Embed Size (px)
Citation preview

PBIS in Urban Alternative
School Settings: Program
Design and Planning
www.pbis.org
Presented by Debborah Smyth, Ph.D., BCBA-D
The May Institute, Inc.
Adam Feinberg, BCBA-D
Mark Williams, ME.D., BCBA
Berkshire Association for Behavior Analysis and Therapy
October 14, 2011
Amherst, MA
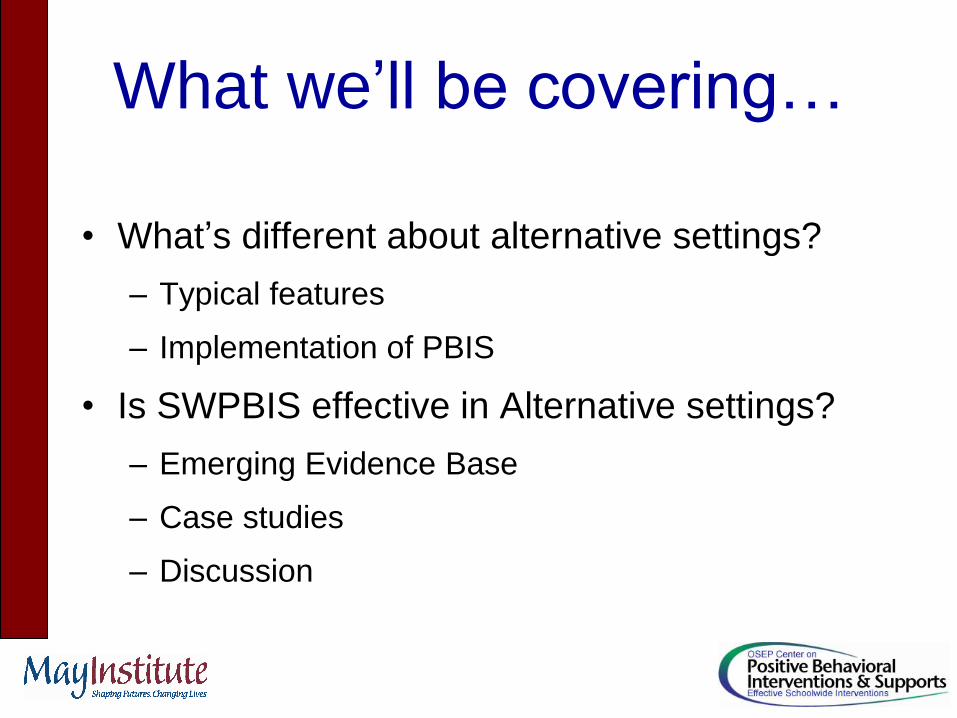
What we’ll be covering…
• What’s different about alternative settings?
– Typical features
– Implementation of PBIS
• Is SWPBIS effective in Alternative settings?
– Emerging Evidence Base
– Case studies
– Discussion
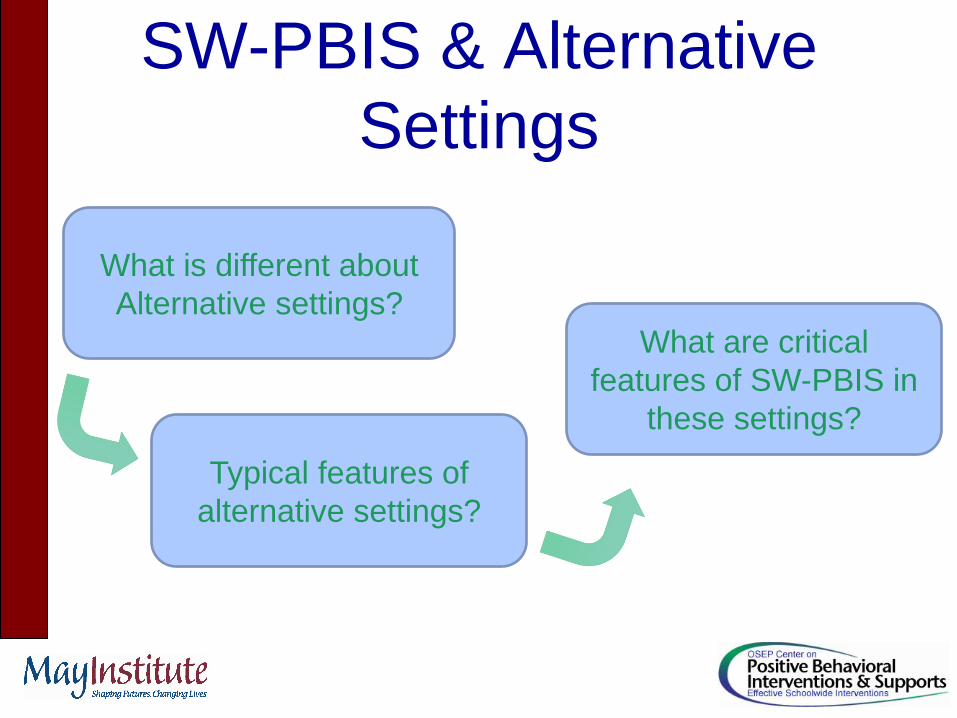
SW-PBIS & Alternative
Settings
What is different about
Alternative settings?
Typical features of
alternative settings?
What are critical
features of SW-PBIS in
these settings?

Primary Prevention:
School-/Classroom-
Wide Systems for
All Students,
Staff, & Settings
Secondary Prevention:
Specialized Group
Systems for Students
with At-Risk Behavior
Tertiary Prevention:
Specialized
Individualized
Systems for Students
with High-Risk Behavior
~80% of Students
~15%
~5%
ALL
SOME
FEW
Small and variable
population with
intensive behavioral,
mental health, and
educational needs
Most
interventions
are
individualized
and intensive.
May also
employ system-
wide features
(i.e., point or
level system)
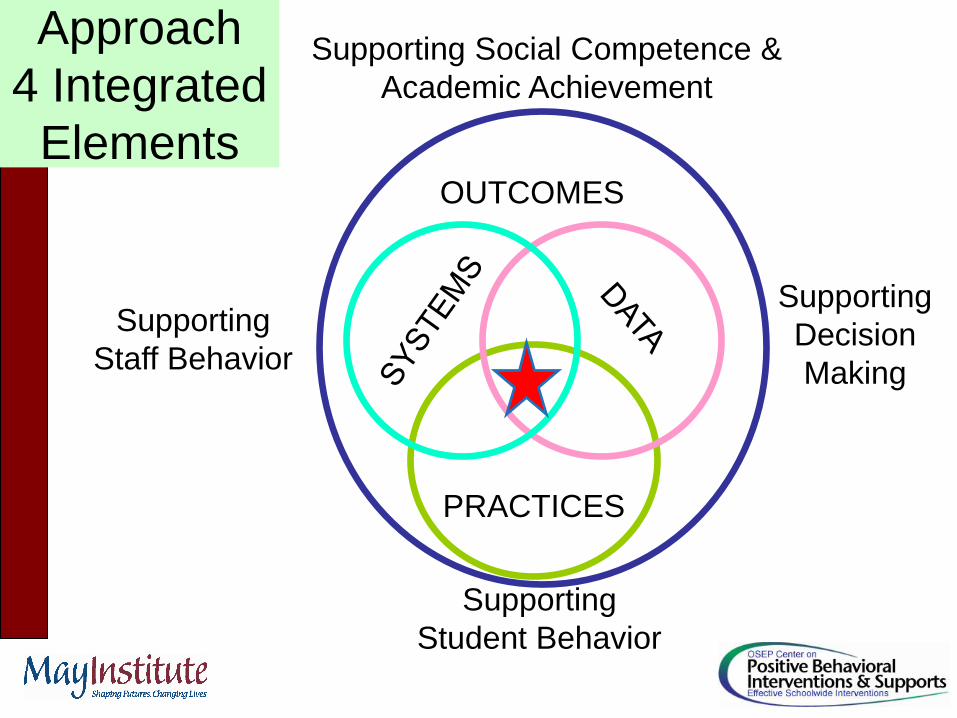
PRACTICES
Supporting
Staff Behavior
Supporting
Student Behavior
OUTCOMES
Supporting Social Competence &
Academic Achievement
Supporting
Decision
Making
Approach
4 Integrated
Elements
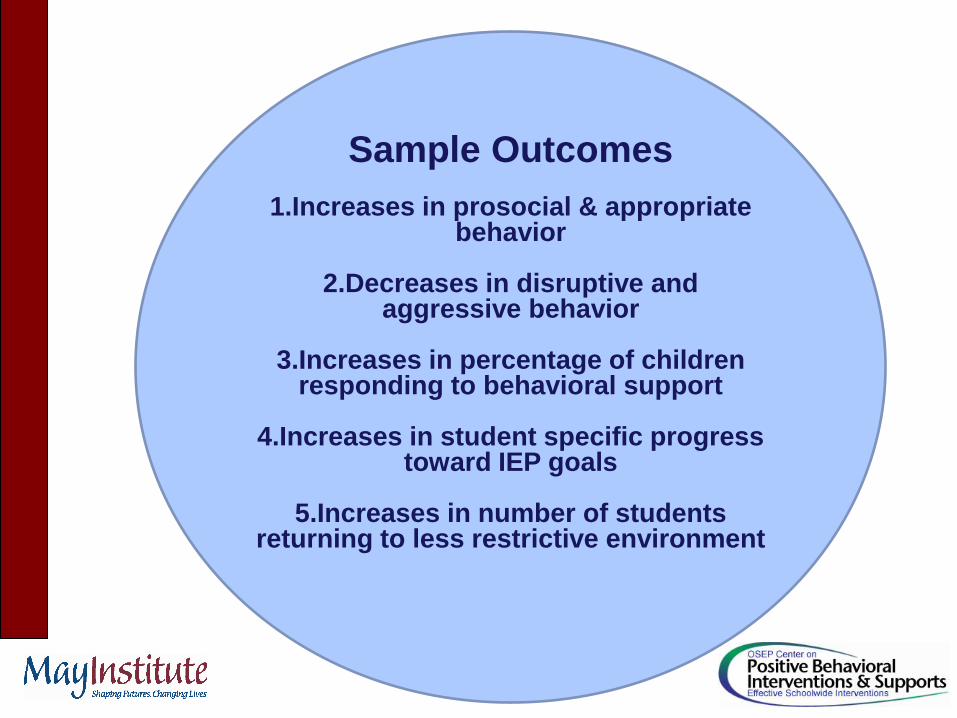
Sample Outcomes
1.Increases in prosocial & appropriate behavior
2.Decreases in disruptive and
aggressive behavior
3.Increases in percentage of children responding to behavioral support
4.Increases in student specific progress
toward IEP goals
5.Increases in number of students returning to less restrictive environment
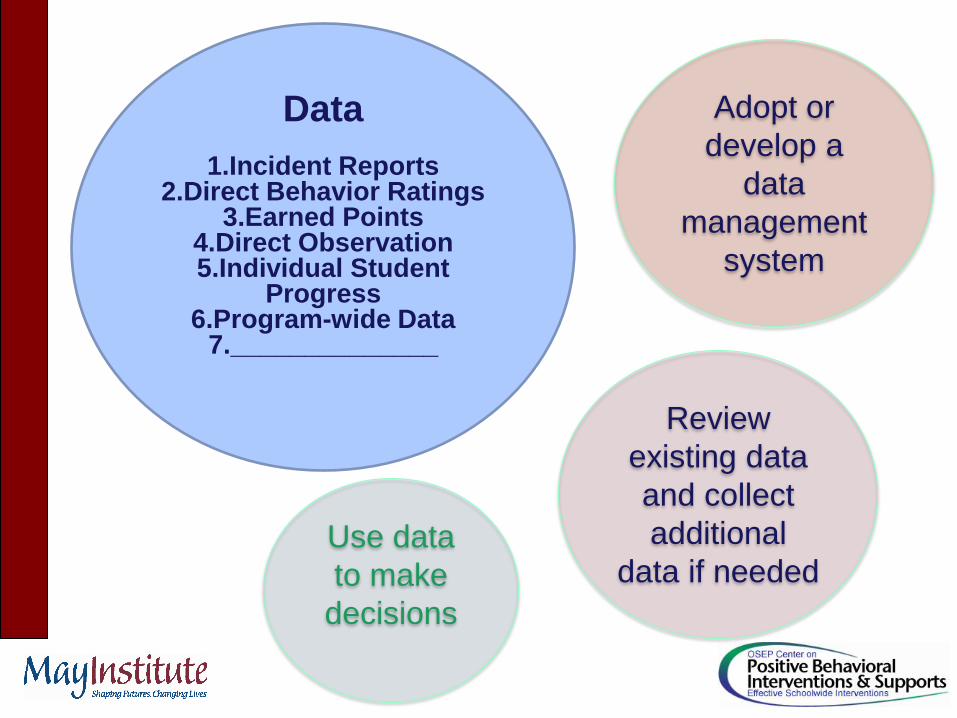
Data
1.Incident Reports 2.Direct Behavior Ratings
3.Earned Points 4.Direct Observation 5.Individual Student
Progress 6.Program-wide Data
7.______________
Adopt or
develop a
data
management
system
Review
existing data
and collect
additional
data if needed
Use data
to make
decisions
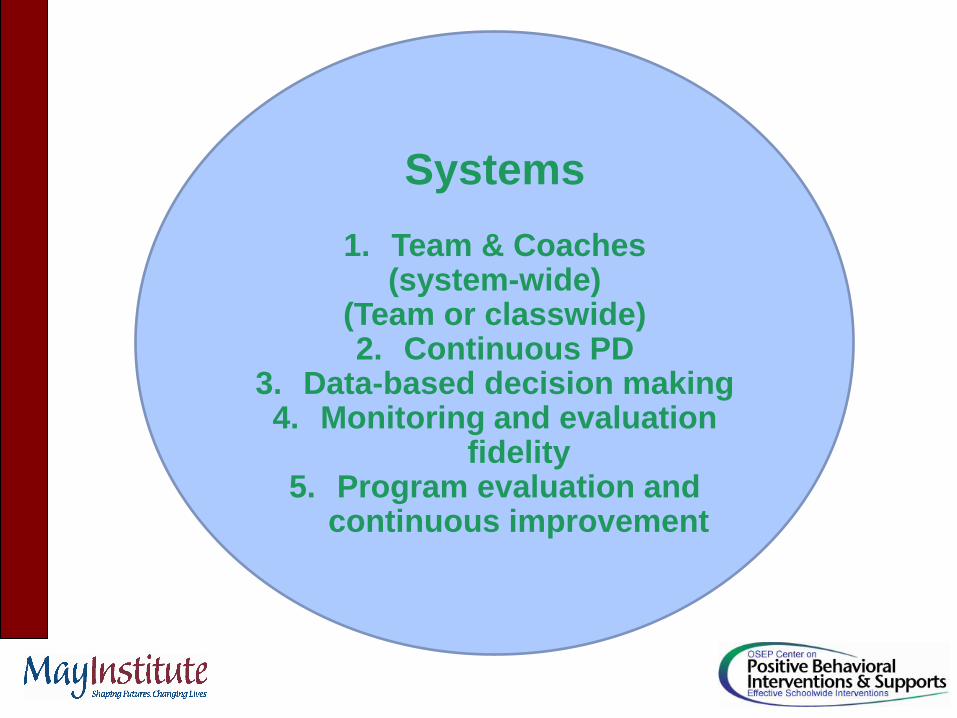
Systems
1. Team & Coaches (system-wide)
(Team or classwide) 2. Continuous PD
3. Data-based decision making 4. Monitoring and evaluation
fidelity 5. Program evaluation and
continuous improvement
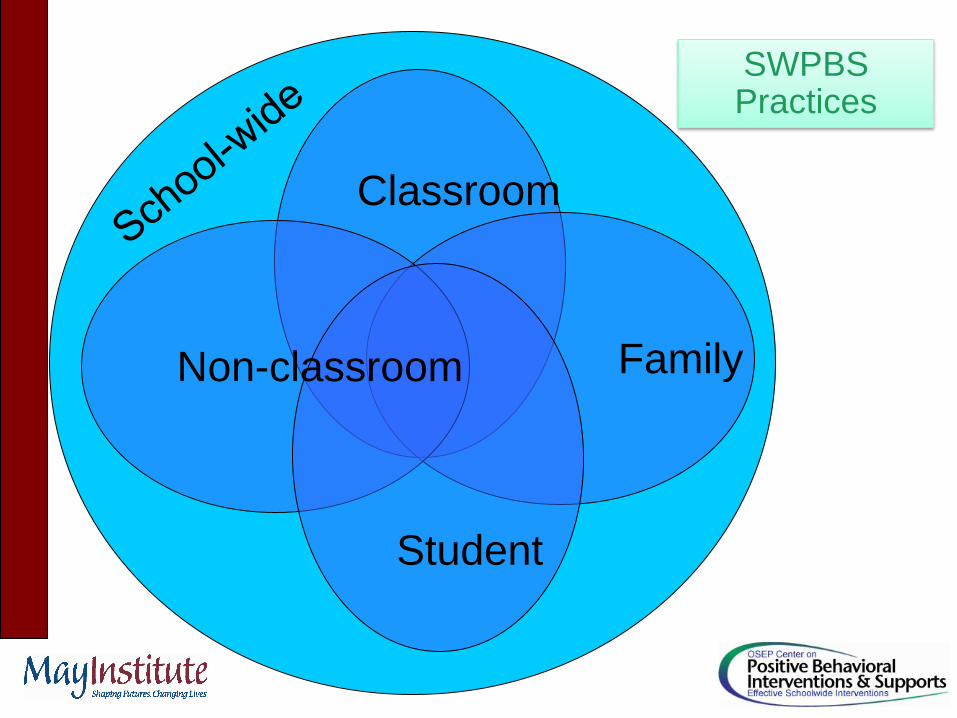
Classroom
SWPBS Practices
Non-classroom Family
Student
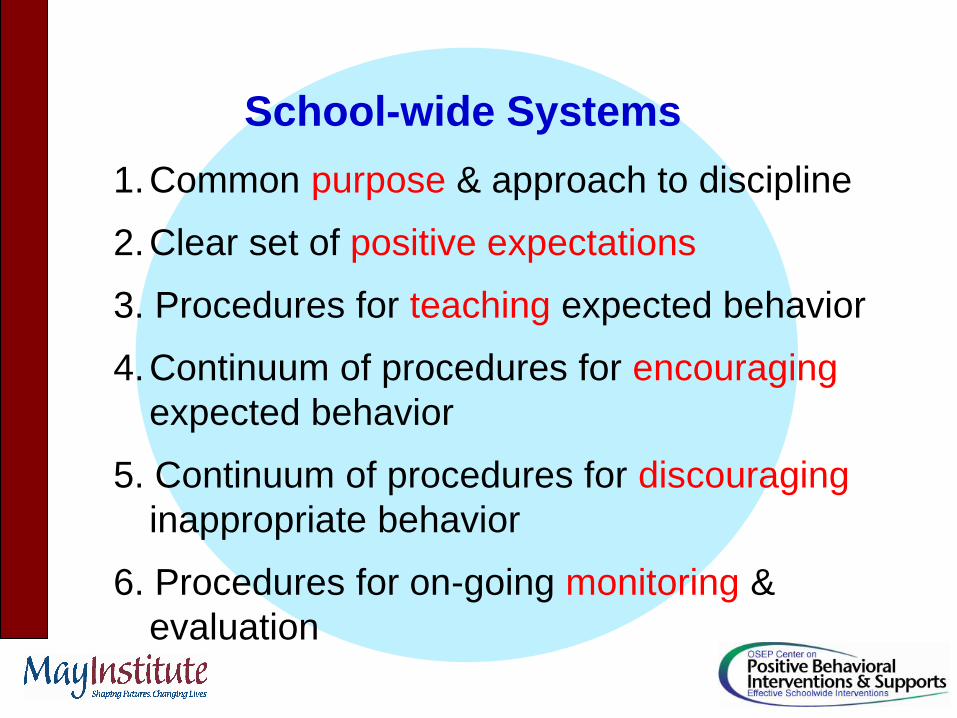
1. Common purpose & approach to discipline
2. Clear set of positive expectations
3. Procedures for teaching expected behavior
4. Continuum of procedures for encouraging
expected behavior
5. Continuum of procedures for discouraging
inappropriate behavior
6. Procedures for on-going monitoring &
evaluation
School-wide Systems

• Maximize structure and predictability
• Establish, post, teach, monitor and reinforce a small number (3-5) of positively stated expectations
• Establish a continuum of strategies to acknowledge students for following expectations
• Active engagement
• Redirections for minor, infrequent behavior errors
• Frequent precorrections for chronic errors
Classroom
Setting Systems
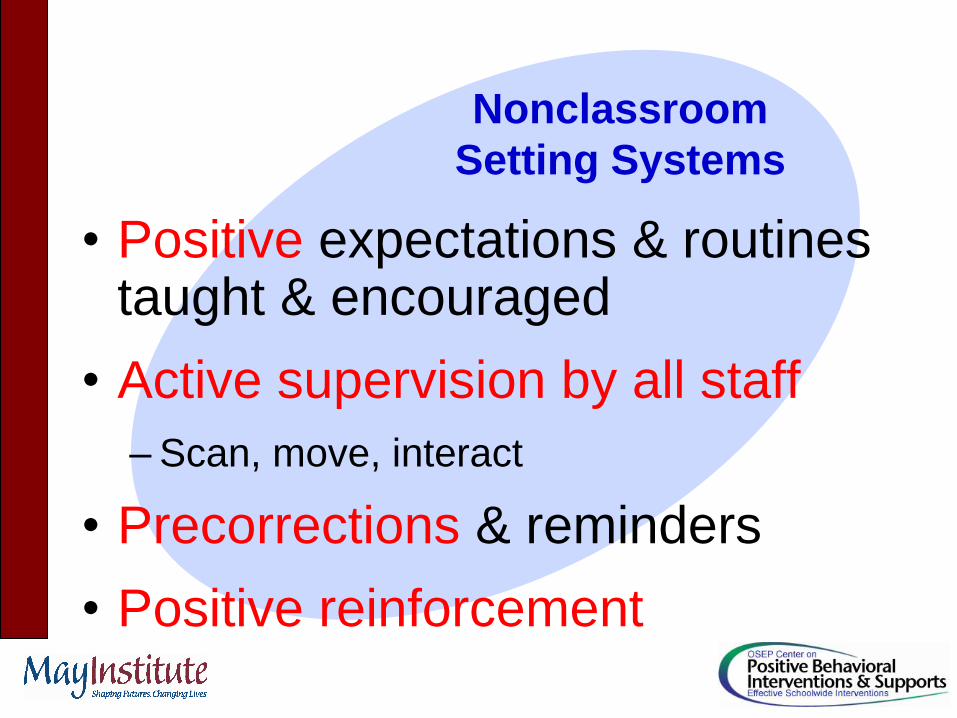
• Positive expectations & routines taught & encouraged
• Active supervision by all staff
– Scan, move, interact
• Precorrections & reminders
• Positive reinforcement
Nonclassroom
Setting Systems

• Develop data decision rules to identify those students who do not respond to Tier I.
• Organize other supports along a continuum.
• Develop an assessment process to determine which additional intervention(s) may be appropriate
• Collect progress monitoring data
Individual Student
Systems
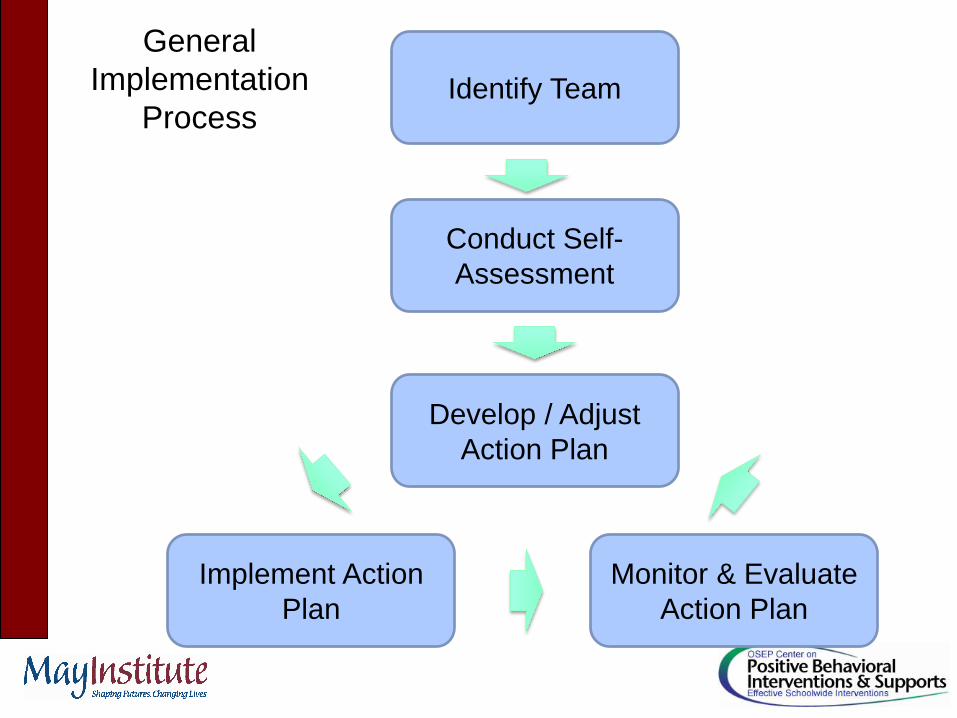
Identify Team
General
Implementation
Process
Conduct Self-
Assessment
Develop / Adjust
Action Plan
Implement Action
Plan
Monitor & Evaluate
Action Plan
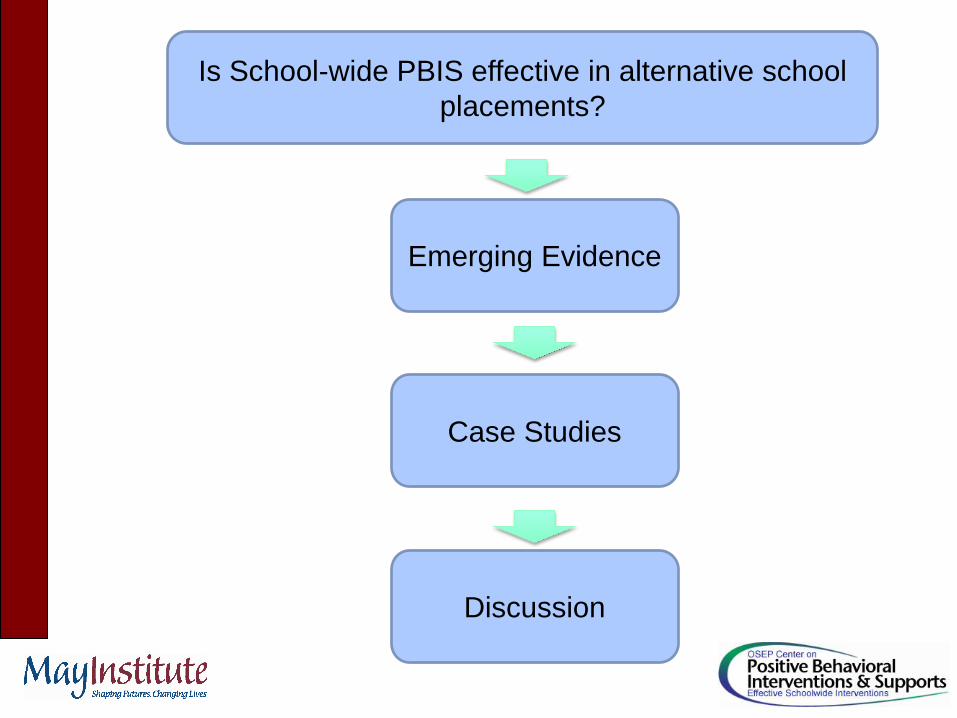
Is School-wide PBIS effective in alternative school
placements?
Emerging Evidence
Case Studies
Discussion
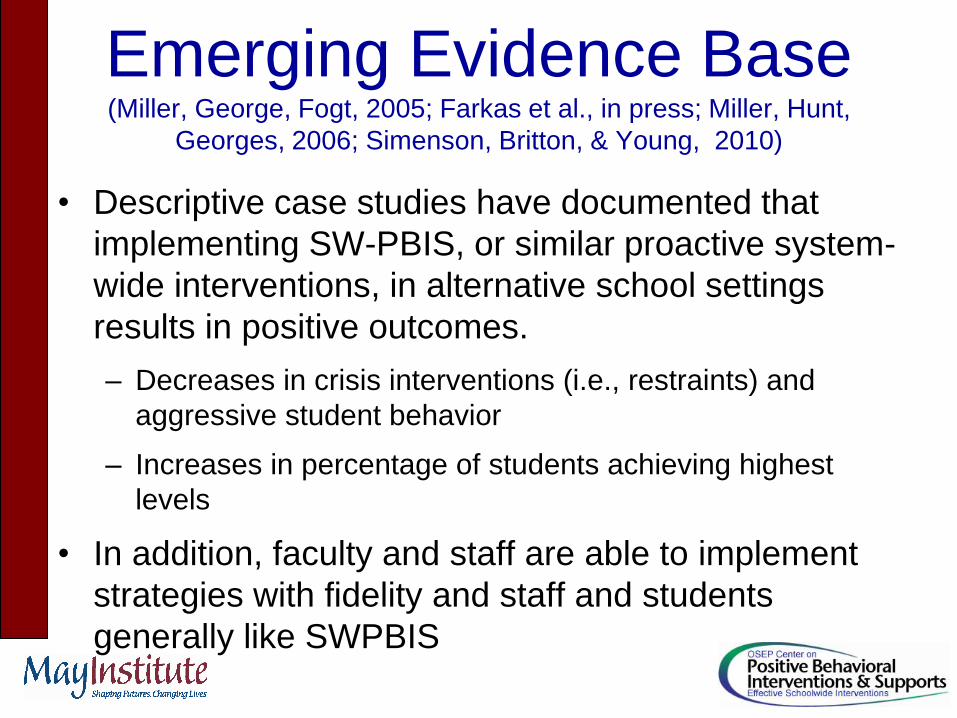
Emerging Evidence Base (Miller, George, Fogt, 2005; Farkas et al., in press; Miller, Hunt,
Georges, 2006; Simenson, Britton, & Young, 2010)
• Descriptive case studies have documented that
implementing SW-PBIS, or similar proactive system-
wide interventions, in alternative school settings
results in positive outcomes.
– Decreases in crisis interventions (i.e., restraints) and
aggressive student behavior
– Increases in percentage of students achieving highest
levels
• In addition, faculty and staff are able to implement
strategies with fidelity and staff and students
generally like SWPBIS

Objectives
• Program Description
• Discuss Impact of PBIS
• Show Outcome Measures
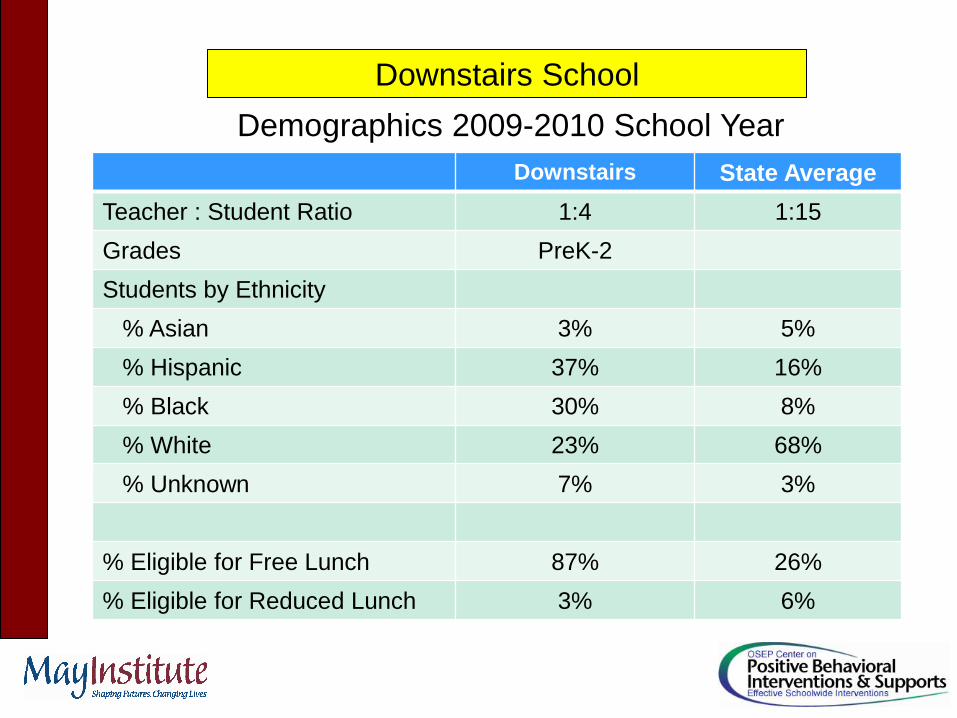
Downstairs State Average
Teacher : Student Ratio 1:4 1:15
Grades PreK-2
Students by Ethnicity
% Asian 3% 5%
% Hispanic 37% 16%
% Black 30% 8%
% White 23% 68%
% Unknown 7% 3%
% Eligible for Free Lunch 87% 26%
% Eligible for Reduced Lunch 3% 6%
Downstairs School
Demographics 2009-2010 School Year
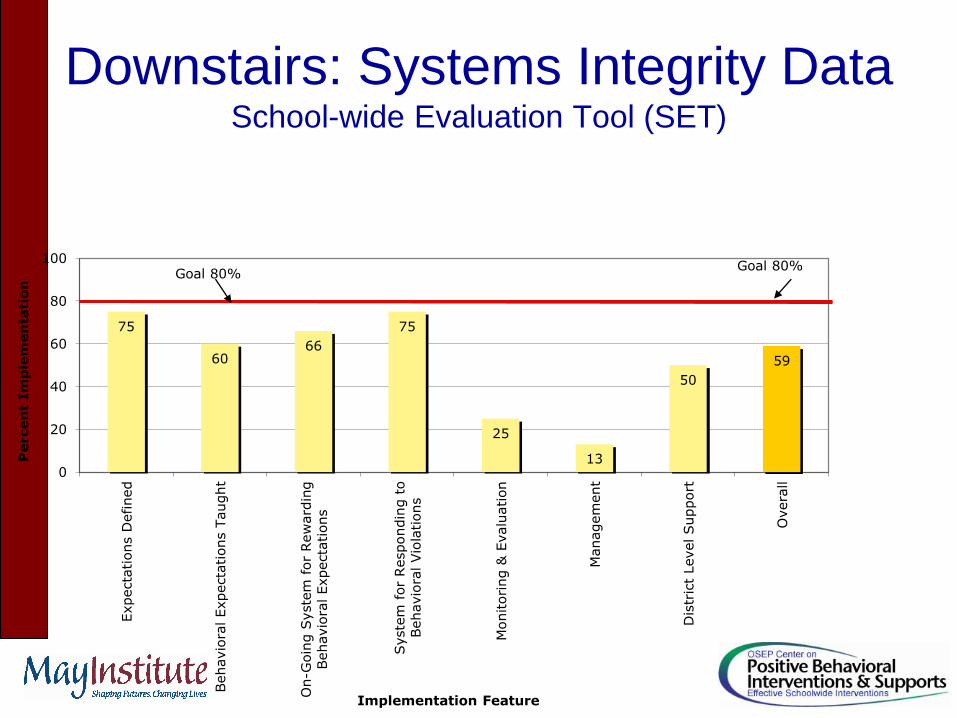
Downstairs: Systems Integrity Data School-wide Evaluation Tool (SET)
75
60 66
75
25
13
50
59
0
20
40
60
80
100
Expecta
tions D
efined
Behavio
ral Expecta
tions T
aught
On-G
oin
g S
yste
m f
or
Rew
ard
ing
Behavio
ral Expecta
tions
Syste
m f
or
Respondin
g t
o
Behavio
ral Vio
lations
Monitoring &
Evalu
ation
Managem
ent
Dis
tric
t Level Support
Overa
ll
Percen
t Im
ple
men
tati
on
Implementation Feature
Goal 80% Goal 80%
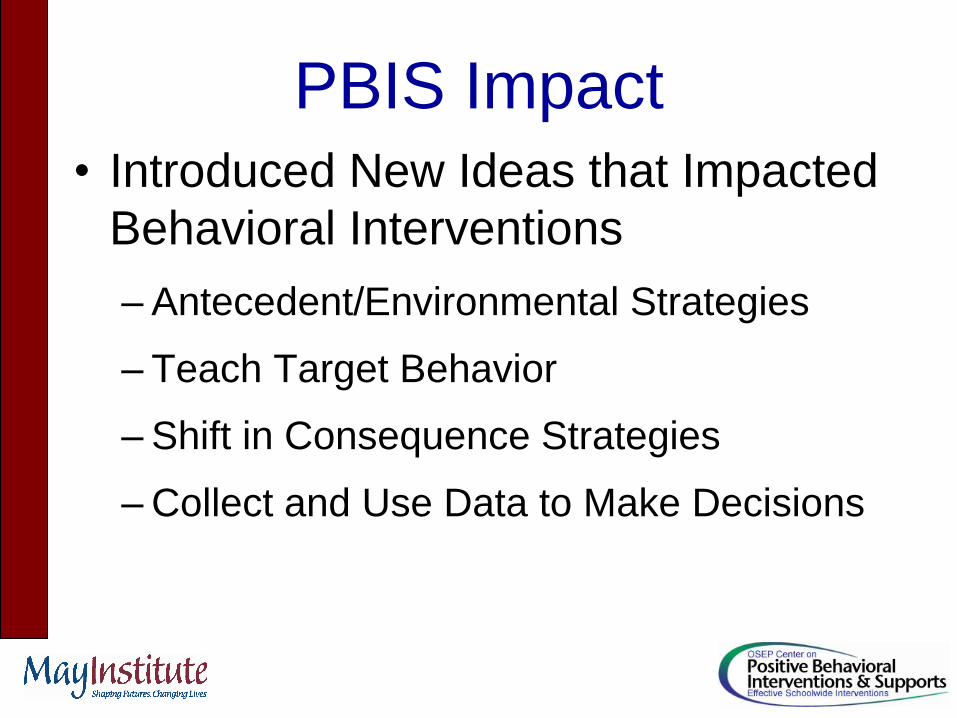
PBIS Impact
• Introduced New Ideas that Impacted
Behavioral Interventions
– Antecedent/Environmental Strategies
– Teach Target Behavior
– Shift in Consequence Strategies
– Collect and Use Data to Make Decisions
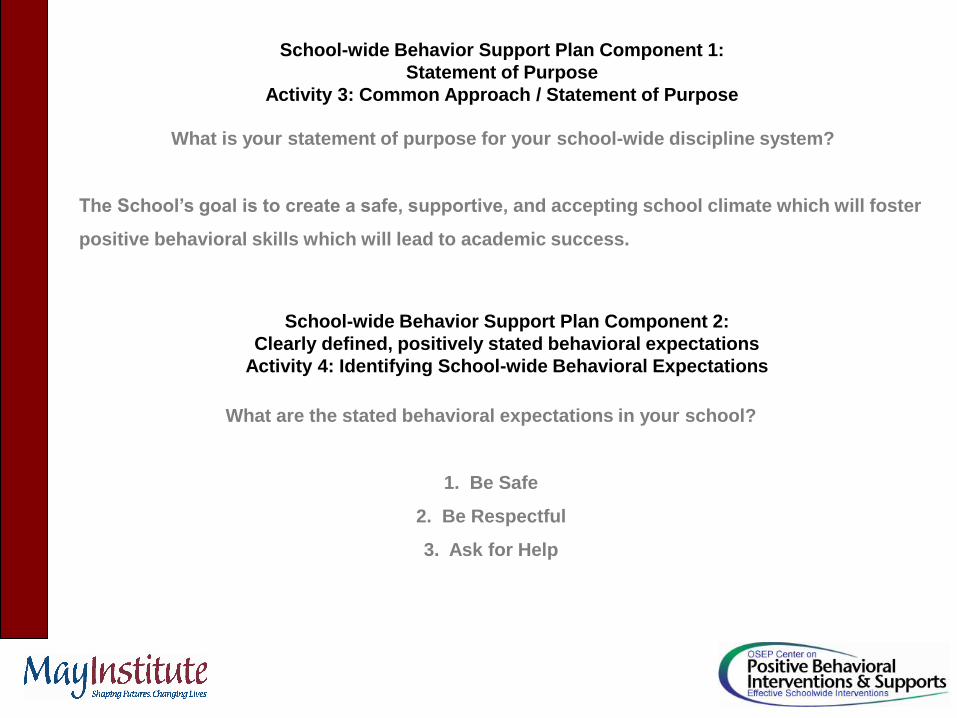
What is your statement of purpose for your school-wide discipline system?
The School’s goal is to create a safe, supportive, and accepting school climate which will foster
positive behavioral skills which will lead to academic success.
School-wide Behavior Support Plan Component 1:
Statement of Purpose
Activity 3: Common Approach / Statement of Purpose
What are the stated behavioral expectations in your school?
1. Be Safe
2. Be Respectful
3. Ask for Help
School-wide Behavior Support Plan Component 2:
Clearly defined, positively stated behavioral expectations
Activity 4: Identifying School-wide Behavioral Expectations
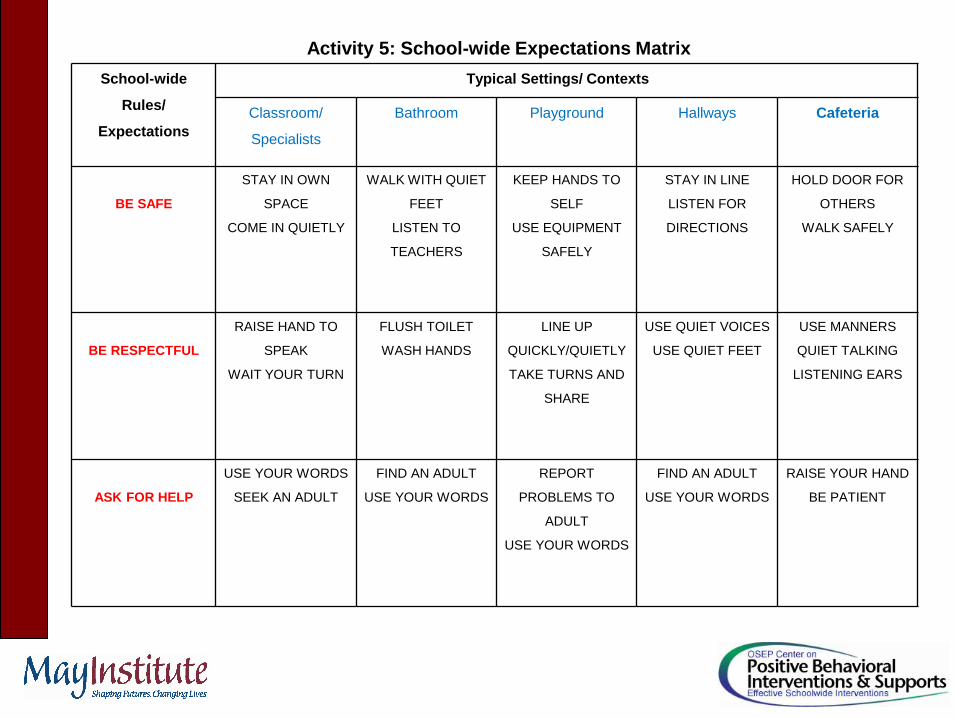
School-wide
Rules/
Expectations
Typical Settings/ Contexts
Classroom/
Specialists
Bathroom Playground Hallways Cafeteria
BE SAFE
STAY IN OWN
SPACE
COME IN QUIETLY
WALK WITH QUIET
FEET
LISTEN TO
TEACHERS
KEEP HANDS TO
SELF
USE EQUIPMENT
SAFELY
STAY IN LINE
LISTEN FOR
DIRECTIONS
HOLD DOOR FOR
OTHERS
WALK SAFELY
BE RESPECTFUL
RAISE HAND TO
SPEAK
WAIT YOUR TURN
FLUSH TOILET
WASH HANDS
LINE UP
QUICKLY/QUIETLY
TAKE TURNS AND
SHARE
USE QUIET VOICES
USE QUIET FEET
USE MANNERS
QUIET TALKING
LISTENING EARS
ASK FOR HELP
USE YOUR WORDS
SEEK AN ADULT
FIND AN ADULT
USE YOUR WORDS
REPORT
PROBLEMS TO
ADULT
USE YOUR WORDS
FIND AN ADULT
USE YOUR WORDS
RAISE YOUR HAND
BE PATIENT
Activity 5: School-wide Expectations Matrix
0
10
20
30
40
50
60
Fre
qu
en
cy
Frequency of Protective Measures Per Month – Lower School
PBIS Consult –
The May Institute
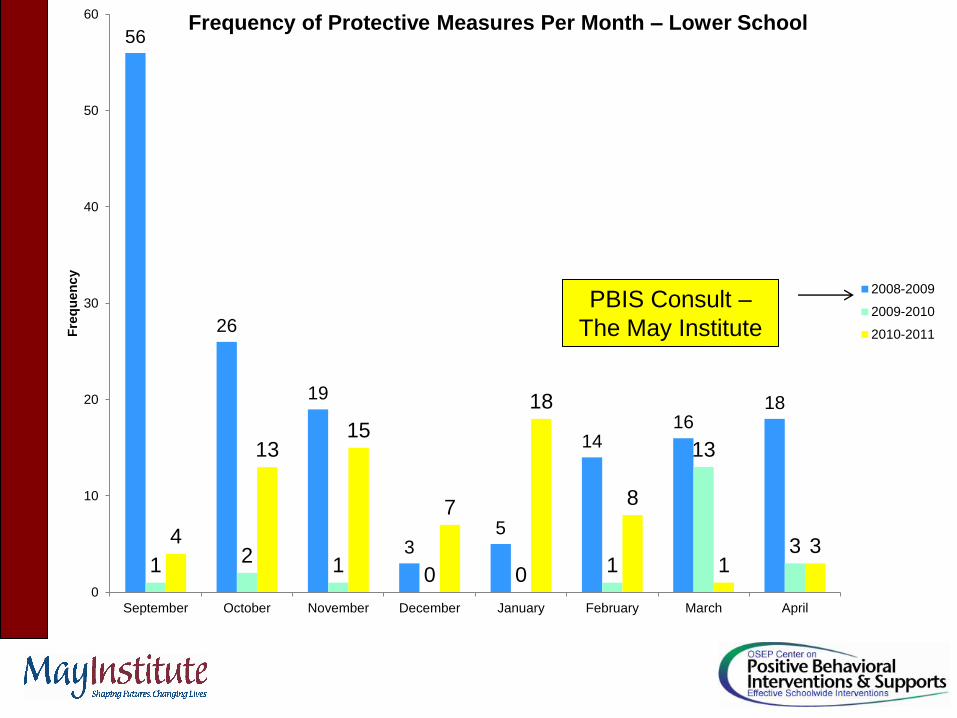
56
26
19
3 5
14 16
18
1 2 1 0 0 1
13
3 4
13 15
7
18
8
1 3
0
10
20
30
40
50
60
September October November December January February March April
Fre
qu
en
cy
Frequency of Protective Measures Per Month – Lower School
2008-2009
2009-2010
2010-2011
PBIS Consult –
The May Institute

Downstairs: Integrity Data School-wide Evaluation Tool (SET)
75
60 66
75
25
13
50
59
100 100
83
100 100
88
50
89
0
20
40
60
80
100
Expecta
tions D
efined
Behavio
ral Expecta
tions T
aught
On-G
oin
g S
yste
m f
or
Rew
ard
ing
Behavio
ral Expecta
tions
Syste
m f
or
Respondin
g t
o
Behavio
ral Vio
lations
Monitoring &
Evalu
ation
Managem
ent
Dis
tric
t Level Support
Overa
ll
Percen
t Im
ple
men
tati
on
Implementation Feature
Spring 2009
Fall 2009
Goal 80% Goal 80%
LYNN
PUBLIC
SCHOOLS
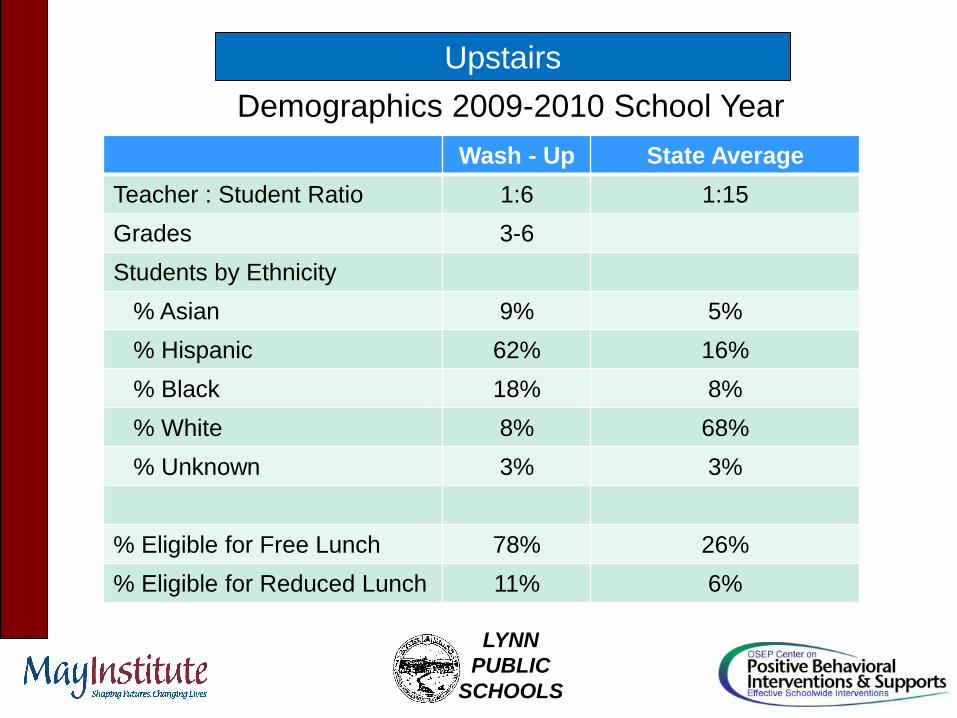
Wash - Up State Average
Teacher : Student Ratio 1:6 1:15
Grades 3-6
Students by Ethnicity
% Asian 9% 5%
% Hispanic 62% 16%
% Black 18% 8%
% White 8% 68%
% Unknown 3% 3%
% Eligible for Free Lunch 78% 26%
% Eligible for Reduced Lunch 11% 6%
Upstairs
Demographics 2009-2010 School Year
LYNN
PUBLIC
SCHOOLS
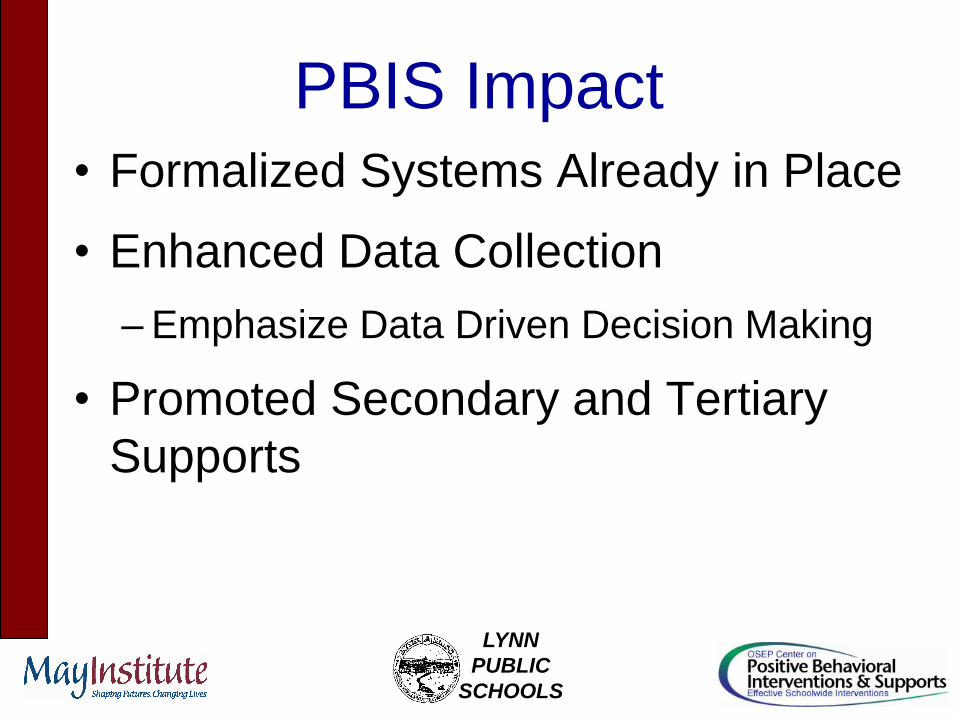
PBIS Impact
• Formalized Systems Already in Place
• Enhanced Data Collection
– Emphasize Data Driven Decision Making
• Promoted Secondary and Tertiary
Supports

Upper Training and Support
• “Buy in” for PBIS was a concern and was perceived to
not be possible by administration or staff.
– Perception was PBIS features were in place
– Review of EBS Survey and current behavioral data
– Team agreed to review PBIS features relative to current system
over a series of team meetings
• School staff had a long learning history of attributing
behavioral challenges as influenced by factors outside
the immediate school environment.

Upstairs: Systems Integrity Data School-wide Evaluation Tool (SET)
Spring 2008
25 20
67
50
38
13
50
38
0
20
40
60
80
100
Expecta
tions D
efined
Behavio
ral Expecta
tions T
aught
On-G
oin
g S
yste
m f
or
Rew
ard
ing
Behavio
ral Expecta
tions
Syste
m f
or
Respondin
g t
o
Behavio
ral Vio
lations
Monitoring &
Evalu
ation
Managem
ent
Dis
tric
t Level Support
Overa
ll
Percen
t Im
ple
men
tati
on
Implementation Feature
Goal 80% Goal 80%

School 1: SW-BSP
Development Review, Discuss, Agreements…
– Clear Expectations: Already in place but modified to increase
clarity for students by linking to reinforcement
– Teaching Expectations: Created formal lesson plans to teach
the school wide expectations
– Reinforcement Procedures: Individualized by classroom.
Modified to a formal school-wide process but added weekly
school-wide activities.
– Consequences: Informal process. Staff was resistant to modify
these procedures.
– Data: Instituted SWIS and bi-monthly meetings regarding Data
review with district BCBA staff.

LYNN
PUBLIC
SCHOOLS
3.33
4.04
10.93
9.59
13.19
10.55
3.18
1.89
0
2
4
6
8
10
12
14
2003-2004 2004-2005 2005-2006 2006-2007 2007-2008 2008-2009 2009-2010 2010-2011
Fre
qu
en
cy
Year
Frequency of Protective Measured Used / Year (per 10 Students)
PBIS Consult from
The May Institute

LYNN
PUBLIC
SCHOOLS
7.38
5.96
11.48
17.96
15.53
35.45
17.05
24.05
0
5
10
15
20
25
30
35
40
2003-2004 2004-2005 2005-2006 2006-2007 2007-2008 2008-2009 2009-2010 2010-2011
Fre
qu
en
cy
Year
Frequency of Suspensions/ Year (per 10 Students)
PBIS Consult
from
The May
Institute

Upstairs stems Integrity Data School-wide Evaluation Tool (SET)
25 20
67
50
38
13
50
38
100
90
100 100 100
87.5
50
90
0
20
40
60
80
100
Expecta
tions D
efined
Behavio
ral Expecta
tions T
aught
On-G
oin
g S
yste
m f
or
Rew
ard
ing
Behavio
ral Expecta
tions
Syste
m f
or
Respondin
g t
o
Behavio
ral Vio
lations
Monitoring &
Evalu
ation
Managem
ent
Dis
tric
t Level Support
Overa
ll
Percen
t Im
ple
men
tati
on
Implementation Feature
Spring 2009
Fall 2009
Goal 80% Goal 80%

Upstairs Integrity Data Team Implementation Checklist (TIC)
100%
67%
75%
67%
100%
75%
25%
68%
100%
83%
50%
92%
50% 50% 50%
63%
100%
83%
50%
92%
50%
75%
50%
67%
0%
10%
20%
30%
40%
50%
60%
70%
80%
90%
100%
Establishcommitment
Establish &maintain team
Conduct self-assessment
Establish school-wide expectations
Establishinformation
system
Build Capacity forFunction-based
Support
District levelSupport
Total
Perc
en
t Im
ple
men
tati
on
Dec-09 Mar-10 Jun-10

PBIS in Alternative Schools Lessons Learned
• Alternative schools with a large number of
behavioral challenges can greatly benefit
from strong effective universal practices
• Take the time to build each component
with consideration
• Use data at every step
• Make sure data guides each decision!


![Module 5: Developing PBIS Behavioral Expectationsdese.ade.arkansas.gov/public/userfiles/RTI/PBIS Tier 1/Facilitators... · [ Developing PBIS Behavioral Expectations ] Trainer Notes:](https://img.dokumen.tips/doc/110x75/5fa707e73c34122bca2d4754/module-5-developing-pbis-behavioral-tier-1facilitators-developing-pbis.jpg)


![Golden Code PBIS Program Golden Ring Middle School Syretta James [PBIS Coach] Gina Peller [PBIS Team Member] Linda Salihi [PBIS Team Leader] Kevin Roberts](https://img.dokumen.tips/doc/110x75/56649f305503460f94c4b850/golden-code-pbis-program-golden-ring-middle-school-syretta-james-pbis-coach.jpg)