Embed Size (px)
Citation preview

Payments Infrastructure and the Performance of PublicPrograms: Evidence from Biometric Smartcards in India∗
Karthik Muralidharan†
UC San DiegoPaul Niehaus‡
UC San DiegoSandip Sukhtankar§
Dartmouth College
March 20, 2014
Abstract
Anti-poverty programs in developing countries are often difficult to implement as intended;one common challenge is governments’ limited capacity to deliver payments securely to targetedbeneficiaries. We evaluate the impact of biometrically-authenticated payments infrastructure onpublic employment and pension programs in the Indian state of Andhra Pradesh, using a large-scale experiment that randomized the rollout of the new system over 158 sub-districts and 19million people. We find that, while far from perfectly implemented, the new system delivered afaster, more predictable, and less corrupt payments process without adversely affecting programaccess. Distributions of key outcomes in treated areas first-order stochastically dominated those incontrol areas, and beneficiaries overwhelmingly favored the new payments system. The investmentwas cost-effective, as time savings to beneficiaries alone were equal to the cost of the intervention(in the case of the employment scheme). Overall the results suggest that investing in secureauthentication and payments infrastructure can significantly add to “state capacity” to effectivelyimplement social programs in developing countries.
JEL codes: D73, H53, O30, O31
Keywords: biometric authentication, secure payments, electronic benefit transfers, public pro-grams, corruption, service delivery, NREGS, India
∗We thank Abhijit Banerjee, Gordon Dahl, Rema Hanna, Gordon Hanson, Anh Tran, and several seminar partic-ipants for comments and suggestions. We are grateful to officials of the Government of Andhra Pradesh, includingReddy Subrahmanyam, Koppula Raju, Shamsher Singh Rawat, Raghunandan Rao, G Vijaya Laxmi, AVV Prasad,Kuberan Selvaraj, Sanju, Kalyan Rao, and Madhavi Rani; as well as Gulzar Natarajan for their continuous support ofthe Andhra Pradesh Smartcard Study. We are also grateful to officials of the Unique Identification Authority of India(UIDAI), including Nandan Nilekani, Ram Sevak Sharma, and R Srikar for their support. We thank Tata ConsultancyServices (TCS) and Ravi Marri, Ramanna, and Shubra Dixit for their help in providing us with administrative data.This paper would not have been possible without the outstanding efforts and inputs of the J-PAL/IPA project team,including Vipin Awatramani, Kshitij Batra, Prathap Kasina, Piali Mukhopadhyay, Raghu Kishore Nekanti, Matt Pe-cenco, Surili Sheth, and Pratibha Shrestha. We are deeply grateful to the Omidyar Network – especially Jayant Sinha,CV Madhukar, Surya Mantha, Ashu Sikri, and Dhawal Kothari – for the financial support and long-term commitmentthat made this study possible. We also thank IPA, Yale University, and the Bill and Melinda Gates Foundation foradditional financial support through the Global Financial Inclusion Initiative.†UC San Diego, JPAL, NBER, and BREAD. [email protected].‡UC San Diego, JPAL, NBER, and BREAD. [email protected].§Dartmouth College, JPAL, and BREAD. [email protected].
1

1 Introduction
Sending and receiving money securely across space is fundamental to the scale and scope of
an economy. Developed countries today are unusual in that their banking infrastructure
and legal environments allow for relatively seamless remote transactions: mail order,
online shopping, money wires, Electronic Benefit Transfers, and so on. In most times and
places, however, payments infrastructure was – and remains – less advanced. Payments
often move through informal networks (for example, the Maghribi traders studied by
Greif (1993) or the present-day “hawala” system in South Asia and the Middle East) or
not at all. In the public sector, weak payments infrastructure makes it difficult to deliver
fast and reliable payments to transfer recipients, and facilitates graft.1 Thus, the lack of a
secure payments infrastructure constrains both public and private economic transactions.
Investing in payments infrastructure can therefore be seen as investing in “state ca-
pacity” that improves the state’s ability to implement its welfare policies and expands
its long-term policy choice set (Besley and Persson, 2009, 2010). More broadly, it can be
seen as public infrastructure – akin to roads, railways, or the internet, which may have
initially been set up by governments for their own use (such as moving soldiers to the
border quickly, or improving intra-government communication), but eventually generated
substantial spillovers to the private sector as well.
Given this logic, recent advances in payments technology have generated considerable
interest regarding their potential to improve the performance of public welfare programs,
as well as to provide financial inclusion for the poor.2 This is nowhere more true than in
India. In 2009, the Indian government embarked on an ambitious two-step agenda: deliver
unique, biometric-linked IDs to all 1.2 billion residents via the Aadhaar (“foundation”)
initiative, and then introduce Direct Benefit Transfers for social program beneficiaries
using Aadhaar-linked bank accounts.3 The Unique ID Authority of India has argued that
Aadhaar will empower poor and underprivileged residents in accessing services such as the
formal banking system and give them the opportunity to easily avail various other services
provided by the Government and the private sector. Finance Minister P. Chidambaram
has simply said that the project would be “a game changer for governance.”4
At the same time, there are at least five reasons to be skeptical about the impacts of
1For instance, Reinikka and Svensson (2004) and Niehaus and Sukhtankar (2013a,b) document cases ofcorruption where junior government officials simply steal funds meant for the poor rather than deliveringthem to the intended recipients.
2The Better than Cash Alliance advocates for the adoption of electronic payments on the grounds thatthey “advance financial inclusion and cost savings while giving governments a more efficient, transparentand secure means of disbursing benefits.” See http://betterthancash.org/, accessed 29 January 2014.
3Malaysia, South Africa, and Indonesia have similar pilot programs under way.4http://uidai.gov.in/index.php?option=comcontent&view=article&id=58&Itemid=
106, accessed September 10, 2013; http://www.nytimes.com/2013/01/06/world/asia/
india-takes-aim-at-poverty-with-cash-transfer-program.html, accessed 3 October 2013.
2

new payments technology and whether they warrant the cost entailed. First, implemen-
tation involves a complex mix of technical and logistical challenges, raising the concern
that the undertaking might fail unless all components are well-implemented (Kremer,
1993). Second, vested interests might subvert the intervention if their rents are threat-
ened (Prescott and Parente, 2000). Third, the new system could generate exclusion errors
if genuine beneficiaries are denied payments due to technical problems. This would be par-
ticularly troubling if it disproportionately hurt the most vulnerable beneficiaries (Khera,
2011). Fourth, reducing rent-extraction could paradoxically hurt the poor if it dampened
incentives for officials to implement anti-poverty programs in the first place (Leff, 1964).
Finally, even assuming positive impacts, the best available estimates of cost-effectiveness
depend on a number of untested assumptions (see e.g. NIPFP (2012)).
We contribute evidence to this debate by measuring the impacts, both positive and
negative, of a large-scale rollout of biometric payments infrastructure integrated into
social programs in India. Working with the Government of the Indian state of Andhra
Pradesh (AP), we randomized the order in which 158 sub-districts introduced biometrically-
authenticated electronic benefit transfers into two large social programs: the Mahatma
Gandhi National Rural Employment Guarantee Scheme (NREGS) and Social Security
Pensions (SSP). The intervention involved both technical as well as organizational changes
to the payments process, and was referred to in short as the AP “Smartcards” project.
Importantly, Smartcards provided beneficiaries with the same effective functionality as
intended by Aadhaar-enabled Direct Benefit Transfers for these two programs. The ex-
periment thus provides an opportunity to learn about the likely impacts of Aadhaar
specifically, as well as modernized payments infrastructure more generally.
The experiment randomized the form of payments over a universe of about 19 mil-
lion people, with randomization conducted over entire sub-districts, making it one of
the largest randomized controlled trials ever conducted. Further, evaluating an “as is”
implementation of a complex program by a government addresses one common concern
about randomized trials in developing countries: that studying NGO-led pilots may not
provide accurate forecasts of performance at scales relevant for policy-making (see for
example Bold et al. (2013)). Our estimates yield the policy parameter that is of practical
relevance, because it reflects the impacts that followed a decision by senior government
officials to invest in the new payments system and is net of all the logistical and political
economy challenges that accompany such a project in practice.
After two years of program rollout, the share of Smartcard-enabled payments in
treated sub-districts had reached 50%.5 Major impediments to implementation included
included logistical challenges in enrolling beneficiaries and distributing cards, procuring
5This figure compares favorably to the pace of electronic benefit transfer (EBT) rollout in other contexts.The United States, for example, took over 15 years to convert all Social Security payments to EBT.
3

and deploying authentication devices and ensuring their functionality, appointing new
payment agents, and cash management and security; administrative challenges such as
designing optimal contracts with implementing banks and the difficulties in re-optimizing
them under a public procurement regime; and political challenges such as attempts by
local political elites to capture the new process by influencing field staff hiring (see
Mukhopadhyay et al. (2013) for details). Such frictions illustrate the importance of eval-
uating at scale under real-world conditions. They also motivate our emphasis throughout
the paper on intent-to-treat analysis, which correctly estimates the average return to as-is
implementation following the “intent” to implement the new system.
We find that, even while incompletely implemented, Smartcards substantially im-
proved the payment collection process, significantly so for NREGS recipients. NREGS
workers workers spent 21 minutes less on collecting each payment (19% less than the
control group) and payment delays between working and receiving wages fell by 10 days
(29% of the control mean). The absolute deviation of payment delays also fell by 39%
relative to control, suggesting that payments became more predictable.6
Beneficiaries also received significantly more money. The average NREGS house-
hold reported earning 23% more through the program, while individual labor supply on
NREGS went up 12% (notsignificant). Government outlays on NREGS, on the other
hand, did not change, resulting in a 12.2 percentage point reduction in “leakage” of funds
(a 40% reduction relative to the control mean of 30.7%). SSP participants, meanwhile,
saw a 1.8 percentage point reduction in the incidence of bribe demands for obtaining
their payments (a 47% reduction relative to the control mean 3.8%) and the incidence of
“ghost” SSP pensioners fell by 1.1 percentage points (not significant, control mean 7.3%).
Notably, these gains for participants were not offset by reduced access to programs in
the first place. While many NREGS workers in the control group report difficulty getting
work, these numbers look marginally if insignificantly better in treated areas. Overall, the
data suggest that Smartcards improved beneficiary experiences in collecting payments,
and also reduced corruption and increased payments received by program participants,
without substantially altering fiscal burdens on the state. Consistent with this view,
84% of NREGS job card holders and 91% of SSP recipients who experienced the system
reported that they prefer the new system to the old.
We find no evidence that poor or vulnerable segments of the population were worse
off under the new system. For key outcomes such as the time to collect payments,
payment delays, and NREGS payments received, the treatment distributions first-order
stochastically dominate the control distributions. Thus, no treatment household was
worse off relative to a control household at the same percentile of the outcome distribution.
6Payment collection times for SSP beneficiaries also improved, although improvements were small andstatistically insignificant, reflecting the fact that status quo collection times and reliability for this programprior to the intervention was much better than NREGS.
4

Treatment effects also did not vary significantly as a function of village-level baseline
characteristics, suggesting broad-based gains from access to the new payments system.
Finally, the Smartcard system was also cost-effective. Several of the impacts represent
pure efficiency gains – in particular, saved beneficiary time and reduced variability in
payment delays – and the value of these alone appears to exceed the government’s cost
of program implementation and operation, at least for the NREGS ($4.44 million in time
savings compared to $4.25 million costs of implementation). Other impacts are inherently
redistributive, and hence not Pareto improvements: for example, reduced mean payment
lags benefit recipients at the cost of banks, and reduced leakage benefits recipients at the
expense of corrupt officials. However, if a social planner places a greater weight on the
gains to beneficiaries (who are likely to be poorer) than on the loss to corrupt officials,
then the welfare gains from reduced leakage will be positive. The reduction in leakage
is also much larger than the cost of implementation; for example, the NREGS leakage
reduction of $38.7 million/year is nine times the cost of implementation.
Our paper fits most directly within the recent literature on technology and service
delivery in developing countries. An emerging theme in this literature is that technology
may or may not live up to its hype. Duflo et al. (2012) find, for example, that digital
cameras and monetary incentives increased teacher attendance and test scores in Indian
schools (when implemented in schools run by an NGO). Banerjee et al. (2008) find, on
the other hand, that a similar initiative to monitor nurses in health care facilities was
subverted by vested interests (when implemented by the government in the public system).
Such contrasting results highlight the importance of as-is evaluation in scaled-up settings.
Our results also add to a growing literature on the impact of payments and authenti-
cation infrastructure in developing countries. Jack and Suri (2014) find that the MPESA
mobile money transfer system in Kenya improved risk-sharing; Aker et al. (2012) find that
using mobile money to deliver transfers in Niger cut costs and increased women’s intra-
household bargaining power; and Gine et al. (2012) show how biometric authentication
helped a bank in Malawi reduce default and adverse selection.
Finally, our results complement recent theoretical work on state capacity (Besley
and Persson, 2009, 2010) by demonstrating that the returns to investing in payments
infrastructure can be large and positive even over as short a time horizon as two years,
and even when integrated into only two public welfare programs. Our analysis in this
paper does not quantify potential future benefits to other public programs, or to private
sector actors as they make use of the new infrastructure, e.g. to offer financial services.
The “public infrastructure” role of payments systems thus remains open for study, as we
discuss in the conclusion.
The rest of the paper is organized as follows. Section 2 describes the context, social
programs, and the Smartcard intervention. Section 3 lays out the research design, and
5

Section 4 presents results. Section 5 discusses cost-effectiveness and welfare impacts;
Section 6 concludes.
2 Context and Intervention
India runs several programs to reduce poverty, but they are typically poorly implemented
(Pritchett, 2010). Most programs suffer from high levels of “leakage,” defined as the
fraction of money spent that does not reach the intended beneficiary. For example, the
two flagship welfare schemes – the Mahatma Gandhi National Rural Employment Guar-
antee Scheme (NREGS) and the Targeted Public Distribution System (TPDS) – have
been estimated to have leakage rates of 40% to 80% (Niehaus and Sukhtankar, 2013a,b;
Programme Evaluation Organization, 2005). Benefits that do reach the poor are often
delivered with long and variable lags, and typically require beneficiaries to make multiple
trips (including unsuccessful ones) over considerable distances to collect their payments.
The Andhra Pradesh (AP) Smartcard Program aimed to reduce leakage and improve
beneficiary experiences in collecting payments by building a biometrically-authenticated
payments infrastructure and integrating this into two major social welfare programs of
the Department of Rural Development (NREGS and SSP). The AP Smartcard Program
was India’s first scaled up attempt to use a biometric payments infrastructure to deliver
payments to program beneficiaries.7 Key features of the two affected programs are de-
scribed below, along with a discussion of the differences between the new and original
payment systems.
2.1 The Mahatma Gandhi National Rural Employment Guar-
antee Scheme (NREGS)
The NREGS is one of the two main welfare schemes in India, and likely the largest
workfare program in the world, covering 11% of the world’s population. The Government
of India’s allocation to the program for fiscal year April 2013-March 2014 was Rs. 330
billion (US $5.5 billion), or 7.9 percent of its budget.8 The program guarantees every rural
7A key motivation for India’s decision to invest in biometrically-authenticated payments infrastructureusing the Aadhaar platform was a desire to reduce leakage in public welfare programs and to improvebeneficiary experiences in accessing their benefits. However, while the Aadhaar is an enabling infrastructurethat can be used to better implement any program, evaluating its impact would require Aadhaar to beintegrated with welfare programs, which has not yet taken place (since Aadhaar is still being rolled out).The AP Smartcard program therefore provides a functional precursor to the integration of Aadhaar in theNREGS and SSP programs. Evaluating its impact can help inform broader national policy decisions on thecosts and benefits of integrating Aadhaar into other programs and beyond AP.
8NREGS figures: http://indiabudget.nic.in/ub2013-14/bag/bag5.pdf; total outlays: http://
indiabudget.nic.in/ub2013-14/bag/bag4.pdf
6

household 100 days of paid employment each year. There are no eligibility requirements,
as the manual nature of the work is expected to induce self-targeting.
To participate in the NREGS, workers must first obtain jobcards, which list house-
hold members and have empty spaces for keeping records of employment. Jobcards can
be obtained from the local Gram Panchayat (GP, or village) or mandal (sub-district)
government offices. Workers with jobcards can apply for work at will, and officials are
legally obligated to provide either work or unemployment benefits (though in practice,
the latter are never issued). The range of projects approved under NREGS is stipulated
by the government and typically consists of minor irrigation projects or improvement of
marginal lands. Implementation takes place under the supervision of officials called Field
Assistants. These officials record attendance and output on muster rolls and send these
to the sub-district for digitization, which triggers the release of funds to pay workers.
Figure 1 depicts the payment process in Andhra Pradesh before the introduction of
Smartcards. In this original system (which is typical for NREGS payments across India),
state governments transfer money to beneficiary post office savings accounts. Workers
operate the accounts with physical passbooks to establish identity and withdraw cash.
In practice, it is quite common for illiterate workers to hand over their passbooks to the
Field Assistant, who controls and operates the accounts for multiple workers by taking
sets of passbooks to the post office, withdrawing cash in bulk for workers, and paying
cash in the villages. In cases where workers keep their passbooks and operate their own
accounts, they have to travel individually to the post office to collect payments and often
must make multiple trips due to unsuccessful attempts to withdraw cash.
Field reports, as well as data from our control group below, suggest that this payment
process can be slow, unreliable, and prone to considerable leakage. As described in
Niehaus and Sukhtankar (2013a,b), theft from the labor budget can take two forms: over-
reporting or under-payment. For example, a worker might do Rs. 100 worth of work,
but an official might report to the government that she is owed Rs. 150 and pocket Rs.
50 for himself; this is over-reporting. In addition, the official could pay the worker only
Rs. 90; in this case he earns Rs. 10 from under-payment. “Ghost” or non-existent/fake
workers are one extreme form of over-reporting. In particular, the control exercised by
local officials on both the upward flow of information regarding work done, as well as the
downward flow of cash (as seen in Figure 1), makes it feasible for them to over-report work
done, and collude with post office officials to divert the payments. Local officials can also
abuse their position of power by not paying workers the full amounts owed to them. Prior
research (Niehaus and Sukhtankar, 2013a,b) suggests that over-reporting is much more
common than under-payment, perhaps because the former is less politically costly. The
status quo system also features considerable delays and uncertainty in payments, which
in turn can limit the extent to which the NREGS serves as an insurance mechanism for
7

the rural poor.9 In extreme cases, delayed payments have even been reported to have led
to worker suicides.10
2.2 Social Security Pensions (SSP)
Social Security Pensions (SSP) are monthly payments targeted to vulnerable populations.
The program covers over 6 million beneficiaries and costs the state roughly Rs. 18 billion
($360 million) annually. Eligibility is restricted to members of families classified as Below
the Poverty Line (BPL), who are local residents of the district in which they receive their
pension and not covered by any other pension scheme. In addition, recipients must qualify
in one of four categories: old age (> 65), widow, disabled, or certain displaced traditional
occupations. Pension lists are proposed by local village assemblies (Gram Sabhas) and
sanctioned by the mandal administration. Pension amounts are very modest and typically
pay Rs. 200 (˜$3) each month, except for the disability pension that pays Rs. 500 (˜$8)
per month.
Unlike the NREGS, pension payments are typically made in the village itself, with
cash being disbursed by a designated government official (village development officer)
each month. While rigorous evidence on leakage and payment delays in the SSP pro-
grams was not available at the start of our study, journalist accounts suggested that the
most common forms of irregularities were “ghost” beneficiaries (especially non-removal
of deceased beneficiaries from the roster), requirements to pay bribes to get put on the
beneficiary roster, and demands for “commissions” to disburse payments.11 Between the
two programs, the government aims to provide social insurance to the able-bodied who
can work (NREGS) as well as those unable to work (SSP), with benefits under the former
being more generous.
9The imperfect implementation of government social insurance programs may even be a deliberate choiceby local elites to preserve their power over the rural poor by being the default provider of insurance (seeAnderson et al. (2013) for a detailed discussion of such deliberate non-implementation; Jayachandran (2006)shows that rainfall shocks benefit landlords and hurt workers due to the fall in wages induced by increasedlabor supply by poor workers attempting to meet subsistence needs; hence improved insurance for laborersmay make landlords worse off).
10See, for example, http://www.hindustantimes.com/india-news/delayed-nrega-payments-drive-workers-to-suicide/article1-1167345.aspx).
11A large number of newspaper articles, from states all over India, record the presence of fakeand ineligible pension beneficiaries. See, for example, http://indianexpress.com/article/
india/india-others-do-not-use/70-000-and-still-counting-fake-old-age-pensioners/,http://articles.timesofindia.indiatimes.com/2013-10-12/chandigarh/42967727_1_
old-age-pension-pension-amount-fake-beneficiaries, and http://archives.digitaltoday.
in/indiatoday/20050620/web2.html. Note that unlike in the NREGS, over-reporting of the amount tobe paid is more difficult in the SSP program since the amounts to be paid are fixed administratively.
8
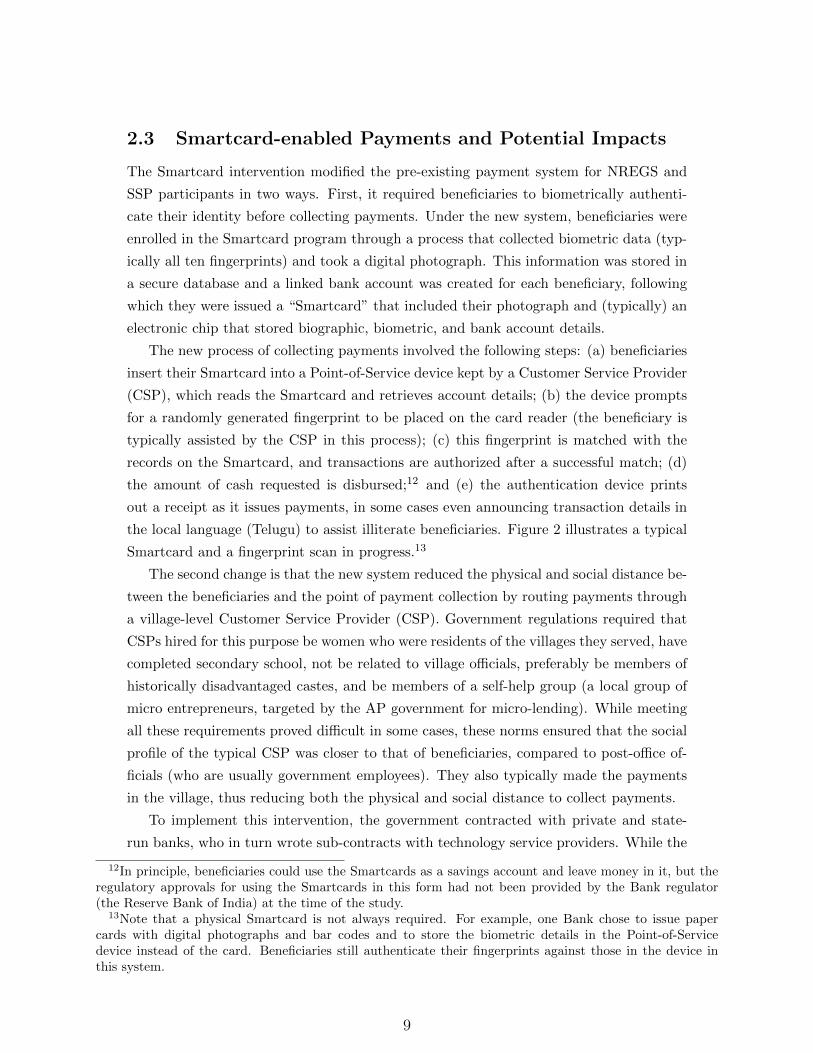
2.3 Smartcard-enabled Payments and Potential Impacts
The Smartcard intervention modified the pre-existing payment system for NREGS and
SSP participants in two ways. First, it required beneficiaries to biometrically authenti-
cate their identity before collecting payments. Under the new system, beneficiaries were
enrolled in the Smartcard program through a process that collected biometric data (typ-
ically all ten fingerprints) and took a digital photograph. This information was stored in
a secure database and a linked bank account was created for each beneficiary, following
which they were issued a “Smartcard” that included their photograph and (typically) an
electronic chip that stored biographic, biometric, and bank account details.
The new process of collecting payments involved the following steps: (a) beneficiaries
insert their Smartcard into a Point-of-Service device kept by a Customer Service Provider
(CSP), which reads the Smartcard and retrieves account details; (b) the device prompts
for a randomly generated fingerprint to be placed on the card reader (the beneficiary is
typically assisted by the CSP in this process); (c) this fingerprint is matched with the
records on the Smartcard, and transactions are authorized after a successful match; (d)
the amount of cash requested is disbursed;12 and (e) the authentication device prints
out a receipt as it issues payments, in some cases even announcing transaction details in
the local language (Telugu) to assist illiterate beneficiaries. Figure 2 illustrates a typical
Smartcard and a fingerprint scan in progress.13
The second change is that the new system reduced the physical and social distance be-
tween the beneficiaries and the point of payment collection by routing payments through
a village-level Customer Service Provider (CSP). Government regulations required that
CSPs hired for this purpose be women who were residents of the villages they served, have
completed secondary school, not be related to village officials, preferably be members of
historically disadvantaged castes, and be members of a self-help group (a local group of
micro entrepreneurs, targeted by the AP government for micro-lending). While meeting
all these requirements proved difficult in some cases, these norms ensured that the social
profile of the typical CSP was closer to that of beneficiaries, compared to post-office of-
ficials (who are usually government employees). They also typically made the payments
in the village, thus reducing both the physical and social distance to collect payments.
To implement this intervention, the government contracted with private and state-
run banks, who in turn wrote sub-contracts with technology service providers. While the
12In principle, beneficiaries could use the Smartcards as a savings account and leave money in it, but theregulatory approvals for using the Smartcards in this form had not been provided by the Bank regulator(the Reserve Bank of India) at the time of the study.
13Note that a physical Smartcard is not always required. For example, one Bank chose to issue papercards with digital photographs and bar codes and to store the biometric details in the Point-of-Servicedevice instead of the card. Beneficiaries still authenticate their fingerprints against those in the device inthis system.
9

banks technically “owned” the accounts, it was the technology providers who built and
managed the actual payments system, including enrolling recipients, issuing Smartcards,
hiring CSPs and managing cash logistics.14 Each district was assigned a single bank-
technology provider pairing, which received 2% of the value of each transaction as a
payment directly from the government (banks and technology providers reached their
own arrangements on how this commission would be split between them, and entered the
contract with the government as a combined entity). Figure 1 illustrates the flow of funds
from the government through banks and technology providers to CSPs and beneficiaries
under the new scheme.
While the Smartcard program was designed to improve beneficiary welfare, the im-
pacts were nevertheless ambiguous a priori, with potential for both positive and negative
impacts. Consider first the payment collection process. Smartcards could speed up pay-
ment if technology providers succeeded in a locating a CSP in each village, reducing
travel time relative to long walks to the nearest post office. However, they could also
slow down the process if CSPs are not reliably present, or if the checkout process slows
down due to failures of biometric authentication (for example, increasing the time per
transaction due to repeated attempts to authenticate). On-time cash availability could
improve or deteriorate depending on how well technology providers managed cash lo-
gistics relative to the post office. Most troubling, Smartcards might cut off benefits to
many beneficiaries if they have difficulty obtaining cards in time, misplace their cards,
or are denied payments due to either malfunctioning authentication devices or errors in
matching biometrics. Skeptics of biometric authentication have repeatedly raised these
concerns (Khera, 2011).
Impacts on fraud and corruption are also unclear. In principle, Smartcards should
reduce payments to “ghost” beneficiaries as these do not have fingerprints and cannot
collect payments. It should also make it harder for corrupt officials to collect payments in
the name of real beneficiaries, since beneficiaries must be present and provide biometric
input, and are also given a receipt which they can cross-check against the amount they
receive. However, these arguments assume that the field technology works as designed.
Given the complexity of implementing the new system well, it was possible that the
entire program would not be implemented well enough to be effective. For instance,
under incomplete implementation (see below), it is possible that the main channels of
leakage are not effectively plugged.
Even if Smartcards achieve their stated goal of reducing corruption, they could have
14This structure was a result of regulatory requirements of the Reserve Bank of India (RBI), which stip-ulated that accounts could only be created by banks. However, since the fixed cost of bank branches wastoo high to make it viable to profitably serve rural areas, the RBI permitted banks to partner with TSPsto jointly offer and operate no-frills accounts that could be used for savings, benefits transfers, remittances,and cash withdrawals.
10

other negative consequences. Making corruption more difficult on some margins could
simply displace it to others (Yang, 2008; Niehaus and Sukhtankar, 2013a). For example,
cleaning up bribery in SSP payments could drive up the illicit price of getting on the
SSP list in the first place. In addition, cracking down on graft could reduce local officials’
incentives to implement programs like the NREGS in the first place, which could in turn
hurt workers on the extensive margin of access to work. In these cases, even if corruption
is reduced, the savings may not be spent on the rural poor.
3 Research Design
3.1 Randomization
The AP Smartcard project started in 2006, but there were several implementation chal-
lenges that took time to resolve (including contracting, integration with the existing
program structure in the field, CSP selection, logistics of enrollment and cash manage-
ment, and development of systems for financial reporting and reconciliation). Further,
the Government of Andhra Pradesh (GoAP) followed a “one district, one bank” imple-
mentation model for the Smartcard Program, which led to considerable heterogeneity
among districts in program implementation as a function of the performance of the bank
that was assigned to the district. In early 2010, GoAP decided to restart the Smartcard
program in eight districts where the originally assigned banks had not made any progress,
and re-allocated the contracts for these districts to banks that had demonstrated better
performance in other districts. This “fresh start” provided an ideal setting for an ex-
perimental evaluation of Smartcards because the roll-out of the intervention could be
randomized in these districts, after basic implementation challenges had been solved by
the banks in other districts and the overall project had stabilized from an implementation
perspective.
Our randomized evaluation of the impact of Smartcards was conducted in these eight
districts of Andhra Pradesh, with a combined rural population of around 19 million.
While not randomly selected, study districts look similar to the remaining 15 districts
of AP on the major socioeconomic indicators, including proportion of rural, scheduled
caste, literate, and agricultural labor populations. They are also geographically spread
out across the state, with representation in all three historically distinct socio-cultural
regions (2 in Coastal Andhra, and 3 each in Rayalseema and Telangana).15 The study was
conducted under a formal agreement between J-PAL South Asia and GoAP to random-
ize the order in which mandals (sub-districts) were converted to the Smartcard system.
15The districts were Adilabad, Anantapur, Khammam, Kurnool, Nalgonda, Nellore, Vizianagaram, andKadapa. Note that the socio-cultural regions are distinct enough that the Indian Parliament has recentlyapproved the split of the Telangana region from Andhra Pradesh to become a new state.
11

Mandals were randomly assigned to one of three waves: 113 to wave 1, 195 to wave 2,
and 45 to wave 3 for a sequential roll out (Figure 3). Our evaluation design focuses on
comparing outcomes in wave 1 (treatment) and wave 3 (control) mandals.16 Randomiza-
tion was stratified by revenue division (an administrative unit between the district and
mandal) and by a principal component of numerous other mandal characteristics.17 Table
1 presents tests of equality between treatment and control mandals along several charac-
teristics reported in official sources, none of which differ significantly (unsurprisingly, as
these data were used for stratification). Table 2 shows household characteristics from the
baseline survey; here, NREGS availability is significantly different (although the baseline
and endline control means are not comparable), as is time to collect payments for SSP
households. Our main empirical results include controls for the village-level baseline mean
value of each outcome to mitigate any imbalances arising through sampling variation.
3.2 Data Collection
Our data collection was designed to assess impacts broadly, including both the positive
and negative potential effects discussed above. To capture these we collected a) official
records on beneficiary lists and benefits paid; b) baseline and endline household sur-
veys of representative samples of enrolled participants; c) independent audits of NREGS
worksites; d) village-level surveys to measure political, social, and development indicators
potentially connected to implementation; and e) surveys of officials to capture process
and implementation issues. Household surveys asked details on receipts from and partic-
ipation in NREGS and SSP programs, as well as information about income, employment,
consumption, and assets more generally. We timed our field data collection exercises to
coincide with the peak period of NREGS participation, which falls between May and
July in most districts. We therefore conducted surveys in August through September
of 2010 (baseline) and 2012 (endline), and the surveys collected data regarding program
participation and payment collection for work done from late May to early July. The
intervention was rolled out in the treatment areas shortly after the baseline surveys, and
the lag between program rollout in treatment and control areas was over two years. Thus,
16A mandal in AP typically has a population of 50,000 - 75,000 and consists of around 25-30 units ofvillage governance (called Gram Panchayats or GPs). There are a total of 405 mandals across the 8 districts.We dropped 51 of these mandals (12.6%) prior to randomization, since the Smartcard program had alreadystarted in these mandals. An additional mandal in Kurnool district was dropped because no NREGS datawere available for that mandal. Of the remaining mandals, 15 mandals were assigned to treatment and 6 tocontrol in each of Adilabad, Anantapur, Khammam, Kurnool, Nellore; 16 to treatment and 6 to control inNalgonda; 10 to treatment and 5 to control in Vizianagaram; and 12 to treatment and 4 to control in Kadapa.Note that wave 2 was created as a buffer to maximize the time between program rollout in treatment andcontrol waves and that our study does not use data from these mandals.
17Specifically: population, literacy, Scheduled Caste and Tribe proportion, NREGS jobcards, NREGSpeak employment rate, proportion of SSP disability recipients, proportion of other SSP pension recipients.
12

we estimate the impact of the program after being implemented for two years (the gap
between baseline and endline surveys).
We sampled 886 GPs using probability proportional to size (PPS) sampling, with
six GPs per mandal in six districts and four GPs per mandal in the other two, and
sampled one habitation from each GP again by PPS.18 Within habitations we sampled
six households from the full frame of all NREGS jobcard holders and four from the frame
of all SSP beneficiaries. Our NREGS sample includes five households reported in the
official records as having worked recently and one household which is not. This sampling
design trades off power in estimating leakage (for which households reported as working
matter) against power in estimating rates of access to work (for which all households
matter). For our endline (baseline) survey we sampled 8826 (8579) households, of which
we were unable to survey 268 (899), while 386 (298) households were confirmed as ghost
households, leaving us with final set of of 8172 and 7382 households for the endline and
baseline surveys respectively.
Note that we have a village-level panel dataset and not a household one (since the
endline sample has to be representative of potential workers at that time). So, we test
for differential attrition across treatment and control mandals in the sampling frames of
the NREGS and SSP programs. While some jobcards drop out of the baseline sample
frame because of death, migration, or household splits, and new jobcards also enter
because of creation of new nuclear families, migration, and new enrollments, neither
change differentially affects treatment mandals (Table A.2a). Similarly, SSP beneficiaries
are equally likely to leave or enter the sample in treatment and control areas (Table
A.2b). Finally, new entrants are also similar to control and treatment counterparts on
demographics (household size, caste, religion, education) and socioeconomics (income,
consumption, poverty status) in both the NREGS and SSP sample frames: there were
hence no compositional changes in our sample frames (Table A.2).
3.3 Implementation and First-Stage
We present a brief description of program implementation and the extent of actual roll-out
for two reasons. First, it helps us distinguish between de jure and de facto realities of the
Smartcard program, and thereby helps to better interpret our results by characterizing
the program as it was implemented. Second, understanding implementation challenges
provides context that may be important if we wish to extrapolate the likely impacts to a
different context.
As may be expected, the implementation of such a complex project faced a number of
technical, logistical, and political challenges. Even with the best of intentions and admin-
18Strictly speaking, it is not always possible to sample more than one unit using PPS; some probabilitieswere top-censored at 1.
13
istrative attention, the enrollment of tens of millions of beneficiaries, physical delivery of
Smartcards and Point-of-Service devices, identification and training of CSPs, and putting
in place cash management protocols would have been a non-trivial task. In addition, local
officials (both appointed and elected) who benefited from the status quo system had little
incentive to cooperate with the project, and it is not surprising that there were attempts
to subvert program activities aimed at reducing leakage and corruption (as also described
in Banerjee et al. (2008)). In many cases, local officials tried to either capture the new
system (for instance, by attempting to influence CSP selection), or delay its implementa-
tion (for instance, by citing difficulties to beneficiaries in accessing their payments under
the new system).
On the other hand, the senior-most officials of GoAP (including the Principal Secre-
tary and other top officials of the Department of Rural Development) were strongly com-
mitted to the project, and devoted considerable administrative resources and attention
to successful implementation. GoAP was also committed to high-quality implementation
of NREGS and was among the leading states across India in the utilization of funds ear-
marked for the program by the (federal) Government of India. Overall, implementation
of the Smartcard Program was a priority for GoAP, but it faced an inevitable set of chal-
lenges as described above. Our evaluation is therefore based on an “as is” implementation
of the Smartcard program at scale.
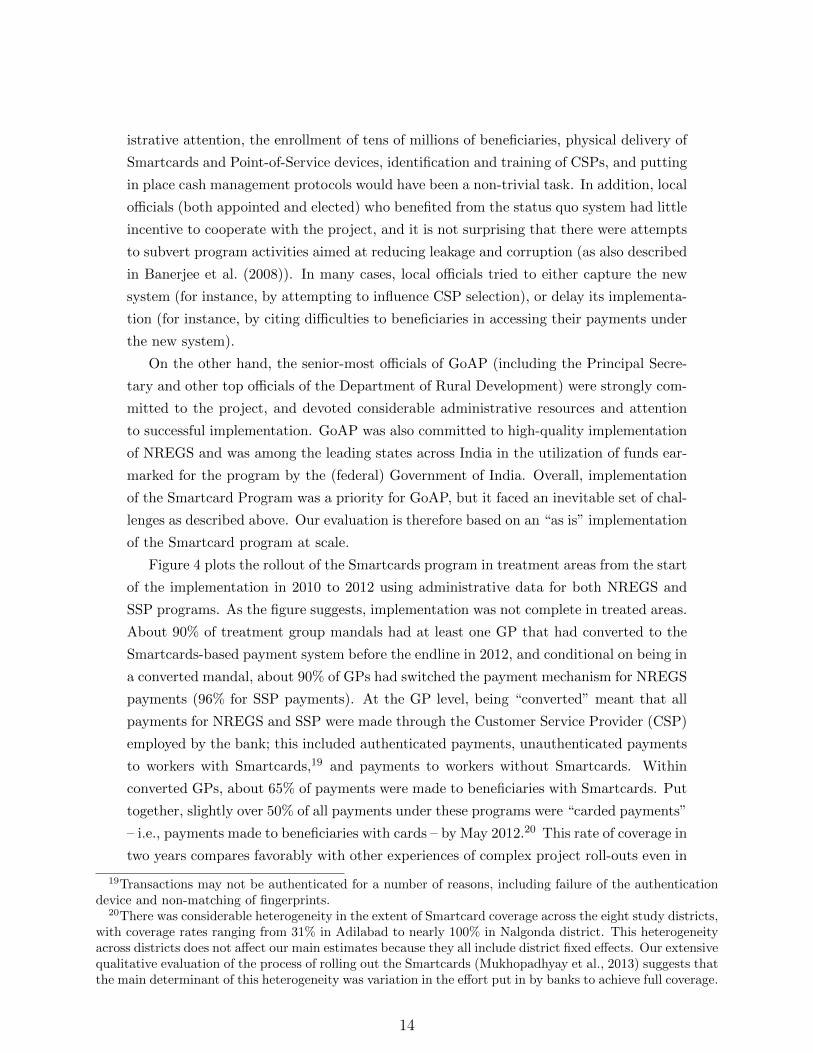
Figure 4 plots the rollout of the Smartcards program in treatment areas from the start
of the implementation in 2010 to 2012 using administrative data for both NREGS and
SSP programs. As the figure suggests, implementation was not complete in treated areas.
About 90% of treatment group mandals had at least one GP that had converted to the
Smartcards-based payment system before the endline in 2012, and conditional on being in
a converted mandal, about 90% of GPs had switched the payment mechanism for NREGS
payments (96% for SSP payments). At the GP level, being “converted” meant that all
payments for NREGS and SSP were made through the Customer Service Provider (CSP)
employed by the bank; this included authenticated payments, unauthenticated payments
to workers with Smartcards,19 and payments to workers without Smartcards. Within
converted GPs, about 65% of payments were made to beneficiaries with Smartcards. Put
together, slightly over 50% of all payments under these programs were “carded payments”
– i.e., payments made to beneficiaries with cards – by May 2012.20 This rate of coverage in
two years compares favorably with other experiences of complex project roll-outs even in
19Transactions may not be authenticated for a number of reasons, including failure of the authenticationdevice and non-matching of fingerprints.
20There was considerable heterogeneity in the extent of Smartcard coverage across the eight study districts,with coverage rates ranging from 31% in Adilabad to nearly 100% in Nalgonda district. This heterogeneityacross districts does not affect our main estimates because they all include district fixed effects. Our extensivequalitative evaluation of the process of rolling out the Smartcards (Mukhopadhyay et al., 2013) suggests thatthe main determinant of this heterogeneity was variation in the effort put in by banks to achieve full coverage.
14

high-income countries. To put Andhra Pradesh’s performance in perspective, the United
States took over fifteen years to convert its own Social Security transfers to electronic
payments.21
We find that treatment GPs are much more likely to be “carded”, i.e. migrated to
the new payment system, with 67% carded for NREGS payments (79% for SSP). We
can also verify that there was practically no contamination in control areas, with less
than 0.5% (0% SSP) of control GPs reporting having migrated to the new system (Table
3). The overall rate of transactions done with carded beneficiaries was 51% in treatment
areas (59% SSP), with basically no carded transactions reported in control areas. We
also asked beneficiaries who had recently worked on NREGS about their Smartcard use
to corroborate these official figures, and find that about 38% (46% SSP) of beneficiaries
in treatment GPs said that they used their Smartcards both generally or recently, while
less than 1% claimed to do so in control areas. Note that the official and survey figures
cannot be directly compared since the official figures are the proportion of transactions
while the survey records the proportion of beneficiaries; moreover, the official figures
do not separate out actually authenticated transactions from payments simply made to
carded beneficiaries that were not authenticated. Meanwhile, the close to 1% figure in
control areas may reflect beneficiary confusion between enrollment – when fingerprints
were scanned and cards issued (which was done in a few control areas even before our
endline) – and actual carded transactions (which were administratively not allowed to
be activated by GoAP in control areas till the endline survey). These responses may
therefore be cases where beneficiaries took their card to get paid even though the new
system was not yet operational.
Overall, both official and survey records indicate that treatment was operational
though incomplete in treatment areas, while contamination in control areas was minis-
cule. Thus, our analysis will focus on using the mandal-level randomization to generate
intent-to-treat (ITT) estimates, which should be interpreted as the average treatment ef-
fects corresponding to an approximately half-complete implementation. These estimates
reflect the magnitudes of impact that are likely under real-world implementation in other
states over a similar time horizon, and likely provide a lower-bound of the long-term
impacts of fully deploying a biometric payment system like Smartcards.
3.4 Estimation
We report intent-to-treat (ITT) estimates, which compare average outcomes in treatment
and control areas. Most outcomes are measured at the household level, with some others
(e.g. NREGS work) at the individual level. All regressions are weighted by inverse
21Direct deposits started in the mid-1990s; by January 1999 75% of payments were direct deposits; andcheck payments finally ceased for good on March 1, 2013. See http://www.ssa.gov/history/1990.html.
15

sampling probabilities to obtain average partial effects for the populations of NREGS
jobcard holders or SSP beneficiaries. We include district fixed effects in all regressions,
and cluster standard errors at the mandal level. We thus estimate
Yimd = α+ βTreatedmd + δDistrictd + εimd (3.1)
where Yimd is an outcome for household or individual i in mandal m and district d, and
Treatedm is an indicator for whether the mandal was in wave 1. When possible we
also report specifications that included the baseline panchayat-level mean of the depen-
dent variable, Y0pmd, to increase precision and to assess sensitivity to any randomization
imbalances. We then estimate
Yipmd = α+ βTreatedmd + γY0pmd + δDistrictd + εipmd (3.2)
where p indexes panchayats. Note that we easily reject γ = 1 in our data, and therefore
do not report difference-in-differences estimates (since these would be misspecified).
Finally, we test for heterogeneity of program impact along key GP-level baseline char-
acteristics using a standard linear interaction specification of the form:
Yipmd = α+β1Treatedmd+β2Characteristic0pmd+β3Characteristic
0pmd·Treatedmd+δDistrictd+εimd
(3.3)
where β3 is the term of interest, which indicates whether treatment effects vary signifi-
cantly by the corresponding initial characteristic (note that we test for heterogeneity by
village-level means of each characteristic, since we have a village-level panel and not a
household panel).
4 Effects of Smartcard-enabled Payments
4.1 Effects on Program Performance
4.1.1 Payments Process
We first examine impacts on the process of collecting payments. This is an important
dimension of program performance in its own right, as payments often arrive after long
and variable delays. NREGS recipients in control mandals report waiting an average of
34 days after finishing each spell of work, more than double the 14 days prescribed by
law. Payments can also take a long time to collect; control households report spending
almost two hours in total collecting an average payment, including both time waiting in
line and also time spent on unsuccessful trips.
We find that Smartcards substantially improved the payment process for NREGS.
16

Columns 1 and 2 of Table 4 report that the total time required to collect a payment
fell by 21 minutes in mandals assigned to treatment (a 19% reduction on a base of 112
minutes). The corresponding estimates for SSP recipients, although negative, are smaller
and not statistically significant (Table 4). This is not surprising, since SSP payments
were made in the village even under the old system. On the other hand, 82% of SSP
beneficiaries who received or enrolled for Smartcards said that Smartcards increased the
speed of payments (Table 8).
Recipients also faced smaller delays in receiving payments after working, andpayment
times became more predictable. Columns 5 and 6 of Table 4 report that assignment to
treatment lowered the mean number of days between working and collecting payments by
0 days, or 29% of the control group mean (and 0% of the amount by which this exceeds
the statutory limit of 14 days). Columns 7 and 8 show that the variability of these lags –
measured as the absolute deviation from the median mandal level lag, thus corresponding
to a robust version of a Levene’s test – also fell, dropping by 39% of the control group
mean. While variability need not imply uncertainty, this at least suggests that recipients
are exposed to less risk.22
4.1.2 Payment Amounts, Bribes, and Leakage
In addition to getting paid faster, recipients get paid more. For NREGS recipients,
Columns 3 and 4 of Table 6 show that earnings per household per week during our
endline study period increased by Rs. 35, or 24% of the control group mean. For SSP
beneficiaries there is less scope for increased earnings, as their benefits are fixed and
the control reports a fairly low rate of bribe demands (3.8%). However, we do see a
1.8 percentage point (47%) reduction in this rate. These results are all consistent with
the Smartcard program’s aspirations of making it more difficult for officials to underpay
beneficiaries.
In contrast, we see no major impacts on fiscal outlays. For the NREGS, Figure
5 plots wage outlays in both treatment and control mandals over the entire two-year
period from January 2010 (seven months before baseline surveys) to December 2012
(three months after endline surveys). The two series track each other closely, with no
discernible differences at baseline, endline, or anywhere else. Columns 1 and 2 of Table 6
confirm this point statistically for the workers sampled into our endline survey; we find no
significant difference between treatment and control mandals.23 We do find a small and
insignificant decline of 1.1 percentage points, or 15% of the control group mean, in the
22We did not ask questions on date of payment to SSP beneficiaries since payment lags were not revealedto be a major concern for them during our initial interviews. Moreover, since payments are made only oncea month, they are spread out over a much longer time frame than the concentrated NREGS work months ofMay-July, and hence recall issues were a concern.
23This is also true for all workers in the full database, not just those sampled.
17

proportion of SSP beneficiaries identified as “ghosts” (Table 5b, Column 1), implying a
small cost savings for government. We see no corresponding change for the NREGS (Table
5a, Column 1), which is consistent with the absence of any change in total outlays.24
The fact that recipients report receiving more while government outlays are unchanged
suggests a reduction in leakage, particularly for the NREGS. Columns 5 and 6 of Table 6
confirm this, showing that the difference between official and survey measures of earnings
per worker per week fell by Rs. 27.
One caveat to this result is that we estimate households in control mandals received Rs.
20 more per week than the corresponding official records indicate, implying a negative
leakage rate (although this result is not significantly different from 0). We view these
estimates of levels of leakage as less reliable than those of the differences, for several
reasons.
First, households may have multiple jobcards as a result of multiple nuclear fami-
lies living together.25 While we sample from the universe of jobcards and not that of
households, it is likely that households respond to the survey questions on the basis of
total NREGS work and payment in the household as opposed to the basis of the specific
jobcard that was sampled. While we discard survey records for individuals within the
household who are not listed on the sampled jobcard for our main comparisons, it is still
possible that some workers may be listed on multiple jobcards. Accordingly, the average
amount of leakage we find in control areas in the full sample at endline is negative.
Using data from the National Sample Survey Round 68 (July 2011-June 2012) to
estimate the number of households with jobcards per district, and our jobcard database
to determine the number of jobcards in the district, we find that the number of jobcards
exceeds the number of households by a factor of 1.9. Using district-specific factors to
scale up official estimates of work done per household rather than per jobcard, we obtain
leakage numbers of 30.7% in control areas and 18.5% in treatment areas at endline (p-
value of difference = 0.11; results in Appendix Table A.4).26 We find that the treatment
has no effect on self-reported ownership of multiple jobcards, so to the extent that this
issue interacts with treatment effects on leakage, these interactions are limited. Moreover,
results are very similar with the sample of beneficiaries who told us their household had
more than one jobcard (results not shown but available on request).
A further caveat is that it is possible that survey reports of higher payments through
NREGS represent collusion between workers and officials and not reductions in leakage:
24We define a recipient as a “ghost” if we confirm that they either did not exist or had permanentlymigrated before the beginning of our study periods (31 May 2010 for baseline, 28 May 2012 for endline).Survey teams confirmed this information with two other neighboring households before making a designation.
25In theory, a Smartcard can only be linked to a single jobcard. In practice, however, the process fordelinking multiple jobcards from Smartcard accounts was never conducted, partly due to the considerabletime and expense involved in determining which was the “real” or active jobcard.
26Note that for these estimates we also include survey reports of all workers within the household.
18

while in both cases more money likely makes it way to the pockets of beneficiaries,
our analysis of random audits of worksites helps us separate these stories. While the
results are noisy, they suggest an increase in worker presence at worksites that is roughly
proportional to the increase in survey reports, which suggests that collusion is unlikely
to be driving increased payments reported in surveys (Appendix Table A.5).27
4.1.3 Program Access
Given that Smartcards appear to have curtailed corruption, one important question is
whether they unintentionally reduced beneficiaries’ access to the programs. While we find
a reduction in leakage as intended, the worry is that if officials’ rents are squeezed, the
incentive to implement the program itself will be lower (Leff, 1964). Although in theory
the NREGS guarantees employment at any time that a household wants it, in practice
researchers have found that access to work is rationed (Dutta et al., 2012). In our data,
20% of control group households said that they had difficulty getting work on NREGS
in May (slack labor demand), 42% had difficulty finding NREGS employment in January
(peak labor demand), while only 3.5% said that anyone in their village can get work on
NREGS whenever they want. All these indicators of program accessibility improve after
the Smartcards treatment, although only the coefficient on the last mentioned indicator is
statistically significant at the 10% level (Table 7). These perceptions of increased access
to work are borne out by basic results on the extensive margin: during our study period,
households were 7.5 percentage points (18% of the control mean) more likely to work in
treatment areas than in control areas (Table 7).
Moreover, we find no evidence of reported increases in the incidence of bribes paid
to enroll in either program. Bribes paid to enroll in SSP for recent enrollees – those
enrolled after Smartcards implementation began – were down by 5.5 percentage points
(72% of the control mean), although this result is not statistically significant (Column
5, Table 5b). Bribes paid to access work on NREGS during the study period were also
(statistically insignificantly) lower (Column 5, Table 5a).
4.1.4 Overall Perceptions
The results above suggest that Smartcards uniformly improved recipients’ experience of
the SSP and NREGS programs; all of our estimates point towards a better user experience.
27We also find no evidence of Hawthorne effects of the experiment or audits on survey respondents orofficials (Appendix Table A.6). Our worksite audits were conducted in 5 randomly selected GPs out of the 6surveyed within each mandal, and we find no difference in survey reports between the audited and unauditedGPs. In addition, we did audits in an additional randomly selected GP that had no survey, and we find nodifferences in audit outcomes between surveyed and non-surveyed GPs. Finally, using the full official data,we find no effect of either audits or surveys on official data outcomes (all results not reported but availableon request).
19

Of course, it is possible that we missed impacts on other important dimensions of program
performance that push in the other direction. We therefore also directly asked recipients
who were exposed to the Smartcard program – including both beneficiaries who had
received a Smartcard and used it to pick up wages, and also beneficiaries who had enrolled
for, but not received, a physical Smartcard – in treated mandals to describe the pros and
cons of the new payment process and state which system they preferred.
Table 8 summarizes the results. Some of our own ex-ante concerns are reflected, with
many recipients stating that they fear losing their Smartcards (53% NREGS, 62% SSP) or
having problems with the payment reader (49% NREGS, 59% SSP). Most beneficiaries do
not trust the Smartcards system enough to deposit money in their accounts. Yet strong
majorities also agree that Smartcards make payment collection easier, faster, and less
manipulable. Overall, 84% of NREGS beneficiaries and 91% of SSP beneficiaries prefer
Smartcards to the status quo, with only 8% of NREGS and 5% of SSP beneficiaries
disagreeing, and the rest neutral. These numbers reinforce the view that Smartcards
significantly improved program performance in delivering payments.
It is worth highlighting the importance of these numbers from a policy point of view.
In practice, senior officials in the government were much more likely to hear about cases
where the Smartcard system was not working well relative to positive reports of im-
proved beneficiary satisfaction. The setting provides an excellent example of the political
economy of concentrated costs to those made worse off by the program (including low
and middle-level officials whose opportunities for graft were reduced) versus the diffuse
benefits to millions of beneficiaries.
4.2 Heterogeneity
4.2.1 Heterogenous Treatment Effects
An important concern regarding the new payments system was the possibility of adverse
distributional consequences even if mean effects were positive. For instance, it is possible
that the most vulnerable beneficiaries face greater difficulty in enrolling for Smartcards or
in authenticating their biometrics, and may as a result be worse off under the new system.
We plot quantile treatment effects of key outcomes (time to collect payment, payment
delays, official payments, and payments received as per the survey) and find that the
treatment distribution first-order stochastically dominates the control distribution for the
major outcomes that show a significant average treatment effect (Figure 6). This suggests
that not only are the average effects positive, but that no treatment household is worse
off relative to a control household at the same percentile in the outcome distribution.
We also test whether treatment effects on key outcomes (time to collect payment,
payment delays, official payments, and survey payments) varied significantly as a func-
20

tion of baseline characteristics at the village level (β3 in Equation 3.3). We first focus
on heterogeneity as a function of the baseline value of the outcome variable. Other char-
acteristics include measures of village-level affluence (consumption, land ownership and
value), importance of NREGS to the village (days worked and amounts paid), and mea-
sures of socio-economic disadvantage (fraction of the population below the poverty line
(BPL) and belonging to historically-disadvantaged scheduled castes (SC)). We find no
significant heterogeneity of program impact along any of these characteristics (Table 9).
Most important of these is the lack of any differential impact of treatment as a function
of the baseline values of each of the outcome variables (first row of Table 9), which suggests
broad-based program impacts at all initial values of these outcomes. To see this more
clearly, Figures A.1 and A.2 plot non-parametric treatment effects on each outcome by
percentile of the baseline value of the same variable. We see that reductions in time
to collect payments and payment delays took place at all percentiles of their baseline
values. Official payments remain unchanged at all percentiles, and survey payments show
an inverted-U pattern, with the highest increases in the intermediate range of baseline
payments.28
4.2.2 Channels of Program Impact
To better understand the channels of impact, Table 10 presents a non-experimental de-
composition of the total treatment effects (on all the key outcomes) between carded and
uncarded GPs and also between beneficiaries in carded GPs who are with and without
Smartcards. We see that for most of the outcomes, significant effects are found only in
the carded GPs, suggesting that the carded payments were indeed the mechanism for
the impacts we find. In addition, we find that uncarded beneficiaries in carded GPs
benefit just as much as carded beneficiaries in these GPs for payment process outcomes
such as time to collect payments and reduction in payment lags. While these are non-
experimental decompositions, they provide suggestive evidence that converting a village
to carded payments may have been the key mechanism by which there were improvements
in the process of collecting payments, and also suggest that the implementation proto-
col followed by GoAP did not inconvenience uncarded beneficiaries in GPs that were
converted to the new system. The lack of negative impacts for uncarded beneficiaries
may be due to GoAPs inability to insist on carded payments for all beneficiaries (due
to the political cost of denying payments to genuine beneficiaries). While permitting
uncarded payments may have permitted some amount of leakage to continue even under
28It is important to note that heterogeneity in our setting could reflect variation in implementation intensityas well as heterogeneous impacts from uniform implementation. Since implementation of the Smartcardprogram was incomplete, we also plot the treatment intensity (fraction of carded payments at the GP level)below each non-parametric plot (panels (c) and (d) of Figures A.1 and A.2). Overall, it appears thatimplementation heterogeneity along observables was limited.
21

the new system, it was probably politically prudent to do so in the early stages of the
implementation.
Accordingly, payments to carded beneficiaries (as opposed to carded GPs) seem to
be the main driver of reductions in leakage, suggesting that biometric authentication
was important for these outcomes. While increases in survey payments and reductions
in leakage are also found only in carded GPs (columns 8 and 12), they appear to be
concentrated on households with Smartcards. Note that the lower official and survey
payments to uncarded beneficiaries in converted GPs could also simply reflect less active
workers (who will be paid less) being less likely to have enrolled for the Smartcards.
As described earlier, the intervention consisted of both technological changes (bio-
metric authentication) as well as operational changes (payment made in the village by
a CSP) in the payments system and our main results represent the composite impact
of these two changes. However, the non-experimental decomposition presented here sug-
gests that converting a GP to the new payment system was the main contributor to the
increased convenience in collecting payments, while the use of biometric Smartcards at
the beneficiary level may have been the main contributor to reductions in leakage.
5 Cost-Effectiveness and Welfare Impacts
We organize our discussion of cost-effectiveness and welfare impacts into two categories:
pure efficiency gains and redistribution. The former includes the reduction in time taken
to collect payment, and the reduction in the variability of the lag between completing
NREGS work and getting paid for it. The latter include the shorter payment lags (which
move the cash value of the interest “float” from banks to beneficiaries), and reduced
leakage (which move funds from corrupt officials to beneficiaries).
We estimate the value of time saved in collecting payments conservatively using re-
ported agricultural wages during June, when they are relatively low. Using June wages
of Rs. 130/day and assuming a 6.5 hour work-day (estimates of the length of the agri-
cultural work day range from 5 to 8 hours/day), we estimate the value of time at Rs.
20/hour. Since the treated areas saw a reduction in time cost of 21 minutes per payment
collected (Table 4), we estimate the value of time saved at Rs 7 per payment collected.
To calculate the cost of the program, we use the 2% commissions the government pays
to banks (because this is supposed to cover all costs of the banks and TSPs for running
the program). This overstates the change in costs because it treats the costs of running
the status-quo delivery mechanism as zero.29 We assume that recipients collect payments
once per spell of work, which is consistent with the fact (presented earlier) that they
29However, we do not include estimates for the cost of time of officials in implementing and overseeing theSmartcard program because they will have had to exercise oversight of the older system as well.
22

do not keep balances on their Smartcards accounts. Using administrative data on all
NREGS payments in our study districts in 2012, we calculate the average payment as Rs.
502, and thus estimate that GoAP would pay 2% of this or Rs. 10 per payment collected.
Since commissions are only paid when GPs are converted, we scale this estimate down
by two-thirds (to account for the fact that only two-thirds of GPs were converted during
the study period) and estimate the cost per payment at Rs. 6.7.30
We conduct a similar exercise for the SSP payments, and compare the costs of program
implementation with the benefits of time saved in Figure 7. We find that the value of
saved time is roughly equal to the government’s costs in the case of NREGS payments,
and we cannot reject that they are equal in the case of the SSP payments (though the
point estimate in this case is also not significant). Scaling up by the size of the two
programs in the 8 study districts, we estimate the cost of the new payment system at
$4.25 million for NREGS ($1.85 million SSP), and the value of time savings at $4.44
million for NREGS ($0.32 million for SSP). Further, the reduction in the variability of
the lag to payment is likely to unambiguously benefit workers (though we do not attempt
to quantify these gains here).
The shorter payment lag moves the float from banks to beneficiaries. We assume that
the value of the float to banks is 5% per year (mean savings account interest rates) and
to poor workers is 26% per year (benchmark interest rates for micro-finance loans, which
are the most common form of credit in rural AP). We use our estimated reduction in
payment lag (10 days, Table 4), and scale up by the total volume of NREGS payments
in the eight study districts, and estimate the annual cost to banks at $0.43 million and
the annual gains to beneficiaries at $2.25 million. We multiply the estimated reduction
in leakage of 12.2% by the total annual outlay of NREGS in the eight study districts, in
order to estimate an annual reduction in leakage of $38.7 million. The reduction of 1.1%
in ghost beneficiaries in the SSP program scaled up by the volume of the SSP payments
would translate into an annual reduction in excess payments of $1.3 million.
Since all of these effects are redistributive, we cannot estimate welfare gains without
taking a view on the relative weights on the utility of winners and losers. However, since
the redistribution is likely to be moving income from the rich to the poor in all these cases,
the gains to social utility should be positive under a utilitarian social welfare function
with equal weights on the utility of all citizens and concave individual utility functions.
To the extent that the aim of the NREGS is explicitly redistributive, the gains in social
utility are likely to be even larger if we put greater weight on the welfare of the poor
30Note that our estimated treatment effects are ITT effects and are based on converting only two-thirdsof GPs. Since Table 10 suggests that the program impacts are driven by converting GPs to the new system,an alternative approach would be to use the randomization as an instrument to generate IV estimates of theimpact of being a carded GP. However, this will simply scale up both the benefit and cost estimates linearlyby a factor of 3/2. We prefer the ITT approach because it does not require satisfying an additional exclusionrestriction.
23

than the rich. Finally, if taxpayers and the social planner place a zero weight on the
utility loss to corrupt officials from being less able to siphon funds meant for the poor
(because these are “illegitimate” earnings), then the welfare gains from reduced leakage
are unambiguously positive and substantively large.
6 Conclusion
The value of improved payments infrastructure is an important open policy question in
developing countries. New technologies promise to relax constraints in both the public
and private sectors, but there are myriad reasons to be skeptical that this promise can
be achieved. We examine this question empirically, conducting a large-scale, randomized,
as-is evaluation of a new payment system built on biometric authentication and electronic
benefit transfer introduced into two major social programs in Andhra Pradesh, India.
We find that, despite substantial implementation challenges which limited conversion
to just over 50% of transactions, the poor gained significantly from the reform. Bene-
ficiaries receive payments faster and more reliably, spend less time collecting payments,
receive a higher proportion of benefits, and pay less in bribes. These gains do not come at
the expense of program access, which if anything appears to improve slightly. Neither do
they come at the expense of the most vulnerable beneficiaries, as we see little heterogene-
ity by baseline characteristics and treatment distributions that stochastically dominate
those in control. Finally, beneficiaries themselves overwhelmingly report preferring the
new payment system to the old. These results, and conservative cost-benefit calculations
using them, suggest that improved payments technology can more than justify their costs
in rural parts of developing countries.
As with any evaluation our results are valid only through a point in time, and we
can only make intelligent guesses as to how outcomes will subsequently evolve. On the
one hand, benefits could deteriorate if interested groups gradually find ways to subvert
or capture the new systems installed. On the other hand, benefits could increase if and
when the government is able to increase coverage and plug remaining loopholes. Perhaps
most importantly, our results describe the value of Smartcards for public programs but do
not capture their potential value as public infrastructure on which private-sector activity
can be built. For example, recipients who now use Smartcards to collect government
transfers may in future also use them to save, borrow, purchase insurance, or send and
receive private transfers. Thus, our estimates (which only quantify the gains from the new
system in two public programs) are likely to be a lower bound on the potential long-term
returns to investing in modern secure payments infrastructure.
24

References
Aker, Jenny, Rachid Boumnijel, Amanda McClelland, and Niall Tierney, “Zapit to Me: The Impact of a Mobile Money Transfer Program,” Technical Report, TuftsUniversity 2012. 1
Anderson, Siwan, Patrick Francois, and Ashok Kotwal, “Clientilism in IndianVillages,” Technical Report, University of British Columbia 2013. 9
Banerjee, Abhijit, Rachel Glennerster, and Esther Duflo, “Putting a Band-Aidon a Corpse: Incentives for Nurses in the Indian Public Health Care System,” Journalof the European Economic Association, 2008, 6 (2-3), 487–500. 1, 3.3
Besley, Timothy and Torsten Persson, “The Origins of State Capacity: PropertyRights, Taxation, and Politics,” American Economic Review, September 2009, 99 (4),1218–44. 1
and , “State Capacity, Conflict, and Development,” Econometrica, 01 2010, 78 (1),1–34. 1
Bold, Tessa, Mwangi Kimenyi, Germano Mwabu, Alice Ng’ang’a, and JustinSandefur, “Interventions and Institutions: Experimental Evidence on Scaling up Ed-ucation Reforms in Kenya,” Technical Report, Center for Global Development 2013.1
Duflo, Esther, Rema Hanna, and Stephen P. Ryan, “Incentives Work: GettingTeachers to Come to School,” American Economic Review, 2012, 102 (4), 1241–78. 1
Dutta, Puja, Rinku Murgai, Martin Ravallion, and Dominique van de Walle,“Does India’s Employment Guarantee Scheme Guarantee Employment?,” Policy Re-search Working Paper Series 6003, World Bank 2012. 4.1.3
Gine, Xavier, Jessica Goldberg, and Dean Yang, “Credit Market Consequences ofImproved Personal Identification: Field Experimental Evidence from Malawi,” Amer-ican Economic Review, October 2012, 102 (6), 2923–54. 1
Greif, Avner, “Contract Enforceability and Economic Institutions in Early Trade: TheMaghribi Traders’ Coalition,” American Economic Review, 1993, 83 (3), pp. 525–548.1
Jack, William and Tavneet Suri, “Risk Sharing and Transactions Costs: Evidencefrom Kenya’s Mobile Money Revolution,” American Economic Review, 2014, 1, 183–223. 1
Jayachandran, Seema, “Selling Labor Low: Wage Responses to Productivity Shocksin Developing Countries,” Journal of Political Economy, 2006, 114 (3), pp. 538–575. 9
Khera, Reetika, “The UID Project and Welfare Schemes,” Economic and PoliticalWeekly, 2011, 46 (9). 1, 2.3
Kremer, Michael, “The O-Ring Theory of Economic Development,” The QuarterlyJournal of Economics, 1993, 108 (3), 551–575. 1
25

Leff, Nathaniel, “Economic Development through Bureaucratic Corruption,” AmericanBehavioural Scientist, 1964, 8, 8–14. 1, 4.1.3
Mukhopadhyay, Piali, Karthik Muralidharan, Paul Niehaus, and SandipSukhtankar, “Implementing a Biometric Payment System: The Andhra Pradesh Ex-perience,” Technical Report, University of California, San Diego 2013. 1, 20
Niehaus, Paul and Sandip Sukhtankar, “Corruption Dynamics: The Golden GooseEffect,” American Economic Journal: Economic Policy, 2013, 5. 1, 2, 2.1, 2.3
and , “The Marginal Rate of Corruption in Public Programs: Evidence from India,”Journal of Public Economics, 2013, 104, 52 – 64. 1, 2, 2.1
NIPFP, “A Cost-Benefit Analysis of Aadhaar,” Technical Report, National Institute forPublic Finance and Policy 2012. 1
Prescott, Edward and Stephen Parente, Barriers to Riches, Cambridge: MIT Press,2000. 1
Pritchett, Lant, “Is India a Flailing State? Detours on the Four Lane Highway toModernization,” HKS Faculty Research Working Paper Series RWP09-013, HarvardKennedy School 2010. 2
Programme Evaluation Organization, “Performance Evaluation of Targeted PublicDistribution System,” Technical Report, Planning Commission, Government of IndiaMarch 2005. 2
Reinikka, Ritva and Jakob Svensson, “Local Capture: Evidence From a CentralGovernment Transfer Program in Uganda,” The Quarterly Journal of Economics, May2004, 119 (2), 678–704. 1
Yang, Dean, “Can Enforcement Backfire? Crime Displacement in the Context of Cus-toms Reform in the Philippines,” The Review of Economics and Statistics, November2008, 90 (1), 1–14. 2.3
26

State
District
Mandal
Gram Panchayat
Worker
State
District
Mandal
Gram Panchayat
Worker
Bank
TSP
CSP
Status Quo Smartcard-enabled
1 1
3b
2
3a
2
4a
4b
Figure 1: Comparison of treatment and control payment systems“TSP” is a Technology Service Provider, a firm contracted by the bank to handle details of electronic transfers. “CSP” is a Customer
Service Provider, from whom beneficiaries receive cash payments after authentication. In both systems, (1) paper muster rolls are
maintained by the GP and sent to the mandal computer center, and (2) the digitized muster roll data is sent to the state financial
system. In the status quo model, (3a) the money is transferred electronically from state to district to mandal, and (4a) the paper
money is delivered to the GP (typically via post office) and then to the workers. In the Smartcard-enabled system, (3b) the money
is transferred electronically from the state to the bank, to the TSP, and finally to the CSP, and (4b) the CSP delivers the cash and
receipts to authenticated recipients.
27

(a) Sample Smartcard
(b) Point-of-Service device
Figure 2: The technology
28

Study MandalsWave
Non-StudyControlTreatment
Andhra Pradesh Smartcard Study Districts
Figure 3: Study districts with treatment and control mandalsThis map shows the 8 study districts and the assignment of mandals (sub-districts) to treatment and control groups. Mandals were
randomly assigned to one of three waves: 113 to wave 1, 195 to wave 2, and 45 to wave 3. Wave 2 was created as a buffer to maximize
the time between program rollout in treatment and control waves; our study does not use data from these mandals. Randomization
was stratified by revenue division (an administrative unit between the district and mandal) and by a principal component of mandal
characteristics including population, literacy, Scheduled Caste and Tribe proportion, NREGS jobcards, NREGS peak employment rate,
proportion of SSP disability recipients, and proportion of other SSP pension recipients.
29

NREGA SSP
0
25
50
75
100
Jul 2011 Oct 2011 Jan 2012 Apr 2012 Jul 2011 Oct 2011 Jan 2012 Apr 2012Month
Con
vers
ion
%
% Mandals % GPs % Carded Payments % Cumulative
Figure 4: Rollout of Smartcard integration with welfare programsThis figure shows program rollout in aggregate and at different conversion levels. A GP converts to the Smartcard-enabled system based
on beneficiary enrollment in the program. “% Mandals” is the percentage of mandals converted in a district. A mandal converts when
at least one GP in the mandal converts. “% GPs” is the percentage of converted GPs in converted mandals. “% Carded Payments” is
the percentage of payments in carded GPs transacted with carded beneficiaries. Multiplying these variables produces the cumulative
program rollout.
0
50000
100000
150000
Jan/2010 Jul/2010 Jan/2011 Jul/2011 Jan/2012 Jul/2012 Jan/2013Month
Ave
rage
Am
ount
Dis
burs
ed
ControlTreatment
Figure 5: Official disbursement trends in NREGSThis figure shows weekly official NREGS payments for all workers averaged at the GP-day level for treatment and control areas. The
grey shaded bands denote the study periods on which our survey questions focus (baseline in 2010 - May 31 to July 4; endline in 2012
- May 28 to July 15).
30

−20
00
200
400
Tim
e to
Col
lect
0 .2 .4 .6 .8 1Percentile of Endline Time
Control TreatmentDifference 95% Confidence Band
(a) Time to collect−
500
5010
0P
aym
ent L
ag
0 .2 .4 .6 .8 1Percentile of Endline Lag
Control TreatmentDifference 95% Confidence Band
(b) Payment Lag
020
040
060
0O
ffici
al A
mou
nt
0 .2 .4 .6 .8 1Percentile of Endline Official
Control TreatmentDifference 95% Confidence Band
(c) Official
−20
00
200
400
600
Sur
vey
Am
ount
0 .2 .4 .6 .8 1Percentile of Endline Survey
Control TreatmentDifference 95% Confidence Band
(d) Survey
Figure 6: Quantile Treatment Effects on Key OutcomesPanels (a)-(d) show nonparametric treatment effects. “Time to collect” is the average time taken to collect a payment, including the
time spent on unsuccessful trips to payment sites. “Payment Lag” is the average lag (in days) between work done and payment received
under NREGS. “Official” refers to NREGS payment amounts paid as listed in official muster records, while “survey” refers to payments
received as reported by beneficiaries, both during study periods (baseline in 2010 - May 31 to July 4; endline in 2012 - May 28 to July
15). All lines are fit by a kernel-weighted local polynomial smoothing function with Epanechnikov kernel and probability weights, with
standard errors bootstrapped.
31

Figure 7: Time savings in collecting paymentsThis figure shows time savings quantified as the opportunity cost of a beneficiary’s time to collect compared against the government
costs for an average payment. “Savings” is calculated as the worker’s private market wage during the time they need to collect a
payment. The time includes time spent in line, making extra trips, etc. The “government cost”, paid to the banks, is 2% of the
payment amount, scaled down to payments made only in carded GPs. The statistic is calculated here from the average payment
amount per workspell. The error bars represent a 95% CI. Standard errors clustered at mandal level.
32

Table 1: Balance on baseline characteristics: Official records
Treatment Control Difference p-value
Population 43734 43578 155 .94Pensions per capita .12 .12 .0013 .79Jobcards per capita .55 .55 -.0063 .84Literacy rate .45 .45 .0039 .74% SC .19 .19 .003 .81% ST .19 .19 .003 .81% population working .51 .51 .00018 .88% male .51 .51 .00018 .88% old age pensions .48 .49 -.0095 .83% weaver pensions .009 .011 -.0015 .71% disabled pensions .1 .1 .0021 .83% widow pensions .21 .2 .014 .48
This table presents outcome means from official data on mandal characteristics. Column 3 reports the difference in treatment and
control means, while column 4 reports the p-value on the treatment indicator, both from simple regressions of the outcome with
district fixed effects as the only controls. A “jobcard” is a household level official enrollment document for the NREGS program. “SC”
(“ST”) refers to Scheduled Castes (Tribes), historically discriminated-against sections of the population now accorded special status
and affirmative action benefits under the Constitution. Statistical significance is denoted as: ∗p < 0.10, ∗∗p < 0.05, ∗∗∗p < 0.01
Table 2: Balance on baseline characteristics: Household survey
NREGS SSPTreatment Control Difference p-value Treatment Control Difference p-value
HHD members 4.8 4.8 .02 .9 4.1 4.2 -.15 .4BPL .98 .98 .0042 .73 .98 .97 .0039 .65Scheduled caste .22 .25 -.027 .34 .19 .23 -.036∗ .092Scheduled tribe .12 .11 .0061 .83 .096 .12 -.023 .45Literacy .42 .42 .0015 .93 .38 .39 -.013 .4Annual income 41447 42791 -1387 .49 33554 35279 -2186 .31Annual consumption 104607 95281 8543 .4 74602 77148 -3445 .55Pay to work/enroll .01 .0095 .0009 .83 .054 .07 -.016 .24Pay to collect .058 .036 .023 .14 .059 .072 -.008 .81Ghost HHD .031 .017 .014 .12 .012 .0096 .0018 .76Time to collect 157 169 -7.3 .63 94 112 -18∗∗ .027Average Payment Delay 29 23 .22 .93Payment delay deviation 11 8.8 -.42 .77Official amount 167 159 12 .51Survey amount 171 185 -12 .56Leakage -4.4 -26 25 .15NREGS availability .47 .56 -.1∗∗ .02HHD doing NREGS work .41 .41 .0021 .95
This table presents outcome means from the household survey. Columns 3 and 6 report the difference in treatment and control means,
while columns 4 and 8 report the p-value on the treatment indicator, all from simple regressions of the outcome with district fixed
effects as the only controls. “BPL” is an indicator for households below the poverty line. “Pay to work/enroll” refers to bribes paid in
order to obtain NREGS work or to start receiving SSP pension. “Pay to Collect” refers to bribes paid in order to receive payments.
“Ghost HHD” is a household with a beneficiary who does not exist (confirmed by three neighbors) but is listed as receiving payment on
official records. “Time to Collect” is the time taken on average to collect a benefit payment, including the time spent on unsuccessful
trips to payment sites, in minutes. Statistical significance is denoted as: ∗p < 0.10, ∗∗p < 0.05, ∗∗∗p < 0.01
33

Table 3: Treatment increased official and self-reported use of Smartcards
(a) NREGS
Official data (%) Survey data (%)
(1) (2) (3) (4)
Carded GPMean fractioncarded pmts
Pmts generallycarded (village mean)
Most recent pmtcarded (village mean)
Treatment .67∗∗∗ .51∗∗∗ .38∗∗∗ .38∗∗∗
(.045) (.04) (.043) (.043)
District FE Yes Yes Yes Yes
Adj R-squared .45 .49 .37 .36Control Mean .0046 .0028 .039 .013N. of cases 886 886 824 824Level GP GP GP GP
(b) SSP
Official data (%) Survey data (%)
(1) (2) (3) (4)
Carded GPMean fractioncarded pmts
Pmts generallycarded (village mean)
Most recent pmtcarded (village mean)
Treatment .79∗∗∗ .59∗∗∗ .46∗∗∗ .46∗∗∗
(.041) (.037) (.05) (.048)
District FE Yes Yes Yes Yes
Adj R-squared .57 .55 .38 .38Control Mean 0 0 .07 .043N. of cases 886 886 882 882Level GP GP GP GP
This table analyzes usage of Smartcards for NREGS and SSP payments as of July 2012. Each observation is a gram panchayat (“GP”:
administrative village). “Carded GP” is a gram panchayat that has moved to Smartcard-based payment, which happens once 40% of
beneficiaries have been issued a card. “Mean fraction carded pmts” is the proportion of transactions done with carded beneficiaries
in carded GPs. Both these outcomes are from official data. Columns 3 and 4 report survey-based measures of average beneficiary use
of Smartcards or a biometric-based payment system in the GP. Standard errors clustered at mandal level in parentheses. Statistical
significance is denoted as: ∗p < 0.10, ∗∗p < 0.05, ∗∗∗p < 0.01
34

Table 4: Payments are easier to access
Time to Collect (Min) Pmt Lag (Days)
(1) (2) (3) (4) (5) (6) (7) (8)NREGS NREGS SSP SSP Average Average Deviation Deviation
Treatment -21∗∗ -21∗∗ -5.9 -2.6 -7.1∗ -10∗∗∗ -2.9∗∗∗ -4.7∗∗∗
(9.3) (8.7) (5.5) (5.9) (3.8) (3.6) (1.1) (1.5)
Carded GP
BL GP Mean .08∗ .23∗∗∗ -.027 .043(.041) (.073) (.09) (.054)
District FE Yes Yes Yes Yes Yes Yes Yes Yes
Week Fe No No No No Yes Yes Yes Yes
Adj R-squared .06 .08 .07 .11 .14 .31 .07 .17Control Mean 112 112 77 77 34 34 12 12N. of cases 10252 10181 3805 3591 14279 7254 14279 7254Level Indiv. Indiv. Indiv. Indiv. Indiv-Week Indiv-Week Indiv-Week Indiv-WeekSurvey NREGS NREGS SSP SSP NREGS NREGS NREGS NREGS
The dependent variable in columns 1-4 is the average time taken to collect a payment (in minutes), including the time spent on
unsuccessful trips to payment sites, with observations at the beneficiary level. The dependent variable in columns 5-6 is the average
lag (in days) between work done and payment received on NREGS, while columns 7-8 report results for absolute deviations from
the median mandal lag. Standard errors clustered at mandal level in parentheses. Statistical significance is denoted as: ∗p < 0.10,∗∗p < 0.05, ∗∗∗p < 0.01
35

Table 5: Corruption: bribes, ghosts, and awareness
(a) NREGS
Ghost households(village mean %)
Bribe to work (%) Bribe to collect (%)
(1) (2) (3) (4) (5) (6) (7) (8)All All Recent Recent
Treatment -.011 -.011 -.0026 -.0027 -.00016 -.00038 -.0021 -.0028(.02) (.021) (.0028) (.0029) (.0015) (.0015) (.0088) (.0092)
BL GP Mean -.0081 -.0066 -.0056∗∗ .014(.067) (.0041) (.0027) (.018)
District FE Yes Yes Yes Yes Yes Yes Yes Yes
Adj R-squared .02 .02 .00 .00 .00 .00 .01 .01Control Mean .11 .11 .0047 .0047 .0022 .0022 .021 .021N. of cases 5314 5278 10540 10469 7232 6908 10437 10366Level HHD HHD Indiv. Indiv. Indiv. Indiv. Indiv. Indiv.
(b) SSP
Ghost households(village mean %)
Bribe to enroll (%) Bribe to collect (%)
(1) (2) (3) (4) (5) (6) (7) (8)All All Recent Recent
Treatment -.0096 -.0091 .0017 .0016 -.047 -.055 -.018 -.018∗
(.011) (.011) (.0074) (.0075) (.031) (.039) (.013) (.011)
BL GP Mean .22 .027 .025 .17∗∗∗
(.14) (.021) (.045) (.043)
District FE Yes Yes Yes Yes Yes Yes Yes Yes
Adj R-squared .01 .01 .01 .01 .05 .05 .06 .10Control Mean .063 .063 .019 .019 .076 .076 .038 .038N. of cases 3512 3310 3802 3587 586 354 3801 3591Level HHD HHD Indiv. Indiv. Indiv. Indiv. Indiv. Indiv.
“Ghost households” refer to households (or all beneficiaries within households) that were confirmed not to exist, or who had permanently
migrated before the study period started on May 28, 2012 (May 31, 2010 for baseline). “Bribe to work” refer to bribes paid in order
to obtain NREGS work, “bribe to collect” refer to bribes paid in order to receive payments on either SSP or NREGS, while “bribes to
enroll” refer to bribes paid in order to get on the SSP beneficiary list. “Recent” in table (a) refers to the 2012 endline study period (May
28-July 15), while in table (b) it refers to 2011-2012. Standard errors clustered at mandal level in parentheses. Statistical significance
is denoted as: ∗p < 0.10, ∗∗p < 0.05, ∗∗∗p < 0.01
36

Table 6: Weekly NREGS earnings increased, leakage reduced
Official Survey Leakage
(1) (2) (3) (4) (5) (6)
Treatment 9.8 7.5 35∗∗ 35∗∗ -25∗ -27∗∗
(12) (12) (15) (15) (13) (13)
BL GP Mean .12∗∗∗ .11∗∗∗ .089∗∗
(.027) (.037) (.038)
District FE Yes Yes Yes Yes Yes Yes
Adj R-squared .03 .05 .05 .06 .03 .04Control Mean 127 127 146 146 -20 -20N. of cases 5180 5144 5180 5144 5180 5144
Each observation refers to household-level average weekly amounts for NREGS work done during the study period (baseline in 2010 -
May 31 to July 4; endline in 2012 - May 28 to July 15). The regressions include all sampled beneficiaries who were a) found by survey
team to match official record or b) listed in official records but confirmed as “ghost” beneficiary as described in Table 5. “Official” refers
to amounts paid as listed in official muster records. “Survey” refers to payments received as reported by beneficiaries. “Leakage” is
the difference between these two amounts. Standard errors clustered at mandal level in parentheses. Statistical significance is denoted
as: ∗p < 0.10, ∗∗p < 0.05, ∗∗∗p < 0.01
Table 7: Access to NREGS work marginally improved
Proportion ofHHDs doing
NREGS work (%)
Do you havedifficulty finding
NREGS work in... (%)
Desired increasein NREGSwork (days)
Is NREGS workavailable when
anyone wants it (%)
(1) (2) (3) (4) (5) (6)Study Period May January May General General
Treatment .075∗∗ -.025 -.031 -.93 .026∗ .023(.033) (.027) (.033) (1.3) (.015) (.015)
BL GP Mean -.023(.027)
District FE Yes Yes Yes Yes Yes Yes
Adj R-squared .05 .10 .10 .08 .02 .02Control Mean .42 .2 .42 6.6 .035 .035N. of cases 4978 4783 4531 4978 4790 4750
This table analyzes household level access to NREGS. Column 1 reports the proportion of households doing work in the 2012 endline
study period (May 28-July 15). “Difficulty finding NREGS work” denotes whether any member of household was unable to get work
during May (slack labor demand) or January (peak labor demand). “Desired increase in NREGS work” is the number of extra days
of work members of the household wanted on NREGS in May. “Is NREGS work available” is an indicator for whether the respondent
believes anyone in the village who wants NREGS work can get it at any time. Standard errors clustered at mandal level in parentheses.
Statistical significance is denoted as: ∗p < 0.10, ∗∗p < 0.05, ∗∗∗p < 0.01
37

Tab
le8:
Ben
efici
ary
opin
ion
sof
Sm
artc
ard
s
NR
EG
SS
SP
Agr
eeD
isag
ree
Neu
tral
/D
on’t
kn
owN
Agr
eeD
isag
ree
Neu
tral
/D
on’t
kn
owN
Positives:
Sm
art
card
sin
crea
sesp
eed
ofp
aym
ents
(les
sw
ait
tim
es)
.78
.03
.19
4891
.82
.06
.12
2245
Wit
ha
Sm
art
card
,I
mak
efe
wer
trip
sto
rece
ive
my
pay
men
ts.6
7.0
4.2
948
68.7
4.0
4.2
222
42
Ih
ave
ab
ette
rch
ance
ofget
tin
gth
em
oney
Iam
owed
by
usi
ng
aS
mart
card
.72
.02
.26
4867
.78
.03
.19
2242
Bec
au
seI
use
aSm
artc
ard
,n
oon
eca
nco
llec
ta
pay
men
ton
my
beh
alf
.72
.04
.24
4865
.76
.05
.20
2238
Negatives:
Itw
asd
ifficu
ltto
enro
llto
ob
tain
aS
mar
tcar
d.2
1.6
0.1
848
77.3
1.5
5.1
322
44I’
mafr
aid
of
losi
ng
my
Sm
artc
ard
and
bei
ng
den
ied
pay
men
t.5
3.1
5.3
247
20.6
2.1
4.2
421
72
Wh
enI
goto
coll
ect
ap
aym
ent,
Iam
afra
idth
at
the
pay
men
tre
ad
erw
ill
not
wor
k.4
9.1
5.3
647
21.5
9.1
6.2
521
71
Iw
ou
ldtr
ust
the
Sm
art
card
syst
emen
ough
tod
epos
itm
on
eyin
my
Sm
artc
ard
acco
unt
.27
.33
.40
4868
.28
.39
.33
2240
Overa
ll:
Do
you
pre
fer
the
smar
tcard
sov
erth
eol
dsy
stem
ofp
aym
ents
?.8
4.0
8.0
850
72.9
1.0
5.0
422
80
This
table
analy
zes
ben
efici
ari
es’
per
cepti
ons
of
the
Sm
art
card
pro
gra
min
trea
tmen
tare
as.
Ben
efici
ari
esin
clude
house
hold
mem
ber
sth
at
work
edin
the
NR
EG
Spro
gra
mor
rece
ived
SSP
ben
efits
.T
hes
eques
tions
wer
eask
edw
hen
ben
efici
ari
eshad
rece
ived
aSm
art
card
and
use
dit
topic
kup
wages
;and
als
oif
they
had
enro
lled
for,
but
not
rece
ived
,a
physi
cal
Sm
art
card
.
38

Table 9: No significant heterogeneity by baseline characteristics
Time to Collect Official Payments Survey Payments Payment lag
(1) (2) (3) (4)
BL GP Mean .025 .00013 .018 .16(.08) (.044) (.066) (.25)
Consumption (Rs. 1,000) -.087 .029 .038 -.01(.16) (.076) (.098) (.027)
Land Value (Rs. 1,000) .0037 .0032 .0024 -.0022(.0038) (.0083) (.011) (.0035)
Own Land 3 -6.7 10 7.3(22) (13) (16) (6.2)
NREGS GP Amount (Rs. 1,000) .015∗∗ .0043 .0016 -.00027(.0073) (.0037) (.0066) (.0013)
NREGS GP Days Worked .0011 .00036 .00029 .000089(.00073) (.00035) (.00055) (.00014)
SC Proportion .6 -11 -8.5 22(48) (20) (21) (14)
BPL Proportion -65 6.1 -29 -29(130) (57) (58) (24)
District FE Yes Yes Yes Yes
Week Fe No No No Yes
Control Mean 112 55 63 34Level Indiv. HHD HHD Indiv-Week
This table shows heterogenous effects on major endline outcomes from GP-level baseline characteristics. Each cell shows the coefficient
on the baseline outcome interacted with the treatment indicator in separate regressions. “Consumption (Rs. 1,000)” is annualized
consumption. “Land Value (Rs. 1,000)” is total land value. “Own Land” is a binary variable of whether household owns land. “NREGS
GP Amount (Rs. 1000)” is total NREGS payment amounts for the period Jan 1, 2010 to July 22, 2010. “NREGS GP Days Worked
(Rs. 1000)” is total NREGS days worked for the period Jan 1, 2010 to July 22, 2010. “SC Proportion” is the proportion of NREGS
workspells performed by schedule caste workers in the period from Jan 1, 2010 to July 22, 2010. “BPL Proportion” is the proportion of
households with a BPL card in the NREGS baseline survey. Total income is trimmed at the top .5% level in both treatment and control
areas. Standard errors are clustered at the mandal level. Statistical significance is denoted as: ∗p < 0.10, ∗∗p < 0.05, ∗∗∗p < 0.01
39

Tab
le10
:N
on-e
xp
erim
enta
ld
ecom
pos
itio
nof
trea
tmen
teff
ects
by
card
edst
atu
s
Tim
eto
coll
ect
Offi
cial
Su
rvey
Lea
kage
Pay
men
tla
g
(1)
(2)
(3)
(4)
(5)
(6)
(7)
(8)
(9)
(10)
Card
edG
P-3
3∗∗∗
7.9
39∗∗
-31∗∗
-6.7
∗∗
(8.2
)(1
3)(1
5)(1
3)(3
.2)
Hav
eS
card
,C
ard
edG
P-3
3∗∗∗
70∗∗
∗13
6∗∗
∗-6
6∗∗
∗-4
(8.5
)(1
6)(2
3)(2
2)(2
.5)
No
Sca
rd,
Card
edG
P-3
2∗∗
∗-4
0∗∗∗
-28
-15
-3.1
(8.6
)(1
4)(1
8)(1
6)(2
.3)
Not
Card
edG
P5
4.9
7.5
1922
46-1
5-2
6-7
.9-6
.7(1
3)(1
3)(1
6)(2
1)(2
2)(2
8)(1
9)(2
4)(5
.4)
(5.2
)
BL
GP
Mea
n.0
71∗
.071
∗.2
8∗∗∗
.2∗∗
.25∗
∗∗.1
.22∗
∗∗.2
8∗∗
∗
(.03
9)(.
039)
(.06
6)(.
085)
(.08
8)(.
1)(.
078)
(.09
4)
Dis
tric
tF
EY
esY
esY
esY
esY
esY
esY
esY
esY
esY
es
Wee
kF
eN
oN
oN
oN
oN
oN
oN
oN
oY
esY
es
Ad
jR
-squ
ared
.10
.10
.04
.06
.06
.10
.04
.05
.14
.13
Contr
olM
ean
112
112
127
127
146
146
-20
-20
3434
N.
of
case
s101
8110
147
5144
4714
5144
4714
5144
4714
1427
914
256
Lev
elIn
div
.In
div
.H
HD
HH
DH
HD
HH
DH
HD
HH
DIn
div
-Wee
kIn
div
-Wee
k
This
table
show
sth
em
ain
ITT
effec
tsdec
om
pose
dby
level
sof
pro
gra
mim
ple
men
tati
on.
“C
ard
edG
P”
isa
gra
mpanch
ayat
that
has
mov
edto
Sm
art
card
base
dpay
men
ts,
whic
h
happ
ens
once
40%
of
ben
efici
ari
eshav
eb
een
issu
eda
card
.“H
ave
SC
ard
,C
ard
edG
P”
and
“N
oSC
ard
,C
ard
edG
P”
are
base
don
whet
her
the
ben
efici
ary
or
house
hold
lives
ina
card
edG
Pand
self
-rep
ort
edre
ceiv
ing
aSm
art
card
(at
least
one
Sm
art
card
inth
ehouse
hold
for
house
hold
-lev
elva
riable
s).
“N
ot
Card
edG
P”
isa
gra
mpanch
ayat
ina
trea
tmen
t
are
ath
at
has
not
yet
mov
edto
Sm
art
card
-base
dpay
men
ts.
Asp
ecifi
cati
on
wit
hth
ebase
line
mea
nis
not
rep
ort
edfo
rth
epay
men
tla
goutc
om
edue
toa
larg
enum
ber
of
mis
sing
base
line
obse
rvati
ons,
whic
hm
akes
dec
om
posi
tion
diffi
cult
.Sta
ndard
erro
rscl
ust
ered
at
mandal
level
inpare
nth
eses
.Sta
tist
ical
signifi
cance
isden
ote
das:
∗p<
0.1
0,∗∗p<
0.0
5,
∗∗∗p<
0.0
1
40

−10
0−
500
5010
015
0T
ime
to C
olle
ct
0 .2 .4 .6 .8 1Percentile of Baseline Time
Control TreatmentDifference 95% Confidence Band
(a) Time to collect−
200
2040
Pay
men
t Lag
0 .2 .4 .6 .8 1Percentile of Baseline Lag
Control TreatmentDifference 95% Confidence Band
(b) Payment Lag
0.1
.2.3
.4.5
.6.7
.8.9
1T
reat
men
t Int
ensi
ty
0 .2 .4 .6 .8 1Percentile of Baseline Time
Treatment Level LPoly of Treat Level
(c) Treatment Intensity - Time to collect
0.1
.2.3
.4.5
.6.7
.8.9
1T
reat
men
t Int
ensi
ty
0 .2 .4 .6 .8 1Percentile of Baseline Lag
Treatment Level LPoly of Treat Level
(d) Treatment Intensity - Payment Lag
Figure A.1: Heterogeneity in Time to collect and Payment LagsPanels (a) and (b) show nonparametric treatment effects by baseline percentile outcome. “Time to Collect” is the average time taken
to collect a payment, including the time spent on unsuccessful trips to payment sites, in minutes. “Payment Lag” is the average lag
(in days) between work done and payment received on NREGS. Panels (c) and (d) show how the intensity of treatment in treatment
areas – measured as the proportion of endline transactions done with carded beneficiaries in carded GPs – varies by baseline percentile
outcome. All lines are fit by a kernel-weighted local polynomial smoothing function with Epanechnikov kernel and probability weights,
with standard errors bootstrapped.
41

−50
050
100
Offi
cial
Am
ount
0 .2 .4 .6 .8 1Percentile of Baseline Official
Control TreatmentDifference 95% Confidence Band
(a) Official−
500
5010
0S
urve
y A
mou
nt
0 .2 .4 .6 .8 1Percentile of Baseline Survey
Control TreatmentDifference 95% Confidence Band
(b) Survey
0.1
.2.3
.4.5
.6.7
.8.9
1T
reat
men
t Int
ensi
ty
0 .2 .4 .6 .8 1Percentile of Baseline Official
Treatment Level LPoly of Treat Level
(c) Treatment Intensity - Official
0.1
.2.3
.4.5
.6.7
.8.9
1T
reat
men
t Int
ensi
ty
0 .2 .4 .6 .8 1Percentile of Baseline Survey
Treatment Level LPoly of Treat Level
(d) Treatment Intensity - Survey
Figure A.2: Heterogeneity in Official and Survey PaymentsPanels (a) and (b) show nonparametric treatment effects by baseline percentile outcomes. “Official” refers to amounts paid as listed in
official muster records, while “survey” refers to payments received as reported by beneficiaries, both during study periods (baseline in
2010 - May 31 to July 4; endline in 2012 - May 28 to July 15). Panels (c) and (d) show how the intensity of treatment in treatment
areas – measured as the proportion of endline transactions done with carded beneficiaries in carded GPs – varies by baseline percentile
outcome. All lines are fit by a kernel-weighted local polynomial smoothing function with Epanechnikov kernel and probability weights,
with standard errors bootstrapped.
42

Table A.1: No differential attrition
(a) NREGS
(1)Attriters from
(2)Entrants in
Baseline Endline
Control .024 .059Treatment .013 .061p-value .22 .79
(b) SSP
(1)Attriters from
(2)Entrants in
Baseline Endline
Control .097 .16Treatment .097 .17p-value .95 .36
These tables compare the entire NREGS sample frame – i.e., all jobcard holders – and the entire SSP beneficiary frame across treatment
and control mandals. Column 1 presents the proportion of NREGS jobcards and SSP beneficiaries that dropped out of the sample
frame after baseline, while column 2 presents the proportion that entered the sample frame at endline. Row 3 reports the p-value of
the difference between treatment and control.
43

Tab
leA
.2:
No
com
pos
itio
nal
chan
ges
(a)
NR
EG
S
(1)
(2)
(3)
(4)
(5)
(6)
(7)
(8)
N.
of
Mem
ber
sH
indu
SC
Any
HH
DM
emR
ead
sB
PL
Tot
alC
onsu
mp
Tot
alIn
com
eO
wn
Lan
d
Tre
atm
ent
.045
-.02
6.0
23-.
031
-.00
1739
570
10∗
.06∗
∗
(.11)
(.01
8)(.
022)
(.02
7)(.
022)
(467
6)(3
772)
(.02
4)
El
Entr
ants
-.16
.011
.029
.064
.067
-107
34-3
259
-.05
4(.
25)
(.04
7)(.
077)
(.04
9)(.
043)
(685
2)(1
0397
)(.
12)
Tre
at*E
lE
ntr
ants
.14
-.02
9-.
077
-.08
9-.
0545
0617
303
.06
(.34)
(.05
8)(.
089)
(.07
1)(.
058)
(906
8)(1
4190
)(.
14)
Dis
tric
tF
EY
esY
esY
esY
esY
esY
esY
esY
es
Ad
jR
-squ
are
d.0
2.0
7.0
2.0
1.0
1.0
1.0
4.0
1C
ontr
olM
ean
4.3
.93
.19
.85
.89
9031
769
708
.59
N.
ofca
ses
4944
4944
4944
4904
4922
4937
4910
4920
Lev
elH
HD
HH
DH
HD
HH
DH
HD
HH
DH
HD
HH
D
(b)
SSP
(1)
(2)
(3)
(4)
(5)
(6)
(7)
(8)
N.
of
Mem
ber
sH
indu
SC
Any
HH
DM
emR
ead
sB
PL
Tot
alC
onsu
mp
Tot
alIn
com
eO
wn
Lan
d
Tre
atm
ent
-.015
.019
-.02
5-.
048∗
.001
2-1
614
4459
.004
3(.
12)
(.02
1)(.
021)
(.02
7)(.
018)
(400
1)(4
003)
(.03
2)
El
Entr
ants
-.03
4.0
076
-.07
9∗∗
-.01
7.0
78∗∗
∗-1
573
-142
2.0
99∗
(.27
)(.
042)
(.03
4)(.
044)
(.02
6)(4
029)
(457
7)(.
056)
Tre
at*E
lE
ntr
ants
-.08
-.00
1.0
49.0
67-.
053
7490
5893
-.05
3(.
3)
(.04
6)(.
04)
(.05
4)(.
033)
(555
5)(5
666)
(.06
7)
Dis
tric
tF
EY
esY
esY
esY
esY
esY
esY
esY
es
Ad
jR
-squ
are
d.0
5.0
4.0
2.0
2.0
1.0
2.0
7.0
2C
ontr
olM
ean
3.5
.89
.21
.64
.87
6379
252
763
.52
N.
ofca
ses
3168
3168
3168
3128
3147
3166
3153
3158
Lev
elH
HD
HH
DH
HD
HH
DH
HD
HH
DH
HD
HH
D
Thes
eta
ble
ssh
owth
at
new
entr
ants
toth
eN
RE
GS
and
SSP
sam
ple
fram
esare
no
diff
eren
tacr
oss
trea
tmen
tand
contr
ol
gro
ups.
“E
LE
ntr
ants
”is
an
indic
ato
rfo
ra
house
hold
that
ente
red
the
sam
ple
fram
efo
rth
een
dline
surv
eybut
was
not
inth
ebase
line
sam
ple
fram
e.“T
reat*
EL
Entr
ants
”is
the
inte
ract
ion
bet
wee
nth
etr
eatm
ent
indic
ato
rand
the
endline
entr
ant
indic
ato
r,and
the
coeffi
cien
tof
inte
rest
inth
ese
regre
ssio
ns.
“N
.of
Mem
ber
s”is
the
num
ber
of
house
hold
mem
ber
s.“H
indu”
isan
indic
ato
rfo
rth
ehouse
hold
bel
ongin
gto
the
hin
du
religio
n.
“SC
”is
an
indic
ato
rfo
rth
ehouse
hold
bel
ongin
gto
a“Sch
edule
dC
ast
e”(h
isto
rica
lly
dis
crim
inate
d-a
gain
stca
ste)
.“A
ny
HH
DM
emR
eads”
is
apro
xy
for
lite
racy
.“B
PL
”is
an
indic
ato
rfo
rth
ehouse
hold
bei
ng
bel
owth
ep
over
tyline.
“T
ota
lC
onsu
mp”
isto
tal
consu
mpti
on.
“O
wn
land”
isan
indic
ato
rfo
rw
het
her
the
house
hold
owns
any
land.
44

Table A.3: Baseline covariates do not predict program implementation
Carded GP Intensity
(1) (2) (3) (4)
Time to Collect (1 hr) -.015 -.018 .00066 -.0068(.018) (.014) (.013) (.01)
Official Amount (Rs. 10,000) -1 -.32 -.59 -.095(1.9) (1.7) (1.4) (1.2)
Survey Amount (Rs. 10,000) -1.4 -1 -.89 -.26(2.2) (1.7) (1.6) (1.3)
Total Income (Rs. 10,000) -.014 -.018∗∗ .00048 -.0098(.013) (.0086) (.011) (.0067)
District FE No Yes No Yes
Adj R-squared .02 .26 .00 .39N. of cases 631 631 631 631
This tables analyzes the effects of baseline covariate variability on endline program implementation in treatment areas. “Carded GP”
is a gram panchayat that has moved to Smartcard based payment, which happens once 40% of beneficiaries have been issued a card.
“Treatment intensity” is the proportion of transactions done with carded beneficiaries in carded GPs. Standard errors clustered at
mandal level in parentheses. Statistical significance is denoted as: ∗p < 0.10, ∗∗p < 0.05, ∗∗∗p < 0.01
Table A.4: NREGS earnings: survey and official (scaled)
Official Survey Leakage
(1) (2) (3) (4) (5) (6)
Treatment 9.6 2.5 33 32 -23 -28(25) (24) (21) (20) (21) (20)
BL GP Mean .16∗∗∗ .1∗∗∗ .13∗∗∗
(.025) (.037) (.033)
District FE Yes Yes Yes Yes Yes Yes
Adj R-squared .03 .05 .06 .07 .06 .07Control Mean 260 260 180 180 80 80N. of cases 5180 5144 5180 5144 5180 5144
Each observation refers to household-level average weekly amounts for NREGS work done during the study period (baseline in 2010 -
May 31 to July 4; endline in 2012 - May 28 to July 15). The regressions include all sampled beneficiaries who were a) found by survey
team to match official record or b) listed in official records but confirmed as “ghost” beneficiary as described in Table 5. “Official”
refers to amounts paid as listed in official muster records, scaled by the average number of jobcards per household in the district.
“Survey” refers to payments received as reported by beneficiaries. “Leakage” is the difference between these two amounts. Standard
errors clustered at mandal level in parentheses. Statistical significance is denoted as: ∗p < 0.10, ∗∗p < 0.05, ∗∗∗p < 0.01
45

Tab
leA
.5:
Pro
por
tion
alin
crea
ses
inw
orke
rsat
wor
ksi
teau
dit
s
WS
MS
urv
eyO
ffici
alM
ust
er-
WS
MS
urv
ey-
WS
M
(1)
(2)
(3)
(4)
(5)
(6)
(7)
(8)
(9)
(10)
Tre
atm
ent
1210
6943
2617
146.
757
33(1
2)(1
0)(4
9)(3
6)(2
7)(2
0)(2
0)(1
7)(4
4)(3
5)
Dis
tric
tF
EY
esY
esY
esY
esY
esY
esY
esY
esY
esY
es
Wee
kF
eN
oY
esN
oY
esN
oY
esN
oY
esN
oY
es
Ad
jR
-squ
are
d.0
9.1
3.0
3.0
9.0
7.1
6.0
9.1
4.0
2.0
7C
ontr
ol
Mea
n28
2817
317
310
810
881
8114
514
5N
.of
case
s51
351
351
351
351
351
351
351
351
351
3
Unit
sre
pre
sent
esti
mate
dnum
ber
of
NR
EG
Sw
ork
ers
on
agiv
enday
.T
he
“W
SM
”num
ber
sare
the
num
ber
of
work
ers
found
inan
indep
enden
taudit
of
NR
EG
Aw
ork
site
sin
aG
P.
The
“Surv
ey”
vari
able
isth
ees
tim
ate
dnum
ber
of
work
ers
we
exp
ecte
dto
find
at
thes
ew
ork
site
sfr
om
house
hold
surv
eydata
when
we
take
into
acc
ount
the
num
ber
of
work
site
sin
aG
Pand
the
aver
age
rep
ort
edw
ork
ing
hours
for
ben
efici
ari
es.
“O
ffici
al”
isth
issa
me
esti
mate
for
adm
inis
trati
ve
data
.Sta
ndard
erro
rscl
ust
ered
at
mandal
level
in
pare
nth
eses
.Sta
tist
ical
signifi
cance
isden
ote
das:
∗p<
0.1
0,∗∗p<
0.0
5,∗∗
∗p<
0.0
1
46

Table A.6: No evidence of Hawthorne effects
WSM Official Survey
(1) (2) (3) (4) (5) (6)
HHD Survey in GP -3.4 10 -4.8(8) (34) (33)
WSM in GP 7.5 -13 3 -17 113(31) (28) (42) (37) (106)
WSM Survey in Week -52 -71 -31 -39 34(51) (52) (39) (39) (84)
Recon Survey in Week 12 -.8 45 40 45(69) (68) (52) (51) (89)
District FE Yes Yes Yes Yes Yes Yes
Week Fe Yes Yes Yes Yes Yes Yes
BL GP Value No No Yes No Yes Yes
GP Size FE No Yes Yes No No No
Adj R-squared .17Control Mean 48 758 758 755 755 1170Level Week Week Week Week Week WeekSample WSM All All HHD & WSM HHD & WSM HHDN. of cases 682 52311 52311 7728 7728 6153
This table analyzes possible Hawthorne effects from the assorted treatment arms. Each cell represents a separate regression of the
effect on the data source (column) from the survey type (row). Units are number of days worked in a GP per week. “HHD Survey in
GP” is the being surveyed by the household survey. “WSM in GP” is being surveyed by the work site audit. Control mean represents
the area with no survey. “WSM Survey in Week” is whether the work site audit happened in that specific week. “Recon Survey in
week” is whether an enumerator to map the worksites in that specific week. Sample of “All” refers to all GPs in our study districts.
Standard errors clustered at mandal level in parentheses. Statistical significance is denoted as: ∗p < 0.10, ∗∗p < 0.05, ∗∗∗p < 0.01
47


![Report on Smartcards- Final Draft 31October2012[1]](https://img.dokumen.tips/doc/110x75/577ce4ae1a28abf1038ee992/report-on-smartcards-final-draft-31october20121.jpg)


