Embed Size (px)
Citation preview
1
Paying for Urbanization in China: Challenges of Municipal Finance in the 21st Century
Christine Wong
Revised draft: August, 2012
Paper prepared for R Bahl, J Linn and D Wetzel, Editors, Metropolitan Government Finances in
Developing Countries. Cambridge, MA. Lincoln Institute for Land Policy.
I. Introduction
China is urbanizing, and the pace is accelerating. The National Bureau of Statistics reported a
population of 1.34 billion at year end 2010, fully half of them living in cities.1 Rapid urbanization is a
recent phenomenon that was unleashed by the country’s transition to a market economy (Figure A).
Starting in the early 1980s, the dismantling of agricultural collectives freed rural labor to leave the
land. Since then, rural-urban migration has steadily accelerated as government restrictions on
population movement were eased, and plenty of jobs were created in cities by economic growth
that has averaged more than 12 per cent per annum in real terms since 1990.
[Figure A]
The scale of China’s urban transformation is unprecedented in human history: during the 1980s,
urban population grew by 110 million. This accelerated to 157 million during the 1990s, and 210
million during the first decade of the 21st century. Nationwide, the current urban population of 670
million is more than three times that in 1980 – an increase of 480 million in just thirty years. The
population of metropolitan Shanghai, China’s largest city, grew from 16 million to 23 million
between the 2000 and 2010 censuses, a 44 percent increase.2 During 2008-2011 alone, Beijing
reportedly absorbed 500,000 new people each year.3
Providing infrastructure and public services to accommodate urbanization of this scale and pace
presents a gargantuan task that would strain any government. In China, the challenge was all the
more daunting as the on-going process of transition from a planned economy to a market economy
was transforming virtually all aspects of social and economic organization, and brought a
catastrophic collapse in the government’s revenue mechanisms that caused the budget to plunge
1 Chinese Statistical Yearbook 2011.
2 Shanghai Statistical Yearbook 2011.
3 Standard Chartered (2012).
2
from one-third of GDP in 1978 to a nadir of 11 percent before a new tax system began to restore
fiscal health from the late 1990s onward (World Bank 2002, Wong and Bird 2008). The upturn in
urbanization thus began in a difficult fiscal environment that worsened through the first two
decades. The financial mechanisms and strategies for Chinese municipalities were forged in this
harsh environment.
Despite the inauspicious start, China’s spectacular economic growth performance over this period
seems to provide prima facie evidence that the government has managed the urbanization process
well enough. New cities have cropped up – the latest count shows 657 cities and nearly 20,000
towns, compared with 233 cities and 2600 towns 30 years ago. Existing cities have expanded. City
centers have been renovated and modernized, infrastructure built, and urban facilities appear to be
keeping up with demand. Visitors to China typically fly into world-class airports and are whisked
into town on multi-lane expressways. The cities are, even modest county towns, crisscrossed by
wide boulevards, and Chinese cities are setting world records in the pace at which subway lines are
being built.4
In fact, a good deal of evidence points to an outstanding performance in providing growth-
supporting infrastructural investments during this period. In 2010, for example, China was ranked
27th among 155 countries in the World Bank Logistics Performance Index (LPI), a measure of a
country’s efficiency in moving goods to and from international markets. With an overall LPI score of
3.49, China is approaching the average of 3.55 for High Income Countries, substantially
outperforming its peer group of lower middle income countries (Table 1).
[Table 1]
The picture is more mixed on the provision of services. A 2006 survey of 5000 households in five
cities found citizens generally pleased with urban public services, but worried about their high costs,
with basic education per child taking up 10 percent of household income, and per capita out-of-
pocket payments for health care another 10 percent. The survey also found the provision and
pricing of services to be highly regressive, with lower income households receiving poorer quality
services but paying significantly higher shares of household income for them (Brixi 2009).
How cities finance services for their growing populations and provide infrastructure for supporting
the expanding economic base have an important impact on the nation’s economic growth and
wellbeing. Yet, surprisingly little is known about the finances of Chinese cities, or indeed, how
municipalities have fared in the reforms of the economic system and public finances. There has
4 National Development and Reform Commission and World Bank (2010).

3
been no study of municipal finance in China since 2000,5 although there is a small literature on urban
infrastructure finance and, more recently, the role of land as a source of finance.6
In the large and vibrant literature on fiscal reform, the focus is overwhelmingly on central-local fiscal
relations and the problems of rural public finance.7 This lack of concern for municipal finance
problems is best illustrated by the excellent two-volume comprehensive treatment of the Chinese
fiscal system written by senior officials in the Ministry of Finance (Li 2006, 2010). In 648 pages, the
topic of urbanization is written up as a box (taking up three-quarters of a page), in which the
implications for public finance merited one sentence: “Following the acceleration of urbanization,
government spending in the areas of public services and public basic infrastructure will increase
significantly.”8 This omission is all the more striking since under China’s decentralized fiscal system,
the burden of financing this urban growth has been borne almost entirely by municipal governments.
This paper attempts to fill this lacuna in the literature. The goal of the paper is to describe and
analyze the financing of public services and infrastructure in municipalities in China. Examining the
practices of the past two decades, I will show that municipal finance has evolved to rely
overwhelmingly on extra-budgetary resources and borrowing, under a policy regime of benign
neglect. The formal system of public finance in China has made few accommodations to the needs
of municipal finance. Except for a few favored cities in the rich coastal provinces, the formal system
does not provide sufficient resources for cities to meet their responsibilities in service provision.
Moreover, municipalities are prohibited from borrowing even for capital expenditures, making it
difficult to finance infrastructure. Yet, the remarkable growth and development of cities has
proceeded because political leaders have been willing to tolerate a plethora of informal, backdoor
solutions that enabled cities both to obtain the resources needed and also limit eligibility to benefits.
We turn next to a brief discussion of China’s urbanization trends and the administrative structure of
Chinese cities in Section II. Discussion of municipal finance will start in Section III with evolution of
the formal fiscal system, and continue in Section IV with the extra-budgetary components.
Financing of urban infrastructure and the emergence of local investment corporations are discussed
in Section V. Section VI concludes with an analysis of the current system of municipal finance, noting
both the achievements and accumulated macroeconomic risks of the strategy, and the adverse
effects on welfare and distribution.
5 Asian Development Bank (2000), and Wong (1997).
6 On infrastructure, see Wu (2010, 2011), Mikesell et al (2011), Honohan (2008), Gao (2007), and Su and Zhao
(2007). On land, see Cao et al (2008), Tao et al (2010), and Guan and Peng (2011). 7 World Bank (2002, 2007a, 2007b), Wong passim, and Bahl (2011).
8 Li (2010), Box 3-4, p. 119.

4
II. Background and context
A. Urbanizing China
In low income countries, industrialization and economic growth are normally synonymous with
urbanization, as labor is shifted out of agriculture. During the first decade of the People’s Republic,
China conformed to this “empirical regularity” – as economic growth accelerated through the 1950s,
people flooded into cities in search of higher paying jobs in the new factories. Urban population
grew by 69 million from 1950 to 1960, when the urbanization rate rose from 11.2% to 19.7%. This
relationship was decisively broken in the early 1960s, though, when government policy turned anti-
urban.
It began from the failure of the Great Leap Forward, when the ambitious drive to reorganize
agriculture in people’s communes and produce steel from backyard furnaces collapsed and
economic crisis ensued. To alleviate food shortages in the cities, the government forcibly returned
millions of newly arrived migrants to their home villages in the early 1960s. In the wake of this
traumatic episode, free population movements were abolished. A household registration (hukou)
system that had been established in the 1950s was called into service. Through state control of
grain and other key consumer goods and limiting rationing to those with urban hukou, the
government was able to limit urban population growth.9 For two decades thereafter, migration was
strictly controlled, and industrialization continued without urbanization. During this period, urban
growth stemmed only from natural population growth, minus an exodus of some 10-15 million
youths who were sent to the villages for “re-education”.10 Even as industry grew from 28 percent of
GDP in 1962 to 44 percent in 1980, the share of population in urban areas remained below 20
percent (Table 2).
[Table 2]
Against this background, the recent rapid urbanization can be seen partly as a catching up process.
Since the 1990s urban population growth has outstripped total population growth, and the shift
from rural to urban will continue even as China’s total population growth is slowing (Figure B). Even
at 50 percent, China is “under-urbanized” – most countries at its income level have higher
proportions of their population living in cities (Henderson 2009).
[Figure B]
9 See Zhang (1983) on the workings of the hukou system. I thank Andrew Watson for sharing this reference.
10 See Bernstein (1977).

5
B. The administrative hierarchy of urban local governments in China
China’s intergovernmental fiscal system makes no distinction between urban and rural governments,
and the assignment of revenues and expenditures is strictly according to their rank in the
administrative hierarchy. Under this set-up, the provincial capitals – the super metropolises – do
not receive any transfers or revenue-raising powers that other prefectural level cities do not receive.
The only concession to size is that on a few taxes, such as the Urban Maintenance and Construction
Tax, larger cities are permitted a specified, higher rate than smaller ones.
China is organized in an administrative structure with five levels of government. Under the central
government there are about 44,000 subnational governments divided into four levels, nearly two-
thirds of which are urban local governments. Figures for year-end 2010 showed that the first level
of subnational government (SNG) comprises 22 provinces and 5 autonomous regions organized for
ethnic minorities, as well as four municipalities with provincial status -- Beijing, Shanghai, Tianjin and
Chongqing. At the next level were 333 prefectural units, of which 50 were prefectures and 283 were
cities. The fourth tier had 2856 units, including 1578 counties, 370 county-level cities and 853 urban
districts under the jurisdiction of prefectural level cities. The bottom tier had 40,906 units that
included 14,571 townships; 19,410 towns, and 6923 urban “street offices” under the jurisdiction of
county level cities. This structure is presented in Figure C.11
[Figure C]
China has more than 27 thousand urban local governments (ULGs). Their distribution across the
subnational levels is presented in Table 3, where I have added a category of “provincial capital cities
and line item cities”.12 This category comprises 31 cities that have prefectural rank, are larger and
more prosperous, and fifteen of them have been informally given “deputy provincial level” status.
Overall, the size distribution of cities is heavily concentrated at the low end, with nearly 40 percent
of the urban population living in small county level cities and towns of perhaps 20,000 to 2-300,000.
Some analysts have argued that Chinese cities are too small to take advantage of the agglomeration
economies of urbanization (Henderson 2009, Chan et al 2008). Table 4 presents the growth of ULGs
by rank for the period 1981 – 2010.
[Table 3] [Table 4]
11
In Figure C, districts and street offices are omitted because their populations are already included in the cities to which they are subordinated.
12 “Line item cities” was a category created in the late 1980s, to confer a higher status on 14 cities destined for
faster growth, to give them more direct access to central government resources without giving them full provincial status. After the Tax Sharing System reform in 1994, as a concession to the provinces, the number of line item cities was reduced to 5. They are Dalian, Qingdao, Ningbo, Xiamen and Shenzhen.
6
C. A Caveat on population data and city size13
The 2000 population census was the first time the government collected nationwide information on
migrants and including them in the urban population counts, alongside the registered, hukou
population. Before that, all population was reported by birth place regardless of where they were
living at the time of the reporting (Chan 2003). As a result, reported population trends did not
reflect the momentous geographic shifts that had begun nearly two decades earlier. Other,
subsequent changes gradually brought the Chinese reporting methodology for urban population
closer to international norms.14
While the national data are improving, however, there is a tremendous amount of confusion in the
citation of city-level statistics. This is partly due to Chinese terminology, which uses “shi” --
municipality, to refer interchangeably either to an administrative unit or a city, and the size
difference is often huge. For example, the provincial level municipality Chongqing has 21 rural
counties, in addition to the municipal core. The whole administrative unit has a population of 33
million, only half of whom live in the urban, built-up core. Mistaking the two has led more than one
Western reporter to proclaim Chongqing as the largest city in China – and indeed the world.15
Claims of China having hundreds of million-plus cities are likewise based on mistaking the
administrative regions for municipalities. In Hebei province, the urbanization rate averages only 17
percent among its 11 prefectural level units, so that the municipalities are just one-sixth the size of
the administrative regions.16
Aside from the confusing terminology, city level population data are “muddied” by the continued
use of hukou population by many city officials, in contravention of the NBS’s call, since 2001, to use
actual population.17 Their motivation is simple: under pressure to boost per capita GDP and growth
performance, it is tempting to use a lower population in the denominator.18 The NBS appears to lack
the clout to enforce reporting standards at the subnational levels, and contributes to the chaos by
publishing conflicting population numbers.19 Even though the subnational bureaus work under the
13
I am indebted to Kam Wing Chan for explaining some of the intricacies of population reporting. 14
See Chan (2009) and Kamal-Chaouli et al. (2009). 15
See, for example, Eugene Robinson in Washington Post, http://www.washingtonpost.com/opinions/china-faces-a-series-of-daunting-internal-challenges/2011/12/05/gIQAYx6qXO_story.html (accessed 12/17/11).
16 CCSY 2010.
17 See CCSY 2001.
18 In 2000, for example, Shenzhen’s per capita GDP was 133,305 yuan if counting only hukou population, but
23,759 yuan based on actual population. Chan (2009) has found many instances of cities using lower than actual population figures, and warns that “..while national urban population figures are broadly accurate, individual city population numbers remain a statistical minefield” (pp. 25-26).
19 For example, the population of Beijing was reported in the CSY 2010 as 17.55 and 14.92m in 2009 for the
administrative region and city proper, respectively. In the CCSY 2010, also published by the NBS but based on city-level reporting, they were reported as 12.46 and 11.75m, respectively.

7
guidance of the NBS, they are funded by SNGs at the same level, and are required to report to local
government before submitting their data upward through the statistical system.20
III. Municipal finance – the fiscal system
It is difficult to do a comprehensive study of municipal finance in China with information that is
currently available to the public. One reason is that at the national level, the Chinese statistical
system does not distinguish between urban and rural regions. For public finance, for example, the
data is disaggregated by administrative level, and we cannot separate out prefectural level cities
from rural prefectures, nor the city districts from their rural counties. More importantly, at present
Chinese cities are reliant on extra-budgetary revenues for the bulk of their financing needs, and until
recently little public information was available on these resources. In this and the next section, our
approach is to identify the components of finance available to municipal governments, assembling
available information to analyse their structure and incentives, and draw some insights on how they
work together.
To understand how municipalities are financed, we start with three stylized facts. First, China
assigns most expenditures to SNGs– municipal governments are responsible for providing and
financing all vital services and infrastructure. Second, the intergovernment fiscal system is weak,
and is characterized by large vertical fiscal gaps at subnational levels, as well as large horizontal
disparities. Third, to ensure that the economy continues to grow, the government has tolerated
backdoor practices to permit SNGs to obtain the resources needed to finance expenditure
responsibilities assigned by the IFS.
A. The Decentralized Fiscal System
In terms of budgetary expenditure shares, China is one of the most decentralized countries in the
world. In 2009, the central government accounted for just 20 per cent of national budgetary
expenditures. The rest were distributed among the four levels of subnational governments: 18 per
cent at the provincial level, 22 per cent at the municipal (or prefectural) level, and 40 per cent at the
county level.21 These high expenditure shares are caused by the assignment of many costly and vital
responsibilities to lower level governments. Under the current intergovernmental assignments, it is
the county level that is responsible for the provision of basic education, which, under Chinese law, is
20
Schreyer and Holz (2005) provide a good summary of the Chinese statistical system and the problems of reform.
21 Over the past decade the government has moved all major expenditure responsibilities upward from the
township to the county level, including basic education, health and social welfare. As a result, the township is no longer a significant level for budgetary purposes. For most purposes, it is more useful to aggregate county and township figures, as is done here.

8
compulsory and free-of-charge for the first nine years. Counties are also responsible for the
delivery of basic health care. Most unusually, governments at the prefectural and county levels are
responsible for income maintenance functions: pensions, unemployment insurance, and social
welfare. This is shown in Table 5, where the counties accounted for a majority of the total national
expenditures on education and health, and municipal and county levels for the bulk of subsidies to
social security in 2007. They are also responsible for the majority of capital spending on the budget.
[Table 5]
These assignments were set in the 1980s, when fiscal decline had led to a series of reforms that
decentralized the financing responsibilities to local governments. The assignments have remained
largely unchanged in the intervening decades even as reforms were bringing large shifts in the
composition of expenditures and recentralizing revenues to move more than 50 percent to the
central government (Wong 1991, 2009). As a result, SNGs, both urban and rural, have faced large
fiscal gaps.
B. What do cities do? Growing responsibilities and an unresponsive fiscal system
What cities do has changed dramatically since the late 1970s. Under the planned economy,
economic development was the primary task, and the focus was on state-owned enterprises (SOEs)
in industry. Data assembled for 1978 show that expenditures on economic development accounted
for nearly 60 percent of SNG budgets, when capital construction, working capital, technological
upgrading, geological prospecting, and the running costs of the departments of industry, transport,
commerce, and agriculture are added together. Of these, the vast majority went to supporting SOEs.
Through the transition, as SOEs were gradually weaned from budgetary support, direct expenditures
on them declined. For a time, subsidies ballooned, absorbing 30 percent of total expenditures by
the late 1980s as government attempted to buffer both enterprises and households from the pain of
price reform. Moreover, market reform led to competition and price adjustments that pushed many
SOEs into financial difficulty and required loss subsidies – the same process that was causing the
steep fiscal decline. As these burdens gradually receded, more resources were shifted to financing
the day-to-day administration of government and providing public services.
The changing composition of local budgetary expenditures is shown in Table 6. The shares of SOE
and development expenditures have declined substantially and social expenditures risen, as
expected. However, development remains large – even in 2010 more than one-third of total
expenditures, reflecting the growth- and investment-driven orientation of the Chinese economy and
local governments.

9
[Table 6]
During the 1980s-1990s, the transition of the economy brought extraordinary pressure on municipal
budgets. First, the on-going fiscal decline had cut budgetary resources available to SNGs, from 18
percent of GDP in 1978 to 13 percent in 1988, and to 8 percent in 1995 (Wong 2009). Cities were
hard-hit as financial strains on SOEs translated into tax arrears and defaults in payment to suppliers
and even workers.
In the meantime, the burdens of social expenditures increased, as market reforms necessitated a
wholesale revamping of how social security was provided. Under the policy of full employment (job
assignments) and life-time tenure for workers, SOEs and collectively owned enterprises had
provided jobs and social welfare. The pension systems were funded by the enterprises on a pay-as-
you-go basis, with generous benefits – retirement at 55-60 years of age, and pensions set at 70-75
percent of the final wage and indexed to current wage levels (World Bank 1997). As reforms
separated enterprises from government budgets, and as SOEs declined, the social security provisions
quickly disintegrated. Many of the obligations were transferred onto municipal budgets, and new
social welfare programs had to be set up to take their place. For municipal governments, these
changes coincided with accelerating urbanization that brought ever more people into cities for
whom infrastructure and services had to be provided.
Yet, the intergovernmental fiscal system seemed to take no notice of the plight of municipal
governments. In the public discourse leading up to the Tax Sharing System reform in 1994, no
mention was made of municipal finance. All attention was focused on how to revive revenue
collections, and especially on regaining central government control over the budget. The reform
that was implemented revamped the tax system and tax administration, introducing a value-added
tax on manufactured products and a business tax on services. It created a new central tax service to
collect central and shared taxes. The reform also fundamentally changed revenue-sharing with
SNGsand clawed back revenues to the center. In the process, the reform ignored the changing
expenditure needs of local governments, urban and rural alike (Wong passim, World Bank 2002).22
Nor did the reform give SNGs any revenue autonomy, with all authority for tax policy retained at the
center.
Moreover, through the period of declining budgetary resources, the central government’s capacity
and willingness to aid poor regions withered. During the years 1994-1997, intergovernment
22
Public services in the rural sector had been provided by the people’s communes under the planned economy. When communes were disbanded in the early 1980s, these services were in most localities left with neither an organizational nor financial framework, and coverage was severely eroded through the 1990s (see World Bank 2002, Wong 2007).

10
transfers fell to less than 1 percent of GDP nationwide. As a result, SNGs were essentially left on
their own in financing their expenditure responsibilities and both vertical and horizontal disparities
in service provision widened (Wong and Bird 2008, Wong 2009).
C. Revenue assignment under the formal fiscal system
Under the Tax Sharing System (TSS) introduced in 1994, taxes are divided into central taxes, shared
taxes and “local” taxes. The initial intent of the TSS was to move away from the negotiated sharing
of general revenues under the previous system, to one where revenues would be divided by tax
assignment. Only a limited number of taxes would be shared, with uniform sharing rates across
regions.23 At present there are four: the value-added tax (VAT), the corporate income tax (CIT), the
personal income tax (PIT) and the securities trading tax. The broad outline of current assignment of
taxes is presented in Table 7.
[Table 7]
However, the simplicity and objectivity intended in the TSS applies only at the central – provincial
division; at lower levels the system is far more complex and murky. This is because the TSS only
specified how taxes would be divided between the central and “local” governments, and left it to the
provinces to further divide among the four levels of subnational government.24 Given that SNGshave
no authority to introduce new taxes or change the bases or rates of taxes, and with only a few
revenue-rich taxes available, the system evolved to one where local taxes are extensively shared
among subnational governments.
Under the principal of territoriality, the province has little direct claim to taxes except through its
authority, conferred by national policy, to set revenue-sharing rules with subprovincial governments.
Provinces have exercised this authority to levy a “tax” on local taxes, taking significant shares of the
main taxes. Arrangements differ across provinces; a sample of sharing rates is presented in Table 8.
[Table 8]
At the next lower tier, prefectures can likewise take a share of the local taxes accruing to counties.
Some examples from Liaoning are offered in Table 9. In recent years, to help improve the fiscal
status of counties, the government has called for removing prefectures from this hierarchical flow,
under the policy of “provinces directly managing counties” (shenguanxian). Under the policy, now
23
See, for examples, World Bank (2002), Wong and Bird (2008), Li (2006, 2010).
24 The Chinese administrative system works as a nested hierarchy, in which each level of government interacts
with only the next level up or down. The central government directs only the provincial governments, and provincial governments report to the central government above and directs the prefectural level below, and so on down the hierarchy. For some implications of this set-up, see Wong (2009, 2011c).
11
implemented in more than two-thirds of the provinces, counties would receive the same shares as
applied previously to prefectures in all the provinces listed in Table 8.
[Table 9]
The composition of revenues is shown in Table 10 for different levels of government. Nationally the
value-added tax (VAT), applied to manufacturing, repair and assembly activities, is the most
important tax, accounting for 40 percent of total tax revenues. For SNGs it is the business tax (BT)
levied on services that is the most important, producing one-third of tax revenues in aggregate. The
Urban Maintenance and Construction Tax (UMCT), levied as a surcharge on the VAT and BT, is an
important source of funding that is earmarked for use in building and maintenance of urban facilities,
and accounts for 8 percent of tax revenues in prefectures and 7 percent in counties. Because of the
extensive sharing of the main taxes among subnational levels, the same six top the list of revenue
sources for the province, prefecture and county levels. The similarities in revenue composition are
especially striking at the prefectural and county levels.
[Table 10]
Taxes on land and real estate have grown increasingly important in Chinese cities. The deed tax, an
ad valorem levy on turnover of land and property, is the fourth most productive tax at the
prefectural and county levels. Along with the property tax, the land value-added tax, and urban land
use tax, the four taxes levied on land and real estate produced 17 percent of tax revenues at the
prefectural level and 16 percent at the county level in 2007. The share of land-based taxes has
grown even faster in recent years amidst the booming land and real estate markets.
This tax structure encourages a strong growth-orientation in SNGs given that the bulk of revenues
come from productive activities, and lacking taxing powers, the only way to increase local revenues
is through economic growth. With the growth of land-related taxes, real estate development has
come to rival industrialization as the growth targeted by local officials. Even with vigorous local
economic growth, though, SNGs at the lower tiers are fighting an uphill battle in this top-down
intergovernmental fiscal system.
National aggregate statistics show municipalities to have fared poorly in revenue-sharing. Taking the
prefectural level as a proxy (where more than 50 percent of the urban population reside), the fiscal
trends in Table 11 show municipalities losing significant shares in both budgetary revenues and
expenditures after the 1994 reform. Collectively, these municipalities had less than half of their
share of national revenue in 2009 compared to 1993. Although grants from higher level
governments have become a significant revenue source since 1993, the municipalities’ share of

12
national expenditures (after transfers) had fallen by one-quarter, while their share of the national
population has more than doubled.
[Table 11]
IV. Going outside the budget
Faced with growing expenditure needs and inadequate resources from the formal fiscal system,
SNGs turned to extra-budgetary channels. Indeed, SNGs and government agencies were
encouraged to find their own supplementary sources of revenue since the gradualist, incremental
reform aimed to avoid creating pockets of resistance, and instead implemented across-the-board
cuts that affected even core services (Wong 2009). In the late 1990s public service providers,
including schools providing basic education, received on average only one-half of their operating
revenues from the budget, and had to find the rest through fees and “other incomes.”25 Even local
police departments typically received only budgetary support for salaries, and had to buy their
uniforms, batons and other equipment from revenues collected through fines and penalties (Bai
2004).
A. Extrabudgetary revenues from fees and levies
The first recourse for government departments and public service providers was to levy fees, user
charges, fines and penalties, under incentives that allowed the collecting agencies to use a part of
the receipts for bonuses and topping-up salaries (World Bank 2005, Wong 2009). With these high
powered incentives, fees and other levies proliferated. In the aggregate, revenues from fees and
levies totaled 8-10 percent of GDP in the late 1990s. SNGs were reportedly financing half or more of
their expenditures from extra-budgetary funds, and the proliferation of fees had become a bane of
businesses and citizens alike (Fan 1998, and Wong 1998, 2001). In 1997, for example, McDonald’s
restaurants in Beijing were on average paying 31 fees that purportedly went to supporting not only
the normal Beijing municipal services, but also air shelter repairs, river cleaning, public festival
decoration and communist party propaganda.26
Since then, the government has taken a number of measures to curb the proliferation of fees and
charges. The strategy was to clamp down on unauthorized fees and levies, bring administrative fees
collected by government departments and agencies into the budget as much as possible, improve
25 For details of how public service providers were funded, see World Bank (2005). 26
Box 3.1, “Would you like fees with that?” World Bank (2000).
13
monitoring of revenues and expenditures of the major items of EBF, and to gradually convert them
to taxes.
The efforts have achieved some measure of success. Many fees have been abolished – including,
most famously, all rural levies under the Rural Fee Reform campaign that was implemented during
2001-2003. Administrative fees continued to grow, but are now incorporated into budget
accounting, though not unified budgeting. In 1996, the category of “Government Fund” (GF) was
created, and thirteen of the largest fees and funds were put under GF including the road
maintenance fee, the vehicle purchase fee, the railroad construction fund, electric power fund, the
Three Gorges Dam fund, and airport management fees and construction fund. GF are subject to
budget management, treated as “below the line” items and reported annually in the budget reports.
By removing some of the biggest sources of EBF – the thirteen funds, for example, accounted for
more than one-fourth of the EBF in 1997 – and tightening authorization of new EBF, the government
has succeeded in whittling down what is reported in the formal category of “extrabudgetary funds”,
which fell to 3.4 percent of GDP in 2003. In 2010 the MOF stopped reporting EBF altogether.
Instead, the new budget classification reports tax revenues plus “non-tax revenues” (NTR) – the
replacement for EBF, as the total “ordinary budget”. In 2010 NTR were approximately 100 billion
yuan (1.7 percent of GDP), equal to 12 percent of the ordinary budget.
This “victory” is largely pyrrhic, however, since the category of Government Fund, rather than being
the transitional stage for bringing EBF into the budget, has grown secularly, with the addition of
some large and rapidly growing sources of revenue that are well outside of budgetary allocation. In
2010, it comprised more than 50 funds, with revenues of 3.7 trillion yuan (9.2 percent of GDP),
compared to 7.4 trillion yuan in the ordinary budget.27 Moreover, there are major sources of
funding that fall outside of the formal EBF/NTR and GF. For municipalities, the three biggest are land,
the social security fund, and borrowing.
B. Land transfer revenues
Aside from charging user fees and imposing quasi-taxes, monetizing state assets was another avenue
for supplementing the budget, and land is the principal asset of municipal governments.28 In
addition to existing city land, municipal governments derive revenues from the conversion of
farmland into non-agricultural use. The value of this revenue stream was greatly enhanced by the
constitution and several amendments, which specify that only the state can undertake the
27 MOF final accounts for the 2010 budget, July 2011.
http://yss.mof.gov.cn/2010juesuan/201107/t20110720_578448.html (accessed 2/18/2012). 28
The 1982 Constitution specifies that urban land is owned by the state while rural land is owned by the collectives.

14
conversion of farmland, conferring a monopoly on land conveyance on local governments.
Moreover, the law also fixes the procurement price of farmland at a multiple of its historical
agricultural output, thus ensuring the bulk of the rising values of urban land accrue to local
governments.29
SNGs began to tap this rich source of revenue in the early 1990s (Wong 1997, Guan and Peng 2011).
With accelerated urbanization boosting land values, this has grown to be a key source of extra-
budgetary revenue for municipal governments. However, until recently there was little public
information about the size of land transfer revenues since they accrue almost entirely to local
governments, and the central government has struggled to gain access.30 Moreover, until 2001, land
transfers were mostly made by administrative allocation and negotiation, and the real value of the
transactions was largely hidden. With the increased use of auctions, land transfers have become
more transparent. The Ministry of Land Resources has published national and provincial data since
2001 (Table 12). However, the data were incomplete – an audit conducted by the National Audit
Office (NAO) of eleven municipalities including Beijing, Tianjin, Chongqing and Guangzhou found that
during 2004-2006, land transfer revenues were under-reported by 71 percent.31
In 2007 the government designated land revenues as GF, and required them to be remitted to the
treasury and budget management. This seems to have improved reporting somewhat. The NAO
found that for 2007-2008, the eleven municipalities under-reported land transfer revenues by a
much reduced 20 percent.
[Table 12]
However, it is difficult to estimate the contribution of land revenues to municipal finance since they
are partly used to compensate households for resettlement. Moreover, as will be shown in a later
section, the importance of land revenues far exceeds their contribution to net income since it is also
the main asset used by municipal governments as collateral for borrowing.
C. Social Security Funds
The Social Security Funds (SSF) were created in 1996, with the introduction of insurance schemes for
urban employees that provide coverage for pensions, work injury, unemployment, maternity, and
health.32 City-level pooling of pension obligations had begun in the 1980s, and this transfer was
29
See Cao et al (2008) and Tao et al (2010). 30
The difficulty of gaining information was made more so because until recent years, the central government was continually asserting its right to share the revenue.
31 Fu Weigang (2010).
32 See, for examples, Hussain (2007), Wang (2005), and Watson (2009).
15
formalized in 1991, when the State Council introduced universal pooling of pension burdens and
placed them at the city level – be they provincial, prefectural or county level cities.33 Through the
1990s, the system was adjusted in several steps, creating the framework that exists today. The new
system has moved the provision of pensions from defined benefits to a two-pillar system combining
a small social pension with individual accounts that provide a top-up based on contributions made
during the employee’s work-life (Dong and Ye 2003).
Under the new system, each city is responsible for collecting the employer and employee
contributions to each scheme and managing the fiduciary responsibilities for the SSF. Although the
basic framework is based on regulations issued by the central government, many details of the
schemes are left to the discretion of the provincial and municipal governments (Hussain 2007). To
minimize fiscal risks, cities were permitted to vary contribution rates and benefit levels, though
there have been some efforts made in harmonizing them in recent years. At their inception,
however, the SSFs were saddled with some unfunded liabilities when the pension scheme was
obliged to accept the transfer of existing participants from the unfunded system, including retirees
and employees who were approaching retirement, with no provisions for covering the costs. As a
result, many pension pools are in deficit. One Chinese scholar estimated total deficits of all pension
pools at 2.5 trillion yuan in 2005, and projected that it would grow to 6 trillion yuan in 30 years.34
Even though cities are the budget-unit for social security, the SSFs are managed mainly by the
Ministry of Human Resources and Social Security (MOHRSS) and its subnational counterparts outside
the budget. The “social security and employment assistance” expenditure item in the budget
comprises expenditures on social welfare, disaster relief and fiscal subsidies to the SSF to cover
shortfalls, while the main expenditures on social security are made under the SSF. Under China’s
decentralized statistical system, information on the SSF are reported by the MOHRSS, separately
from fiscal data.
With urbanization, an ageing population, and with recent policies that have significantly expanded
social safety net provisions, SSF expenditures have grown rapidly. Coverage has grown from just
SOE pensions and an unemployment insurance program created in the 1980s, to include a pension
program for residents who never held a formal sector job, as well as a basic medical, work injury,
and maternity insurance programs created in the 1990s. Since 1990, contributions to the SSF have
grown from 1 percent of GDP in 1990 to 4.7 percent in 2010, averaging an annual growth of 27
percent, scattered in the more than 2000 local SSF pools.
33
State Council Decision on the reform of the pension insurance system for urban enterprise employees. June 1991. 34
Wang (2005).

16
D. China’s fragmented municipal finance
The salient feature of these components of extra-budgetary finance is that information is scattered
in different channels, and they are not always reported in full. Putting together all available
information, Figure D shows the “comprehensive budget,” of all known resources mobilized for
public expenditure excluding borrowing. Nationwide, the comprehensive budget has grown rapidly,
from 29.3 percent of GDP in 2006 to 36.5 percent in 2010. Most of the growth came from land, a
notoriously volatile revenue source. The ordinary budget (budget plus NTR) also grew, from 21
percent to 22.6 percent, but its share was declining, to less than 60 percent of the total in 2010. For
subnational governments, the composition is even more weighted toward non-budgetary revenues
– in 2010 the budget fell to less than 40 percent of the total (Figure E). Even with NTR, the ordinary
budget from own revenues is less than one-half of the comprehensive budget.
[Figure E]
A composite picture is constructed in Table 13 of the comprehensive budgets of prefectural level
municipalities that includes transfers from higher level governments. In this composite, land
revenues are almost equal to the size of own ordinary budget revenues, though not when transfers
are included. SSF are 18 percent of the total, and this share can be expected to grow in the future.
[Table 13]
Information is assembled in Table 14 on the different strands of revenue for Guangzhou, a
prefectural level city that is the provincial capital of prosperous Guangdong province, and Shanghai,
a provincial level city. It is not surprising that these larger cities, with more diversified economic
bases, draw a larger share of their revenues from taxes under the formal fiscal system, though it is
surprising that they also receive more transfers. Even for them, land revenues form a significant
part of revenues. In Shanghai, when direct and indirect taxes are included, land-based activities
including real estate development have reportedly accounted for 35% of total revenues since 2006.
In 2009 they accounted for fully 50% of the growth in revenues.35
[Table 14]
The SSF comprises nearly a quarter of revenues in Shanghai and an even larger share of expenditures,
when direct budgetary expenditures are included. As one of the oldest industrial centers, Shanghai‘s
SSF is burdened with huge “legacy” costs from the socialist system. In 2008, the municipality spent
12.14 billion yuan in fiscal subsidies to cover SSF arrears, absorbing 17-18% of budgetary
35
Shanghai Financial College (2010), p. 6.

17
expenditures. 36 As Shanghai also has the oldest population among Chinese cities, these subsidies
can be expected to rise.
How does a municipal budget look?
A typical municipal budget presentation includes budgetary information and some sketchy
information on extra-budgetary revenues and expenditures (now called NTR, in the “ordinary
budget”). In the case of Jiangyin, a county level city in prosperous Jiangsu province, the city
statistical yearbook offers an unusually detailed disaggregation for EBF that shows EBF providing
supplementary resources for funding many types of municipal expenditures (Table 15).37 Altogether
the EBF were 941 million yuan in 2009, less than 10 percent of the size of the budget.
[Table 15]
In addition to EBF, Jiangyin also had expenditures of 1.6 billion yuan in social security funds, as well
as 2.9 billion yuan in expenditures from Government Funds. Unfortunately, the yearbook does not
provide the sources of GF, so it is also not clear whether the figure includes land revenues, and no
breakdown was provided on the uses of the SSF and GF.
The presentation in Jiangyin mirrors the fragmented nature of the budget for municipalities overall,
where management of the revenues is highly compartmentalized. The municipal budget allocates
only revenues from the ordinary budget. All other revenues -- land, SSF, and the different funds and
fees that make up the EBF/NTR and GF, are allocated by the collecting agencies and departments. At
the national level there is no consolidated account of these resources. Even in a municipality, if such
a consolidated account exists, it is not publicized, and is not reported even to the people’s
congresses.38
The composition of expenditures from the ordinary budget accounts are presented in Table 16 for
SNGs, along with those for Guangzhou and Jiangyin. Data that is currently available does not permit
a detailed breakdown of expenditures from the comprehensive budget, but we can assume that
overall it is likely to tip the balance slightly toward social expenditures, and the trend will continue in
that direction. SSF are spent on social services, along with a majority of EBF/NTR assuming the
composition of expenditures in Jiangyin are broadly representative.39 Land revenues are mostly
earmarked for use in land preparation and urban infrastructure – 100 percent for development.
Except for 2010, the sum of SSF and 60 percent of EBF/NTR has in the past few years been larger
36
Ibid., p 121. 37
This is consistent with the picture found in earlier studies showing departmental expenditures often far exceed budget appropriations (World Bank 2002, 2005, and 2007).
38 Guan and Peng (2011) notes that land revenues are not reported to the people’s congresses.
39 They were divided: 60 percent social, and the rest for development and administration.
18
than land revenues, tipping the balance toward social spending overall. However, this balance shifts
sharply when we include borrowing.
[Table 16]
Finally, a key feature of China’s municipal finance is that a large portion of the urban population is
excluded from urban services, most notably social welfare, social security, education, healthcare and
housing, and this is not reflected in the accounting of revenues and expenditures. These are the
migrants who lack hukou – now estimated to be one-third of the total urban population (Miller
2012). This is likely part of the reason that China’s urbanization has not spawned large slums, as
migrants are discouraged from bringing their dependents to the cities with them.
V. Investment in infrastructure
The provision of infrastructure is vital to supporting urbanization, and how to finance these
investments is a central component of municipal finance. Under market reforms, public investment
management has changed dramatically in China (Wong 2011a). By far the most important was the
rapid withdrawal of budgetary inputs to investment that was driven by fiscal decline. Except for a
small spike under the fiscal stimulus programs in the late 1990s and again in 2008-2010, the share of
budgetary inputs has remained below 5 percent of total investment since 1993 (Table 17).40 “Self-
raised” funds have always been large, and now finance more than three-quarters of total. However,
their composition is amorphous and ill-defined.
[Table 17]
The second important change was that investment became decentralized. Figure F shows the SNG
share of budgetary investment rising in line with their share of budgetary expenditures.41 An
additional aspect of the decentralization of investment responsibilities is that just as higher level
governments were offloading them to SNGs, fiscally constrained SNGs often devolved the
responsibilities to public institutions such as schools and hospitals, and likewise encouraged them to
find their own resources.
[Figure F]
Along with financing, the authorities for investment decisions were also progressively devolved.
Under the planned economy, investment projects went through a formal process of preparation that
included feasibility studies, technical reviews and appraisals before approval. Project approval
40
For the 2008-2010 fiscal stimulus and its impact on public investment, see Wong (2011b). 41
In 2007 the MOF changed budget classification systems, and stopped reporting capital spending separately from recurrent expenditures.

19
authority was vested with the State Planning Commission (now renamed the National Development
and Reform Commission, NDRC) and its subnational counterparts, the DRCs. This was a key part of
the macro coordination function performed by the NDRC since project approval was a precondition
for application for land, raw materials, and funding including bank loans. Through the transition,
project approval was progressively decentralized to lower level governments. The decisive reform
came in 2004, when the government limited the requirement for administrative approval to only
projects financed by public funds and mega projects with investments exceeding a specified
threshold or in strategic sectors.42 Given the diversified funding of public investments and a lack of
clear definition on what constituted “public funds”, this decision was widely interpreted by SNGs to
mean that only projects funded by the budget were required to go through the approval framework.
The vast majority of public investment was considered exempted from 2004 onward, and the
gatekeeper function of the NDRC and DRCs has been severely eroded.43
Just as there is no consolidated account of municipal budgets, there is no consolidated account of
capital expenditures at the municipal level. In fact, it appears that there is no capital budget at any
level of government (Wong 2011a, Mikesell et al. 2011). Municipal governments finance
infrastructural investments from budget appropriations, earmarked tax revenues (chiefly the urban
maintenance and construction tax), extra-budgetary (now nontax) revenues, Government Funds,
land revenues as well as policy loans from the state development banks.
The diversified and decentralized character of public investment is demonstrated in Table 18, where
the data show that budgetary allocations are a minor share of investment funding, and they are only
weakly tilted toward public infrastructure.44 Even in the social sectors, the budget accounted for
only 9-12 percent of investments, and the bulk of funding came from “self-raised” funds – user
charges, fees, and other borrowing.
[Table 18]
For urban infrastructure such as public utilities (water supply and drainage, sewerage, residential gas
and heating, and public transport), parks, sanitation, and flood control, the Ministry of Construction
publishes a yearbook that provides more disaggregated data on urban construction and gives what
looks to be a comprehensive accounting of funding sources and uses (Tables 19 and 20).
42
State Council Document on Reform of Investment Institutions (2004). See Wong (2011a). 43
See Mikesell et al (2011) for practices in Guangdong. In fieldwork conducted in December 2010, I learned that even in localities that retained administrative approval procedures, the exercise was largely pro forma, since approval was always granted if funding was assured.
44 Data from 2007 is chosen to avoid distortions introduced by the massive fiscal stimulus program
implemented in 2008-2010.

20
Unfortunately, the MOC coverage is incomplete, as it includes only activities of the urban
construction departments. It does not include investments in housing, electricity,
telecommunications, and ports, airports and railways. Nor does it include investments in social
facilities such as sports stadiums, schools, clinics and hospitals. But even for the subsectors covered,
the coverage appears to be incomplete. For example, for 2008 the MOC reported investments
totaling RMB 29.54 billion in urban water supply and 16.35 billion in residential gas supply, while the
NBS reported investments of 104.54 and 43.63 billion, respectively.45 On the funding side, while
some land revenues go to funding urban maintenance and construction; the majority are usually
reserved for larger scale infrastructural projects undertaken by other departments (Mikesell et al
2011).
[Tables 19 and 20]
A. The emergence of local investment corporations
One of the most important developments in municipal finance in China over the past two decades is
the emergence of local investment corporations (LICs), which have been instrumental in helping
SNGs achieve and maintain high levels of investment in infrastructure. Around the world,
borrowing is widely used for public investments in infrastructure, and this method of financing is
considered both efficient and fair (Bird 2005). In China, however, the Budget Law prohibits SNGs
from borrowing without explicit permission from the State Council (Article 28).
To work around this constraint, starting in the 1980s SNGs – mostly at the prefectural and provincial
levels – turned to the creation of special financial vehicles to undertake the task of raising funds for
public investment. They were initially created as financially independent, single-purpose entities,
often for the purpose of taking on loans from international financial institutions. Being financially
independent restricted their scope to undertakings with the capacity for debt servicing, and these
corporations were prevalent in the construction and operation of toll roads, power companies,
water companies and utilities.
A breakthrough came in 1992, when Shanghai created the first broad-based investment corporation
to undertake investment in urban infrastructure, the General Corporation of Shanghai Municipal
Property (SMPC), and gave it the mission to co-ordinate and provide for the construction of facilities
such as water supply, sewerage, roads, and utility hook-ups. To finance these tasks, the corporation
was assigned a variety of fiscal funds from the municipal budget and authorized to borrow (Figure G).
45
MOC (2008), Table on 2008 urban public infrastructure construction investment by type; and CSY 2009, Table 5-15.
21
Its creation made possible a quantum leap in the financing available for infrastructure to support
urban renewal and expansion in Shanghai, raising it from the level of a few billion yuan per year
prior to the creation of SMPC, to 17 and 38 billion in 1993 and 1994.46 Investment in urban
infrastructure totaled 540 billion yuan over the period of 1998-2004 (Gao 2007), and the number of
corporations of this type grew to 10 (Wu 2011).
[Figure G]
Over time, the model spread to other municipalities. By the turn of the century, most cities had
established local investment corporations (LICs), and they came to play an increasingly key role in
financing urbanisation in many localities.47 As they became more accepted, their separation from
local public finances appears to have been relaxed, and SNGs began to guarantee many bank loans
for LICs. Typically, the LICs raise and bundle together bank loans and other financing, using a variety
of municipal assets including budgetary and off-budget revenues as equity and collateral.
Increasingly, with urbanisation bringing rising land values, land has become the principal asset
backing LICs, and municipalities have pledged future receipts from land revenues as collateral for
bank loans.48
Before 2009, even though LICs had by then accumulated 5 trillion yuan in bank loans, very little was
known about them.49 The macroeconomic risks they pose came to light dramatically during the
fiscal stimulus program, when they received their first official endorsement. In October 2008 the
government announced a RMB 4 trillion stimulus program to combat contagion from the global
financial crisis.50 To ensure SNGs had sufficient funds to support the ambitious investment program,
fiscal rules were relaxed, and SNGs were invited to borrow.51 LICs went “viral”; they proliferated,
and in 2009 alone took on 3 trillion yuan in new loans, and in the first quarter of 2010 they took 40
percent of new credit nationwide (Investors Bulletin, 2010; Wei, 2010). It was only when the China
Banking Regulatory Commission (CBRC) became concerned with the pace of lending to LICs that they
46
Investment in infrastructure was RMB 3.6, 4.8 and 6.1 in 1990, 1991 and 1992, respectively. SASS (1998). 47
See also Su and Zhao (2007). 48
The 2011 survey of LICs conducted by the National Audit Office found that future land revenues were pledged as collateral for bank loans in 309 prefectures and 1131 counties, equal to 93% and 56% of the those administrative units, respectively (NAO 2011, p.11).
49 NAO 2011.
50 For an analysis of how the fiscal stimulus program was implemented, see Wong (2011b).
51 In a joint document, the People’s Bank of China and the China Banking Regulatory Commission called for
“supporting localities with appropriate conditions organize and build financial platforms, issue corporate debt and medium-term notes and other financial products, to broaden the channels of funding for providing counterpart funds for central government investment projects.” People’s Bank of China and China Banking Regulatory Commission (2009).

22
discovered the near-complete absence of information about them. Previously they had existed in
the interstices of China’s mixed economy. They were never assigned a supervisory agency, and no
one had asked for regular reporting of their activities.
Since mid-2009, the government has been engaged in a massive catching-up exercise in collecting
information on LICs and their operations, culminating with a nationwide audit that took place during
March – May 2011, involving 41,000 staff from the National Audit Office and their local subsidiaries
(NAO 2011). But even now the numbers are disputed as agencies disagree on what an LIC is (Table
21).
[Table 21]
B. Local government debt
While the LICs were the main vehicle for SNG borrowing, they were not alone. In its survey, the NAO
had focused its mission on uncovering all debt guaranteed explicitly or implicitly by local
governments. It found SNG liabilities totaling RMB 10.7 trillion at year-end 2010 (equal to 263% of
own revenues and 27% of GDP in 2010), of which LICs accounted for only half. Government
departments accounted for a quarter, and public service units (universities, schools, hospitals,
research organizations, etc.) accounted for 18 percent, and “others” the rest. Almost 80 percent of
the debt came from bank loans, 7 percent from bond issuance, and the rest from individuals and
enterprises.
It seems the prohibition on local government borrowing was completely ineffective, but only served
to push it underground and out of purview of the national authorities. All levels of SNG were
involved, starting in the 1980s with the provinces. By the early 1990s, nearly all prefectures and
counties were borrowing, and it had become a significant source of funding for SNGs especially for
infrastructure, but also other expenditures. In 2009 alone, at the peak of credit expansion under the
stimulus program, SNGs borrowed as much as 4 trillion yuan, compared to their comprehensive
revenues of 9.5 trillion.52 While 2009 was an extreme year, the great boom in local building projects
over the past 5-6 years – from new government districts, airports, subways, museum, sports
stadiums to new university campuses, suggests that funding has been readily available, much of it
from borrowing.53
52
CBRC estimated that LICs took one-third of new credit in 2009, or 3.2 trillion yuan (Investors Bulletin, 2010). Other local government entities presumably also took new debt during the year.
53 A joint study found that in planning subway projects municipal officials generally worked without a financial
plan, and were confident that funds would be available. They also universally chose extremely large
23
C. The soft budget constraint for borrowing and infrastructural investment
In borrowing to finance infrastructure, China is following common practices in other parts of the
world. Where it differs is in the unsupervised nature of the borrowing, not only by national
authorities, but apparently at the local level as well. In a trenchant critique, researchers in the
NDRC Investment Research Institute described the current system of local investment finance as
operating under “the three no’s”: with no guiding framework, no limit, and no accountability.54
There is no overall framework that defines the scope of public investment. Municipalities often lack
an investment plan that includes consideration of total debt levels. LICs often do not compile an
assets and liabilities account, and they are so closely linked to SNGs that it is difficult to separate out
and define their responsibilities. In China’s immature financial system, banks are ill-equipped to
provide the discipline expected from capital markets, especially when municipal finances are so
complex and non-transparent. In any case, after more than 20 years of hyper-growth, there was a
widespread belief that land values will always rise, and government can make good on guarantees.
VI. Rebuilding municipal finance for the 21st Century
Municipal finance in China today is the product of ad hoc, adaptive experimentation over the past
three decades, a period during which the economy was undergoing three transitions: from a
socialist planned economy to a market-oriented economy, from an agrarian society to an urban
industrial society, and from being one of the world’s poorest economies to a middle-income country.
These transitions wreaked havoc on the pre-existing social and economic organizations, and new
ones had to be created. With the central government preoccupied with the fiscal crisis brought on
by the decline of the state economy, municipalities were left on their own to cope with their
changing environment.
In this maelstrom, municipal governments faced enormous pressures on two fronts – to provide a
new social safety net to replace the one under the state economy, and to provide infrastructure to
support the fast-unfolding economic growth and the migrants flooding in. They improvised. One
tactic adopted was to limit eligibility for urban services to reduce the growth in demand for them,
and the hukou system provided a convenient, fool-proof mechanism for excluding the new
projects and underground options even though traffic volumes and building costs pointed to light rail as the superior option (NDRC and World Bank 2010).
54 Wang et al (2010). .
24
migrants.55 The other was to go off-budget in search of resources, and SNGs displayed remarkable
ingenuity in doing so.
This “model” of municipal finance and especially many of its revenue mechanisms had grown out of
the extremely harsh fiscal environment that SNGs faced in the 1980s and 1990s, when mobilization
of resources in support of growth was accepted as of paramount importance. The information we
have examined in this paper show that municipal governments have over-delivered on this objective
– mobilizing off-budget resources to provide services and building massive amounts of infrastructure.
However, this laissez faire model of municipal finance has long outlived its usefulness, and the costs
are piling up. In the 21st Century, China is a global economic power, and its national objectives have
shifted to a broader agenda that also calls for rebalancing the economic growth away from the high
savings- and investment-driven to a more consumption-driven growth, and taking steps toward
building a more inclusive “harmonious society” where citizens benefit more equally from China’s
economic miracle.56 The dynamics of the current municipal finance system, where incentives for
SNGs are lopsided in favour of developing off-budget revenues, are fundamentally at odds with this
new agenda. The complex and opaque nature of the current municipal finances is also out-of-step
with the government program to move toward transparency in the public sector and permit greater
participation.
Moreover, the model is unsustainable. The most pressing immediate problem is that SNGs and
their LICs have run up a mountain of debt that threatens to bring the banking sector grinding to a
halt. The NAO reported that more than one-half of the 10.7 trillion yuan was due in 2011, 2012 and
2013. With the central government taking measures both to clamp down on new lending to LICs and
cool down the super-heated housing price inflation, many SNGs have been unable to service their
debt as land markets have slowed. Even in Beijing, for example, the Municipal Land Bureau reported
that land lease revenues had slowed to a total of 25 billion yuan during the first five months of 2011,
insufficient to cover the monthly interest cost of more than 10 billion yuan on the 250 billion yuan
debt for the municipal land bank.57 Nationwide, a mass default was avoided only when the
government ordered banks in February 2012 to roll over their loans to LICs.58 A more permanent
bail-out will likely have to be worked out step-by-step over the next few years.
Nor is the heavy reliance of municipal governments on one-off land lease sales sustainable. With
leases running 40-70 years, urban land is virtually a non-renewable resource, and in the more
55
This was noted in Kirkby (1985) and called “industrialization on the cheap”. 56
These goals have been repeated in official statements since 2003, and was embedded in the 11th
Five Year Plan (2006-2010) and reiterated in the current 12
th FYP.
57 New Century, Issue No. 25, 27 June, 2011.
58 Financial Times 12 February, 2012.
25
developed coastal cities it is already providing a declining portion of municipal revenues (Wang
2011).
As municipal finance evolved over the past 30 years, the patchwork of ad hoc responses left many
issues unresolved, among them the coordination between levels of government coexisting within
expanding metropolitan regions. In China acute conflicts have arisen over the ownership of land, tax
bases and social assets, along with problems of coordinating infrastructure and service provision
(Shanghai Financial College 2010). Accommodations are worked out on a case-by-case basis by the
administrative units themselves, and little information is reported systematically about the
arrangements. It may be more equitable and efficient to work out a national framework and provide
guidance on best practices.
Finally, the decentralized financing has given rise to a two-tier society that keeps rural migrants
permanently out of the mainstream of urban life. Although their relative deprivation had, for the
past 3 decades, been alleviated by the economic growth and job creation that brought rising
incomes to the rural populace, the glaring unfairness is building social tensions and hindering
investments in human development. The magnitude of the problem can be glimpsed in Shanghai,
where the share of non-hukou population staying for more than 6 months has grown from 20
percent of the total in 2000 to 39 percent in 2010.59 Incorporating migrants in urban service
provision will require central government participation in financing them.
In the 21st Century, China is an urban nation. Rebuilding the system of municipal finance must move
to the top of the government’s policy agenda. For a new system that can efficiently mobilize and
manage fiscal and financial resources to deliver social welfare and infrastructure, municipal
governments need access to more transparent and sustainable sources of finance from taxes, user
charges, and grants. Greater revenue discretion, along with transparent and regulated access to
credit, should help to harden their budget constraints. The first step toward rebuilding the system
should be a rationalization of the IFS that assigns revenues and responsibilities in a way that is better
aligned with the decentralized, increasingly mobile society that China has become.
59
Shanghai Statistical Yearbook 2011.

26
References
Asian Development Bank (2000). Managing Urban Change - Strategic Options for Municipal Governance and Finance in China. PRC: TA 2924 – Study of Municipal Finance. Manila, Philippines.
Bahl, Roy (2011). “Intergovernmental Fiscal Relations and Local Public Finance: What’s Next on the Agenda.” In Joyce Y. Man and Yu-Hung Hong (eds.) China’s Local Public Finance in Transition. Cambridge. Lincoln Institute of Land Policy.
Bai Nansheng (2004). “A police story.” Paper at the Conference on Rural Change in China, Peking University, July 5-6.
Bernstein, Thomas (1977). Up to the Mountains and Down to the Villages: The Transfer of Youth from Urban to Rural China. New Haven and London: Yale University Press.
Bird, Richard (2005). “Getting It Right: Financing Urbanization in China”, Asia-Pacific Tax Bulletin. March/April. 107-117.
Brixi, Hana (2009). China: Urban Services and Governance. World Bank Policy Research Working Paper 5030.
Cao, Guangzhong, Changchun Feng and Ran Tao (2008). “Local “Land Finance” in China’s Urban Expansion: Challenges and Solutions”, China & World Economy, v. 16, n.2, 19-30.
Chan, Kam Wing, 2009. “Measuring the Urban Millions,” China Economic Quarterly, March, pp.21-26.
Chan, Kam Wing, 2003. "Chinese Census 2000: New Opportunities and Challenges," The China Review, 3(2), pp.1-12.
Chan, Kam Wing, Vernon Henderson, and Kai Yuen Tsui, 2008. “Spatial Dimensions of Chinese Economic Development,” in Thomas Rawski and Loren Brandt (eds.), China’s Great Transformation: Origins, Mechanisms, and Consequences of the Post-Reform Economic Boom, Cambridge University Press, pp.776-828.
Chung, Jae-Ho and Tao-Chiu Lam (2004). “China’s City System in Flux: explaining post-Mao administrative changes,” The China Quarterly (180), December; 945-964.
Dai Junliang (2003). “Research on the recent adjustments of administrative divisions in large and medium sized cities”, originally published in Administrative Divisions and Place Names No. 2, reprinted in Economic Theory and Economic Management, No. 9, 2002 (sic).
Dong, Keyong and Xiangfeng Ye (2003). “Social security system reform in China”, China Economic Review 14, 417-425.
Fu Weigang (2010). “Why is there so much chaos on the use of land transfer revenues?” Dongfang Morning Post, April 25.
Gao, Guo Fu (2007). “Urban Infrastructure Investment and Financing in Shanghai.” George Peterson and Patricia Arnez (eds). Financing Cities: Fiscal Responsibility and Urban Infrastructure in Brazil, China, India, Poland and South Africa. Sage Publications for the World Bank.
27
Guan Qingyou and Peng Mei (2011). “Land Finance: the Opiate.” Processed.
He Yang and Man Yanyun (2011). “Risk Warning on Local Financing Platform Debt: a Perspective Based on an Analysis of Land-Based Finance”, mimeo.
Henderson, Vernon (2009). “Urbanization in China: Policy Issues and Options.” in Medium and Long Term Development and Transformation of the Chinese Economy. Editors Edwin Lim, M Spence and J
Yu. Beijing, CITIC Press, 2011. http://www.cairncrossfund.org/download/十二五项目报告/Background%20Papers/Henderson%20-%20Final_Report_2009.11.10[Urbanization].pdf (accessed 3/21/2012).
Honohan, Patrick (2008). “Finance for Urban Centers,” in Shahid Yusuf and Tony Saich (eds), China Urbanizes: Consequences, Strategy and Policy. The World Bank.
Hussain, Athar. (2007). “Social security in transition”, in Vivienne Shue and Christine Wong (eds.) Paying for Progress in China: Public Finance, Human Welfare and Changing Patterns of Inequality. London, Routledge.
Kamal-Chaoui, L., E. Leman, and R. Zhang (2009), “Urban Trends and Policy in China”, OECD Regional Development Working Papers, 209/1. Paris, OECD.
Kirkby, Richard (1985). Urbanization in China: Town and Country in a Developing Economy 1949-2000 AD. New York. Columbia University Press.
Investors Bulletin (2010), “A Tight Hoop Should be Put on Local Government Financing Platforms”, 6 June, http://finance.ifeng.com/news/special/dfzwwj/20100606/2282325.shtml, accessed 20 May 2011.
Legal Daily (2009). Conflict of interests is biggest barrier to expanding pension pools, July 13. http://news.sohu.com/20090713/n265172715.shtml (2/25/12).
Li Ping (2010). (Ed.), Caizheng tizhi jianming tujie (A Concise Graphical Depiction of the Fiscal System). Beijing. Chinese Financial Economics Press.
Li Ping (2006). (Ed.), Zhongguo zhengfujian caizheng guanxi tujie (China: Intergovernmental Fiscal Relations). Beijing. Chinese Financial Economics Press.
Mikesell, John L., Jun Ma, Alfred Tat-kei Ho, and Meili Niu (2011). “Financial local public infrastructure: Guangdong province”, in Joyce Yanyuan Man and Yu-Hung Hong (Editors), China’s Local Public Finance in Transition. Lincoln Institute of Land Policy, Cambridge, MA.
Miller, Tom (2012). “At Last, Momentum for Hukou Reform,” Reportage, GK Dragonomics, March 27.
National Audit Office (2011). Local Government Debt Audit Results. 2011, No. 35, June 27.
National Development and Reform Commission and World Bank (2010). Urban rail development in China : issues and options. World Bank Working Paper 55772, 1/05/2010.
National Bureau of Statistics, China City Statistics Yearbook (CCSY), annual. Beijing. National Statistical Press.

28
National Bureau of Statistics, China Statistics Yearbook, annual. Beijing. National Statistical Press.
National Bureau of Statistics, New China 55 Years Statistical Compendium, New China 60 Years Statistical Compendium. Beijing. National Statistical Press.
People’s Bank of China and China Banking Regulatory Commission (2009). “Some guiding opinions on further strengthening the adjustment of credit structures to promote the stable and relatively rapid growth of the national economy”, 24 March, Beijing.
Schreyer, Paul and Carsten Holz (2005). “Institutional Arrangements for the Production of Statistics,” in OECD, Governance in China. Paris, OECD.
Securities Times web (2012). How to get the funds managing nearly 2 trillion yuan to sing the same tune? 9 February (http://finance.people.com.cn/stock/BIG5/17062490.html, accessed 2/25/2012).
Shanghai Financial College Institute of Urban Public Finance and Public Administration (2010), Editors, Urban Public Finance to Promote the “Two Centre” Construction of Shanghai. Beijing. Chinese Financial Economics Press.
Standard Chartered (2012). “On the Ground: Masterclass: China 2011, England 1890.” 04 January.
State Council (2004). State Council Document on Reform of Investment Institutions. July.
Su, Ming and Zhao Quanhou (2007). “China: Fiscal Framework and Urban Infrastructural Finance.” in Peterson and Arnez.
Tao, Ran, Fubing Su, Mingxing Liu, and Guangzhong Cao (2010). ” Land Leasing and Local Public Finance in China's Regional Development: Evidence from Prefecture-level Cities.” Urban Studies 47: 2217-2236.
Wang, Dewen (2005).China’s Urban and Rural Old Age Security System: Challenges and Options. Chinese Academy of Social Sciences, Working Paper Series No. 53. http://iple.cass.cn/file/dw17.pdf (accessed 3/21/2012).
Wang Yuanjing, Gao Zhenhua and He Yinzi (2010). “The challenge of local government fund-raising and rebuilding the model – taking urban construction as an example.” Jingji lilun yu jingji guanli (economic theory and economic management) (in Chinese). Issue 4, pp. 53-60.
Wang Guangtao (Editor) (2011). The State of China’s Cities 2010/2011: Better City, Better Life. Beijing, Foreign Languages Press.
Watson, Andrew (2009). “Social Security for China's Migrant Workers – Providing for Old Age.” Journal of Current Chinese Affairs, 38, 4, 85-115.
Wong, Christine (2011a). “Can Humpty Dumpty Be Put Together Again? A Review of Public Investment Management in China,” forthcoming in World Bank, Investing to Invest: Strengthening public investment management and global lessons, Washington, DC.
Wong, Christine (2011b). “The Fiscal Stimulus Program and Problems of Macroeconomic Management in China”, OECD Journal on Budgeting, Volume 2011/3.
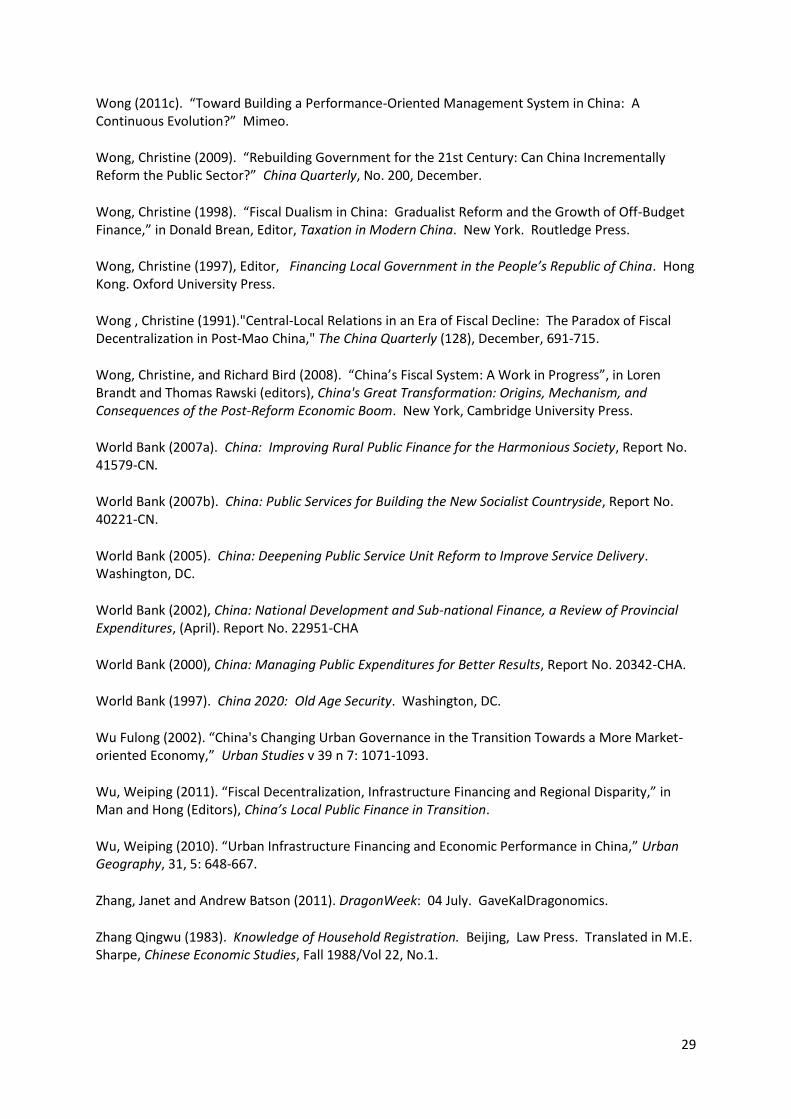
29
Wong (2011c). “Toward Building a Performance-Oriented Management System in China: A Continuous Evolution?” Mimeo.
Wong, Christine (2009). “Rebuilding Government for the 21st Century: Can China Incrementally Reform the Public Sector?” China Quarterly, No. 200, December.
Wong, Christine (1998). “Fiscal Dualism in China: Gradualist Reform and the Growth of Off-Budget Finance,” in Donald Brean, Editor, Taxation in Modern China. New York. Routledge Press.
Wong, Christine (1997), Editor, Financing Local Government in the People’s Republic of China. Hong Kong. Oxford University Press.
Wong , Christine (1991)."Central-Local Relations in an Era of Fiscal Decline: The Paradox of Fiscal Decentralization in Post-Mao China," The China Quarterly (128), December, 691-715.
Wong, Christine, and Richard Bird (2008). “China’s Fiscal System: A Work in Progress”, in Loren Brandt and Thomas Rawski (editors), China's Great Transformation: Origins, Mechanism, and Consequences of the Post-Reform Economic Boom. New York, Cambridge University Press.
World Bank (2007a). China: Improving Rural Public Finance for the Harmonious Society, Report No. 41579-CN.
World Bank (2007b). China: Public Services for Building the New Socialist Countryside, Report No. 40221-CN.
World Bank (2005). China: Deepening Public Service Unit Reform to Improve Service Delivery. Washington, DC.
World Bank (2002), China: National Development and Sub-national Finance, a Review of Provincial Expenditures, (April). Report No. 22951-CHA
World Bank (2000), China: Managing Public Expenditures for Better Results, Report No. 20342-CHA.
World Bank (1997). China 2020: Old Age Security. Washington, DC.
Wu Fulong (2002). “China's Changing Urban Governance in the Transition Towards a More Market-oriented Economy,” Urban Studies v 39 n 7: 1071-1093.
Wu, Weiping (2011). “Fiscal Decentralization, Infrastructure Financing and Regional Disparity,” in Man and Hong (Editors), China’s Local Public Finance in Transition.
Wu, Weiping (2010). “Urban Infrastructure Financing and Economic Performance in China,” Urban Geography, 31, 5: 648-667.
Zhang, Janet and Andrew Batson (2011). DragonWeek: 04 July. GaveKalDragonomics.
Zhang Qingwu (1983). Knowledge of Household Registration. Beijing, Law Press. Translated in M.E. Sharpe, Chinese Economic Studies, Fall 1988/Vol 22, No.1.

30
Figure A. Urbanization rates in China
Source: CSY 2011.
Table 1. Global Logistics Performance Index (Feb 2010) LPI Rank
Country LPI Score
Customs Infrastructure International shipments
Logistics competence
Tracking & tracing
Timeliness
27 China 3.49 3.16 3.54 3.31 3.49 3.55 3.91
1 High income 3.55 3.36 3.56 3.28 3.5 3.65 3.98
2 Upper middle income
2.82 2.49 2.54 2.86 2.71 2.89 3.36
3 Lower middle income
2.59 2.23 2.27 2.66 2.48 2.58 3.24
4 Low income 2.43 2.19 2.06 2.54 2.25 2.47 2.98
Source: World Bank Logistics Performance Index http://web.worldbank.org/WBSITE/EXTERNAL/TOPICS/EXTTRANSPORT/EXTTLF/0,,contentMDK:21514122~menuPK:3875957~pagePK:210058~piPK:210062~theSitePK:515434,00.html, accessed 28/2/2012.
Table 2. China’s urbanization and industrialization
Urban population (million)
Increase over past decade (million)
Urbanization rate
Industry share of GDP*
1950 61.69 17.6%
1960 130.73 69.04 19.7% 28.3%
1970 144.24 13.51 17.4% 36.8%
1980 191.4 47.16 19.4% 43.9%
1990 301.95 110.55 26.4% 36.7%
2000 459.06 157.11 36.2% 40.4%
2010 669.78 210.72 49.9% 40.1%
* The first two figures are from 1952 and 1962.
Source: CSY 2007 and 2011.

31
Figure B. China’s population growth by decade, 1950-2010.
Source: CSY 2011.
Figure C. Structure of Government in China (2010)
Notes: None of the provincial level cities have prefectural cities or county level cities below them. Beijing has
2 counties, 142 towns and 40 townships; Tianjin has 3 counties, 115 towns and 20 townships; Shanghai has 1
county, 109 towns and 2 townships; Chongqing has 21 counties, 587 towns and 252 townships.
333 Prefectures (Avg. Pop: 3.8 million )
2003 Counties and county level cities (Avg. Pop: 443,000)
33,9983 Townships/towns (Avg. Pop: 17,500)
Central Government (Population: 1.34 billion)
4 Provincial level Muncipalities Beijing, Shanghai, Tianjin, Chongqing
(Avg Pop: 21.1 million)
22 Provinces & 5 Autonomous Regions
(Avg Pop: 46.5 million)

32
Source: CSY 2011.
Table 3. Distribution of urban local governments by administrative rank and size (2009).
Number Average Population (mn)
Share of urban population
Provincial level 4 12.13 8%
Provincial capitals and line item cities*
31 3.06 15%
Prefectural level 251 0.95 39%
County level 367 na na
Township level 19,322 na na
* excluding Lhasa. Source: China City Statistical Yearbook 2010.
Table 4. Growth of ULGs by administrative rank, 1980-2010.
Cities Towns
Provincial level
Prefectural level
County level
Total Increase over past decade
1981 3 108 122 233 56 2664*
1990 3 185 279 467 234 11,392
2000 4 259 400 663 196 19,692
2010 4 283 370 657 -6 19,410
* 1982 figure. Source: CSY 1981, 1991, 2001, and 2011; Chan and Hu (2003), Chan, Henderson and Tsui (2008).
Table 5. Distribution of budgetary expenditures by level of government (2007, % total)
All Budgetary Expenditures
Education Health Social Security and
Employment
Capital Spending
(2006)
Central 23.0 5.5 1.7 6.3 27.9
Province 17.7 15.0 17.2 24.9 18.5
Municipalities 22.2 18.8 26.2 27.7 28.8
Counties* 37.1 60.7 54.9 41.2 24.8
* Counties’ share includes that of townships. Source: Calculated from China Fiscal Yearbook (2008), pp. 147; and Compendium of Local Fiscal Statistics 2006, 2007.
Table 6. Composition of budgetary expenditures (% total, all SNGs)
1978 1988 1998 2010
SOEs 55.7 28.1 19.6 na
Development 57.5 21.7 24.3 35.6
Social 18.0 24.0 26.2 42.7
Administration 7.9 10.4 15.7 21.7
Subsidies 10.7 29.6 7.7 na
Source: MOF data, regrouped by author’s estimates.

33
Table 7. Tax assignments in China
Central Taxes Shared Taxes Local Taxes
Excise (consumption) Value-added tax (75/25) Business tax
Customs duties Corporate income tax (60/40) Propery tax
Vehicle purchase tax Personal income tax (60/40) Urban land use tax
Securities trading tax (97/3) Vehicle use tax
Vehicle license tax
Ship tonnage tax
Deed tax
Stamp tax
Urban maintenace and construction tax
Land value-added tax
Farmland occupation tax Resource tax
Note: This is a simplified version. For more details and exceptions, see Wong and Bird 2008.
Table 8. Sharing rates by tax type between province and prefecture levels
(as % of local receipts) VAT CIT PIT Business tax Resource tax
Guangdong (2011) na 50/50 50/50 50/50 na
Hebei (2009) 40/60 50/50 25/75 0/100 40/60
Hunan (2010) 25/75 30/70 30/70 25/75 25/75
Liaoning (2004) 40/60 50/50 37.5/62.5 30/70 na
Shandong (2003) na 20/80 0/100 20/80 na
Shanxi (2003) na 50/50 50/50 na na
Source: documents on implementing “provinces managing counties”, and fieldwork in Liaoning in
2005-2006.
Table 9. Sharing rates between municipalities and their subordinate counties in Liaoning
(as % of local receipts) Provincial Prefecture County
Anshan (2003)
VAT 40 20 40
CIT 50 12.5 37.5
PIT 37.5 25 37.5
Business Tax 30 30 40
Property Tax 50 0 50
Panjin and Yingkou (2004)
VAT 40 24 36
CIT 50 20 30
PIT 37.5 25 37.5
Business Tax 30 28 42
Property Tax 50 20 30
Source: Fieldwork visit September 2004 and background papers from Panjin and Yingkou (2004).

34
Table 10. Composition of own tax revenues at each administrative level (2007)
National (2010)
Province Prefecture /municipality
County
Business tax 13.9% 39.2% 31.1% 31.7% VAT* 39.2% 17.4% 19.2% 21.1%
CIT 15.9% 24.3% 15.4% 12.5%
Deed tax 3.1% 2.5% 9.6% 6.4%
Urban Maintenance and Construction Tax
2.3% 2.2% 7.8% 7.1%
PIT 6.0% 10.1% 5.8% 5.3%
Property tax 0.8% 3.6% 4.0%
Land value-added tax 1.1% 0.8% 2.4% 2.8%
Urban land use tax 1.6% 0.6% 1.8% 2.7%
Stamp tax 1.2% 1.1% 1.8% 1.9%
Resource tax 1.3% 1.0% 0.7% 1.7%
Farmland occupation tax 0.5% 0.1% 0.4% 1.9%
Vehicle purchase tax 1.1% 0.0% 0.4% 0.5%
Tobacco tax 2.2% 0.0% 0.0% 0.3%
Note: the township level is omitted because since 2002/2003 its importance has been substantially
downgraded, and its responsibilities (and revenues) moved upward to the county level.
* The national VAT includes VAT and excise on imports.
Source: MOF difang caizheng ziliao (2007).
Table 11. Fiscal trends by tier of government
(Percent of national total) 1993 1998 2002 2006 2009
Revenues
Central 22 50 55 53 52
Provincial 13 10 12 12 11
Pref/ Municipality 34 20 16 17 16
County+township 32 20 17 19 21 Expenditures
Central 34 29 31 25 20
Provincial 11 19 20 18 18
Pref/ Municipality 29 24 21 23 22
County+township 27 28 29 34 40
Source: MOF.

35
Table 12. Revenues from land transfer.
(billion yuan) Transaction volume Net income
2001 129.59
2002 241.58
2003 542.13 179.91
2004 641.22 233.98
2005 588.38 218.97
2006 807.76 297.83
2007 1221.67 454.15
2008 1037.53 361.19
2009 1396.48 na
2010 3010.89 na
Source: China Land Resources Bulletin, various years; and MOF 2010 budget final accounts (July 2011). The 2010 figure is the sum of four funds: income from the transfer of use rights for state-owned land, user charges for bringing new land under construction, the fund on profits of state-owned land, and receipts from agricultural land development (MOF 2010 final accounts). This may be inconsistent with earlier figures reported by the Ministry of Land Resources. Income from land transfers alone was 2819.77 billion.
Figure D. China’s comprehensive budget (% GDP)
Note: EBF figures used for 2006-07, and NTR used for 2008-2010. Source: CSY (2010, 2011), China Fiscal Yearbook 2010, China Land Resources Bulletin, various years; and MOF 2010 budget final accounts (July 2011).

36
Figure E. Composition of subnational revenues by source
Source: same as Figure E. Subnational share of SSF assumed to be 90% of total.
Table 13. A composite picture of prefectural level municipalities budget (2010)
Billion RMB All prefectural cities Share of total
Ordinary budget revenues 1587.17 33.3%
Gross transfers including tax rebates 646.99 13.6%
Land revenues 1513.72 31.7%
Government funds (excl land) 174.82 3.7%
Social Security Fund 847.04 17.8%
Comprehensive Budget 4769.74 100.0%
Average population (2009, mn) 1.16
Source: estimated from data used in Figures E and F. Assumptions:
1. NTR is used in place of EBF to avoid double-counting. Pref share assumed to be 45%. 2. Used pref share of budget revenues from 2009 for both own revenues. Transfers share is 20%. 3. Used pref share of land revenues from 2004, assumed to be unchanged at 52%. 4. For all other components, used 50% as pref share. This is probably an underestimate.
Table 14. Revenue composition of Guangzhou and Shanghai
Billion RMB Guangzhou (2010)
Share of total
Shanghai (2009)
Share of total
Ordinary budget revenues 70.27 35.5% 254.0 49.4%
Gross transfers including tax rebates 40.50 20.5% 41.5 8.1%
Land revenues 55.15 27.9% 104.3 20.3%
Government funds (excl land) 16.43 8.3%
Social Security Fund 15.36 7.8% 114.3 22.2%
Comprehensive Budget 197.70 100% 514.13 100%
Population (mn) 6.55 17.02

37
Per capita fiscal resources (thou RMB) 30.20 30.21
Source: Guangzhou Statistical Yearbook 2011, Shanghai Statistical Yearbook 2010, China City Statistical Yearbook 2010, China Fiscal Yearbook 2009, China Population and Employment Statistical Yearbook 2010, China Land Resources Bulletin, China Labor Statistical Yearbook 2010, and Shanghai Financial College (2010).
Table 15. Composition of fiscal expenditures in Jiangyin Municipality, 2009. Unit: Million yuan Budgetary Extra-
budgetary Social
Security Fund Government
Fund
General Public Services 1195.72 70.25
Public Safety 574.58 23.36
Education 1681.03 323.48
Science and Technology 223.93 1.27
Culture, Sport and Media 99.67 16.97
Social Security and Employment Assistance 682.15 107.17
Medical and Health Care 313.15 60.64
Environmental Protection 358.96 44.8
Community Affairs 2277.67 161.31
Agriculture, Forestry and Water Conservancy 477.71 88.9
Transportation 430.52 15.94
Mining, power and Information Industry 897.41
Grain and material reserves 141.46
Earthquake reconstruction assistance 140
Other Expenditure 662.79 26.83
Total 10,169.83 940.92 1605.85 2900.1
Comprehensive Budget 15,616.7
Per capita (yuan) 12,976 Per capita, by component (yuan) 8,450 782 1,334 2,410
Shares of comprehensive budget 65.1% 6.0% 10.3% 18.6%
Population (mn) 1.2
Source: Jiangyin Statistical Yearbook 2010, p.157.
Table 16. Composition of budgetary expenditures by broad category.
All SNGs 2010
Guangzhou 2009
Jiangyin 2009
development 35.6% 28.2% 39.7%
social 42.7% 41.2% 35.1%
administration 21.7% 30.5% 25.2%
Source: CSY 2011, Guangzhou Statistical Yearbook 2010, Jiangyin Statistical Yearbook 2010. All data are regrouped and recalculated on same basis as Table 6.

38
Table 17. Sources of finance for fixed investment (percent)
1982 1993 1995 2000 2003 2007 2009
Budget 22.7 3.7 3.5 6.8 4.8 3.9 5.1 Domestic credit 14.3 23.5 21.7 23.6 23.0 15.3 15.7 Foreign 4.9 7.3 13.1 5.8 4.5 3.4 1.8 Self-raised and other 58.1 65.5 61.7 63.8 67.6 77.4 77.4 Note: Self-raised funds are own receipts of enterprises or institutions. “Other” includes capital from bond issue by enterprises or banks, levies, own capital and donations. Source: New China 55 Years, and CSY.
Figure F. Subnational share of budgetary expenditures and investment
Sources: CSY 2011, and MOF data.
Table 18. Investments by source and by sector (2007).
By Source By Management
Jurisdiction
As percent total Budget Loans Foreign Self-
Raised Other Central Local
Social Service Facilities
Education 12.3 12.9 0.6 66.2 8.1 10.2 89.8 Health 9.3 11.7 0.6 72.6 5.8 5.3 94.7 Infrastructure
Urban water supply 11.1 20.3 3.7 58.1 6.8 1 99 Electricity 6 43.6 1 43.5 5.9 38.6 61.4 Transportation 13.5 33.3 1.5 43.2 8.4 24.4 75.6 Telecommunication 1.5 1.9 0.9 92.9 2.8 50.7 49.3 Infrastructural Investment 9.8 34.1 1.4 47.7 7 30.4 69.6 All Investment 3.9 15.3 3.4 60.6 16.8 11.2 88.8
Billions RMB Yuan
Infrastructure Investment 216.9 756.6 30.9 1060.1 156.1 694.6 1587 All Investment 585.7 2304.4 513.3 9137.3 2539.6 1316.5 10,429.9
Source: assembled from CSY 2008.
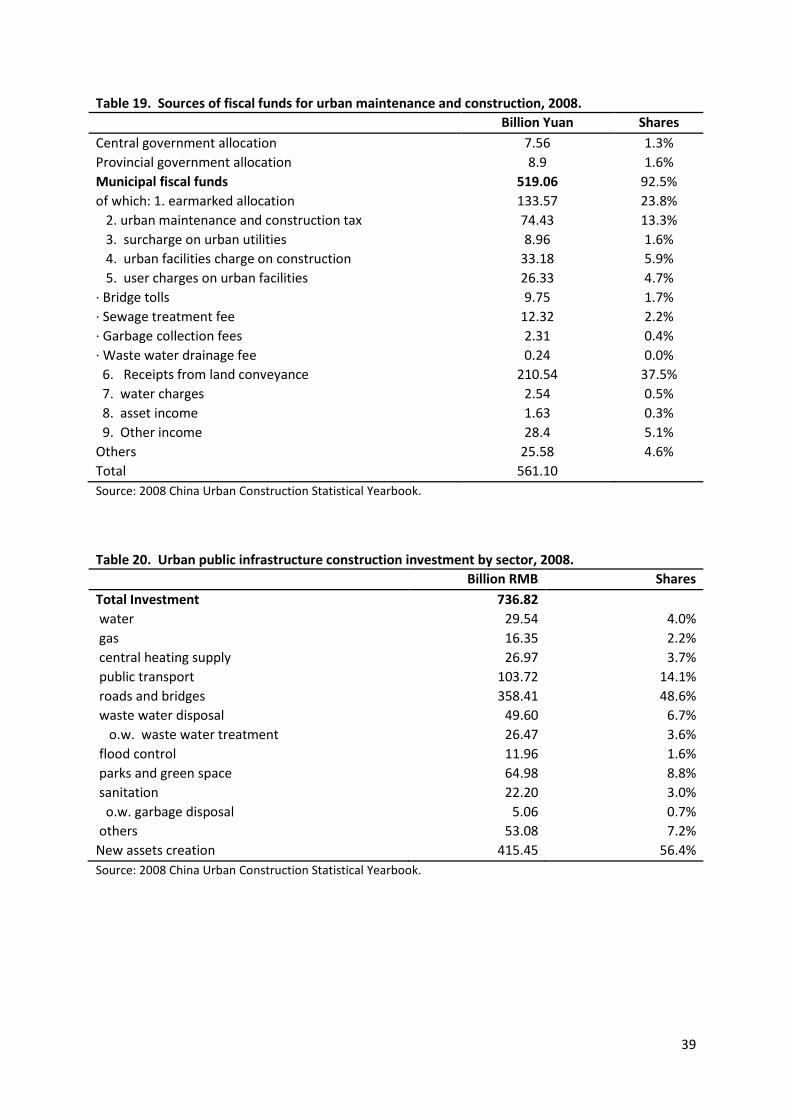
39
Table 19. Sources of fiscal funds for urban maintenance and construction, 2008.
Billion Yuan Shares
Central government allocation 7.56 1.3%
Provincial government allocation 8.9 1.6%
Municipal fiscal funds 519.06 92.5%
of which: 1. earmarked allocation 133.57 23.8%
2. urban maintenance and construction tax 74.43 13.3%
3. surcharge on urban utilities 8.96 1.6%
4. urban facilities charge on construction 33.18 5.9%
5. user charges on urban facilities 26.33 4.7%
· Bridge tolls 9.75 1.7%
· Sewage treatment fee 12.32 2.2%
· Garbage collection fees 2.31 0.4%
· Waste water drainage fee 0.24 0.0%
6. Receipts from land conveyance 210.54 37.5%
7. water charges 2.54 0.5%
8. asset income 1.63 0.3%
9. Other income 28.4 5.1%
Others 25.58 4.6%
Total 561.10
Source: 2008 China Urban Construction Statistical Yearbook.
Table 20. Urban public infrastructure construction investment by sector, 2008.
Billion RMB Shares
Total Investment 736.82
water 29.54 4.0%
gas 16.35 2.2%
central heating supply 26.97 3.7%
public transport 103.72 14.1%
roads and bridges 358.41 48.6%
waste water disposal 49.60 6.7%
o.w. waste water treatment 26.47 3.6%
flood control 11.96 1.6%
parks and green space 64.98 8.8%
sanitation 22.20 3.0%
o.w. garbage disposal 5.06 0.7%
others 53.08 7.2%
New assets creation 415.45 56.4%
Source: 2008 China Urban Construction Statistical Yearbook.

40
Figure H. General Corporation of Shanghai Municipal Property (SMPC)
Source: SASS (1998).
Table 21. LIC debt (year-end 2010).
Agency Number of LICs
LIC debt (RMB trn)
Share of SNG
revenue
Share of GDP
People's Bank of China >10,000 <14.4 355% 36%
China Banking Regulatory Commission 9828 9.1 224% 23%
National Audit Office 6576 5 123% 13%
Source: CSY 2011, and Zhang and Batson (2011).
Budgetary allocation
for urban construction
SMPD
Public goods:
Urban infrastructure:
water, sewerage, roads,
utility hook-ups, etc.
Urban maintenance
and construction tax
Private goods:
Profit-making ventures
in real estate
development
Bond issues
Fees and charges on
public facilities
Rental incomes from
city-owned property
30% of tax-exempted
incomes of
development
Commercial bank
loans