Embed Size (px)
Citation preview

Published in: Journal of Experimental Psychology: Animal Learning & Cognition http://www.apa.org/pubs/journals/xan/index.aspx 2015, vol. 41 (2), pp 137–151 © 2015 American Psychological Association
http://dx.doi.org/10.1037/xan0000054
Pavlovian conditioning and cumulative reinforcement rate
Justin A. Harris, Angela E. Patterson, and Saba Gharaei
The University of Sydney, Australia.
In five experiments using delay conditioning of magazine approach with rats, reinforcement rate was varied either by manipulating the mean interval between onset of the conditioned stimulus (CS) and unconditioned stimulus (US) or by manipulating the proportion of CS presentations that ended with the US (trial‐based reinforcement rate). Both manipulations influenced the acquisition of responding. In each experiment, a specific comparison was made between two CSs that differed in their mean CS‐US interval and in their trial‐based reinforcement rate, such that the cumulative reinforcement rate—the cumulative duration of the CS between reinforcements—was the same for the two CSs. For example, a CS reinforced on 100% of trials with a mean CS‐US interval of 60 s was compared with a CS reinforced on 33% of trials and a mean duration of 20 s. Across the five experiments, conditioning was virtually identical for the two CSs with matched cumulative reinforcement rate. This was true as long as the timing of the US was unpredictable, and thus response rates were uniform across the length of the CS. We conclude that the effects of CS‐US interval and of trial‐based reinforcement rate are reducible entirely to their common effect on cumulative reinforcement rate. We discuss the implications of this for rate‐based, trial‐based and real‐time associative models of conditioning.
Key words: Rat; delay conditioning; magazine approach; variable interval.
Address correspondence to:
Justin Harris School of Psychology University of Sydney Sydney 2006 Australia Tel: +61 2 9351 2864 Email: [email protected]
Author note: The work was supported by grants DP1092695 and FT100100091 from the Australian Research Council.
This article may not exactly replicate the final version published in the APA journal. It is not the copy of record.

HARRIS, PATTERSON & GHARAEI PAVLOVIAN CONDITIONING AND REINFORCEMENT RATE
2
Many models of associative learning identify the content of that learning with a one‐dimensional variable such as associative strength (e.g., Pearce, 1994; Rescorla & Wagner, 1972; Wagner, 1981). The net associative strength of a conditioned stimulus (CS) is updated on every trial, either increasing if the unconditioned stimulus (US) is present, or decreasing if it is absent. Thus associative strength is directly affected by the probability of the US given the CS. The major alternative to associative models argues that animals learn specifically about the temporal relationships between CSs and USs: animals encode and remember when the US occurred relative to the onset (or offset) of the CS (Balsam & Gallistel, 2009; Gibbon, 1977; Kirkpatrick & Church, 2003). One version of this view argues that animals use temporal information to compute reinforcement rate as the frequency of the US per unit time since CS onset (i.e., the reciprocal of the time between CS onset and the US). Responding depends on the comparison between an estimate of the time to reinforcement during the CS (T) with an estimate of the time to reinforcement when the CS is absent (I); when the I/T ratio exceeds a decision threshold, the animal starts to respond to the CS (Gallistel & Gibbon, 2000).
A key point of difference between associative models and rate‐based models of conditioning concerns the role of the trial. A rate‐based model like Rate Estimation Theory (RET) assumes that the content of learning is given by the cumulative time during the CS per reinforcement, and as such, trials play no role in when or how learning proceeds (see Balsam, Drew, & Gallistel, 2010, for a more recent description of rate‐based learning). This contrasts with most associative models of conditioning which assume that the trial is the unit of learning. The simplest case is exemplified by the Rescorla‐Wagner (1972) model, in which the change in associative strength (V) is computed at the end of each trial. Such a simple trial‐based approach cannot account for the observation that conditioned responding is related to reinforcement rate when that rate is manipulated by varying the mean CS‐US interval without varying the proportion of trials that include the US (Harris & Carpenter, 2011). Nonetheless, associative accounts of this sort can accommodate the effect of variations in mean CS‐US interval if V is updated continuously across the course of a trial, effectively dividing the trial into many micro‐trials. Each moment during the CS, prior to the US, is computed as a sequence of non‐reinforced trials. As such, conditioned responding reflects the sum of each increment in V at the time of reinforcement and the cumulative loss of V during the CS leading up to reinforcement. This mechanism is akin to the rate estimation process in RET, inasmuch as V decreases in proportion to the cumulative time during the CS without reinforcement.
The simple associative model described above resembles rate‐based models in arguing that V is proportional to cumulative reinforcement rate. But this is only true for the associative account if the associability of
the CS remains constant at each point in time during its presentation. Associative models that have been developed to describe conditioning in real‐time (as time elapses during a trial) typically argue otherwise. One prominent example is Wagner’s (1981) SOP model, in which the representation of the CS, and thus its associability, gradually decays as time elapses. This predicts that more is learned about reinforcement if it occurs early in a CS presentation than if it occurs late. Another prominent real‐time associative model, the Temporal Difference (TD) model (Sutton & Barto, 1990), assumes that moment‐to‐moment responding during a CS is influenced not only by the rate of reinforcement at each time point but also by the prospect of reinforcement at future time points. In this case, later reinforcements can have a greater overall influence on responding than early ones.
The relationship between CS‐US interval and reinforcement rate has been investigated in a series of experiments by Bouton and Sunsay (2003). In one experiment (Experiment 2 of their paper), four groups of rats were conditioned in a magazine approach paradigm with either a 10‐s or 30‐s CS, reinforced on either 100% or 33% of trials. As expected, rats trained with the 30‐s CS were slower to acquire magazine responses, and responded at a lower rate, than rats trained with the 10‐s CS; rats reinforced on 33% of trials were slower to acquire, and showed less, responding than rats reinforced on 100% of trials. The most interesting comparison was between the 33% group trained with a 10‐s CS and the 100% group trained with a 30‐s CS, since their cumulative CS durations per reinforcement, and thus the reinforcement rates, were equal. Numerically, it appeared that the first group conditioned more quickly and to higher level of responding than the second group, as predicted if the associability of a CS decays as time elapses. However, these differences were not statistically significant. The comparison was also complicated by the fact that the groups differed in their baseline (pre‐CS) response rates.
In another experiment (Experiment 3), Bouton and Sunsay (2003) compared two groups that were conditioned with the same CS‐US interval (10 s) but which differed in the length and number of non‐reinforced exposures of the CS. For one group, reinforced trials were intermixed with an equal number of long (40 s) non‐reinforced presentations of the CS; for the other group, for every reinforced trial there were four short (10 s) non‐reinforced trials. Thus the two groups were matched for cumulative CS exposure per reinforcement (50 s of CS for every US). Despite this, there was faster and stronger conditioning in the group given one 40‐s non‐reinforced CS presentation for every reinforced trial. This result is consistent with a model like SOP which predicts that the two groups would differ in the mean associability of the CS during non‐reinforcement—for the 40‐s group, much of the non‐reinforced exposure would occur when the CS has low associability, whereas for the other group each
HARRIS, PATTERSON & GHARAEI PAVLOVIAN CONDITIONING AND REINFORCEMENT RATE
3
moment of non‐reinforcement would occur when associability was still high (early in the CS presentation).
Bouton and Sunsay’s (2003) experiments suggest that the effect of CS‐US interval on delay conditioning is not simply a function of cumulative reinforcement rate, but depends on trial structure as implied by trial‐based models of learning. This conclusion is at odds with our recent demonstrations that the relationship between response rate and reinforcement rate is the same regardless of how reinforcement rate is distributed across trials (Harris & Carpenter, 2011). However, there is an important difference between our experiments and those reported by Bouton and Sunsay that may well be relevant to this issue. In all the experiments reported by Harris and Carpenter, the CS‐US interval varied randomly from trial to trial, whereas in all the experiments by Bouton and Sunsay the CS‐US interval was fixed for every trial (as is true of most delay conditioning experiments). This means that Bouton and Sunsay’s rats were almost certainly learning the fixed timing of the US, and their response rates as time elapsed during the CS would have varied accordingly, as has been shown in many Pavlovian conditioning paradigms (Church, Meck, & Gibbon, 1994; Davis, Schlesinger, & Sorenson, 1989; Kehoe & Joscelyne, 2005; Pavlov, 1927; Roberts, 1981; Smith, 1968; Williams, Lawson, Cook, Mather, & Johns, 2008). Given this, it is likely that all points in time during the CS were not alike in terms of their impact on what the rats learned about the rate of reinforcement. For example, in Bouton and Sunsay’s Experiment 3, the CS duration was always 10 s on all reinforced trials, and thus the rats would have learned to expect the US at that approximate time. If learning about the absence of the US on non‐reinforced trials depended on when the rats expected the US to occur, then the two critical groups described earlier would not have been equivalent because the 20% group received four non‐reinforced 10‐s CS‐US intervals for every reinforced one, whereas the 50% group received only one non‐reinforced 10‐s CS‐US interval for every reinforced one. Therefore, if conditioning specifically involves learning about when the US will occur during or after the CS (e.g., Balsam et al., 2010), then the reinforcement rate in the first 10 s of the CS was much higher for one group than for the other, which could easily account for the difference in rate and level of conditioning observed.
The present experiments revisit the question of how conditioning is affected by reinforcement rate, and whether learning about non‐reinforcement accumulates across trials or whether it depends on how non‐reinforcement is distributed across trials. The majority of experiments used randomly varying CS‐US intervals to prevent the rats from learning to expect the US at a specific point in time during the CS, and to prevent them from timing their responses accordingly. Previously, we have observed that rats respond at a uniform rate during a CS that has been conditioned using variable CS‐US intervals sampled randomly from a uniform distribution of
intervals (Harris, Gharaei, & Pincham, 2011). The uniform nature of the response rate makes it easier to compare responses between CSs with different mean CS‐US intervals, and removes the possibility that what rats learn about non‐reinforcement might vary as time elapses during the CS if their expectation of the US varies across the length of the CS.
Experiments 1 and 2 in the present series were similar to Experiment 2 in Bouton and Sunsay (2003), but used
entirely within‐subject designs, which ensures a common response baseline and therefore avoids problems arising from differences in response scale, and variable CS‐US intervals. Rats were trained with four CSs, two of which were long and two were short (mean CS‐US intervals were 60 s vs 20 s in Experiment 1, and 30 s vs 10 s in Experiment 2). Within each pair of CSs, one CS was reinforced with a food pellet on every trial (100% reinforcement rate) and the other was reinforced with food on every third trial (33% reinforcement rate). In each case, the key comparison is between the long CS reinforced on 100% of trials and the short CS reinforced on 33% of trials, since both of these CSs have the same cumulative reinforcement rate. To anticipate the results of those experiments, we found no difference in the acquisition of responding to the two CSs being compared. Experiment 3 confirmed this result when CS‐US intervals were variable, but found a difference between CSs with matched cumulative reinforcement when the CS‐US intervals were fixed. Two more experiments also found little evidence for differences in conditioning between short and long CSs with matched reinforcement rate. Finally, because the experiments in this series focused on attempting to confirm a null hypothesis, we performed a Bayesian analysis on the data combined across all experiments to test our conclusion that conditioning was unaffected by CS length when differences in reinforcement rate were eliminated.
Experiment 1
Experiment 1 used a 2x2 factorial within‐subjects design. Rats were conditioned with two short CSs that had a mean duration of 20 s, and two long CSs that had a mean duration of 60 s. Two of the four CSs were reinforced on 100% of trials, and the other two were reinforced on 33% of trials. The design is summarised in the illustration in Figure 1A. Based on previous experiments (Andrew & Harris, 2011; Bouton & Sunsay, 2003; Harris & Carpenter, 2011), we expected significant main effects on both factors, such that the rats would respond less to the long CSs than to the short CSs, and would respond more to the 100% CSs than to the 33% CSs. However, the comparison of particular interest is between rats’ responses to the long 100% CS and the short 33% CS, since these have the same cumulative rate of reinforcement (one US per 60 s of CS). If, as predicted by some real‐time trial‐based models of conditioning and suggested by the results reported in Bouton and Sunsay (2003), conditioning is affected by trial structure, then

HARRIS, PATTERSON & GHARAEI PAVLOVIAN CONDITIONING AND REINFORCEMENT RATE
4
Experiment 1
+ 20‐s 33%
+ 60‐s 33%
+ + + 20‐s 100%
60‐s 100% + + +
A
0
0.1
0.2
0.3
0.4
0.5
0.6
1 5 10 15 20 25 30
Mean response rate /s
Session
20‐s 100% 60‐s 100% 20‐s 33% 60‐s 33% pre CS
B
0
0.1
0.2
0.3
0.4
0.5
0.6
0 20 40 60 80 100
Mean response rate /s
Time (s)
20‐s 100%60‐s 100% 20‐s 33% 60‐s 33% pre CS
C
0
100
200
300
400
20‐s 60‐s 20‐s 60‐s
Med
ian trials to criterion
CS 100% 100% 33% 33%
D
there should be a difference in the rats’ response rates to the two CSs. However, if trial structure is irrelevant and rats simply accumulate learning about non‐reinforcement across CS exposure, then they should show similar levels and rates of conditioning to the two CSs
Methods
Subjects. Thirty‐two experimentally naive male Hooded Wistar rats (Rattus norvegicus; 7 to 10 weeks of age at the start of the experiment) were obtained from the Laboratory Animal Services breeding unit at The University of Adelaide, South Australia. During the experiment, they were housed in groups of 8 in large white plastic tubs, measuring 26 x 59 x 37cm (height x length x depth), located in the animal colony maintained by the School of Psychology at the University of Sydney. They had unrestricted access to water in the home tubs. Three days prior to commencement of the experiment, they were placed on a restricted food schedule. Each day, each tub of rats received a ration of their regular dry chow equal to 5% of the total weight of all rats in the tub.
The food was provided half an hour after the end of the daily training session, and all food was eaten within 3 hrs.
Apparatus. Rats were trained and tested in 16 Med Associates™ conditioning chambers measuring 28.5 x 30 x 25 cm (height x length x depth). The end walls of each chamber were made of aluminum; the sidewalls and ceiling were Plexiglas™. The floor of the chamber consisted of stainless‐steel rods, 0.5 cm in diameter, spaced 1.5 cm apart. Each chamber had a recessed food magazine in the center of one end wall, with an infra‐red LED and sensor located just inside the magazine to record entries by the rat. A small metal cup measuring 3.5 cm in diameter and 0.5 cm deep was fixed on the floor of each food magazine. Attached to the food magazine was a dispenser delivering 45 mg food pellets (purified rodent pellets; Bioserve, Frenchtown, NJ). Each chamber was enclosed in a sound‐ and light‐resistant wooden shell. Throughout all sessions, fans located in the rear wall provided ventilation; the operation of these created a background noise level measuring 70dB. Experimental events were controlled and recorded automatically by computers and relays located in the same room.
Figure 1. A: Design of Experiment 1. Four variable CSs were reinforced with food (+) on either 100% or 33% of trials, after a mean CS duration of either 20 s or 60 s. All CSs had the same number of trials per session. B: Mean response rates during each of the four CSs, and during a 30‐s pre‐CS interval, on each of the 30 sessions of Experiment 1. C: Mean response rate per second of elapsed time during CS presentations, averaged over the last 10 sessions. D: Median number of trials to criterion for each of the four CSs.

HARRIS, PATTERSON & GHARAEI PAVLOVIAN CONDITIONING AND REINFORCEMENT RATE
5
Two auditory and two visual stimuli were presented from four spatially separated sources. White noise (78dB) was presented from a speaker mounted on the wall of each operant chamber above and to the right of the food magazine. A tone (78dB and 2.9 kHz) was produced from a piezo buzzer positioned on the floor of the sound‐attenuating shell behind each operant chamber. A flashing light (2 Hz; 3.0cd/m2) was emitted by a 3x3 array of white LEDs, located on the floor of the sound‐attenuating shell in front of the operant chamber. A steady light (30cd/m2) was produced by an incandescent bulb mounted high on the back wall of the sound‐attenuating shell. The allocation of these four stimuli to the four CSs was counterbalanced across rats, with the constraint that stimuli with the same percent of reinforcement (e.g., the two 100% stimuli), and with the same mean length (e.g., the two 20 s stimuli), did not belong to the same modality.
Procedure. The experiment was initially run with 16 rats, and then replicated 12 months later with another 16 rats. The day before training commenced, the rats received a single 20‐min magazine training session during which 20 food pellets were presented on a variable‐time (VT) 1 min schedule, with no stimulus presentations. The rats then received daily conditioning sessions 5 days per week for a total of 30 sessions. Each session consisted of 12 randomly intermixed presentations of each of the four CSs (48 trials in total). The inter‐trial interval varied randomly according to a uniform distribution with a minimum of 50 s and mean of 120 s. The duration of each CS presentation varied randomly from trial to trial according to a uniform distribution with a mean of either 20 s (2 to 38 s), for two CSs, or 60 s (2 to 118 s), for the other two CSs. For one 20‐s and one 60‐s CS, the termination of every presentation coincided with delivery of a food pellet. For the other two CSs, one third of trials (4 of 12) terminated with food. Across all sessions, the timing of each photo‐beam interruption by head entry into the magazine was recorded during each CS and 30‐s pre‐CS period.
Results and Discussion
There was a significant overall difference in response rate between the two replications, F(1, 30) = 5.85, p = .022. However, in the analyses described below, the replication factor did not interact with any other factor, largest F(1, 30) = 1.64, p = .220. Therefore, for ease of exposition, both sets of data were combined into a single set for description and statistical analyses.
The mean response rates per session during each of the four CSs are shown in Figure 1B. As predicted, rats responded at a higher rate during the short CSs than dur‐ing the long CSs, and they responded more during the CSs reinforced on 100% of trials than during the CSs reinfor‐ced on 33% of trials. These main effects were confirmed by a 2x2x30 ANOVA (with Greenhouse‐Geisser correction to degrees of freedom whenever the analysis failed the test for sphericity). There was a significant difference in
response rates between the short and long CSs, F(1, 31) =
74.26, p < .001, 2p = 0.71 (95% confidence interval on
2p
= 0.60 to 0.81) (Hentschke & Stüttgen, 2011), and a significant difference between the 100% and 33% CSs, F(1,
31) = 70.69, p < .001, 2p = 0.70 (0.59 to 0.81). There was
a significant interaction between these factors, F(1, 31) =
12.70, p = .001, 2p = 0.29 (0.09 to 0.53). There was a
significant main effect of Session, F(4.2, 132) = 11.29, p <
.001, 2p = 0.27 (0.18 to 0.40), that interacted with both
CS duration, F(5, 156) = 15.18, p < .001, 2p = 0.33 (0.24 to
0.45), and percentage reinforcement per trial, F(4.5, 138)
= 14.70, p < .001, 2p = 0.32 (0.24 to 0.43). There was no
triple interaction, F(8.1, 250) = 0.85, p = .698.
The comparison of most interest is between the 20‐s 33% CS and the 60‐s 100% CS. It is clear in Figure 1B that the rats showed virtually identical conditioning to the two CSs. An ANOVA comparing just these two CSs showed there was no difference in overall response rate between them, F(1, 31) = 0.01, p = .916, nor was there an interact‐ion between CS and Session, F(7.2, 223) = 1.81, p = .085.
Because the 20‐s and 60‐s CSs differ in mean length by a large amount, comparing their mean response rates is only valid if those response rates are consistent across the duration of both CSs. To confirm that response rates were indeed stable, Figure 1C shows a plot of the mean response rates for each second of each CS averaged over the last 10 sessions. As expected, response rates rose sharply at the onset of the CS, and remained remarkably stable as time elapsed. Crucially, the pattern of responding across time was very similar for the 60‐s 100% CS and the 20‐s 33% CS. We conducted a 2x35 ANOVA to compare response rates between these CSs over the first 35 s. There was a significant main effect of time, F(4.4,
136) = 3.80, p = .005, 2p = 0.11 (0.07 to 0.21), but no
overall difference between the two CSs, F(1, 31) = 0.73, p = .400, nor was there a significant interaction between CS and time, F(6.6, 203) = 2.05, p = .054.
The absence of any difference in conditioning to the 60‐s 100% CS and the 20‐s 33% CS is surprising given that the two CSs differed in the number of reinforced trials they received per session. According to conventional trial‐based models of conditioning, conditioned responding to the 100% CS should appear in an earlier session than to the 33% CS because the former received three times as many reinforced presentations per session. To explore this issue more fully, we conducted an analysis measuring the point at which each rat began to show reliable responding to each CS. Response rates on each trial were first converted to elevation scores—the response rate per second during the CS minus the response rate per second in the pre‐CS period. These elevation scores were then used to calculate cumulative elevation rates1 across trials
1 We used the cumulative response rates because cumulative records
tend to increase consistently across trials, and therefore only one value needs to be set as a threshold for responding to reach a criterion. By contrast, when setting a criterion for response rates on individual trials, which go up and down a lot, one needs to set a threshold value for the

HARRIS, PATTERSON & GHARAEI PAVLOVIAN CONDITIONING AND REINFORCEMENT RATE
6
for each CS. Reliable responding to the CS, above baseline, would be evident once the cumulative rate exceeded a positive threshold. By contrast, as long as a rat had not learned to respond to a CS, the cumulative elevation rate would remain close to zero. We compared how quickly responding emerged to each CS by calculating the number of trials each rat took to reach the response criterion for each CS. For the purposes of the analyses presented here, we set the threshold to 10, but the results were very similar when other thresholds were used. Wilcoxon signed‐ranks tests were used when comparing the number of trials to criterion between CSs,
with a Bonferroni adjustment to the significance level ( = .017) to take account of multiple comparisons. These median trials‐to‐criterion are shown in Figure 1D. As expected, responding to the 20‐s 100% CS reached the criterion after the fewest trials, and responding to the 60‐s 33% CS reached criterion after the most trials. Importantly, responding to the 60‐s 100% CS and the 20‐s 33% CS reached criterion after similar numbers of trials, z = ‐0.32, p = .749. Therefore, despite the difference in number of reinforcements per session, which should have favored earlier responding to the 60‐s 100% CS, responding emerged to it after the same number of trials as to the 20‐s 33% CS. In contrast to this null result, comparisons between CSs that received the same number of reinforcements per session showed that responding emerged significantly sooner to the 20‐s 100% CS than to the 60‐s 100% CS (median = 103 versus 184.5), z = ‐4.15, p < .001, and emerged significantly sooner to the 20‐s 33% CS than to the 60‐s 33% CS (median = 172.5 versus 361), z = ‐3.31, p < .001. Therefore, a longer mean CS‐US interval, and thus lower mean reinforcement rate, slows the acquisition of responding, as predicted by rate based models. However, it should be noted that the difference in number of trials to criterion was approximately twofold for both comparisons, which is less than the threefold difference in time to acquisition predicted by rate‐based models for CSs that differ threefold in reinforcement rate.
Experiment 2
In Experiment 1, two CSs that were matched for mean CS duration per reinforcement produced equivalent amounts of conditioning. This matching was achieved by providing three times as many reinforcements to the long (60 s) 100% CS as to the short (20 s) 33% CS, while keeping the number of trials of each equal. Because the long CS had three times as many reinforced trials as the short CS, this may have increased the rate of conditioning to the long CS which could have mitigated any difference in conditioning that would otherwise favor the short CS (see Gottlieb, 2008). Experiment 2 addressed this confound by equating CSs for the number of reinforced trials per session; it thus allowed CSs to differ threefold in the number of presentations per session. Experiment 2 also investigated the impact of reinforcement rate using
response rate and also select values for what proportion of trials must remain above this threshold and over what time window.
different rates (different CS durations) from those used in Experiment 1. The durations used here were the same as those used by Bouton and Sunsay (2003) in their Experiment 2. Rats were trained with four variable CSs, two had a mean duration of 10 s and the other two had mean durations of 30 s, and within each pair two CSs were reinforced on every trial (6 out of 6 trials per session) while the other two CSs were reinforced on every third trial (6 out of 18 trials per session). The design is illustrated in Figure 2A.
As for Experiment 1, we would expect more responding to the shorter (10 s) CSs than the longer (30 s) CSs, and more responding to the 100% reinforced CSs than the 33% reinforced CSs. Further, if conditioning depends on mean reinforcement rate, and is not otherwise affected by differences in trial number or length, we would expect equivalent conditioning to the short 33% CS and the long 100% CS.
Methods
Subjects and apparatus. Sixteen experimentally naive male Hooded Wistar rats (8 to 10 weeks of age at the start of the experiment) were obtained from the same source and were housed in the same manner as described for Experiment 1. They were trained and tested in the same 16 Med Associates™ conditioning chambers, with the same two auditory and two visual stimuli as CSs. The allocation of the stimuli to the four CSs was counterbalanced across rats, as in Experiment 1.
Procedure. The rats received magazine training, as in Experiment 1, before commencing daily conditioning sessions 5 days per week for a total of 30 sessions. Each session consisted of randomly intermixed presentations of each of the four CSs: six of each of the 100% CSs, and 18 of each of the 33% CSs (48 trials in total). The inter‐trial interval (US to CS) varied randomly according to a uniform distribution with a minimum of 50 s and mean of 120 s. The duration of each CS varied randomly from trial to trial according to a uniform distribution with a mean of either 10 s (2 to 18 s) or 30 s (2 to 58 s). For the two 100% CSs, the termination of every presentation coincided with delivery of a food pellet. For the other two CSs, one third of trials (six of 18) terminated with food. Across all sessions, the timing of each photo‐beam interruption by head entry into the magazine was recorded during each CS and 30‐s pre‐CS period.
Results and Discussion
The mean response rates per session for each of the four CSs are shown in Figure 2B. As in Experiment 1, rats responded at a higher rate during the short (10 s) CSs than during the long (30 s) CSs, and they responded more during the 100% CSs than during the 33% CSs. Both main effects were confirmed by a 2 x 2 x 30 repeated measures ANOVA (with Greenhouse‐Geisser correction). There was a significant difference in response rates between the
short and long CSs, F(1, 15) = 32.02, p < .001, 2p = 0.68
HARRIS, PATTERSON & GHARAEI PAVLOVIAN CONDITIONING AND REINFORCEMENT RATE
7
Experiment 2
0
0.2
0.4
0.6
0.8
1
1.2
1 5 10 15 20 25 30
10‐s 100% 30‐s 100% pre CS
10‐s 33% 30‐s 33%
Mean response rate /s
Session
0
0.2
0.4
0.6
0.8
1
1.2
1 10 20 30 40 50
Mean response rate /s
Time (s)
+ 10‐s 100%
30‐s 100% +
+ 10‐s 33%
+ 30‐s 33%
0
10
20
30
40
50
60
70
10‐s 30‐s 10‐s 30‐s
Med
ian trials to criterion
CS
A B
C D
10‐s 100% 30‐s 100% pre CS
10‐s 33%30‐s 33%
100% 100% 33% 33%
Figure 2. A: Design of Experiment 2. Four variable CSs were reinforced with food (+) on either 100% or 33% of trials, after a mean CS duration of either 10 s or 30 s. CSs reinforced on 33% of trials were three times as frequent as CSs reinforced on 100% of trials, thus matching all CSs for the number of reinforced trials per session. B: Mean response rates during each of the four CSs, and during a 10‐s pre‐CS interval, on each of the 30 sessions of Experiment 2. C: Mean response rate per second of elapsed time during CS presentations, averaged over the last 10 sessions. D: Median number of reinforced trials to criterion for each of the four CSs.
(95% confidence interval on 2p = 0.51 to 0.84), and
between the 100% and 33% CSs, F(1, 15) = 26.35, p < .001,
2p = 0.64 (0.52 to 0.83). There was no significant
interaction between these factors, F(1, 15) = 1.82, p = .197. There was a significant main effect of Session, F(2.2,
34) = 12.93, p < .001, 2p = 0.46 (0.32 to 0.67), that
interacted with the percent of reinforcement per trial,
F(6.2, 93) = 2.63, p = .020, 2p = 0.15 (0.13 to 0.30), but
not with CS duration F(6.6, 99) = 1.75, p = .111. There was no significant triple interaction, F(6.1, 92) = 1.70, p =.129.
It is clear in Figure 2B that response rates to the 10‐s 33% CS and the 30‐s 100% CS were similar. An ANOVA showed there was no significant difference in overall response rate between these two CSs, F(1, 15) = 1.01, p = .330, nor was there an interaction between the CSs and Session, F(4.4, 66) = 1.38, p = .250. To find out whether response rates to the CSs were stable across elapsed time during the trial, Figure 2C shows a plot of the mean response rates for each second of each CS averaged over
the last 10 sessions. Response rates rose sharply at the onset of the CS, and remained steady. This pattern was very similar for the 30‐s 100% CS and the 10‐s 33% CS. A 2x18 ANOVA compared response rates between these CSs over the first 18 s. There was a significant main effect of
time, F(4.3, 65) = 4.80, p = .001, 2p = 0.24 (0.12 to 0.48),
but no overall difference between the two CSs, F(1, 15) = 1.57, p = .229, nor was there a significant interaction between CS and time, F(7.2, 108) = 1.47, p = .184.
As for Experiment 1, we also conducted an analysis of the speed of acquisition by calculating the point at which responding exceeded a criterion. In this experiment, the different CSs were all matched for number of reinforced trials per session, and therefore we were able to calculate reinforcers‐to‐criterion, rather than trials‐to‐criterion. We computed the cumulative sum of elevation scores (response rate during the CS minus pre‐CS response rate) across all trials for the 100% reinforced CSs and across one in three trials for the 33% reinforced CSs. For this

HARRIS, PATTERSON & GHARAEI PAVLOVIAN CONDITIONING AND REINFORCEMENT RATE
8
analysis we used every third trial of the 33% CSs, rather than selecting the reinforced trials, because the latter method would tend to select trials that followed a long gap since last reinforcement. We then identified the trial at which this cumulative elevation score exceeded a criterion of 10, as had been used in Experiment 1. The results are shown in Figure 2D. Wilcoxon signed‐ranks tests were used when comparing the number of reinforcements to criterion between CSs, with a
Bonferroni adjustment to the significance level ( = .017). The median number of reinforcements to criterion was lowest for the 10‐s 100% CS, highest for the 30‐s 33% CS, and similar for the other two. Not surprisingly, reinforcements to criterion did not differ between the 10‐s 33% CS and the 30‐s 100% CS, z = 0.49, p = .624. Comparing CSs that differed in mean length but received an equal number of trials per session showed that reinforcements to criterion did not differ between the 10‐s 100% CS (median = 36.5) and the 30‐s 100% CS (median = 44.5), z = 1.03, p = .303. However, the difference between the 10‐s 33% CS (median = 39.5) and the 30‐s 33% CS (median = 59) was significant, z = 2.95, p = .003. In sum, conditioned responding emerged at the same point for the two CSs that had matched reinforcement rates, as predicted by time accumulation models of condition. However, the evidence was mixed concerning differences in the point at which responding emerged to two CSs that differed threefold in reinforcement rate. Even when there was a significant difference (between the 10‐s 33% CS and the 30‐s 33% CS), the difference was relatively small (reinforcements to criterion were 50% greater for the 30‐s CS) whereas time accumulation models would predict a threefold difference in the point at which responding would emerge. In this regard, it is worth pointing out that the particular results we report above are not specific to the particular criterion score used here (a cumulative elevation rate = 10), and different thresholds produced very similar results.
Experiment 3
Experiments 1 and 2 failed to find any reliable difference in rats’ response rates to two CSs that had a threefold difference in their mean durations and differed threefold in the proportion of trials that were reinforced, if the overall reinforcement rate (per unit time) was equated for the two CSs. Thus our experiments did not confirm the difference in responding that was evident, although not statistically significant, in Experiment 2 of Bouton and Sunsay (2003). This is despite the fact that our within‐subjects design should be more sensitive to differences between conditions than their between‐subjects design. An important difference between the experiments is that Bouton and Sunsay used fixed duration CSs whereas the CSs in our experiments had variable durations. Therefore, it is likely that the rats in Bouton and Sunsay’s experiment learned to time their responses to the fixed length of the CSs, whereas the rats in our experiments would not have learned to time their responses.
Experiment 3 was designed to test whether using fixed versus variable CS durations affected the comparison between CSs with matched reinforcement rate but differing in length and percentage of reinforcement. Two groups of rats were each trained with two CSs. For one group (“Fixed”), one CS had a fixed duration of 10 s, and the other CS had a fixed duration of 30 s. For the other group (“Variable”), the durations of the CSs varied from trial to trial, with a mean of 10 s or 30 s. For both groups, the short CS was reinforced on 33% of trials and the long CS was reinforced on 100% of trials. The design is illustrated in Figure 3. Based on the results of Experiments 1 and 2, we expected that the Variable group would acquire very similar response rates to the two CSs. We also expected that their responses to the CSs would be uniform across time within each CS presentation because the rats could not learn to time their responses. We predicted different results for the rats in the Fixed group. Based on the observations reported by Bouton and Sunsay (2003), we expected that the rats would respond more to the 30‐s CS than to the 10‐s CS. We also expected that these rats would learn to time their responses to peak near the end of each CS presentation, and therefore the pattern of responding within the trial would differ for the 10‐s and 30‐s CSs.
Methods
Subjects and apparatus. Thirty‐two experimentally naive female albino Sprague Dawley rats (8 weeks of age at the start of the experiment) were obtained from the Animal Resources Centre in Perth, Western Australia. The change in rat strain was a consequence of a switch in supplier. The rats were housed in groups of four in split‐level ventilated plastic boxes (TechniplastTM) measuring 40 x 46 x 40cm (length x width x height), located in the animal colony maintained by the School of Psychology at the University of Sydney. Other details of housing were the same as described for Experiment 1. The rats were trained and tested in the same 16 Med Associates™ conditioning chambers, with one auditory and one visual stimulus (white noise and steady light). The allocation of the stimuli as CSs was counterbalanced across rats.
Procedure. The rats received magazine training, before commencing daily conditioning sessions 5 days per week for a total of 30 sessions. Each session consisted of randomly intermixed presentations of two CSs: 12 presentations of one CS that was reinforced on 100% of trials, and 36 presentations of the second CS that was reinforced on 33% of trials. For rats in the Variable group (n=16), the duration of each CS varied randomly from trial to trial according to a uniform distribution with a mean of 30 s (2 to 58 s) for the 100% CS and a mean of 10 s (2 to 18 s) for the 33% CS. For rats in the Fixed group (n=16), each presentation of the 100% CS was exactly 30 s long, and each presentation of the 33% CS was exactly 10 s long. For both groups, the inter‐trial interval (US to CS) varied randomly according to a uniform distribution with a minimum of 40 s and mean of 120 s. Across all sessions,

HARRIS, PATTERSON & GHARAEI PAVLOVIAN CONDITIONING AND REINFORCEMENT RATE
9
Experiment 3
30‐s 100% + +
+ 10‐s 33%
+
Group Fixed A
30‐s 100%+ +
+ 10‐s 33%
+
Group Variable BMean response rate /s
0
0.1
0.2
0.3
0.4
0.5
0.6
0.7
1 5 10 15 20 25 30
Day
30‐s 10‐s pre CS
Group Fixed C
0
0.1
0.2
0.3
0.4
0.5
0.6
0.7
1 5 10 15 20 25 30
Mean response rate /s
Session
30‐s10‐s pre CS
Group Variable D
0
0.2
0.4
0.6
0.8
1 5 10 15 20 25 30 35 40 45 50 55
Fixed 30‐s
Fixed 10‐s Variable 30‐s Variable 10‐s
Mean response rate /s
Time (s)
E
0
20
40
60
80
100
120
140
Fixed Variable
Med
ian trials to criterion
Group
F
30‐s 10‐s
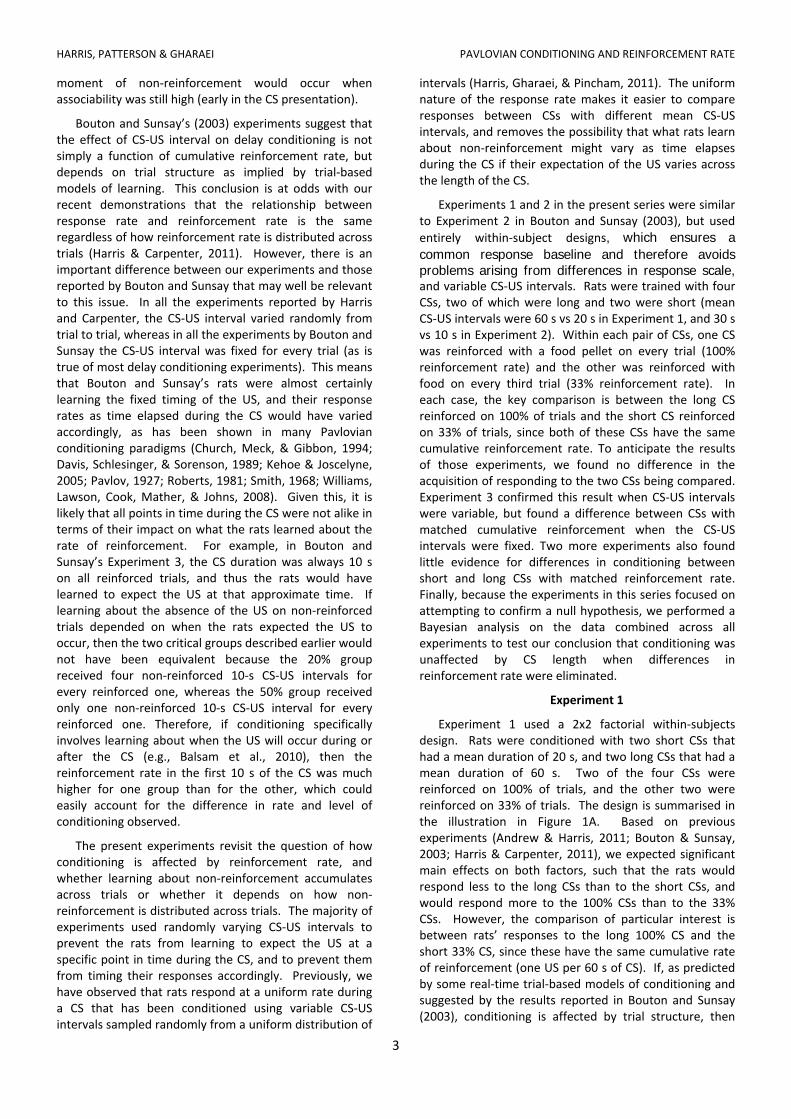
Figure 3. A and B: Design of Experiment 3. Two groups of rats were trained with two CSs that were reinforced with food (+) on either 100% or 33% of trials. For Group Fixed, the 100% CS had a fixed duration of 30‐s, and the 33% CS had a fixed duration of 10‐s; For Group Variable, the 100% CS had a variable duration with a mean of 30‐s, and the 33% CS had a variable duration with a mean of 10‐s. There were three times as many trials per session with the 33% CS than the 100% CS, such that they were equated for number of reinforced trials per session. C and D: Mean response rates during the two CSs, and during a pre‐CS interval, across all 30 sessions, for the two groups. E: Mean response rate per second of elapsed time during CS presentations, averaged over the last 10 sessions. F: Median number of reinforced trials to criterion for each CS for both groups.
the timing of each photo‐beam interruption by head entry into the magazine was recorded during each CS and 20‐s pre‐CS period.
Results and Discussion
The mean response rates to both CSs across sessions for both groups are shown in Figure 3C and 3D. While response rates to the two CSs were very similar for the rats in the Variable group, there is evidence of differences between the two CSs in the Fixed group. In the latter group, responding to the 30‐s (100%) CS appeared to rise at an earlier point of training, but responding reached a
higher asymptote to the 10‐s (33%) CS. Baseline (pre‐CS) response rates were very similar between the two groups.
An ANOVA of the pre‐CS response rates found that there was no significant difference in overall response rates between the groups, F(1, 30) = 0.43, p = .515. There was a significant change in pre‐CS response rate across
sessions, F(4.9, 148) = 7.30, p < .001, 2p = 0.20, but this
did not interact with Group, F(4.9, 148) = 0.74, p = .596. An ANOVA of response rates during the CSs also found there was no overall difference between the two groups, F(1, 30) = 0.00, p = .955. There was no overall difference

HARRIS, PATTERSON & GHARAEI PAVLOVIAN CONDITIONING AND REINFORCEMENT RATE
10
between the two CSs, F(1, 30) = 1.53, p = .225, and this did not interact with Group, F(1, 30) = 0.72, p = .402. There was a significant main effect for Sessions, F(4.0,
119) = 20.80, p < .001 , 2p = 0.41, that did not interact
with Group, F(4.0, 119) = 0.78, p = .541, but did interact
with CS, F(3.6, 107) = 3.43, p = .014, 2p = 0.10. Finally,
there was a significant three‐way interaction between CS,
Group and Sessions, F(3.6, 107) = 6.18, p < .001 , 2p =
0.17. Trend analyses showed that this three‐way interaction was for the linear trend across sessions, F(1,
30) = 32.04, p < .001 , 2p = 0.52, meaning that there was
a significantly larger difference between the two CSs in their linear trends across sessions for the Fixed group than for the Variable group. The nature of the interaction was explored with separate ANOVAs run on each group. In the Fixed group, response rates did not differ between the two CSs overall, F(1, 15) = 1.56, p = .231, but there was a significant interaction between CS and Sessions,
F(2.8, 41) = 5.46, p = .004 , 2p = 0.267, and this took the
form of a significant difference in linear trend across sessions between the two CSs, F(1, 30) = 30.62, p < .001,
2p = 0.67. In the Variable group, there was no difference
in response rates overall between the CSs, F(1, 30) = .13, p = .728, nor was there an interaction between Sessions and CS, F(6.7, 100) = 1.44, p = .201. Therefore, there were differences between the two CSs when their durations were fixed (as evident in Figure 3C) but not when their durations were variable (Figure 3D).
Figure 3E shows the mean response rates as time elapsed during each CS presentation, averaged over the last 10 sessions of the experiment. It is clear that response rates to the variable CSs were largely steady across time. By contrast, there was a conspicuous gradient to response rates to the two fixed CSs, with response rates peaking at the end of each CS, at the time when food would have been delivered. For each group, we conducted an ANOVA comparing response rates across time for the time period that was common to both CSs. For the Fixed group, a 2x10 ANOVA showed there was a significant main effect of time, F(1.3, 20) = 23.26, p
< .001, 2p = 0.61 (0.49 to 0.83), and a significant overall
difference between the two CSs, F(1, 15) = 23.56, p < .001,
2p = 0.61 (0.47 to 0.83), as well as a significant
interaction between CS and time, F(2, 30) = 20.69, p <
.001, 2p = 0.58 (0.44 to 0.78). A trend analysis showed
that there was a significant interaction between CS and
linear trend across time, F(1, 15) = 31.34, p < .001, 2p =
0.68. For the Variable group, a 2x18 ANOVA showed that there was a significant main effect for time, F(4.5, 68) =
5.11, p = .001, 2p = 0.25 (0.18 to 0.43), but there was no
overall difference between the two CSs, F(1, 15) = 1.40, p = .256. There was, however, a significant interaction
between CS and time, F(4.9, 73) = 8.13, p < .001, 2p =
0.35 (0.29 to 0.50), which took the form of a significant interaction between CS and linear trend across time, F(1,
15) = 25.69, p < .001, 2p = 0.63. As can be seen in Figure
3E, this interaction was due to the fact that responding took a few seconds to emerge after onset of the 30‐s CS,
but responding emerged more immediately for the 10‐s CS. Nonetheless, beyond those first few seconds, response rates to both CSs were very similar and steady across time.
As for the previous experiments, we also compared the rate of conditioning to the different CSs in terms of reinforcements to criterion, using the same criterion as for Experiments 1 and 2. The median numbers of reinforcements to criterion for both CSs for both groups are shown in Figure 3F. It is clear that responding to the 30‐s CS emerged sooner than to the 10‐s CS for the Fixed group (median trials to criterion = 58.5 and 126.5). The difference in reinforcements to criterion was significant according to a Wilcoxon signed‐ranks test, z = 3.36, p < .001. There was also a significant difference in reinforcements to criterion between the two CSs for the Variable group, z = 2.07, p = .038, although in this case responding emerged slightly sooner to the 10‐s CS (median = 62.5) than to the 30‐s CSs (74).
This experiment has again found there to be no detectable differences in response rates to two CSs that differ three‐fold in length and percent reinforcement when the CSs are matched for cumulative reinforcement rate, as long as the durations of the CSs vary from trial to trial. There was a small but significant difference in number of reinforced trials to criterion favouring the shorter CS. At this stage we are reluctant to place much weight in this one difference given that there was no evidence for such a difference in the previous two experiments (or in the next two experiments).
When CSs have fixed durations, there were consistent differences between CSs with different lengths despite matching their overall rates of reinforcement. This distinction between fixed and variable CSs was accompanied by clear differences in the pattern of responding within the trial, in that response rates were elevated but remained flat as time elapsed during presentations of the variable CSs, whereas response rates showed a clear temporal gradient for the fixed CSs. The fact that the temporal gradients differed between the two fixed CSs identifies a confound when attempting to compare their overall response rate. This underscores the advantage of using variable rather than fixed CS‐US intervals when comparing between CSs of different length.
Experiment 4
The previous three experiments have found little evidence for differences in conditioned responding between variable CSs that differed threefold in their mean durations and in the percent of reinforcement, when their overall reinforcement rates were matched. Experiment 4 examined this issue by comparing CSs that differed fivefold in duration and percent of reinforcement. As illustrated in Figure 4, the rats were trained with four CSs that had mean durations of either 12 s or 60 s, and were reinforced on either 100% of trials or 20% of trials. The

HARRIS, PATTERSON & GHARAEI PAVLOVIAN CONDITIONING AND REINFORCEMENT RATE
11
critical comparison was between two CSs that differed fivefold in both duration and percent of reinforcement but had matched reinforcement rates per unit time. The design is shown in Figure 4A.
Methods
Subjects and apparatus. Sixteen experimentally naive female hooded Wistar rats (12 weeks of age at the start of the experiment) were obtained from the same source as the rats in Experiments 1 and 2. (This experiment and the next one were run before Experiment 3.) The rats were housed in the same manner as described for Experiment 1. They were trained and tested in the same 16 Med Associates™ conditioning chambers, with the same two auditory and two visual stimuli as CSs. The allocation of the stimuli to the four CSs was counterbalanced across rats using a Latin square, with the constraints that B and C were always from different modalities.
Procedure. The rats received magazine training, as in Experiment 1, before commencing daily conditioning sessions 5 days per week for a total of 30 sessions. Each session consisted of randomly intermixed presentations of four CSs: there were six presentations of each of two CSs reinforced on 100% of trials, and 30 presentations of each of two CSs reinforced on 20% of trials (six of 30). One of the 100% CSs and one of the 20% CSs were short (mean duration = 12 s, range = 2 to 22 s); the other two CSs were long (mean duration = 60 s, range = 2 to 118 s). The inter‐trial interval (US to CS) varied randomly according to a uniform distribution with a minimum of 20 s and mean of 72 s. Across all sessions, the timing of each photo‐beam interruption by head entry into the magazine was recorded during each CS and 12‐s pre‐CS period.
Results and Discussion
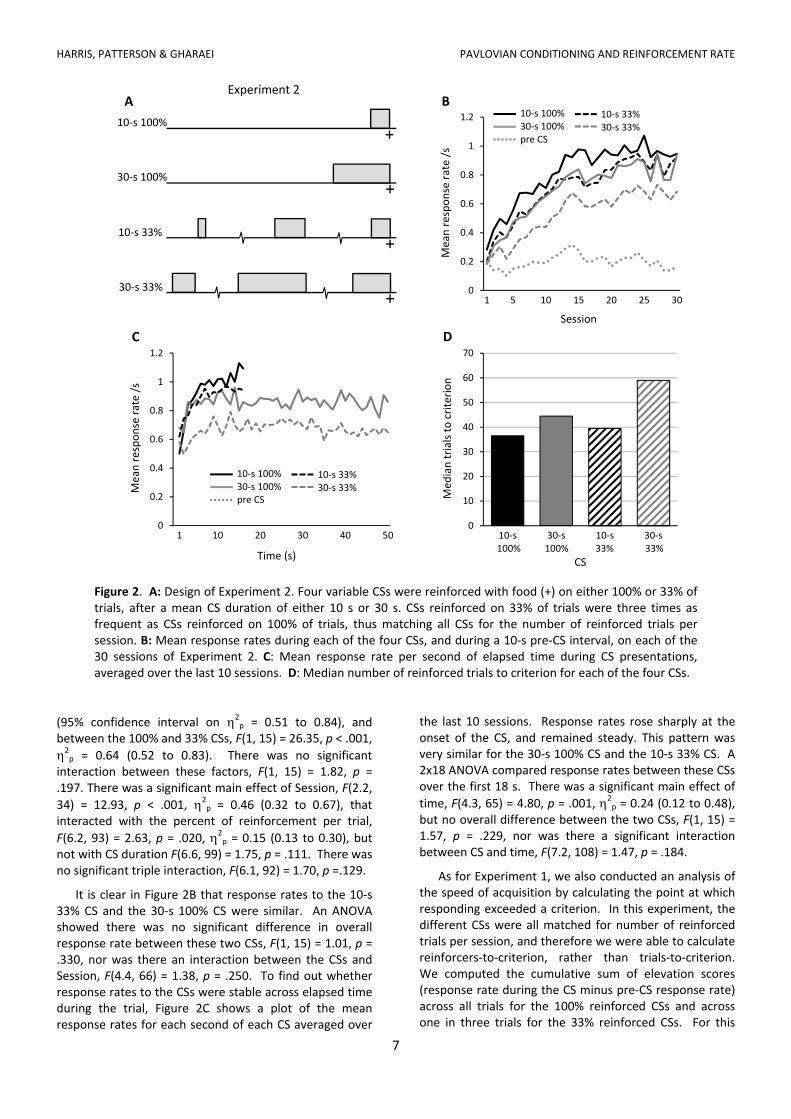
Figure 4B shows the mean response rate to each of the four CSs on each session of the experiment. Across the 30 sessions of training, the rats responded more to the two 12‐s CSs than to the two 60‐s CSs, and they responded more to the two 100%‐reinforced CSs than to the two 20%‐reinforced CSs. A 2x2x30 within‐subjects ANOVA, with Greenhouse‐Geisser correction, confirmed that there was a significant main effect for CS duration,
F(1, 15) = 36.46, p < .001, 2p = 0.71 (95% confidence
interval on 2p = 0.58 to 0.85), and a significant main
effect for percent reinforcement, F(1, 15) = 50.04, p <
.001, 2p = 0.77 (0.65 to 0.90), as well as a significant
interaction between these main effects, F(1, 15) = 26.47,
p < .001, 2p = 0.64 (0.47 to 0.81). There was a significant
main effect for Sessions, F(4.7, 70) = 5.40, p < .001, 2p =
0.27 (0.19 to 0.43), that interacted with both CS duration,
F(5.7, 87) = 7.97, p < .001, 2p = 0.35 (0.28 to 0.48), and
percent reinforcement, F(6.5, 98) = 7.83, p < .001, 2p =
0.34 (0.27 to 0.50). There was a significant triple interaction between all three factors, F(6.2, 93) = 4.84, p <
.001, 2p = 0.24 (0.21 to 0.39).
The comparison of key interest is between responding to the 60‐s 100% CS and responding to the 12‐s 20% CS, since these are matched for cumulative reinforcement rate. Responding to these two CSs appeared to be very similar across the 30 sessions. An ANOVA comparing just these two CSs showed that the overall level of responding did not differ significantly between them, F(1, 15) = 1.79, p = .201, nor was there an interaction between them across sessions, F(5.1, 77) = 1.03, p = .409. Response rates per second across elapsed time during each of the CSs are shown in Figure 4C. Response rates to the 60‐s 100% CS showed some gradual decline over the full length of the longest presentations (up to 120 s). Nonetheless, response rates to this CS were very similar to the 12‐s 20% CS when compared over their shared length (22 s). A 2x22 ANOVA showed there was a significant main effect
of time, F(3.4, 51) = 2.89, p = .038, 2p = 0.16 (0.10 to
0.33), but no difference between the two CSs, F(1, 15) = 0.77, p = .394, and no interaction between CS and time, F(4.9, 73) = 0.97, p = .501.
To compare how quickly responding emerges to the different CSs, we calculated the number of reinforced trials to reach a response criterion. For each rat, we calculated the number of reinforced trials taken for the cumulative elevation rate for each CS to reach a criterion of 5. This criterion was selected because response rates were much lower than in the previous experiments, and a majority of rats failed to reach the higher criterion used in those earlier experiments. The median number of reinforcements to criterion for each CS is shown in Figure 4D. Wilcoxon signed‐ranks tests compared the number of trials to criterion between CSs, with a Bonferroni
adjustment to the significance level ( = .017). As previously, responding reached the criterion to the 12‐s 100% CS after the fewest reinforced trials, and to the 60‐s 20% CS after the most reinforced trials. Of particular interest to the present objectives, responding reached criterion after the same number of reinforced trials (median = 76.5) for the 60‐s 100% CS and the 12‐s 20% CS, z = 0, p = 1. When comparing between other pairs of CSs, there was an approximately twofold difference in the reinforcements to criterion between the 12‐s 100% CS and the 60‐s 100% CS (medians = 35.5 and 76.5), as well as between the 12‐s 20% CS and the 60‐s 20% CS (medians = 76.5 and 150). The first of these differences was significant, z = ‐3.44, p < .001, but the second fell short of statistical significance, z = ‐1.85, p = .064. The twofold differences in reinforcements to criterion between the two 100% CSs and between the two 20% CSs are well short of the fivefold difference anticipated by time accumulation models.
This experiment, like those before it, has found no evidence for a difference in conditioned responding to two variable CSs that have matched cumulative reinforcement rate. This is in spite of the fact that, in this experiment, the CSs in question differed fivefold in mean duration and in the percentage of trials that were reinforced.

HARRIS, PATTERSON & GHARAEI PAVLOVIAN CONDITIONING AND REINFORCEMENT RATE
12
Experiment 4
+ 60‐s 100%
+ 12‐s 20%
12‐s 100% +
[+60‐s 20%
A
0
0.1
0.2
0.3
0.4
0.5
0.6
0.7
0 10 20 30 40 50 60 70 80 90 100 110
12‐s 100%
60‐s 100% 12‐s 20% 60‐s 20% pre CS
Mean response rate /s
Time (s)
C
0
0.1
0.2
0.3
0.4
0.5
0.6
0.7
1 5 10 15 20 25 30
12‐s 100% 60‐s 100% 12‐s 20% 60‐s 20% pre CS
Session
Mean response rate /s
B
0
20
40
60
80
100
120
140
160
12‐s 60‐s 12‐s 60‐s
Med
ian trials to criterion
100%
CS 100% 20% 20%
D
Figure 4. A: Design of Experiment 4. Four variable CSs were reinforced with food (+) on either 100% or 20% of trials, after a mean CS duration of either 12 s or 60 s. CSs reinforced on 20% of trials were five times as frequent as CSs reinforced on 100% of trials, thus matching all CSs for the number of reinforced trials per session. B: Mean response rates during each of the four CSs, and during a 12‐s pre‐CS interval, on each of the 30 sessions. C: Mean response rate per second of elapsed time during CS presentations, averaged over the last 10 sessions. D: Median number of reinforced trials to criterion for each of the four CSs.
Experiment 5
Most of the previous experiments varied CS duration and percent reinforcement in a 2x2 factorial design, ensuring that two stimuli shared the same cumulative reinforcement rate. Experiment 5 abandoned this factorial design, and instead parametrically varied length and percent reinforcement between four CSs such that all shared the same cumulative reinforcement rate. One CS had a mean length of 100 s and was reinforced on 100% of trials, another had a mean length of 50 s and was reinforced on 50% of trials, a third had a mean length of 25 s and was reinforced on 25% of trials, and the fourth had a mean length of 12.5 s and was reinforced on 12.5% of trials. This allowed us to systematically test the impact of CS length and percent reinforcement across an eightfold range. The design is shown in Figure 5A. A systematic effect of either CS length or percent reinforcement, independent of their effects on cumulative reinforcement rate, would be reflected in a linear trend across the four groups.
Methods
Subjects and apparatus. Sixteen experimentally naive female hooded Wistar rats (12 weeks of age at the start of the experiment) were obtained from the same source as the rats in Experiment 1. They were housed in the same manner as described for Experiment 1. They were trained and tested in the same 16 Med Associates™ conditioning chambers, with the same two auditory and two visual stimuli as CSs. The allocation of the stimuli to the four CSs was counterbalanced across rats using a Latin square.
Procedure. The rats received magazine training, as in Experiment 1, before commencing daily conditioning sessions 5 days per week for a total of 30 sessions. Each session consisted of randomly intermixed presentations of four CSs: there were six presentations of one CS with a mean duration of 100 s (range from 1 to 199 s) and rein‐forced with a food pellet on 100% of trials; 12 presen‐tations of a second CS with a mean duration of 50 s (1 to 99 s) and reinforced on 50% of trials; 24 presentations of

HARRIS, PATTERSON & GHARAEI PAVLOVIAN CONDITIONING AND REINFORCEMENT RATE
13
Experiment 5
+ 25‐s 25%
100‐s 100% +
+ 12.5‐s 12.5%
+ 50‐s 50%
A
0
0.05
0.1
0.15
0.2
0.25
0.3
1 5 10 15 20 25 30
Session
Mean response rate /s
100‐s 100% 50‐s 50% 25‐s 25% 12.5‐s 12.5% pre CS
B
0
0.05
0.1
0.15
0.2
0.25
0.3 100‐s 100%
50‐s 50% 25‐s 25% 12.5‐s 12.5% pre CS
Mean response rate
1 20 100 60 80 120 140 160 18040 Time (s)
C
0
20
40
60
80
100
120
140
160
180
100s 50s 25s 12.5s0
20
40
60
80
100
120
140
160
180
100‐s 50‐s 25‐s 12.5‐s
Med
ian trials to criterion
CS
D
100% 50% 25% 12.5%
Figure 5. A: Design of Experiment 5. Four variable CSs were reinforced with food (+) on either 100%, 50%, 25% or 12.5% of trials, after a mean duration of either 100 s, 50 s, 25 s, or 12.5 s. The frequency of each CS was inversely proportional to its percent of reinforcement, such that all CSs received the same number of reinforced trials per session. B: Mean response rates during each of the four CSs, and during a 12‐s pre‐CS interval, on each of the 30 sessions. C: Mean response rate per second of elapsed time during CS presentations, averaged over the last 10 sessions. D: Median number of reinforced trials to criterion for each of the four CSs.
a third CS with a mean duration of 25 s (1 to 49 s) and reinforced on 25% of trials; and 48 presentations of the fourth CS with a mean duration of 12.5 s (1 to 24 s) and reinforced on 12.5% of trials. The inter‐trial interval (US to CS) varied randomly according to a uniform distribution with a minimum of 20 s and mean of 70 s. Across all sessions, the timing of each photo‐beam interruption by head entry into the magazine was recorded during each CS and 12‐s pre‐CS period.
Results and Discussion
As shown in Figure 5B, response rates were on the whole lower than in previous experiments because all four CSs had low reinforcement rates. Nonetheless, there appear to be small differences between some of the CSs. An overall ANOVA confirmed that there was a main effect
for CS, F(2.3, 34) = 4.02, p =.023, 2p = 0.21 (95%
confidence interval on 2p = 0.11 to 0.40). There was no
significant main effect of Session, F(3.4, 51) = 1.70, p = .173, nor was there an interaction between Session and CS, F(4.9, 74) = 1.44, p = .222. Trend analyses on the factor CS showed there to be a significant linear trend,
F(1, 15) = 6.42, p =.023, 2p = 0.30, and a significant cubic
trend, F(1, 15) = 10.88, p = .005, 2p = 0.42, but no quad‐
ratic trend, F(1, 15) = 0.08, p = .777. A follow‐up analysis compared response rates between the 100‐s 100% CS and the 12.5‐s 12.5% CS, these being the CSs that differed by the greatest margin in length and percentage reinforce‐ment. Response rates to the two CSs did not differ significantly overall, F(1, 15) = 4.06, p = .062, nor was there an interaction between the CSs and the change in response rates across sessions, F(5.5, 83) = 1.80, p = .115.

HARRIS, PATTERSON & GHARAEI PAVLOVIAN CONDITIONING AND REINFORCEMENT RATE
14
Response rates across elapsed time during the CS presentations, averaged over the last 10 sessions, are shown in Figure 5C. For clarity, response rates in the figure were averaged across 2‐s bins. Response rates were generally steady across the trial for all CSs. A 4x24 ANOVA compared responding across each of the first 24 s of each CS (the time period in common to all four CSs). There was a significant main effect of CS, F(1.4, 21) = 9.08,
p = .003, 2p = 0.38 (0.26 to 0.55), and a significant main
effect of time, F(4.3, 64) = 2.84, p = .029, 2p = 0.16 (0.12
to 0.36), but there was no interaction between CS and time, F(4.9, 73) = 0.92, p = .663. Therefore, while response rates did differ between the CSs, even when analysing only the first 24 s of the trials, the CSs did not differ in the pattern of responding across elapsed time in the trial.
To analyse rate of acquisition of responding to each CS, we calculated the number of reinforced trials taken for each rat’s cumulative elevation score to each CS to reach a criterion of 4. (This value was chosen because the majority of rats reached this criterion for all CSs.) The median number of reinforced trials to criterion for each CS is shown in Figure 5D. The rats reached the response criterion sooner for CSs A and B than C or D, consistent with the overall greater response rate to A and B than to C and D. Wilcoxon signed‐ranks tests were used to compare the number of trials to criterion between all pairs of CSs, with a Bonferroni adjustment to the significance level (alpha = .008) to take account of multiple comparisons. These tests showed that the only comparison to reach the adjusted level of significance was between the 100‐s 100% CS and the 12.5‐s 12.5% CS, z = 2.66, p = .008. The comparison between the 50‐s 50% CS and the 12.5‐s 12.5% CS fell short of significant, z = 2.35, p = .019, as did the difference between 50‐s 50% CS and the 25‐s 25% CS, z = 2.13, p = .033, and the difference between 100‐s 100% CS and the 25‐s 25% CS, z = 1.85, p = .064. All other comparisons were well short of significant, largest z = 0.88, p = .379.
This experiment has produced the first statistically significant evidence for a difference in response rates between CSs that have the same cumulative reinforcement rate but different mean lengths and percentage of trials that are reinforced. A significant linear trend across the CSs showed that response rates tended to be higher to longer CSs with a higher percentage of reinforcement than to shorter CSs with a lower percentage of reinforcement. However, a significant cubic trend in the data showed that the effect was not uniform. Moreover, while there was a significant difference in reinforced trials to criterion between the 100‐s 100% CS and the 12.5‐s 12.5% CS, we note that this difference was in the opposite direction to the only other significant difference in number of reinforced trials to criterion that has been found in the present series of experiment (in Group Variable of Experiment 3).
Omnibus Analysis
The five experiments presented here compared conditioned responding between two CSs that had the same cumulative rate of reinforcement but differed in length and in the percentage of trials that were reinforced. When the CS presentation had fixed length, and thus the timing of the US was predictable, response rates differed between the two CSs (Group Fixed in Experiment 3). However, this comparison was confounded by systematic differences between the CSs in the timing of responses within the trial. When the durations of the CSs varied from trial to trial, preventing the rats from learning to time their responses, there was very little evidence for any difference in conditioning between the two CSs. Only the last experiment found evidence for a statistically significant difference—with response rates being slightly higher for longer CSs than shorter ones. However, Experiments 2 and 4 found small and non‐significant differences in the opposite direction, and in the other two experiments response rates were almost identical for the paired CSs that had matched cumulative reinforcement rates. Thus overall, the results seem to offer little support for the possibility that conditioning varies as a function of either CS length or percentage of trials reinforced, when cumulative reinforcement rate is held constant. Nonetheless, to explore this issue further, we have conducted an analysis combining data from all five experiments (excluding results from the Fixed group in Experiment 3). This analysis compares the response rates, averaged over all sessions, to the CSs with matched cumulative reinforcement rates. For Experiment 5, in which there were four such CSs, the 100‐s 100% CS and the 12.5s 12.5% CS were selected. Thus we are combining data from CSs that differed threefold (Experiments 1 to 3), fivefold (Experiment 4), and eightfold (Experiment 5) in mean length and percentage of trials that are reinforced.
Figure 6 shows a scatter plot of response rates from all 96 rats across the five experiments. It plots response rates to the short partially‐reinforced CS against response rates to the long 100% CS. The graph includes the diagonal between the axes; along this line the values on the axes are equal. It is clear that the data for the 96 rats cluster quite tightly along the diagonal. A regression line (not shown) fitted to the data is almost indistinguishable from the diagonal; the slope of the regression line (1.004) is only marginally different from 1, and its intercept (0.002) is only marginally different from zero. Not surprisingly, the goodness of fit of the regression line is only marginally above the fit of the diagonal, r2 = 0.9490 versus 0.9488. This shows that the difference between the long and short CSs is, on the whole, very close to zero.
To subject this null hypothesis to statistical test, we have calculated the Bayesian Information Criterion (BIC) for the diagonal (representing the null hypothesis) and compared that to the BIC value for other functions fitted to the same data (representing alternative hypotheses of

HARRIS, PATTERSON & GHARAEI PAVLOVIAN CONDITIONING AND REINFORCEMENT RATE
15
0
0.2
0.4
0.6
0.8
1
1.2
0 0.2 0.4 0.6 0.8 1 1.2
Response rate to short CS
Response rate to long CS
the difference between the two CSs). We have computed the BIC as
BIC ∙ / ∙
where n is the total number of data points (i.e., 96), SSE is the sum of squares of the difference between the expected value (based on the function) and observed values of each data point, and k is the number of free parameters in the function (for the null hypothesis, k = 0). We then calculated an odds ratio of the null hypothesis versus each alternative using the exponential function of the difference in BICs between the null and each alternative. The alternative functions we tested were two one‐parameter lines (y = mx, and y = x+b), the two‐parameter regression line (y = mx + b), as well as second, third and fourth order polynomials. The BIC for the diagonal was lower than for all of the alternative functions we tested, establishing that the null hypothesis was more likely than any of those alternatives. The alternative function with the lowest BIC, and thus the most likely given the data, was the single parameter line, [long CS] = [short CS] – 0.003. However its BIC value was 4.3 units higher than the BIC of the diagonal, which translates into an odds ratio of 8.5:1 in favor of the null hypothesis.
Figure 6. Scatter plot of data from 96 rats across the five experiments described in this paper (excluding Group Fixed from Experiment 3). Each dot shows a single rat’s mean response rates to a short CS, reinforced on a fraction of trials, plotted against its response rates to a long CS reinforced on 100% of trials. The plot includes the diagonal (identity function) between the axes.
General Discussion
The five experiments presented here investigated how conditioning is affected by differences in the mean length of the CS and differences in the proportion of trials that are reinforced. Both factors affected conditioning: acquisition was slower and response rates were lower for longer CSs than for shorter ones; and acquisition was slower and response rates lower for CSs that were
reinforced on a small percentage of trials than for CSs reinforced on every trial. However, the effect of both manipulations was entirely due to their common effect on cumulative reinforcement rate. Thus, the rate of conditioning and level of responding was the same for CSs that differed markedly in both mean length and percentage of reinforcement if they had the same cumulative reinforcement rate.
These results are at odds with findings from similar experiments reported by Bouton and Sunsay (2003). In one experiment, they compared magazine response rates between two groups of rats, one was trained with a fixed 30‐s CS reinforced on 100% of trials and the other was trained with a fixed 10‐s CS reinforced on 33% of trials. Response rates appeared to differ, although not significantly so, between these groups. That between‐subjects comparison is very similar to the within‐subjects comparison we have made here for Group Fixed of Experiment 3, and in that group, there was a significant interaction between CS length and the change in response rate across sessions. Therefore, our Experiment 3 did identify a difference in the acquisition of conditioned responding between a short fixed‐duration CS and a long fixed‐duration CS. However, that experiment also showed that the comparison between the two fixed CSs was confounded by the fact that the pattern of responding within a trial differed markedly between them. Response rates to the 10‐s CS rose sharply to peak at the end of the CS, whereas response rates remained low over the first 10‐s of the 30‐s CS and peaked at the end of the CS presentation. These findings confirm many previous demonstrations that conditioned responding is timed to coincide with the expected moment of US arrival (Church et al., 1994; Davis et al., 1989; Kehoe & Joscelyne, 2005; Pavlov, 1927; Roberts, 1981; Smith, 1968; Williams et al., 2008). In the present context, they show that any differences in the strength of conditioned responding between fixed‐duration CSs that differ in length is confounded with differences in the timing of responses to those CSs. This issue of response timing would similarly confound interpretation of Bouton and Sunsay’s Experiment 3. By using variable‐duration CSs, this confound was avoided in the experiments we present here because response rates were steady across elapsed time. The fact that, under these conditions, we have observed equivalent conditioning to a long CS reinforced on every trial and a short partially‐reinforced CS shows that conditioning is proportional to cumulative CS time per reinforcement when reinforcement rate and reinforcement timing are not confounded.
Some prominent real time models of conditioning anticipate that length or percentage of reinforcement will have effects on conditioning beyond that related to cumulative rate of reinforcement. As discussed in the Introduction, one class of associative model assumes that the associability of the CS decays as time elapses (e.g., Wagner’s 1981 SOP model). According to another class, the TD model (Sutton & Barto, 1990), the associative

HARRIS, PATTERSON & GHARAEI PAVLOVIAN CONDITIONING AND REINFORCEMENT RATE
16
strength at each point in time is not only a product of the probability of reinforcement at that moment, but is also affected by the probability of reinforcement at future time points in the trial. This means that responding to a CS is elevated by the prospective likelihood of the US, which is higher for a long CS that is reinforced on 100% of trials than for a short partially reinforced CS. These models are complex, and depending on the choice of parameters and assumptions, they can make quite varied predictions about the relative effect of CS length and percentage of reinforcement. Our simulations show that these models frequently predict a difference in rate and/or level of conditioning between CSs that have matched cumulative reinforcement rate but differ in length and percentage of reinforcement. However, it is possible that judicious selection of parameters can enable them to predict equivalent conditioning when cumulative reinforcement rate is matched. Nonetheless, it seems unlikely that these models can consistently make such a prediction across the variations in trial length explored across the five experiments presented here. Moreover, the Bayesian analysis conducted on the data from all five experiments combined showed that the odds are strongly against a model with even one additional parameter that allows it to be flexible in its predictions about CSs with matched cumulative reinforcement. Rather, the present data very substantially favor any model that makes a singular prediction that CSs with matched cumulative reinforcement rates will condition at the same rate and to the same level despite differences in length and percentage of reinforcement.
The present experiments show that conditioning strength is directly related to cumulative reinforcement rate. This conclusion is consistent with rate‐based models of conditioning, like RET (Gallistel & Gibbon, 2000), which assume that conditioning is the simple inverse of the cumulative CS time between USs. It is also consistent with any simple associative model that assumes the rate of learning to be constant for each moment that the CS is present, and is not affected by any decay process that might otherwise reduce the amount learned as the length of a CS is extended. A simple instantiation of such a model would involve the iterative computation of an error‐correction learning rule (e.g., Rescorla & Wagner, 1972) using some suitably small time step. However, both RET and a simple associative model make predictions about differences in the rate of learning that are not supported by the present experiments. In Experiment 1, where all CSs were matched for number of trials per session, the 60‐s 100% CS was reinforced three times as often as the 20‐s 33% CS. Therefore, according to the associative model, responding to the 100% CS should have been acquired at an earlier point during training than to the 33% CS, yet there was no such difference in either the learning curve over sessions or the number of trials to a response criterion. For rate‐based models, responding emerges to a CS at the point when the ratio of the reinforcement rate of the CS to the background
reinforcement rate exceeds a threshold. Since the current experiments are within‐subjects, the background rate of reinforcement was constant for any comparison between CSs, and so differences in the point when responding appeared for different CSs should be inversely proportional to each CS’s reinforcement rate. For example, a threefold decrease in mean reinforcement rate should result in a threefold increase in the number of reinforced trials needed before responding emerges. While there were differences in how quickly responding emerged for CSs that differed in mean reinforcement rate, these differences were not always apparent, and when they were, the differences in reinforcements to criterion were always much smaller than would be predicted based on the differences in reinforcement rate. For example, in Experiment 4, CSs that differed fivefold in mean reinforcement rate differed only twofold in the number of reinforced trials required for responding to reach a criterion.
Our findings are somewhat at odds with a long‐known difference between the effects of continuous and partial reinforcement in terms of their susceptibility to extinction. The Partial Reinforcement Extinction Effect (PREE) refers to the observation that a CS (or response) that has been reinforced on every trial will undergo more rapid extinction than a CS (or response) that has been reinforced on only a fraction of trials (Mackintosh, 1974). This difference in extinction has been observed even for CSs that have been matched for cumulative reinforcement rate during conditioning by, for example, using short presentations of the partial CS and long presentations of the continuous CS (Bouton, Woods, & Todd, 2014; Haselgrove, Aydin, & Pearce, 2004). While the experiments by Haselgrove et al. and Bouton et al. used fixed CS‐US intervals, and are therefore susceptible to issues of response timing, it is not obvious how timing of US expectancy would produce the difference in extinction they reported. Indeed, in some experiments (e.g., Haselgrove et al., Experiment 1) the Partial and Continuous CSs were matched not only for cumulative reinforcement rate but also the timing of the US relative to CS onset. Thus the PREE identifies an effect of non‐reinforcement at the level of the trial over‐and‐above its effect on cumulative reinforcement rate. The fact that this effect is not evident during acquisition suggests that there might be a fundamental difference in the effects of non‐reinforcement during acquisition and during extinction, which contradicts the way that simple associative models treat learning about non‐reinforcement. Alternatively, given that the PREE is usually absent in within‐subjects designs (Pearce, Redhead, & Aydin, 1997), this raises a possibility that the results we present here are specific to our within‐subjects designs. It is thus possible that there would be differences in conditioning between CSs with matched cumulative reinforcement rate but differing in trial‐based reinforcement if they were compared between subjects (as in Bouton & Sunsay, 2003).

HARRIS, PATTERSON & GHARAEI PAVLOVIAN CONDITIONING AND REINFORCEMENT RATE
17
In conclusion, the five experiments presented here suggest that the trial is not a relevant unit of learning, inasmuch as variations in reinforcement rate at the level of the trial are neither necessary nor sufficient to produce measurable differences in conditioning. They also show that neither the rate nor strength of conditioning is affected by differences in CS duration, after controlling for differences in reinforcement rate, which is inconsistent with the notion that the CS representation decays across the length of its presentation. Rather, they show that conditioning is a function of the steady accumulation of learning across non‐reinforced exposure to the CS between reinforcements. This conclusion is consistent with rate‐based models of conditioning, like RET (Gallistel & Gibbon, 2000), or with a simple associative model in which the rate of learning is constant for each moment that the CS is present. However, both of these types of model make other predictions about the rate of acquisition that were not supported. Specifically, the emergence of conditioned responding was not sensitive to differences in number of reinforced trials per session, as would be predicted by an associative model, and was less sensitive to differences in the rate of reinforcement than predicted by RET.
References
Andrew, B. J., & Harris, J. A. (2011). Summation of reinforcement rates when conditioned stimuli are presented in compound. Journal of Experimental Psychology: Animal Behavior Processes, 37, 385‐393.
Balsam, P. D., Drew, M. R., & Gallistel, C. R. (2010). Time and associative learning. Comparative Cognition and Behavior Reviews, 5, 1‐22. doi: 10.3819/ccbr.2010.50001
Balsam, P. D., & Gallistel, C. R. (2009). Temporal maps and informativeness in associative learning. Trends in Neurosciences, 32, 73‐78.
Bouton, M. E., & Sunsay, C. (2003). Importance of Trials Versus Accumulating Time Across Trials in Partially Reinforced Appetitive Conditioning. Journal of Experimental Psychology: Animal Behaviour Processes, 29, 62‐77.
Bouton, M. E., Woods, A. M., & Todd, T. P. (2014). Separation of time‐based and trial‐based accounts of the partial reinforce‐ment extinction effect. Behavioural Processes, 101, 23‐31.
Church, R. M., Meck, W. H., & Gibbon, J. (1994). Application of scalar timing theory to individual trials. Journal of Experi‐mental Psychology: Animal Behavior Processes, 20, 135‐155.
Davis, M., Schlesinger, L. S., & Sorenson, C. A. (1989). Temporal specificity of fear conditioning: Effects of different conditioned stimulus‐unconditioned stimulus intervals on the fear‐potentiated startle effect. Journal of Experimental Psychology: Animal Behavior Processes, 15, 295‐310.
Gallistel, C. R., & Gibbon, J. (2000). Time, rate, and conditioning. Psychological Review, 107, 289‐344.
Gibbon, J. (1977). Scalar expectancy theory and Weber's law in animal timing. Psychological Review, 84, 279‐325.
Gottlieb, D. A. (2008). Is the number of trials a primary deter‐minant of conditioned responding? Journal of Experimental Psychology: Animal Behavior Processes, 34, 185‐201.
Harris, J. A., & Carpenter, J. S. (2011). Response rate and rein‐forcement rate in Pavlovian conditioning. Journal of Experi‐mental Psychology: Animal Behavior Processes, 37, 375‐384.
Harris, J. A., Gharaei, S., & Pincham, H. L. (2011). Response rates track the history of reinforcement times. Journal of Experi‐mental Psychology: Animal Behavior Processes, 37, 277‐286.
Haselgrove, M., Aydin, A., & Pearce, J. M. (2004). A partial rein‐forcement extinction effect despite equal rates of reinforce‐ment during Pavlovian conditioning. Journal of Experimental Psychology: Animal Behavior Processes, 30, 240‐250.
Hentschke, H., & Stüttgen, M. C. (2011). Computation of measures of effect size for neuroscience data sets. European Journal of Neuroscience, 34, 1887‐1894.
Kehoe, E. J., & Joscelyne, A. (2005). Temporally specific extinction of conditioned responses in the rabbit (Oryctolagus cuniculus) nictitating membrane preparation. Behavioral Neuroscience, 119, 1011‐1022.
Kirkpatrick, K., & Church, R. M. (2003). Tracking the expected time to reinforcement in temporal conditioning procedures. Learning & Behavior, 31, 3‐21.
Mackintosh, N. J. (1974). The psychology of animal learning. London, UK: Academic Press.
Pavlov, I. P. (1927). Conditioned reflexes: An investigation of the physiological activity of the cerebral cortex. (G. V. Anrep, Trans.). New York: Dover.
Pearce, J. M. (1994). Similarity and discrimination: A selective review and a connectionist model. Psychological Review, 101, 587‐607.
Pearce, J. M., Redhead, E. S., & Aydin, A. (1997). Partial reinforcement in appetitive Pavlovian conditioning with rats. Quarterly Journal of Experimental Psychology. B, Comparative & Physiological Psychology, 50(4), 273‐294.
Rescorla, R. A., & Wagner, A. R. (1972). A theory of Pavlovian conditioning: Variations in the effectiveness of reinforcement and nonreinforcement. In A. H. Black & W. F. Prokasy (Eds.), Classical conditioning II: Current research and theory. (pp. 64‐99). New York: Appleton‐Century‐Crofts.
Roberts, S. (1981). Isolation of an internal clock. Journal of Experimental Psychology: Animal Behavior Processes, 7, 242‐268.
Smith, M. C. (1968). CS‐US interval and US intensity in classical conditioning of the rabbit's nictitating membrane response. Journal of Comparative and Physiological Psychology, 66, 679‐687.
Sutton, R. S., & Barto, A. G. (1990). Time‐derivative models of Pavlovian reinforcement. In M. Gabriel & J. Moore (Eds.), Learning and computational neuroscience: Foundations of adaptive networks (pp. 497‐537). Cambridge, MA: Bradford Books/MIT Press.
Wagner, A. R. (1981). SOP: a model of automatic memory processing in animal behavior. In N. E. Spear & R. R. Miller (Eds.), Information processing in animals: memory mechanisms (pp. 5‐47). Hillsdale, NJ: Erlbaum.
Williams, D. A., Lawson, C., Cook, R., Mather, A. A., & Johns, K. W. (2008). Timed Excitatory Conditioning Under Zero and Negative Contingencies. Journal of Experimental Psychology: Animal Behavior Processes, 34(1), 94‐105.