Embed Size (px)
Citation preview

Pavement-related research at the MIT Concrete Sustainability Hub
November 2014

Slide 2
Context: the US is not sufficiently investing in its ailing road system
The U.S. road system is in poor condition
Significant funding is required to fix the system
$170 billion in annual capital investment needed to improve road system (source: FHWA)
Insufficient investments are being made
• The Highway Trust Fund is nearly bankrupt
• Funding for roads will remain constrained for the foreseeable future
Slide 3
Governments are being forced to do more with less
Governments Look for New Ways to Pay for Roads and BridgesFeb 14, 2013

Slide 4
Our actions today affect the financial healthof future generations

Slide 5
Our actions today affect the environmental health of future generations
We urgently need cost-effective solutions that maximize performance while minimizing environmental impact

Slide 6
MIT Concrete Sustainability Hub Mission: Develop breakthroughs that will lead to more sustainable and durable infrastructure, buildings and homes
Increasing performance
Reducing costReducing
environmental impacts
This will be accomplished by:

Slide 7
CSHub approach is holistic and multidisciplinary
Science Engineering Economics Environment

Slide 8
CSHub research supports pavement decisions
Environmental Impact
Cost Performance
Factors in decisions
LCA (life-cycle assessment)
LCCA (life-cycle cost analysis)
Pavement design process

Slide 9
LCA – Life-cycle assessment: Method for quantifying environmental impact
Materials Production
Manufacture
Use
Disposal / Recycling
Life-cycle impact
Process
Raw Materials
Energy
Processing Chemicals
Product
Air Emissions
Water Effluents
Releases to Land
Process inventory

Slide 10
LCCA – Life-cycle cost analysis:Method for evaluating total costs of ownership
0
2
4
6
8
10
12
Rea
l Cos
t
0
2
4
6
8
10
12
Life
-Cyc
le C
ost
Transform individual pavement expenditures over time into…
…total life-cycle cost

Slide 11
CSHub models are probabilistic
Probabilistic models incorporate uncertainty. The figure shows a range of cost outcomes for two competing project alternatives. Source: FHWA
Slide 12
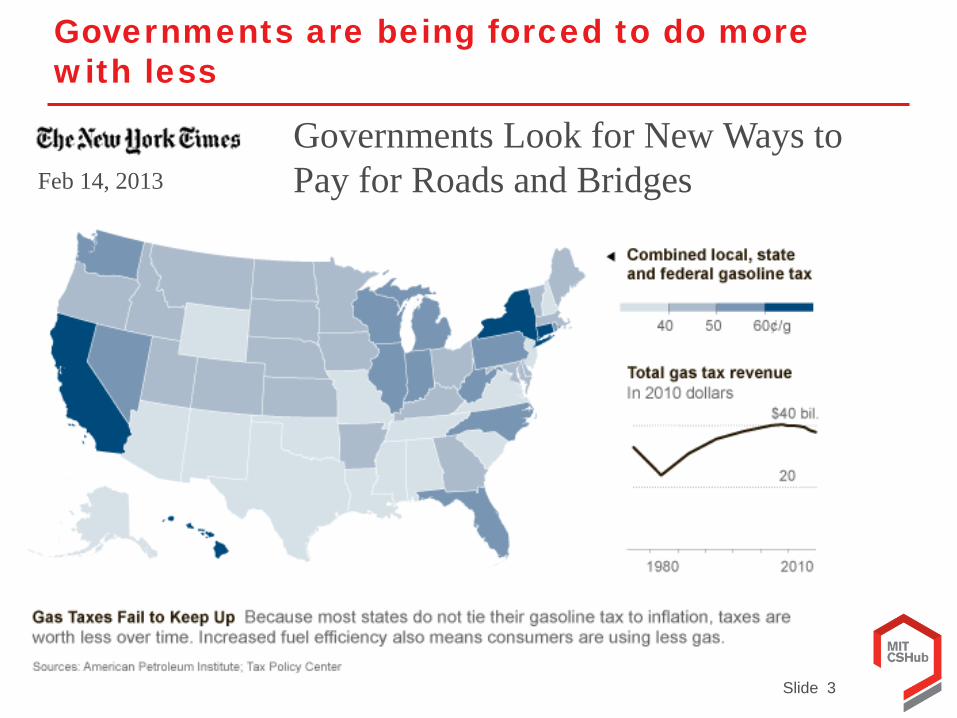
The life-cycle perspective frames CSHub work
Materials Production• Use recycled
materials• Reduce energy
use• Improve
material performance
Design & Construction• Use less (i.e.,
stronger) material
• Create longer-lasting designs
Use• Reduce vehicle
fuel consumption
• Reduce heat island effects
End-of-Life• Enable material
recovery
There are multiple mechanisms for reducing environmental impact and cost across a structure’s life
Prioritizing mechanisms requires a trade-off analysis of performance and life-cycle environmental impacts and costs

Slide 13
CSHub Pavement LCA & LCCA Goals
1. Drive the pervasive use of life-cycle costing and life-cycle assessment for:– Pavement design– Pavement type selection– Maintenance decisions– Asset management
2. Improve the robustness of pavement-related decision-making

Slide 14
Motivation: Pavement design is iterative; Accelerated feedback more testing, more improvement
10.0” JPCP w/ 1.25” Dia Dowels
Subgrade
6.0” Agg Subbse
Design Proposal &
ContextLayersTraffic
Climate
Analyze Using ME Design Principles
N AdequatePerformance
8.0” JPCP w/ 1.25” Dia Dowels
Subgrade
6.0” Agg Subbse
FinalDesign
Develop Lifecycle Bill of Activities
EvaluateLCCA / LCA
Y

Slide 15
Motivation: Pavement design is iterative; Accelerated feedback more testing, more improvement
10.0” JPCP w/ 1.25” Dia Dowels
Subgrade
6.0” Agg Subbse
Design Proposal &
ContextLayersTraffic
Climate
Analyze Using ME Design Principles
Develop Lifecycle Bill of Activities
EvaluateLCCA / LCA
N YAdequatePerformance
MIT research aims to
integrate these activities
8.0” JPCP w/ 1.25” Dia Dowels
Subgrade
6.0” Agg Subbse
FinalDesign

Slide 16
LIFE-CYCLE COST:
Key accomplishments–
Key findings

Slide 17
CSHub created linkage between design tools and evaluation
Life-cycle inventory
• Material & energy inflows
• Emissions outflows
Bill – of –activities
• Material quantities
• Construction activities
• Maintenance timing
• Logistics
Cash flows
• Magnitude• Timing
7.0” JPCP w/ 1.25” Dia Dowels
Subgrade
6.0” Agg Subbse
Pavement Design
&Context
MEPDG
LCCAModel
LCAModel
PavementPerformance
Performance-to-activitymodeling
Pavement has associated activities;…activities translate to cost & impact

Slide 18
CSHub created probabilistic cost estimates for entire life-cycle
Construction Operation
Cash
Flo
w
1) Unit-price of inputs2) Quantity of inputs
1) Quantity of inputs2) Future construction prices3) Maintenance timing

Slide 19
CSHub created effective long-term, probabilistic price projections
0
20
40
60
80
100
120
140
1900 1920 1940 1960 1980 2000 2020 2040
Real
Pri
ce o
f Ce
men
t (1
998
$)
Source: USGS
Effective price projections:• Must be built from significant sets of data• Must be viewed as probabilistic in nature
Price projections are created and validated using historical data

Slide 20
CSHub conducted LCCAs for a wide range of scenarios
4 Locations
FL: Wet no freeze
MO: Wet freeze
CO: Dry freeze
AZ: Dry no freeze
3 Traffic Levels
• Rural local street/highway
• Rural state highway
• Urban interstate
Several framing conditions
• Pavement designs
• Maintenance schedules
• Design life
• Analysis period

Slide 21
LIFE-CYCLE COST:
Key accomplishments–
Key findings

Slide 22
Key findings from CSHub LCCA research
Life cycle matters
Context matters
The future is worth considering
Risk matters
Key findings from CSHub LCCA research
Life cycle matters
Context matters
The future is worth considering
Risk matters
Slide 23
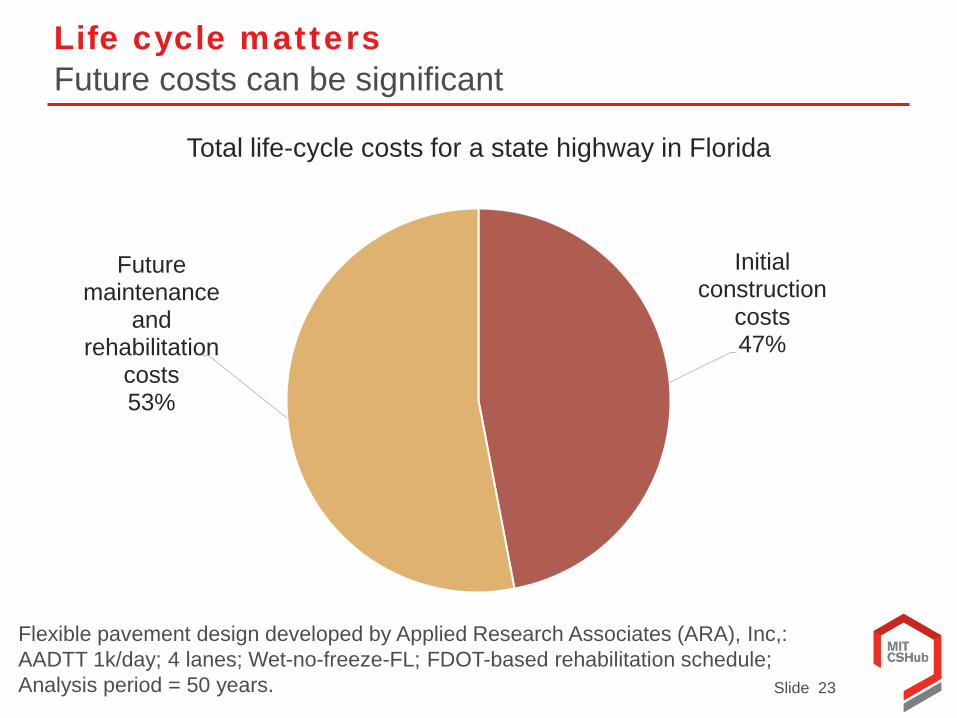
Life cycle mattersFuture costs can be significant
Initial construction
costs47%
Future maintenance
and rehabilitation
costs53%
Total life-cycle costs for a state highway in Florida
Flexible pavement design developed by Applied Research Associates (ARA), Inc,: AADTT 1k/day; 4 lanes; Wet-no-freeze-FL; FDOT-based rehabilitation schedule; Analysis period = 50 years.

Slide 24
Context mattersCosts vary with location, traffic level, & pavement design
Initial costs98%
Rehab costs2%
Interstate, rigid design
Initial costs79%
Rehab costs21%
Interstate, flexible design
Initial costs47%
Rehab costs53%
State highway, flexible design
Initial costs89%
Rehab costs11%
Local highway, rigid design

Slide 25
0
40
80
120
160
1975 1980 1985 1990 1995 2000 2005 2010 2015
Nor
mal
ized
Rea
l Pri
ce In
dex
AsphaltAve. annual price change = 1.3%
ConcreteAve. annual price change = -0.2%
LumberAve. annual price change = -0.8%
The future is worth consideringPrices change differently for different materials

Slide 26
CSHub forecasts have been shown to be more effective than current assumptions
0%
20%
40%
60%
0 5 10 15 20
Aver
age
Erro
r of F
orec
ast
Years into the future
CSHub Forecasting Model
Current Practice
Increasing Performance
Testing the effectiveness of the model for the state of Colorado
Real price projections outperform conventional assumptions of no real price change

Slide 27
The future is worth consideringEffective price projections are plausible
0
50
100
150
200
2010 2020 2030 2040 2050
Rea
l Pric
e In
dex
Concrete (Constituent Based) Asphalt (Constituent Based)
-
50
100
150
200
2010 2020 2030 2040 2050
Rea
l Pric
e In
dex

Slide 28
0%
20%
40%
60%
80%
100%
2 3 4 5
Cum
ulat
ive
Prob
abili
ty
Life-Cycle Cost: Net Present Value (millions of $s per mile)
Risk mattersHigher uncertainty means higher risk
Design 2
Design 1
1%
9%
~same
50% Confidence
90% Confidence
12%
Difference between alternatives depends on risk profiles
Risk of exceeding a particular cost can be calculated
Slide 29
There are several opportunities for future research
• Improve models for estimating initial construction cost
• Incorporate life-cycle cost considerations into asset management programs

Slide 30
LIFE-CYCLE ENVIRONMENTALPERFORMANCE:
Key accomplishments–
Key findings
Slide 31
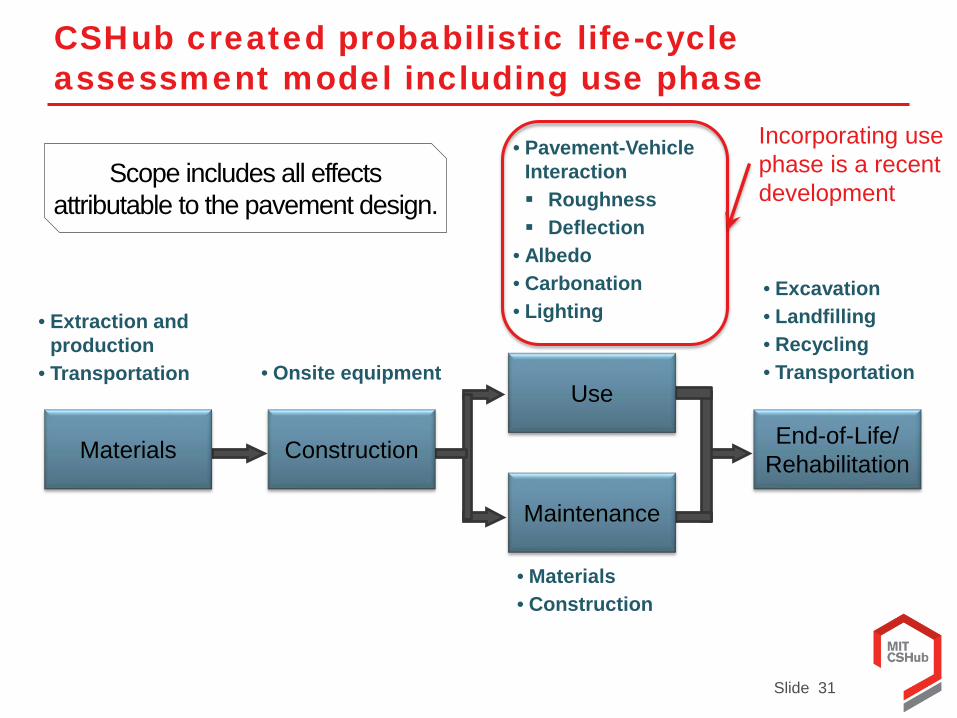
CSHub created probabilistic life-cycle assessment model including use phase
• Onsite equipment
Materials End-of-Life/ Rehabilitation
• Excavation• Landfilling• Recycling• Transportation
• Pavement-Vehicle Interaction Roughness Deflection
• Albedo• Carbonation• Lighting• Extraction and
production• Transportation
• Materials• Construction
Construction
Use
Maintenance
Scope includes all effects attributable to the pavement design.
Incorporating use phase is a recent development

Slide 32
CSHub implemented model-based assessment of PVI using new deflection model
Structure and Material
MEPDG+HDM4MIT Model
Deflection & Roughness
Excess Fuel Consumption
Environmental Impact
Calculation Method:
Pavement Deflection Pavement Roughness

Slide 33
CSHub conducted LCAs for a wide range of scenarios
4 Locations
FL: Wet no freeze
MO: Wet freeze
CO: Dry freeze
AZ: Dry no freeze
3 Traffic Levels
• Rural local street/highway
• Rural state highway
• Urban interstate
Several framing conditions
• Pavement designs
• Maintenance schedules
• Design life
• Analysis period

Slide 34
LIFE-CYCLE ENVIRONMENTALPERFORMANCE:
Key accomplishments–
Key findings
Slide 35
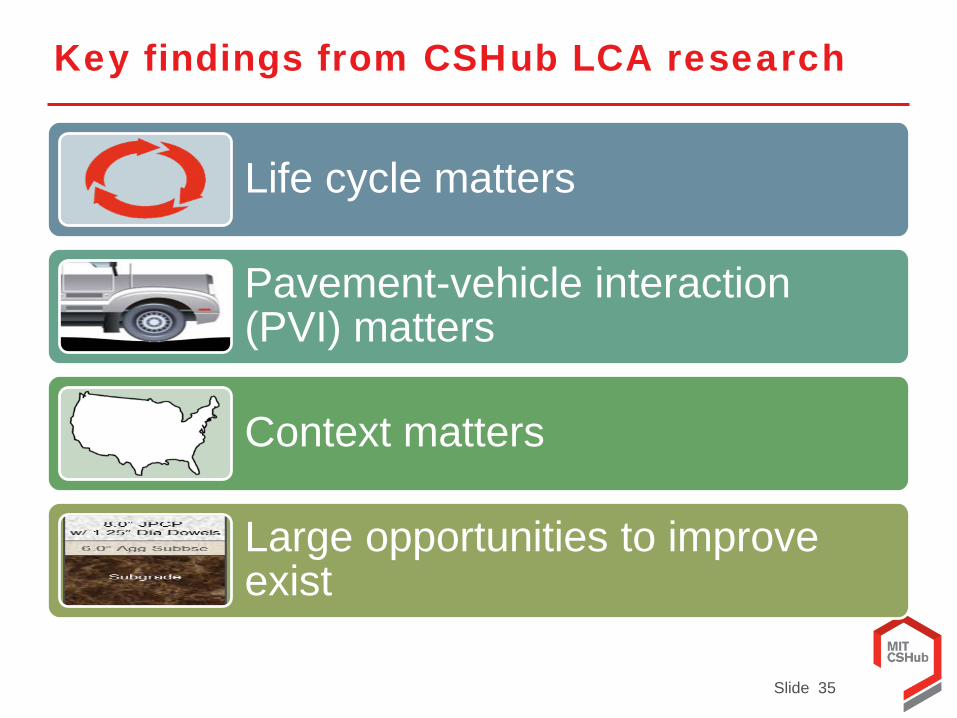
Key findings from CSHub LCA research
Life cycle matters
Pavement-vehicle interaction (PVI) matters
Context matters
Large opportunities to improve exist

Slide 36
Life-cycle mattersUse phase can be a significant fraction of pavement environmental impact
Construction29%
Use58%
M&R7%
End-of-Life6%
Example:Life-cycle GHG (greenhouse gas) emissions of an urban interstate pavement in Missouri
Flexible pavement design developed by Applied Research Associates (ARA), Inc,: AADTT 8k/day; 6 lanes; Wet-freeze-MO; MEPDG-based rehabilitation schedule.

Slide 37
PVI mattersExcess fuel consumption from PVI is significant
0
250
500
750
Mill
ion
Gal
lons
per
Yea
r
Urban Other ArterialUrban FreewaysUrban InterstateRural Other ArterialRural Interstate
Estimate of extra fuel consumption from PVI in US pavement test sections
Total of ~700 million gallons
of excess fuel per year

Slide 38
Deflection mattersIn some contexts, deflection causes the majority of fuel lost to PVI
Fuel loss: roughness
40%Fuel loss: deflection
53%
Other*7%
*Other: carbonation & lighting
Example:Use-phase GHG emissions by source for an urban interstate pavement in MissouriUse

Slide 39
Roughness mattersIn some contexts, however, roughness causes most of the fuel lost to PVI
*Other: carbonation & lighting
Example:Use-phase GHG emissions by source for an urban interstate pavement in Colorado
Fuel loss: roughness
61%
Fuel loss: deflection
31%
Other*8%
Use

Slide 40
PVI mattersPVI data can be used in network pavement management
Excess fuel consumption due to PVI for cars & trucks on interstates in Virginia in 2013
Assumed speed= 100 km/h=62.6 mph; assumed temperature= 16 C/61 F
Fuel Consumption (gallon/mile)
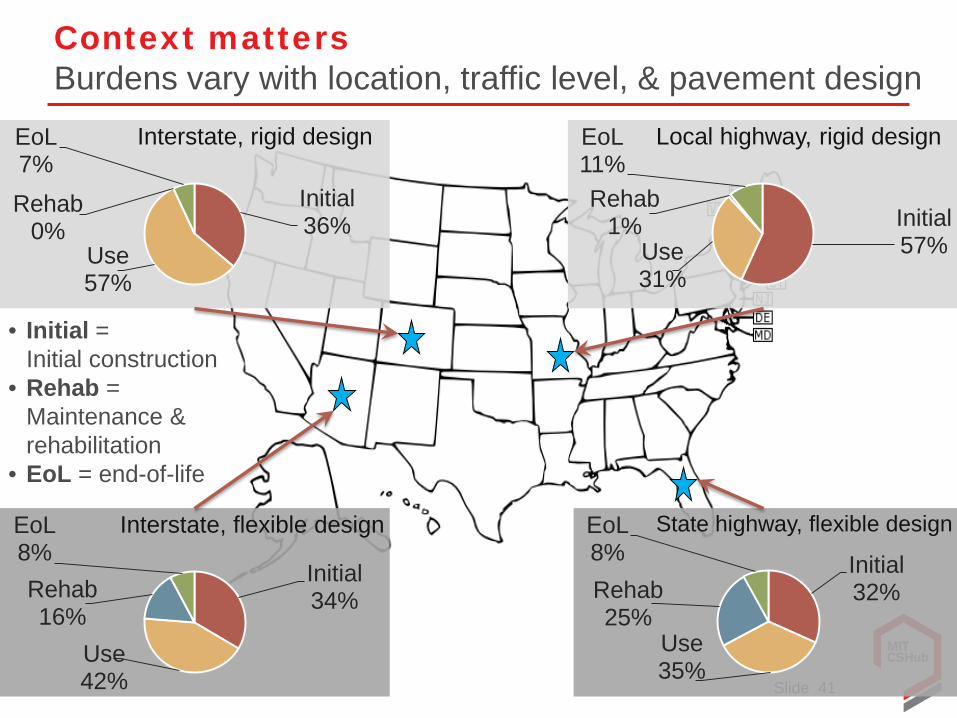
Slide 41
Context mattersBurdens vary with location, traffic level, & pavement design
Initial36%
Use57%
Rehab0%
EoL7%
Interstate, rigid design
Initial34%
Use42%
Rehab16%
EoL8%
Interstate, flexible designInitial32%
Use35%
Rehab25%
EoL8%
State highway, flexible design
Initial57%Use
31%
Rehab1%
EoL11%
Local highway, rigid design
• Initial = Initial construction
• Rehab = Maintenance & rehabilitation
• EoL = end-of-life

Slide 42
Large opportunities to improve existPavement design optimization saves GHGs & $
Optimizing design represents a clear
win-win
Slide 43
There are several opportunities for future research
• Develop context-specific models of albedo
• Explore impacts of using recycled content in pavement materials
• Identify opportunities to reduce impact using optimized designs
Slide 44
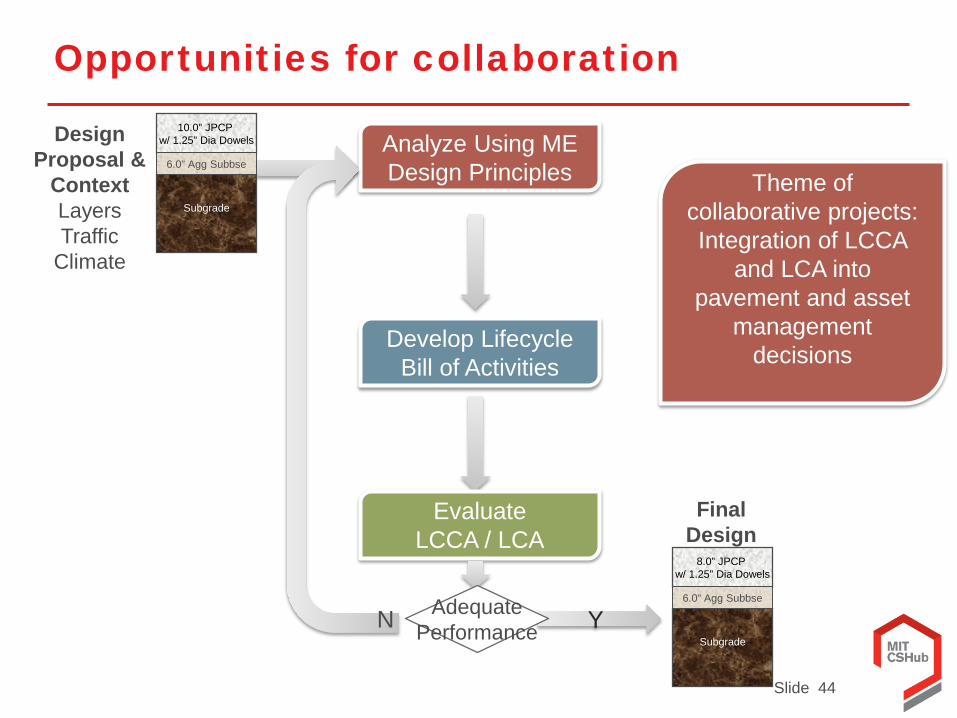
Opportunities for collaboration 10.0” JPCP
w/ 1.25” Dia Dowels
Subgrade
6.0” Agg Subbse
Design Proposal &
ContextLayersTraffic
Climate
Analyze Using ME Design Principles
Develop Lifecycle Bill of Activities
EvaluateLCCA / LCA
N YAdequatePerformance
8.0” JPCP w/ 1.25” Dia Dowels
Subgrade
6.0” Agg Subbse
FinalDesign
Theme of collaborative projects: Integration of LCCA
and LCA into pavement and asset
management decisions
Slide 45
Potential collaborative research topics
• LCCA– Integrating probabilistic LCCA and ME design– Improving cost estimation methods
• LCA– Integrating probabilistic LCA and ME design– Improving data and models used in LCA
• PVI– Network-level assessments of excess fuel
consumption due to PVI

More information available at:http://cshub.mit.edu/[email protected]

Slide 47
Backup slides
Slide 48
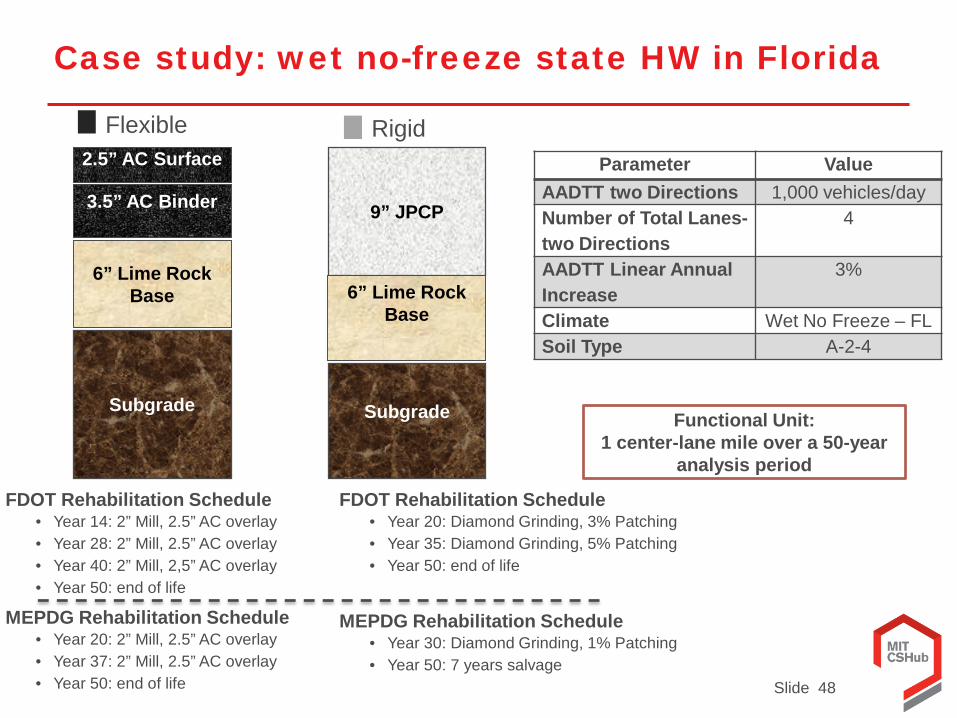
Case study: wet no-freeze state HW in Florida
9” JPCP
Subgrade
6” Lime Rock Base
FDOT Rehabilitation Schedule• Year 20: Diamond Grinding, 3% Patching• Year 35: Diamond Grinding, 5% Patching• Year 50: end of life
MEPDG Rehabilitation Schedule• Year 30: Diamond Grinding, 1% Patching• Year 50: 7 years salvage
3.5” AC Binder
2.5” AC Surface
Subgrade
6” Lime Rock Base
FDOT Rehabilitation Schedule• Year 14: 2” Mill, 2.5” AC overlay • Year 28: 2” Mill, 2.5” AC overlay • Year 40: 2” Mill, 2,5” AC overlay • Year 50: end of life
MEPDG Rehabilitation Schedule• Year 20: 2” Mill, 2.5” AC overlay • Year 37: 2” Mill, 2.5” AC overlay • Year 50: end of life
Parameter ValueAADTT two Directions 1,000 vehicles/dayNumber of Total Lanes-two Directions
4
AADTT Linear Annual Increase
3%
Climate Wet No Freeze – FLSoil Type A-2-4
Flexible Rigid
Functional Unit: 1 center-lane mile over a 50-year
analysis period

Slide 49
Case study: wet freeze urban interstate HW in Missouri
11.0” JPCP w/ 1⅝ in Dia Dowels
Subgrade
6.0” Agg Subbse
MODOT Rehabilitation Schedule• Year 25: Diamond grinding & full
depth patching• Year 50: End of life
MEPDG Rehabilitation Schedule• Year 30: Diamond grinding & full
depth patching• Year 50: 7 years salvage
MO : 8.5” BaseMEPDG: 7” Base
2” Asphalt Surface3” Asphalt Inter.
Subgrade
24” rock base material
MODOT Rehabilitation Schedule• Year 25: 2” Mill, 2” AC overlay • Year 35: 2” Mill, 2” AC overlay • Year 50: end of life
MEPDG Rehabilitation Schedule• Year 12: 2” Mill, 2” AC overlay • Year 33: 2” Mill, 3” AC overlay • Year 50: end of life
Parameter ValueAADTT two Directions 8,000
vehicles/dayNumber of Total Lanes-two Directions
6
AADTT Linear Annual Increase
3%
Climate Wet Freeze - MOSoil Type A-7-6
Flexible Rigid
Functional Unit: 1 center-lane mile over a 50-year
analysis period