Embed Size (px)
Citation preview

Pavement Deterioration
Prediction Model and
Project Selection for
Kentucky Highways
Guangyang Xu, Lihui Bai*, Zhihui Sun University of Louisville
Tracy Nowaczyk*, Chad Shive, Jon Wilcoxson Operations and Pavement Management Branch
Kentucky Transportation Cabinet

Outline
2
Project Background
AC Pavement Deterioration Prediction Models • Methodology
• Results and discussions
An Analytical Hierarchy Process for Project Selection • Methodology
• Results and discussions
Conclusions
9th International Conference on Managing
Pavement Assets | May 18-21, 2015
Background
3
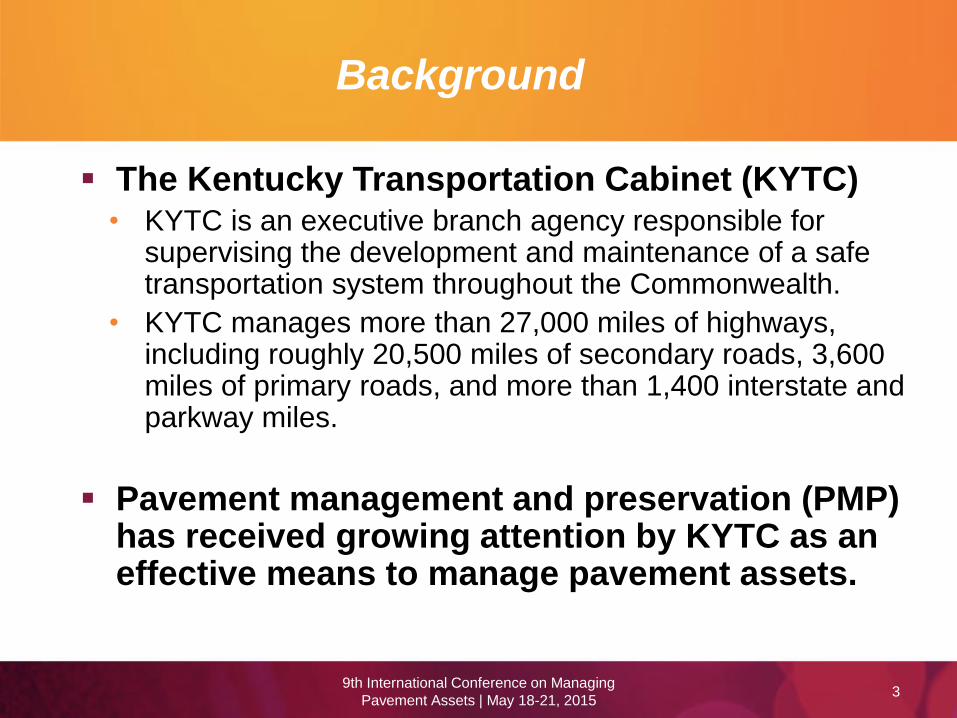
The Kentucky Transportation Cabinet (KYTC) • KYTC is an executive branch agency responsible for
supervising the development and maintenance of a safe transportation system throughout the Commonwealth.
• KYTC manages more than 27,000 miles of highways, including roughly 20,500 miles of secondary roads, 3,600 miles of primary roads, and more than 1,400 interstate and parkway miles.
Pavement management and preservation (PMP) has received growing attention by KYTC as an effective means to manage pavement assets.
9th International Conference on Managing
Pavement Assets | May 18-21, 2015
Problem Statement
4
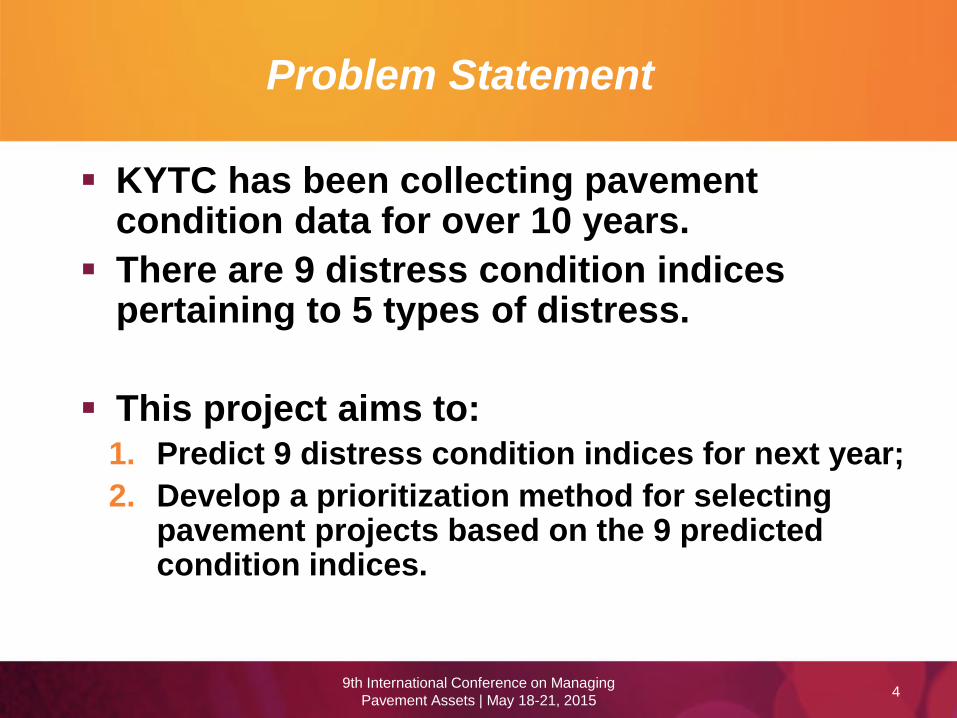
KYTC has been collecting pavement condition data for over 10 years.
There are 9 distress condition indices pertaining to 5 types of distress.
This project aims to: 1. Predict 9 distress condition indices for next year;
2. Develop a prioritization method for selecting pavement projects based on the 9 predicted condition indices.
9th International Conference on Managing
Pavement Assets | May 18-21, 2015
Pavement Prediction Model –
Condition Data
5
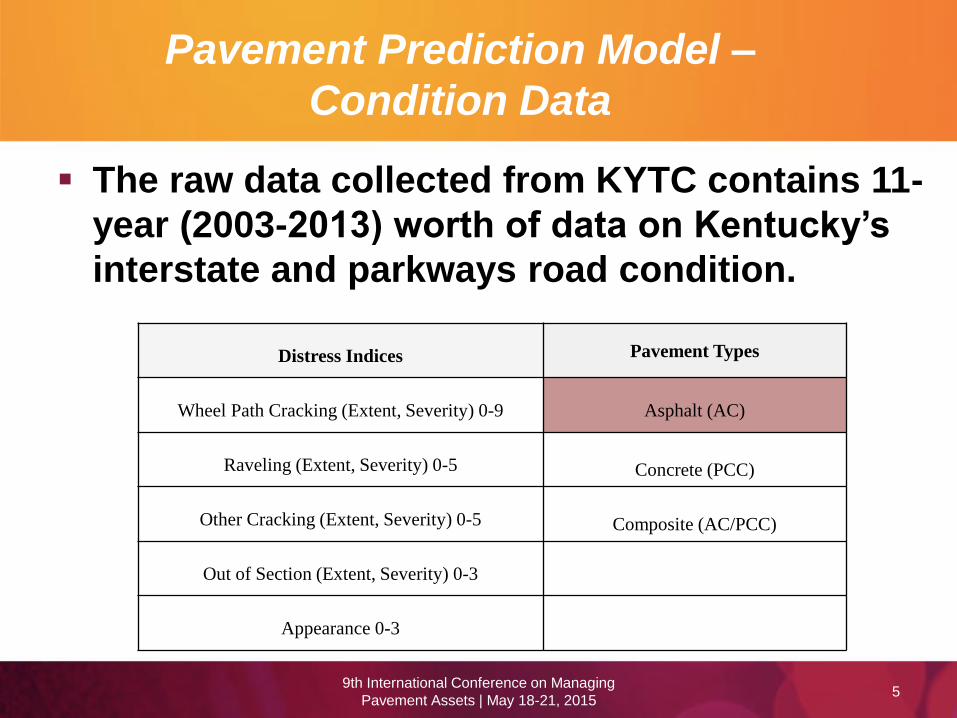
The raw data collected from KYTC contains 11-
year (2003-2013) worth of data on Kentucky’s
interstate and parkways road condition.
Distress Indices Pavement Types
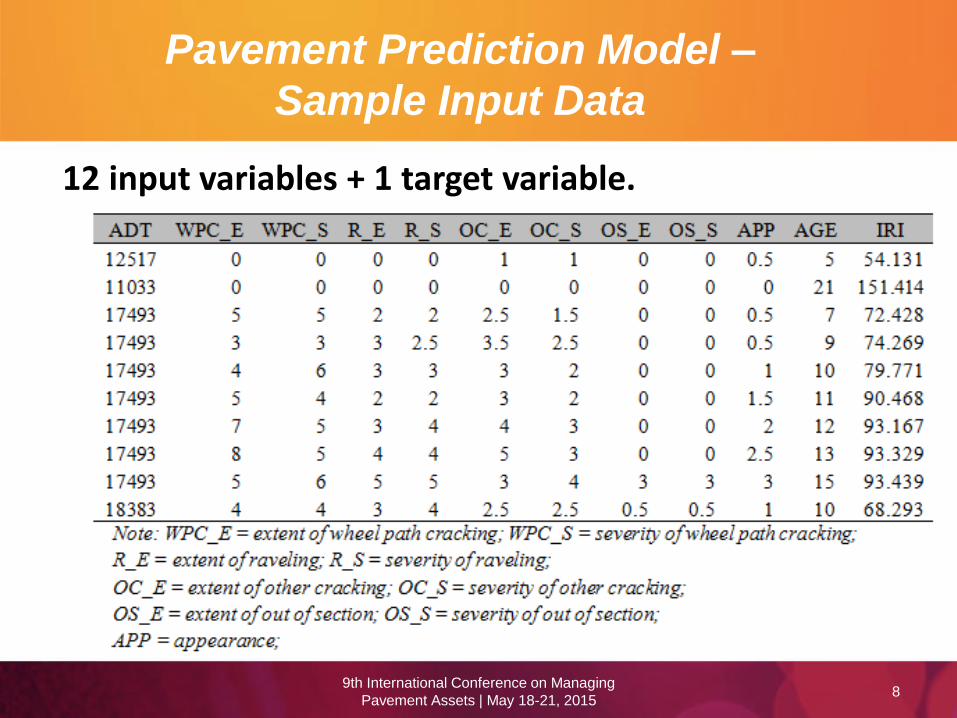
Wheel Path Cracking (Extent, Severity) 0-9 Asphalt (AC)
Raveling (Extent, Severity) 0-5 Concrete (PCC)
Other Cracking (Extent, Severity) 0-5 Composite (AC/PCC)
Out of Section (Extent, Severity) 0-3
Appearance 0-3
9th International Conference on Managing
Pavement Assets | May 18-21, 2015
Pavement Prediction Model – Other
Data
6
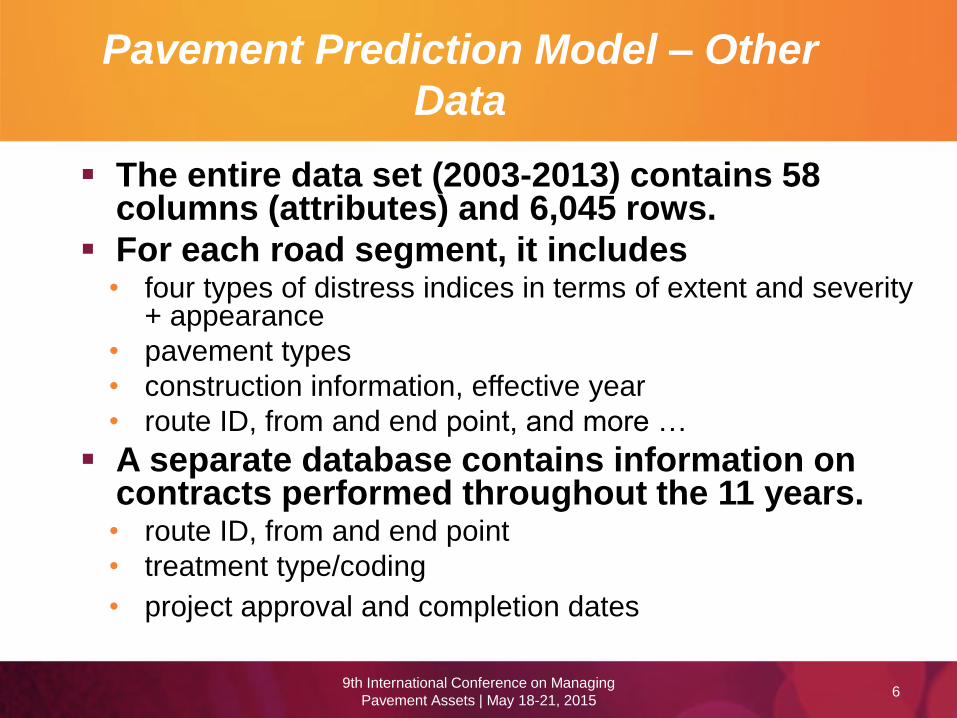
The entire data set (2003-2013) contains 58 columns (attributes) and 6,045 rows.
For each road segment, it includes • four types of distress indices in terms of extent and severity
+ appearance
• pavement types
• construction information, effective year
• route ID, from and end point, and more …
A separate database contains information on contracts performed throughout the 11 years. • route ID, from and end point
• treatment type/coding
• project approval and completion dates
9th International Conference on Managing
Pavement Assets | May 18-21, 2015
Pavement Prediction Model – Data
Processing
7
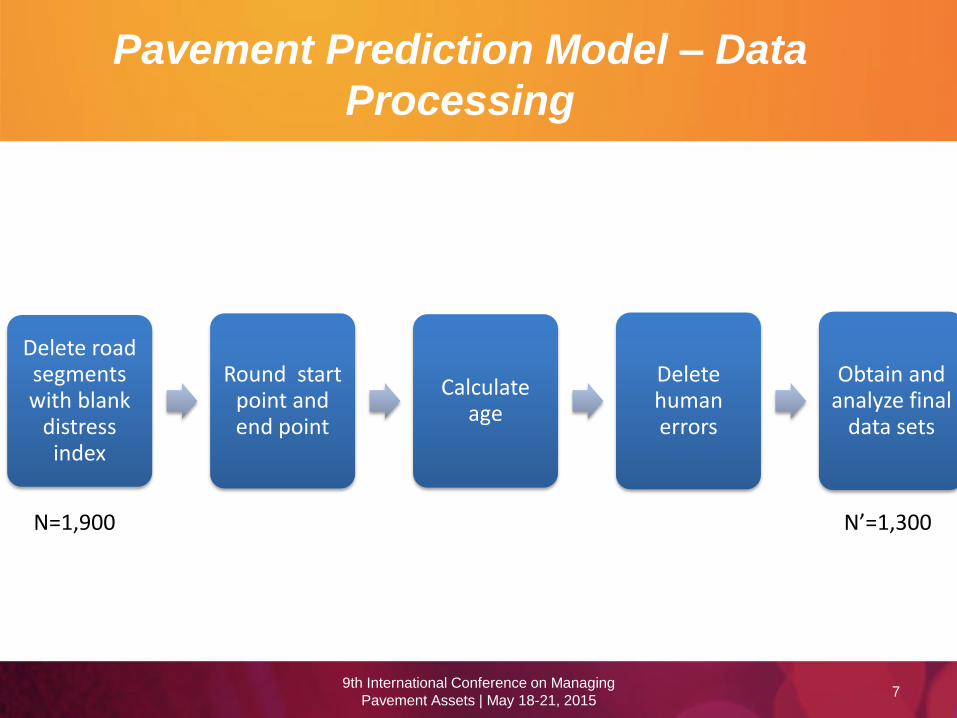
Delete road segments with blank
distress index
Round start point and end point
Calculate age
Delete human errors
Obtain and analyze final
data sets
9th International Conference on Managing
Pavement Assets | May 18-21, 2015
N=1,900 N’=1,300
Pavement Prediction Model –
Sample Input Data
8
12 input variables + 1 target variable.
9th International Conference on Managing
Pavement Assets | May 18-21, 2015
Multiple Linear Regression Models
9
We used SAS Enterprise Miner 12.1 to perform the linear regression for predicting each of the 9 distress indices.
“Data Partition” module is used to partition all final data set into 50% training, 25% validation and 25% testing data.
The “Transform” module is used to handle ADT data.
The stepwise regression is used as our selection model.
9th International Conference on Managing
Pavement Assets | May 18-21, 2015
Multiple Linear Regression Models
10
The following scenarios of using various sets of input variables are done for each distress index to be predicted.
S1: Total of 12 input variables, i.e., ADT, age, IRI, APPEAR, WPC_EXT, WPC_SEV, RF_EXT, RF_SEV, OC_EXT, OC_SEV, OS_EXT, OS_SEV.
S2: A subset of the entire 12 input variables is used based on recommendations from KYTC experts.
S3: Only use the target variable from the previous year as input variable to predict this variable for next year.
S4: Only use the pavement age as input variable to predict any distress index for next year
9th International Conference on Managing
Pavement Assets | May 18-21, 2015
Multiple Linear Regression:
AC_WPC_EXT
11
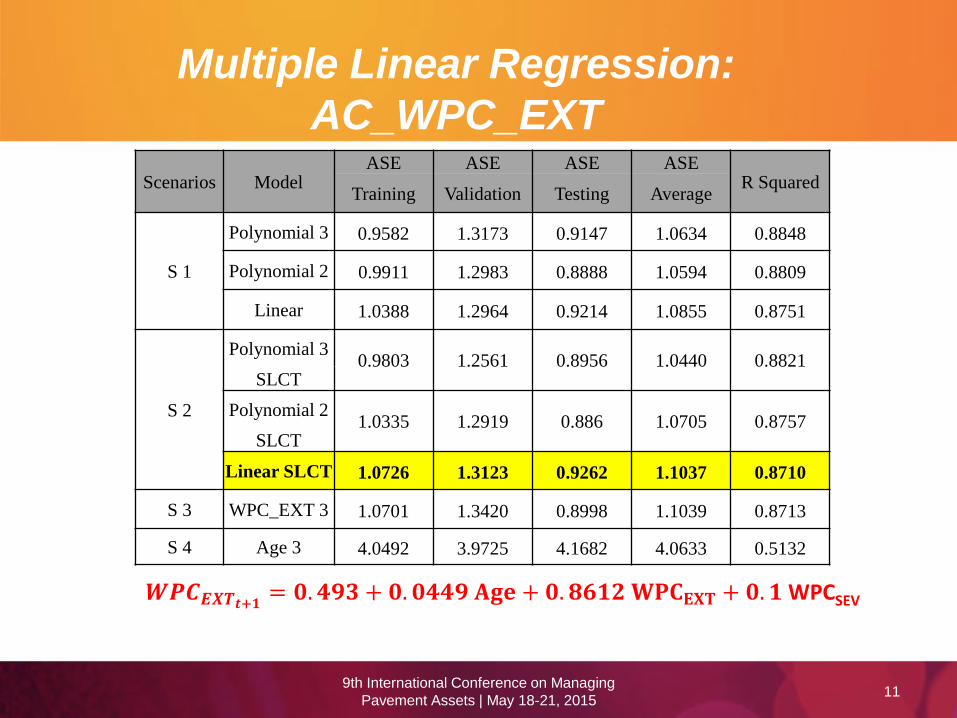
Scenarios Model ASE ASE ASE ASE
R Squared Training Validation Testing Average
S 1
Polynomial 3 0.9582 1.3173 0.9147 1.0634 0.8848
Polynomial 2 0.9911 1.2983 0.8888 1.0594 0.8809
Linear 1.0388 1.2964 0.9214 1.0855 0.8751
S 2
Polynomial 3 0.9803 1.2561 0.8956 1.0440 0.8821
SLCT
Polynomial 2 1.0335 1.2919 0.886 1.0705 0.8757
SLCT
Linear SLCT 1.0726 1.3123 0.9262 1.1037 0.8710
S 3 WPC_EXT 3 1.0701 1.3420 0.8998 1.1039 0.8713
S 4 Age 3 4.0492 3.9725 4.1682 4.0633 0.5132
𝑾𝑷𝑪𝑬𝑿𝑻𝒕+𝟏= 𝟎. 𝟒𝟗𝟑 + 𝟎. 𝟎𝟒𝟒𝟗 𝐀𝐠𝐞 + 𝟎. 𝟖𝟔𝟏𝟐 𝐖𝐏𝐂𝐄𝐗𝐓 + 𝟎. 𝟏 WPCSEV
9th International Conference on Managing
Pavement Assets | May 18-21, 2015
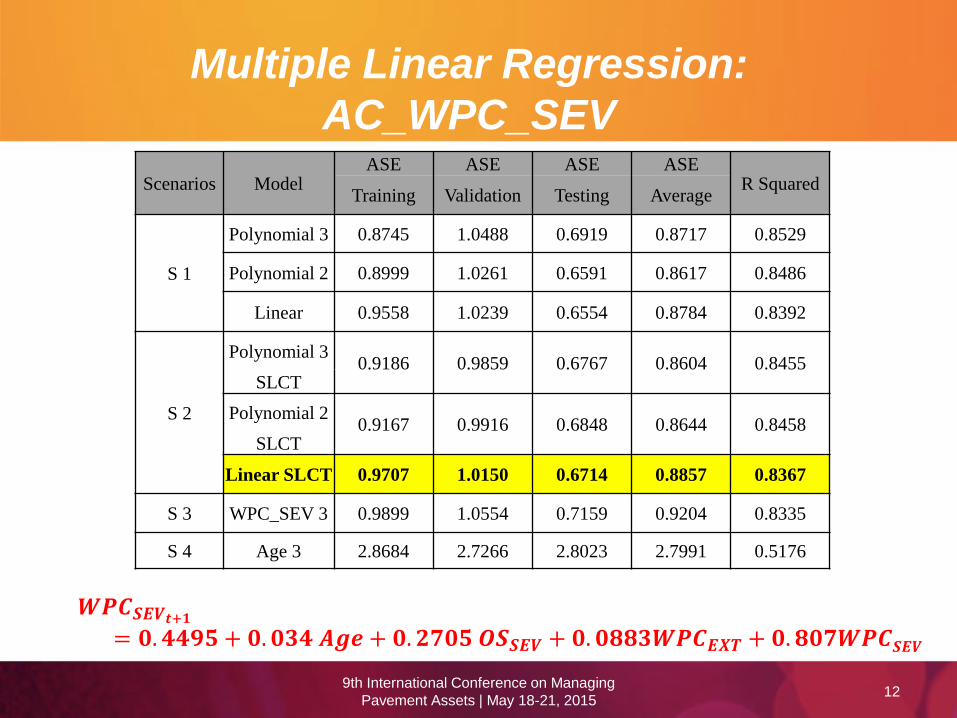
Multiple Linear Regression:
AC_WPC_SEV
12
Scenarios Model ASE ASE ASE ASE
R Squared Training Validation Testing Average
S 1
Polynomial 3 0.8745 1.0488 0.6919 0.8717 0.8529
Polynomial 2 0.8999 1.0261 0.6591 0.8617 0.8486
Linear 0.9558 1.0239 0.6554 0.8784 0.8392
S 2
Polynomial 3 0.9186 0.9859 0.6767 0.8604 0.8455
SLCT
Polynomial 2 0.9167 0.9916 0.6848 0.8644 0.8458
SLCT
Linear SLCT 0.9707 1.0150 0.6714 0.8857 0.8367
S 3 WPC_SEV 3 0.9899 1.0554 0.7159 0.9204 0.8335
S 4 Age 3 2.8684 2.7266 2.8023 2.7991 0.5176
𝑾𝑷𝑪𝑺𝑬𝑽𝒕+𝟏
= 𝟎. 𝟒𝟒𝟗𝟓 + 𝟎. 𝟎𝟑𝟒 𝑨𝒈𝒆 + 𝟎. 𝟐𝟕𝟎𝟓 𝑶𝑺𝑺𝑬𝑽 + 𝟎. 𝟎𝟖𝟖𝟑𝑾𝑷𝑪𝑬𝑿𝑻 + 𝟎. 𝟖𝟎𝟕𝑾𝑷𝑪𝑺𝑬𝑽
9th International Conference on Managing
Pavement Assets | May 18-21, 2015
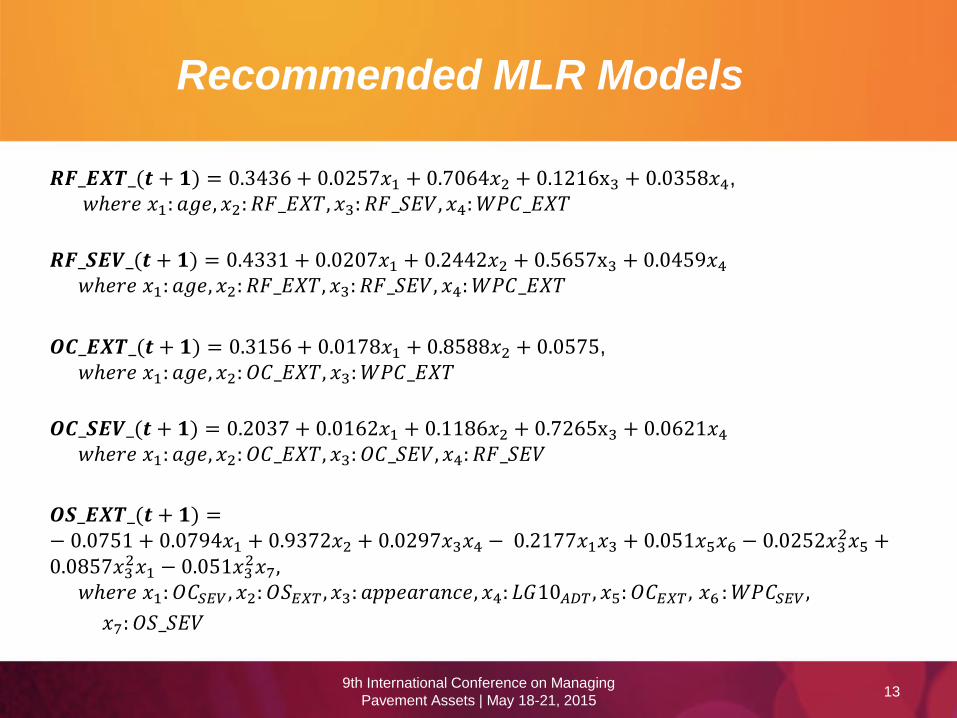
Recommended MLR Models
13
𝑹𝑭_𝑬𝑿𝑻_(𝒕 + 𝟏) = 0.3436 + 0.0257𝑥1 + 0.7064𝑥2 + 0.1216x3 + 0.0358𝑥4,
𝑤ℎ𝑒𝑟𝑒 𝑥1: 𝑎𝑔𝑒, 𝑥2: 𝑅𝐹_𝐸𝑋𝑇, 𝑥3: 𝑅𝐹_𝑆𝐸𝑉, 𝑥4: 𝑊𝑃𝐶_𝐸𝑋𝑇
𝑹𝑭_𝑺𝑬𝑽_(𝒕 + 𝟏) = 0.4331 + 0.0207𝑥1 + 0.2442𝑥2 + 0.5657x3 + 0.0459𝑥4
𝑤ℎ𝑒𝑟𝑒 𝑥1: 𝑎𝑔𝑒, 𝑥2: 𝑅𝐹_𝐸𝑋𝑇, 𝑥3: 𝑅𝐹_𝑆𝐸𝑉, 𝑥4: 𝑊𝑃𝐶_𝐸𝑋𝑇
𝑶𝑪_𝑬𝑿𝑻_(𝒕 + 𝟏) = 0.3156 + 0.0178𝑥1 + 0.8588𝑥2 + 0.0575,
𝑤ℎ𝑒𝑟𝑒 𝑥1: 𝑎𝑔𝑒, 𝑥2: 𝑂𝐶_𝐸𝑋𝑇, 𝑥3: 𝑊𝑃𝐶_𝐸𝑋𝑇
𝑶𝑪_𝑺𝑬𝑽_(𝒕 + 𝟏) = 0.2037 + 0.0162𝑥1 + 0.1186𝑥2 + 0.7265x3 + 0.0621𝑥4
𝑤ℎ𝑒𝑟𝑒 𝑥1: 𝑎𝑔𝑒, 𝑥2: 𝑂𝐶_𝐸𝑋𝑇, 𝑥3: 𝑂𝐶_𝑆𝐸𝑉, 𝑥4: 𝑅𝐹_𝑆𝐸𝑉
𝑶𝑺_𝑬𝑿𝑻_(𝒕 + 𝟏) =− 0.0751 + 0.0794𝑥1 + 0.9372𝑥2 + 0.0297𝑥3𝑥4 − 0.2177𝑥1𝑥3 + 0.051𝑥5𝑥6 − 0.0252𝑥3
2𝑥5 +0.0857𝑥3
2𝑥1 − 0.051𝑥32𝑥7,
𝑤ℎ𝑒𝑟𝑒 𝑥1: 𝑂𝐶𝑆𝐸𝑉 , 𝑥2: 𝑂𝑆𝐸𝑋𝑇 , 𝑥3: 𝑎𝑝𝑝𝑒𝑎𝑟𝑎𝑛𝑐𝑒, 𝑥4: 𝐿𝐺10𝐴𝐷𝑇 , 𝑥5: 𝑂𝐶𝐸𝑋𝑇 , 𝑥6 : 𝑊𝑃𝐶𝑆𝐸𝑉 ,
𝑥7: 𝑂𝑆_𝑆𝐸𝑉
9th International Conference on Managing
Pavement Assets | May 18-21, 2015
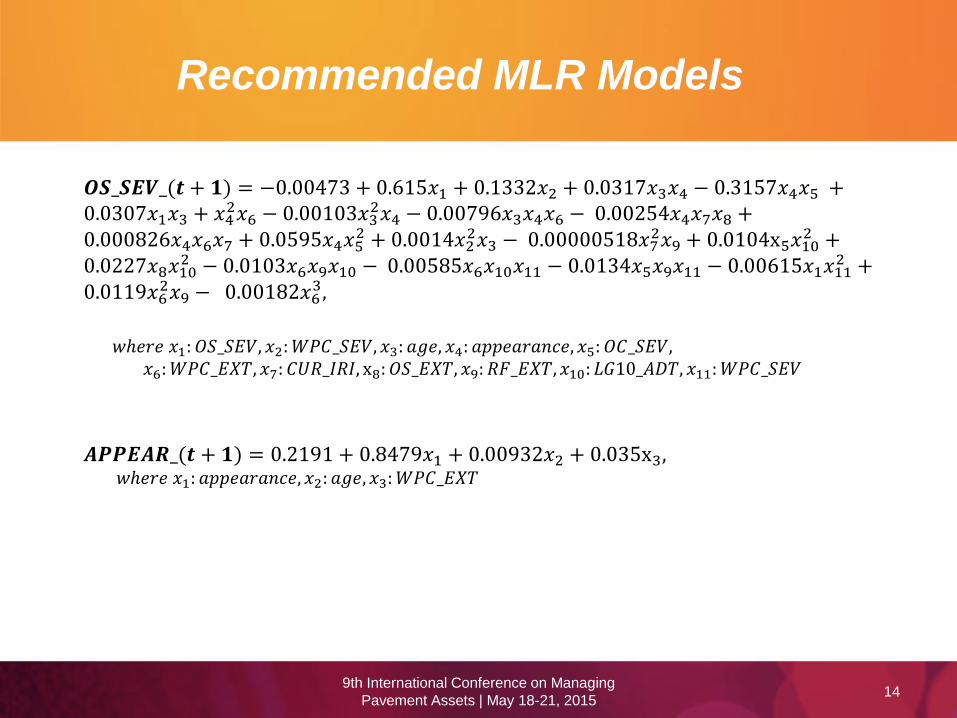
Recommended MLR Models
14
𝑶𝑺_𝑺𝑬𝑽_(𝒕 + 𝟏) = −0.00473 + 0.615𝑥1 + 0.1332𝑥2 + 0.0317𝑥3𝑥4 − 0.3157𝑥4𝑥5 +0.0307𝑥1𝑥3 + 𝑥4
2𝑥6 − 0.00103𝑥32𝑥4 − 0.00796𝑥3𝑥4𝑥6 − 0.00254𝑥4𝑥7𝑥8 +
0.000826𝑥4𝑥6𝑥7 + 0.0595𝑥4𝑥52 + 0.0014𝑥2
2𝑥3 − 0.00000518𝑥72𝑥9 + 0.0104x5𝑥10
2 +0.0227𝑥8𝑥10
2 − 0.0103𝑥6𝑥9𝑥10 − 0.00585𝑥6𝑥10𝑥11 − 0.0134𝑥5𝑥9𝑥11 − 0.00615𝑥1𝑥112 +
0.0119𝑥62𝑥9 − 0.00182𝑥6
3,
𝑤ℎ𝑒𝑟𝑒 𝑥1: 𝑂𝑆_𝑆𝐸𝑉, 𝑥2: 𝑊𝑃𝐶_𝑆𝐸𝑉, 𝑥3: 𝑎𝑔𝑒, 𝑥4: 𝑎𝑝𝑝𝑒𝑎𝑟𝑎𝑛𝑐𝑒, 𝑥5: 𝑂𝐶_𝑆𝐸𝑉,
𝑥6: 𝑊𝑃𝐶_𝐸𝑋𝑇, 𝑥7: 𝐶𝑈𝑅_𝐼𝑅𝐼, x8: 𝑂𝑆_𝐸𝑋𝑇, 𝑥9: 𝑅𝐹_𝐸𝑋𝑇, 𝑥10: 𝐿𝐺10_𝐴𝐷𝑇, 𝑥11: 𝑊𝑃𝐶_𝑆𝐸𝑉
𝑨𝑷𝑷𝑬𝑨𝑹_(𝒕 + 𝟏) = 0.2191 + 0.8479𝑥1 + 0.00932𝑥2 + 0.035x3,
𝑤ℎ𝑒𝑟𝑒 𝑥1: 𝑎𝑝𝑝𝑒𝑎𝑟𝑎𝑛𝑐𝑒, 𝑥2: 𝑎𝑔𝑒, 𝑥3: 𝑊𝑃𝐶_𝐸𝑋𝑇
9th International Conference on Managing
Pavement Assets | May 18-21, 2015
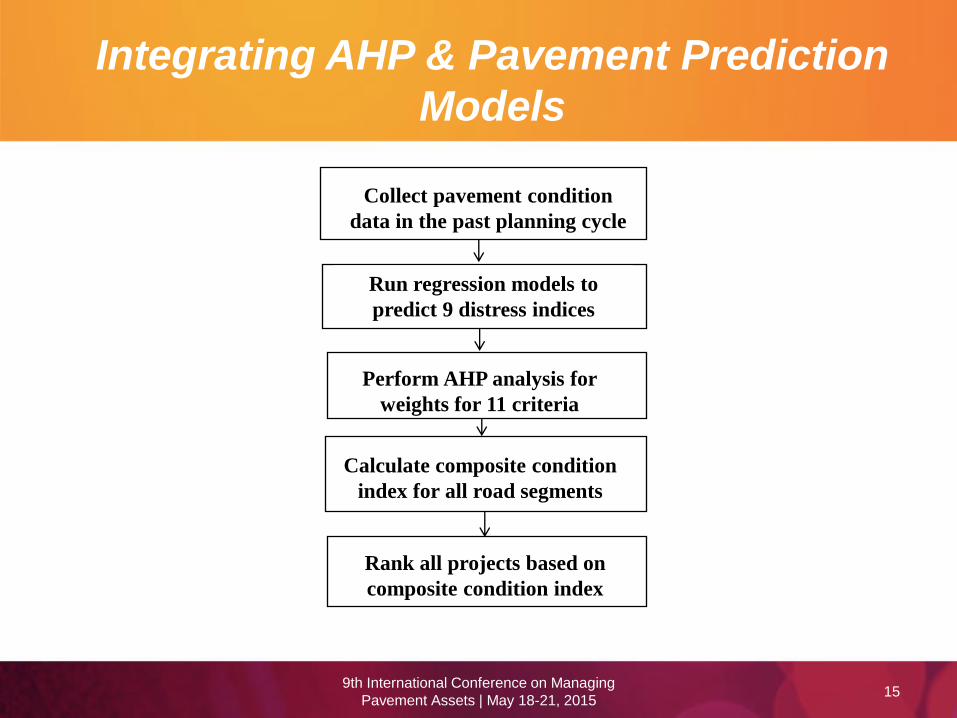
Integrating AHP & Pavement Prediction
Models
15
Collect pavement condition
data in the past planning cycle
Run regression models to
predict 9 distress indices
Perform AHP analysis for
weights for 11 criteria
Calculate composite condition
index for all road segments
Rank all projects based on
composite condition index
9th International Conference on Managing
Pavement Assets | May 18-21, 2015
A Composite Pavement Distress
Index
16
The analytic hierarchy process (AHP) is a structured technique for organizing and analyzing complex decisions, based on mathematics and psychology.
In practice, AHP has been used by companies and organizations including Intel, Apple, NASA and Xerox to make decisions on choice, prioritization, resource allocation, etc.
9th International Conference on Managing
Pavement Assets | May 18-21, 2015
The Curent Rating Method
17
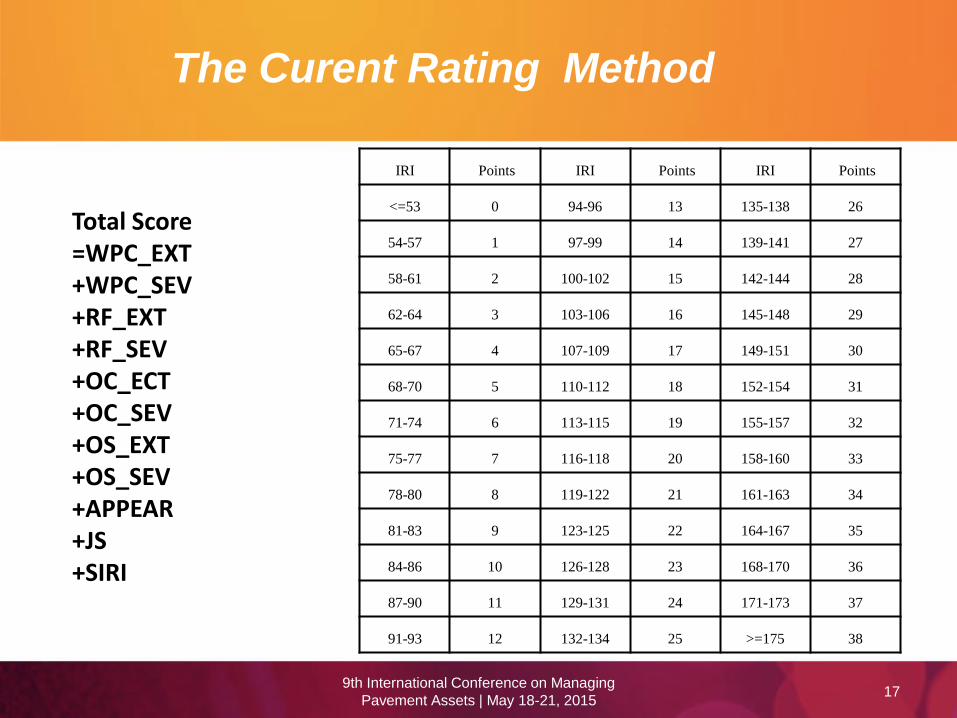
Total Score =WPC_EXT +WPC_SEV +RF_EXT +RF_SEV +OC_ECT +OC_SEV +OS_EXT +OS_SEV +APPEAR +JS +SIRI
IRI Points IRI Points IRI Points
<=53 0 94-96 13 135-138 26
54-57 1 97-99 14 139-141 27
58-61 2 100-102 15 142-144 28
62-64 3 103-106 16 145-148 29
65-67 4 107-109 17 149-151 30
68-70 5 110-112 18 152-154 31
71-74 6 113-115 19 155-157 32
75-77 7 116-118 20 158-160 33
78-80 8 119-122 21 161-163 34
81-83 9 123-125 22 164-167 35
84-86 10 126-128 23 168-170 36
87-90 11 129-131 24 171-173 37
91-93 12 132-134 25 >=175 38
9th International Conference on Managing
Pavement Assets | May 18-21, 2015

Composite Pavement Distress Index
18
Intensity of
importance
Definition
1 “factor A” and “factor B” are equally important
3 “factor A” is moderately favored than “factor B”
5 “factor A” is strongly favored than “factor B”
7 “factor A” is very strongly favored than “factor B”
9 “factor A” is extremely favored than “factor B”
2,4,6,8 Ratings are between two adjacent judgments
WPC_EXT 5 RF_EXT 1 Pairwise comparison
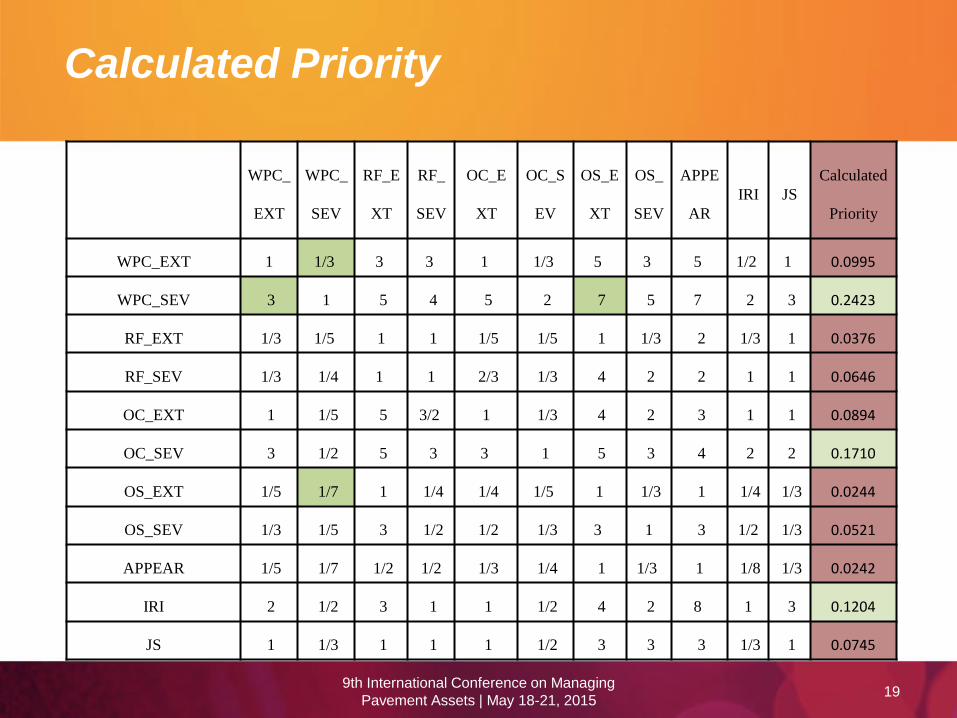
There are 11 criteria and 55 pairwise comparisons.
9th International Conference on Managing
Pavement Assets | May 18-21, 2015
Calculated Priority
19
WPC_
EXT
WPC_
SEV
RF_E
XT
RF_
SEV
OC_E
XT
OC_S
EV
OS_E
XT
OS_
SEV
APPE
AR IRI JS
Calculated
Priority
WPC_EXT 1 1/3 3 3 1 1/3 5 3 5 1/2 1 0.0995
WPC_SEV 3 1 5 4 5 2 7 5 7 2 3 0.2423
RF_EXT 1/3 1/5 1 1 1/5 1/5 1 1/3 2 1/3 1 0.0376
RF_SEV 1/3 1/4 1 1 2/3 1/3 4 2 2 1 1 0.0646
OC_EXT 1 1/5 5 3/2 1 1/3 4 2 3 1 1 0.0894
OC_SEV 3 1/2 5 3 3 1 5 3 4 2 2 0.1710
OS_EXT 1/5 1/7 1 1/4 1/4 1/5 1 1/3 1 1/4 1/3 0.0244
OS_SEV 1/3 1/5 3 1/2 1/2 1/3 3 1 3 1/2 1/3 0.0521
APPEAR 1/5 1/7 1/2 1/2 1/3 1/4 1 1/3 1 1/8 1/3 0.0242
IRI 2 1/2 3 1 1 1/2 4 2 8 1 3 0.1204
JS 1 1/3 1 1 1 1/2 3 3 3 1/3 1 0.0745
9th International Conference on Managing
Pavement Assets | May 18-21, 2015
Results
20
We conducted a pilot study using two subsets of road segments to compare the recommendations from the current rating system and those from the proposed rating system using AHP.
Two subsets are randomly selected from the 2010 pavement condition database, whose conditions need treatments.
9th International Conference on Managing
Pavement Assets | May 18-21, 2015
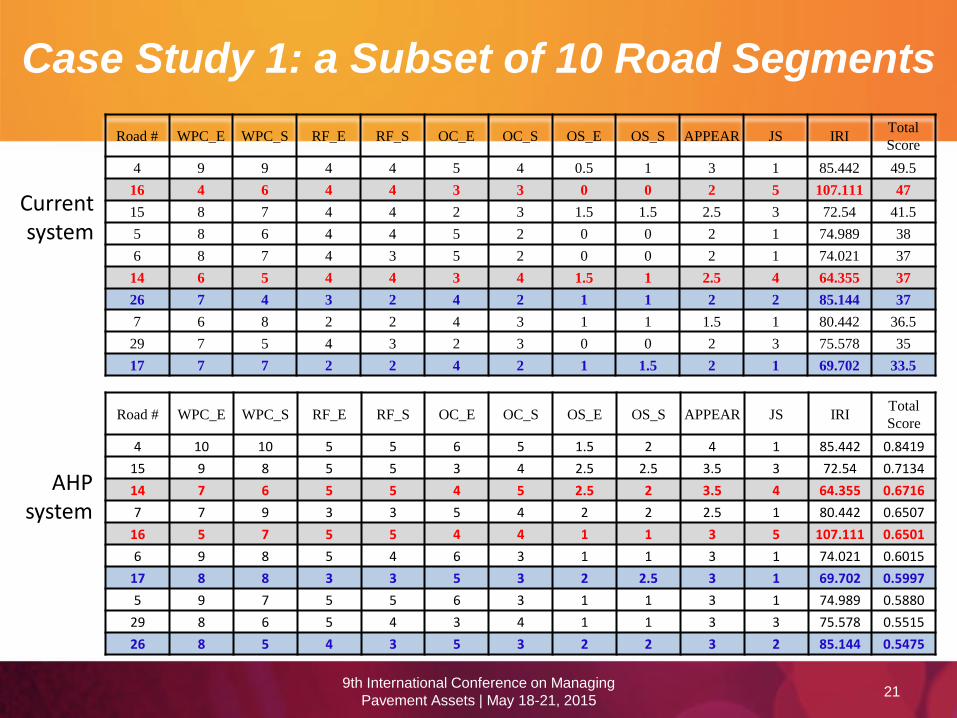
Case Study 1: a Subset of 10 Road Segments
21
Road # WPC_E WPC_S RF_E RF_S OC_E OC_S OS_E OS_S APPEAR JS IRI Total
Score
4 9 9 4 4 5 4 0.5 1 3 1 85.442 49.5
16 4 6 4 4 3 3 0 0 2 5 107.111 47
15 8 7 4 4 2 3 1.5 1.5 2.5 3 72.54 41.5
5 8 6 4 4 5 2 0 0 2 1 74.989 38
6 8 7 4 3 5 2 0 0 2 1 74.021 37
14 6 5 4 4 3 4 1.5 1 2.5 4 64.355 37
26 7 4 3 2 4 2 1 1 2 2 85.144 37
7 6 8 2 2 4 3 1 1 1.5 1 80.442 36.5
29 7 5 4 3 2 3 0 0 2 3 75.578 35
17 7 7 2 2 4 2 1 1.5 2 1 69.702 33.5
Road # WPC_E WPC_S RF_E RF_S OC_E OC_S OS_E OS_S APPEAR JS IRI Total
Score
4 10 10 5 5 6 5 1.5 2 4 1 85.442 0.8419
15 9 8 5 5 3 4 2.5 2.5 3.5 3 72.54 0.7134
14 7 6 5 5 4 5 2.5 2 3.5 4 64.355 0.6716
7 7 9 3 3 5 4 2 2 2.5 1 80.442 0.6507
16 5 7 5 5 4 4 1 1 3 5 107.111 0.6501
6 9 8 5 4 6 3 1 1 3 1 74.021 0.6015
17 8 8 3 3 5 3 2 2.5 3 1 69.702 0.5997
5 9 7 5 5 6 3 1 1 3 1 74.989 0.5880
29 8 6 5 4 3 4 1 1 3 3 75.578 0.5515
26 8 5 4 3 5 3 2 2 3 2 85.144 0.5475
9th International Conference on Managing
Pavement Assets | May 18-21, 2015
Current system
AHP system

Comparison on Priorities Priority = 10 receives treatment first
22
0
1
2
3
4
5
6
7
8
9
10
-10 10 30 50 70 90 110 130 150
Pri
ori
ty =
11
- R
ank
Ord
er
IRI
Current rating system
Composite pavementdistress index
A2
#16
B1
#14
B2
#14
A1
#16
9th International Conference on Managing
Pavement Assets | May 18-21, 2015
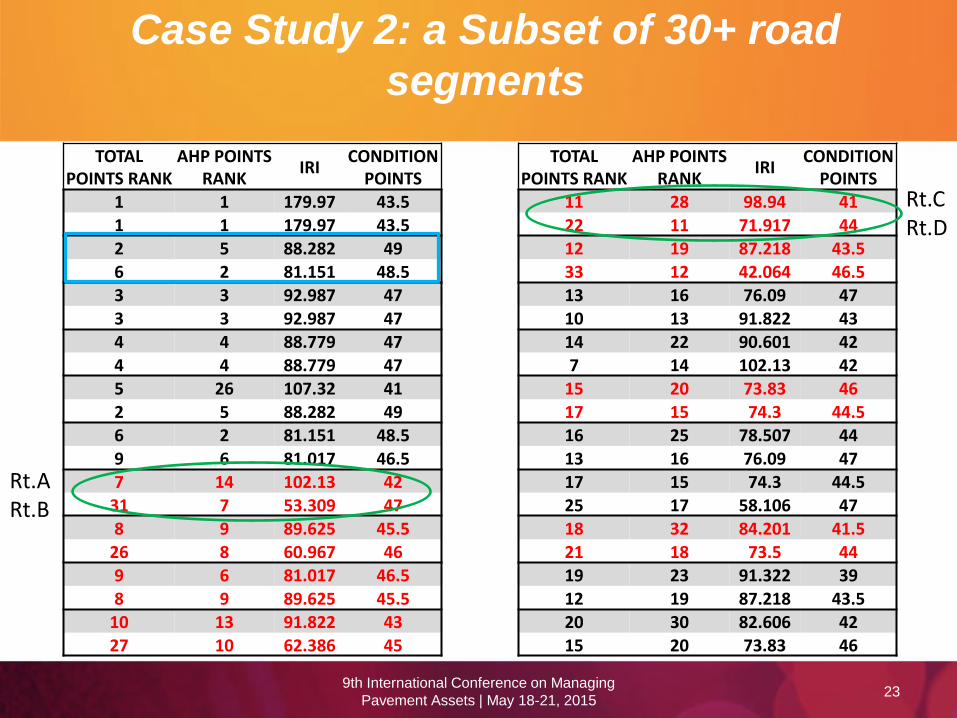
Case Study 2: a Subset of 30+ road
segments
23 9th International Conference on Managing
Pavement Assets | May 18-21, 2015
TOTAL POINTS RANK
AHP POINTS RANK
IRI CONDITION
POINTS 1 1 179.97 43.5
1 1 179.97 43.5 2 5 88.282 49 6 2 81.151 48.5
3 3 92.987 47 3 3 92.987 47
4 4 88.779 47 4 4 88.779 47
5 26 107.32 41 2 5 88.282 49 6 2 81.151 48.5
9 6 81.017 46.5 7 14 102.13 42
31 7 53.309 47
8 9 89.625 45.5
26 8 60.967 46 9 6 81.017 46.5 8 9 89.625 45.5
10 13 91.822 43 27 10 62.386 45
TOTAL POINTS RANK
AHP POINTS RANK
IRI CONDITION
POINTS 11 28 98.94 41
22 11 71.917 44 12 19 87.218 43.5 33 12 42.064 46.5
13 16 76.09 47 10 13 91.822 43
14 22 90.601 42 7 14 102.13 42
15 20 73.83 46 17 15 74.3 44.5 16 25 78.507 44
13 16 76.09 47 17 15 74.3 44.5
25 17 58.106 47
18 32 84.201 41.5
21 18 73.5 44 19 23 91.322 39 12 19 87.218 43.5
20 30 82.606 42 15 20 73.83 46
Rt.A Rt.B
Rt.C Rt.D
Conclusions
24
We developed multiple linear regression models for KYTC to predict 9 distress indices for AC pavement for Kentucky Interstate parkways.
The R2 values of all the MLR models are larger than 0.85 except OS_SEV. Meanwhile, the average ASE from the MLR models is fairly small (~0.1)
AHP-based composite distress index seems to address the overemphasis on IRI by the current rating method.
9th International Conference on Managing
Pavement Assets | May 18-21, 2015
Consistency Ratio
25 9th International Conference on Managing
Pavement Assets | May 18-21, 2015
• Consistency ratio for the above
pairwise comparison matrix is 0.0482
<< 0.1, a threshold value for AHP to be
valid.
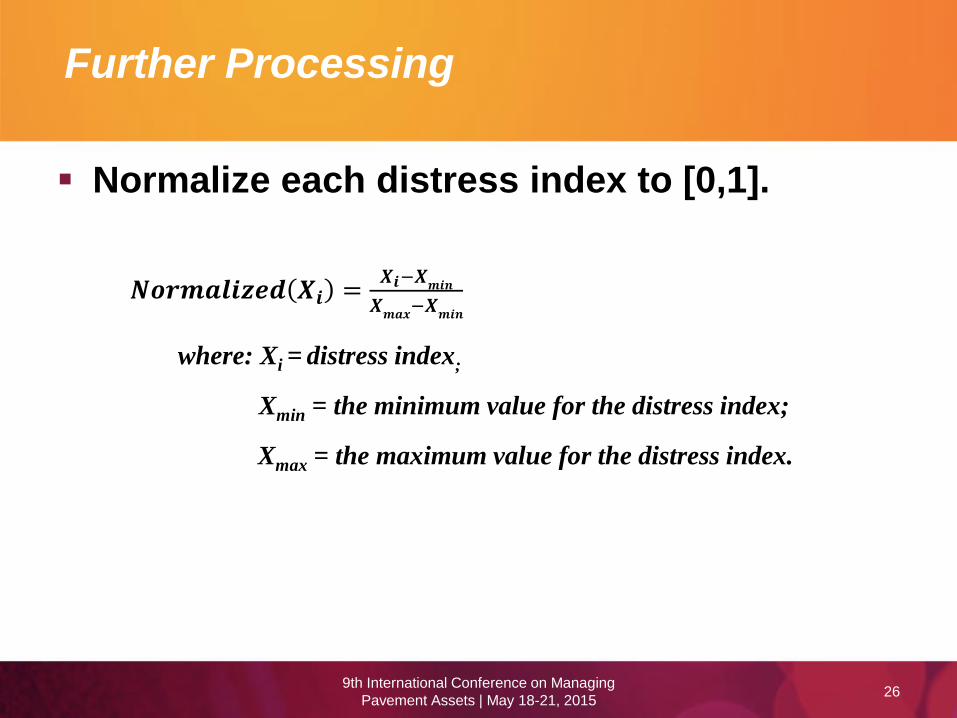
Further Processing
26
𝑵𝒐𝒓𝒎𝒂𝒍𝒊𝒛𝒆𝒅 𝑿𝒊 =𝑿𝒊−𝑿
𝒎𝒊𝒏
𝑿𝒎𝒂𝒙
−𝑿𝒎𝒊𝒏
where: Xi = distress index;
Xmin = the minimum value for the distress index;
Xmax = the maximum value for the distress index.
Normalize each distress index to [0,1].
9th International Conference on Managing
Pavement Assets | May 18-21, 2015