Embed Size (px)
Citation preview

Pavement Condition Surveys – Overview of Current Practices
By
Nii Attoh-Okine Offei Adarkwa
June, 2013
Delaware Center for Transportation University of Delaware
355 DuPont Hall Newark, Delaware 19716
(302) 831-1446
DCT 245

The Delaware Center for Transportation is a university-wide multi-disciplinary research unit reporting to the Chair of the Department of Civil and Environmental Engineering, and is co-sponsored by the University of Delaware and the Delaware Department of Transportation.
DCT Staff
Ardeshir Faghri Jerome Lewis Director Associate Director
Ellen Pletz Earl “Rusty” Lee Matheu Carter Sandra Wolfe
Business Administrator I T2 Program Coordinator T² Engineer Event Coordinator
DCT Policy Council
Robert McCleary, Co-Chair Chief Engineer, Delaware Department of Transportation
Babatunde Ogunnaike, Co-Chair Dean, College of Engineering
Delaware General Assembly Member
Chair, Senate Highways & Transportation Committee
Delaware General Assembly Member Chair, House of Representatives Transportation/Land Use & Infrastructure Committee
Ajay Prasad
Professor, Department of Mechanical Engineering
Harry Shenton Chair, Civil and Environmental Engineering
Drew Boyce
Director of Planning, Delaware Department of Transportation
Ralph Reeb Planning Division, Delaware Department of Transportation
Executive Director, Delaware Transit Corporation
Representative of the Director of the Delaware Development Office
James Johnson President, JTJ Engineers, LLC
Holly Rybinski
Rybinski Engineering
Delaware Center for Transportation University of Delaware
Newark, DE 19716 (302) 831-1446

Project Report for
Pavement Condition Surveys – Overview of Current Practices
Prepared for
Delaware Department of Transportation
by
Nii Attoh-Okine Offei Adarkwa
Delaware Center for Transportation
College of Engineering University of Delaware
Newark, DE 19716
June 2013
This work was sponsored by the Delaware Center for Transportation and was prepared in cooperation with the Delaware Department of Transportation. The contents of this report reflect the view of the authors who are responsible for the facts and accuracy of the data presented herein. The contents do not necessarily reflect the official views of the Delaware Center for Transportation or the Delaware Department of Transportation at the time of publication. This report does not constitute a standard, specification, or regulation.

2013
PAVEMENT CONDITION SURVEYS OVERVIEW OF CURRENT PRACTICES OFFEI ADARKWA & PROF. NII ATTOH-OKINE JUNE 2013

PAVEMENT CONDITION SURVEY
EXECUTIVE SUMMARY
Pavement Condition Surveys refer to activities performed to give an indication of the serviceability
and physical conditions of road pavements. These activities have three main aspects namely data
collection, condition rating and quality management. In recent times, most state agencies are
inclined towards automated and semi-automated means of collecting pavement data. Condition
rating involves quantifying the condition of pavement assets based on a chosen scale or index. The
rating index selected by an agency depends on the agency’s available resources and its ability to
address pavement issues prevalent in the area. There are two main groups of condition indexes;
estimated and measured condition indexes. Estimated condition ratings are based on observed
physical conditions of the pavements while the measured condition rating systems are not only
based on observations by trained raters but are also backed by physical measurements such as
roughness and mathematical expressions. Quality management is done to ensure that the data
collected meets the needs of the pavement management process. It involves activities such as
specification of data collection protocols, quality criteria, responsibilities of personnel, quality
control, quality acceptance, corrective action and quality management documentation.
There is room for improvement in all aspects of the pavement management process. Quality
criteria need to be updated periodically using basic statistical tools. All quality management
procedures must be well documented to help improve future data quality control and assurance
procedures. With quality and reliable data, pavement management will be improved and this will
ultimately lead to efficient use of pavement assets.
1

Table of Contents
1.0 INTRODUCTION .................................................................................................................... 5
1.1 Background ........................................................................................................................... 5
1.2 Importance of Condition Rating Surveys .............................................................................. 6
1.3 Objectives .............................................................................................................................. 7
1.4 Layout of Report ................................................................................................................... 7
2.0 CONDITION RATING PROCESS ..................................................................................... 8
2.1 Brief History .......................................................................................................................... 8
2.2 Data Collection .................................................................................................................... 11
2.2.1 Data Collection Methods .............................................................................................. 12
2.2.2 Data Collection Equipment .......................................................................................... 14
2.3 Condition Rating Systems ................................................................................................... 23
2.3.1 Evolution ...................................................................................................................... 23
2.3.2 Classes of Condition Indexes ....................................................................................... 24
2.3.2.1 Estimated Condition Survey ...................................................................................... 25
2.3.2.2 Measured Condition Rating ....................................................................................... 27
2.4 Quality Management ........................................................................................................... 34
2.4.1 Quality Management of Distress Data .......................................................................... 36
2.4.2 Quality Management of ride quality data ..................................................................... 36
3.0 CURRENT PRACTICES IN THE US .............................................................................. 38
4.0 EVALUATION.................................................................................................................. 52
4.1 Network & Project Level Data Collection .......................................................................... 52
4.2 Manual & Automated Data Collection................................................................................ 53
4.3 Types of Data Collected & Frequency ................................................................................ 54
4.2 Consistency in Pavement Distress Ratings ......................................................................... 56
4.5 Differences among Pavement Condition Indexes ............................................................... 58
5.0 CONCLUSIONS & RECOMMENDATIONS .................................................................. 60
5.1 Conclusion ........................................................................................................................... 60
5.2 Recommendations ............................................................................................................... 62
REFERENCES ............................................................................................................................. 63
2

LIST OF FIGURES
Figure 1: Pavement performance in terms of condition ratings over time ..................................... 9 Figure 2: Pavement Management Process .................................................................................... 10 Figure 3: Auto Rod and Level Device .......................................................................................... 15 Figure 4: Dipstick 2000 ................................................................................................................ 16 Figure 5: Computerized Profilograph ........................................................................................... 17 Figure 6: Real System from PASCO ............................................................................................ 18 Figure 7: ARAN vehicle ............................................................................................................... 19 Figure 8: Pathway Services Inc., Digital Inspection Vehicle (DIV) ............................................. 21 Figure 9 Pavement Condition Rating Systems ............................................................................. 25 Figure 10: Present Serviceability Rating ...................................................................................... 25 Figure 11: PCI Ratings (Illinois Center for Transportation, Implementing Pavement Management Systems for Local Agencies-State-of-the-Art/ State-of-the-Practice) .......................................... 28 Figure 12: Typical utility curve .................................................................................................... 49 Figure 13: Accuracy and Precision ............................................................................................... 57
LIST OF TABLES
Table 1: Comparison of Automated and Manual Pavement Data Collection Methods ................ 13 Table 2: Summary of automated equipment used in pavement evaluation .................................. 22 Table 3: PASER ratings and maintenance requirements .............................................................. 26 Table 4: Bituminous Pavement Weighting Factors ...................................................................... 30 Table 5: Concrete Pavement Weighting Factors .......................................................................... 30 Table 6: Continuously Reinforced Concrete Pavement Weighting Factors ................................. 31 Table 7: Total weighting and SR .................................................................................................. 31 Table 8: Equivalent Cracking Valuation for Asphalt Concrete .................................................... 33 Table 9: PSC Categories ............................................................................................................... 33 Table 10: Flexible Pavement Defects and Severity Levels (DelDOT) ......................................... 39 Table 12: Surface Treated Pavement Defects and Severity Levels (DelDOT) ............................ 40 Table 13: Composite Pavement Defects and Severity Levels (DelDOT)..................................... 41 Table 14: Rigid Pavement Defects and Severity Levels (DelDOT) ............................................. 42 Table 15: Flexible Pavement Defects and Levels of Defect Extents (DelDOT) .......................... 44 Table 16: Surface Treated Pavement Defects and Levels of Defect Extents (DelDOT) .............. 44 Table 17: Composite Pavement Defects and Levels of Defect Extents (DelDOT) ...................... 44 Table 18: Rigid Pavement Defects & Levels of Defect Extents (DelDOT) ................................. 45 Table 19: PENNDOT Data discrepancy tolerances ...................................................................... 46 Table 20: Comparison of Network Level and Project Level Data Collection .............................. 53 Table 21 Summary of Pavement condition data collection methods [xv] .................................... 54 Table 22: Data Collected by state agencies and Frequency of Collection .................................... 55
3

ABSTRACT
Pavement condition surveys form the core part of pavement management. The overall goal of
pavement management is to ensure efficient use of resources by assisting management in making
informed decisions. In other words, pavement management reduces the level of subjectivity in
decision making. Condition surveys have three main aspects namely; data collection, condition
rating and quality management. This document examines the evolution of various aspects of
condition ratings. It also takes a closer look at current practices by some transportation agencies
in the United States.
4

1.0 INTRODUCTION
Pavements form a greater part of our society’s infrastructure system whose proper functioning is
essential for development. Similar to other types of infrastructure assets, pavements deteriorate
over time. Therefore, there is the need to find ways to preserve these capital intensive assets to
ensure they perform as expected. This need resulted in the development of periodic and routine
maintenance activities undertaken by Departments of Transportation (DOTs) nationwide.
The level of repair and rehabilitation done on the roads depends on the physical condition of the
road at a particular time in relation to its acceptable and operable condition. Thus, the condition
of pavements is monitored regularly and this is known as pavement condition monitoring. These
condition monitoring surveys play a vital role in pavement management since it provides
valuable information that forms the basis of repair and rehabilitation activities. The information
given to management staff is usually in the form of condition ratings of specific sections or an
entire pavement network based on which sound and informed decisions are made.
Pavement condition rating refers to a score that quantifies the performance of a pavement section
or an entire network. The score is based on visual inspection and or measures such as roughness,
skid resistance, deflection among others. Condition Rating systems used by states as part of their
pavement management systems differ as a result of different requirements by State DOTs as well
as the rating system’s cost of implementation and ease of understanding. This report investigates
all aspects of pavement condition surveys and rating systems in use nationwide.
1.1 Background
Pavement condition surveys give an indication of the serviceability of the road pavements and also
the physical condition of the assets. It is referred to as the collection of data to determine the ride
5

quality and structural integrity of a road segment [iv].They are based on observations by trained
staff as well as measurements of pavement roughness, surface distress, skid resistance, deflection,
among others. Condition ratings may be done manually or through automated means. The choice
of whether automated or manual depends on an agency’s priorities and its available resources. The
condition rating for a particular section is chosen from a scale which may range from 0 to 100, 0
to 5 or even 0 to 99. There are three main aspects of condition surveys which will be looked at in
detail in this document. They are data collection, condition rating and quality management.
1.2 Importance of Condition Rating Surveys
Pavement Condition Surveys are vital to the operations of DOTs due to several reasons.
First, pavement condition monitoring helps agencies to schedule maintenance and rehabilitation
works efficiently [i]. As a result, the DOTs have an idea as to when to carry out maintenance in
order to effectively utilize the assets during its useful lifespan. This is done by setting a threshold
level of performance which will indicate acceptable and non-acceptable operating conditions.
Second, pavement condition ratings are used as a fair basis of comparison for different pavements.
In other words, pavement condition ratings allows for a more objective comparison of two or more
pavement sections. This becomes important when prioritizing maintenance and rehabilitation
projects.
Third, condition ratings enable DOTs and all stakeholders to estimate the level of repair and
rehabilitation required in terms of costs and extent of deterioration. This is because the condition
ratings reflect the current condition of the pavement.
Lastly, data obtained from condition surveys can be used for long-term budget planning. The
survey data of past and present conditions can be used to project future conditions and this serves
6

as a guide for management during allocation of funds for future works. With condition ratings,
management decisions are no longer based on sentiments and hunches but rather on the valuable
and reliable information provided by the condition ratings.
1.3 Objectives
This report will seek to:
1. Identify issues in Pavement data collection;
2. Identify the types of equipment used in data collection;
3. Identify types of condition rating systems and the variables and factors affecting
performance; and
4. Address various data quality management procedures.
1.4 Layout of Report
This report has 5 main chapters. The first chapter is the introduction. The second chapter sheds
light on the three main aspects of pavement condition surveys. The third chapter takes a look at
current condition rating practices in the country. Chapter four contains the evaluation of the various
aspects of condition rating such as the equipment and indices used and chapter five is the
concluding chapter.
7

2.0 CONDITION RATING PROCESS
2.1 Brief History
The main purpose of highways is to serve the highway users by giving a comfortable and safe ride
to their destinations. As such, DOTs were charged with the responsibility of ensuring the needs of
the public are met when using the highways. In order to perform their tasks, DOTs needed to define
what comfort was for the general public. This was and still is a difficult question to answer since
what may be comfortable to an individual may not be comfortable for others. State departments
relied on the personal knowledge and experience of their staff to maintain their highways [ii]. As
a result, condition surveys were done by engineers and trained inspectors who identified distresses
on the roads based on visual inspections. The manual means of conducting condition surveys were
found to be subjective, time-consuming and often times hazardous for the staff. Efforts were made
to automate the entire condition survey and rating process. Currently, some state DOT’s, for
example Maryland, employ fully-automated condition survey systems. In the 1960’s, a condition
index was developed by the American Association of State Highway Officials (AASHO) in order
to make pavement condition surveys more objective. This index was based largely on the Present
Serviceability Rating (PSR) which was also based on ride quality as experienced by a panel of
raters riding in a vehicle on the road.
Condition ratings are done periodically by the state DOTs. The data accumulated serves as a
valuable source of information for assessing and predicting the performance of the pavement over
time. See figure 1. This helps in anticipating rehabilitation needs and prioritizing competing
projects [iii].
8

Figure 1: Pavement performance in terms of condition ratings over time
The condition survey process is composed of three main activities, namely; Data collection,
Quality Control (QC)/Quality Assurance (QA), and Condition rating. QC/QA can also be referred
to as Quality Management. It is worth noting that the condition survey process is part of the larger
Pavement Management process which involves decision making. See figure 2. Information
obtained after the condition surveys is then packaged and sent to management. Decisions are then
made based on this information. The decision making process may be optimized using Pavement
Management Software (PMS) and other optimization tools. These tools make use of models that
predict the pavement performance over time and influence decisions to be taken. QC activities are
performed before data collection, during data collection and after data collection. QA is performed
before data is delivered to management for decisions to be made.
9

Figure 2: Pavement Management Process
Figure 2 above shows that pavement condition survey is a part of the pavement management
process which includes the decision making procedures. The scope of this study is pavement
condition survey. The first step is the QC step which requires calibration of equipment and random
field tests. After the results of the field tests are accepted, data collection takes place. QC is done
after data collection to ensure acceptable data quality. Corrective actions involving calibration and
rating is done when results of QC are not acceptable. Condition ratings are then carried out on the
data. Before data is fed to decision-making and optimization tools or sent to management, quality
assurance is done again to ensure that the results are coherent.
10

2.2 Data Collection
Data collection is a very important part of the condition survey process. The type of data that is
collected by DOTs varies nationwide. This is because different DOTs consider different factors as
indicators of pavement performance and deterioration. Examples of data collected during surveys
are rut depth, International Roughness Index (IRI), faulting, among others. Data that is collected
during condition surveys depend on the type of pavement, whether rigid or flexible. The types of
data collected can be categorized into four groups. They are distress data, structural capacity, ride
quality data and skid resistance data.
Ride quality data refers to IRI, profile data and Present Serviceability Rating (PSR) data. It is data
that gives an indication of how comfortable it is to ride along a particular section. Ride quality data
is sometimes referred to as roughness data. This type of data is associated with the quality of the
ride as experienced by road users. The ride quality is quantified using the IRI or PSR.
Distress data also refers to the data that describes the types, extent and severities of distresses on
the pavement surface. This type of data is usually in the form of pavement images and videos
which are analyzed by trained engineers who identify the distresses present. Similarly, the data
can also be collected through visual inspections during condition surveys. Pavement distresses are
major signs of deterioration and usually manifest as distortions, disintegrations and fractures [xiii].
Distortions refer to corrugations and rutting. Disintegrations also refer to spalling, stripping and
raveling. Fracture is the broad term referring to cracking as a result of traffic loadings and changes
in temperature. This is the data that is mostly used as a basis to determine the type of maintenance
work that is required for a particular section of pavement.
Structural Capacity data gives an indication of the load carrying capacity of the pavement. This
type of data collection is usually conducted at the project level using destructive and non-
11

destructive methods. Deflection measurements are typically used to calculate the load transfer
capabilities of the structural layers and hence, the structural capacity of the pavement [xiii].
Deflection at a point is defined as the vertical deflected distance as a result of dynamic or static
loading at a specific point.
Skid resistance refers to the force developed when a wheel slides along a pavement surface when
it is prevented from rotating. It is dependent on the microtexture and macrotexture of pavements.
It is generally expressed in terms of friction factor, f or skid number, SN[xiii].
f=F/L (1)
SN=100*f (2)
where F=frictional resistance opposing motion in the plane of the interface and L=load
perpendicular to interface.
There must be some level of skid resistance in order to prevent skidding accidents. Skid resistance
decreases over time as the aggregates used in the pavement construction become polished. Skid
resistance varies seasonally and so this must also be taken into consideration during measurement.
It is worth mentioning that the condition ratings of pavements are based on the aforementioned
data types. Some condition rating systems are based on only one category of data or a combination
of all the four types.
2.2.1 Data Collection Methods
There are two approaches to collecting pavement data. They are automated and manual pavement
data collection methods. Currently, most state DOTs are gravitating towards the automated
approach due to several reasons. For example, Maryland has a fully automated pavement condition
12

survey system. However, the manual methods have unique characteristics that make DOTs
continue to rely on them. The characteristics of both approaches are tabulated in table 1. The two
methods are compared in terms of time, safety of staff, objectivity of measurements, cost, data
size, handling and employers’ point of view. An agency’s preference for one of these approaches
or even a combination of them is based on the amount of financial resources and human capital it
has as well as the level of detail and accuracy of data required.
Table 1: Comparison of Automated and Manual Pavement Data Collection Methods
Automated Data Collection Manual Data Collection
Time Reduces data collection times Longer data collection times
Safety Much safer means of collecting data Personnel at risk collecting data
Objectivity Objective measurements Usually subjective since it depends on
experience of personnel
Cost Very expensive equipment costs Relatively less expensive
Data Size Vast amounts of data collected & stored
depending on capacity of equipment
Agencies may only be able to collect
smaller amounts of data at a time
Data
Handling
Not subject to transcription errors Subject to transcription errors
Employers Suitable in agencies seeking to downsize
number of employees
Source of employment for rating staff
Coverage May cover footprint of data collection
vehicle. Multiple runs sometimes needed
to cover entire road width
Inspectors can cover entire width of
road section relatively easier
13
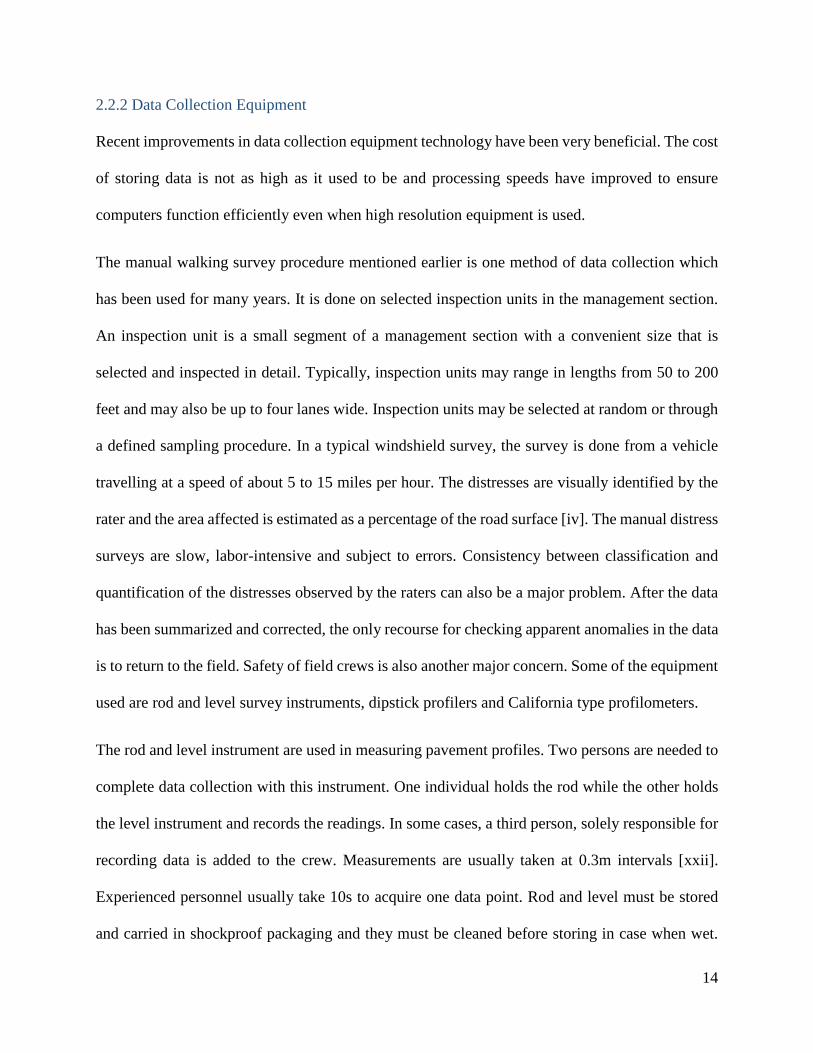
2.2.2 Data Collection Equipment
Recent improvements in data collection equipment technology have been very beneficial. The cost
of storing data is not as high as it used to be and processing speeds have improved to ensure
computers function efficiently even when high resolution equipment is used.
The manual walking survey procedure mentioned earlier is one method of data collection which
has been used for many years. It is done on selected inspection units in the management section.
An inspection unit is a small segment of a management section with a convenient size that is
selected and inspected in detail. Typically, inspection units may range in lengths from 50 to 200
feet and may also be up to four lanes wide. Inspection units may be selected at random or through
a defined sampling procedure. In a typical windshield survey, the survey is done from a vehicle
travelling at a speed of about 5 to 15 miles per hour. The distresses are visually identified by the
rater and the area affected is estimated as a percentage of the road surface [iv]. The manual distress
surveys are slow, labor-intensive and subject to errors. Consistency between classification and
quantification of the distresses observed by the raters can also be a major problem. After the data
has been summarized and corrected, the only recourse for checking apparent anomalies in the data
is to return to the field. Safety of field crews is also another major concern. Some of the equipment
used are rod and level survey instruments, dipstick profilers and California type profilometers.
The rod and level instrument are used in measuring pavement profiles. Two persons are needed to
complete data collection with this instrument. One individual holds the rod while the other holds
the level instrument and records the readings. In some cases, a third person, solely responsible for
recording data is added to the crew. Measurements are usually taken at 0.3m intervals [xxii].
Experienced personnel usually take 10s to acquire one data point. Rod and level must be stored
and carried in shockproof packaging and they must be cleaned before storing in case when wet.
14

Data collection using the rod and level must not be done in windy conditions as it may lead to
errors. See figure 3.
Figure 3: Auto Rod and Level Device
Source: APR Consultants, http://www.aprconsultants.com/Pavement-Profile-Measurement.html, Date accessed: July 20, 2013
The Dipstick profiler is also another instrument used for measuring pavement profiles. The name
‘Dipstick’ is the trade name of the company that manufactures the profilers. The company is Face
Construction Technologies of Norfolk, VA. This device is currently being used in about 63
countries. Federal Highway Administration (FHWA) and the World Bank have established
guidelines and procedures for using the dipstick profiler. The Dipstick measurements record data
at rates greater than the rod and level instrument. The dipstick profiler’s main body is composed
of an inclinometer, LCD panels and a battery for providing power supply
[xxiii]. See figure 4. The sensor is unbalanced as the device is pivoted on one leg as the other leg
moves down the pavement. The relative elevation is read from the display as the sensor gains
equilibrium. Experienced personnel can obtain 500 readings per hour.
15

Figure 4: Dipstick 2000
Source: http://www.pavementinteractive.org/article/roughness/, Date accessed: July 20, 2013, 3:10pm
The 25-foot California profilograph is also another important device used by some agencies for
acquiring data on pavement profiles. This equipment is basically a rolling straight edge. It
measures vertical deviations using the instrument as a 25-foot reference plane recording the
readings on a profilogram. The instrument is a 25-foot aluminum truss with a recorder located at
center top of the device. Profilographs are pushed by personnel at walking speeds along the
pavement section. Advanced profilographs may have small propulsion units of about 3 horsepower
pushing them [xxiv]. A necessary precaution that must be taken is that the speed at which the
equipment is pushed along the pavement must be reduced when there are excessive spikes in the
readings which affect the quality of the data. See figure 5.
16

Figure 5: Computerized Profilograph
Source: Surface Systems & Instruments, Inc. http://www.smoothroad.com/products/profilograph/, Date accessed: July 20, 2013, 4:00pm
To minimize the errors and standardize the survey process, agencies employ automated methods
in recording, reduction, processing and storage of pavement data. An automated distress survey
can be defined as any method in which distress data is entered directly to the computer in the field
during the survey. This type of survey can reduce greatly errors associated with transferring data
from paper forms used in the field to computer systems for analysis. Other benefits of automated
distress surveys include safety for survey crews, faster and more objective surveys. Most states
now use automated means to collect data on pavement friction, roughness, profile, rut depth and
deflection.
Several technologies hold great promise in the area of automated high-speed distress data
collection. Examples are laser technology, film-based systems and video systems.
The Road excellent automatic logging system (Real) is a system that is from the PASCO
Corporation. PASCO is one of the renowned companies which specializes in the measurement and
collection of geospatial data for use by government agencies and private sector organizations. The
Real system conducts surveys on road images as well as providing geographical characteristics. It
17

has the ability to also capture images on the entire road environment which makes it more useful
for conducting a road management system. With Real, it is possible to gain stereoscopic
information on road texture conditions through the captured images and 3D data. Figure 6 shows
the Real system from PASCO.
Figure 6: Real System from PASCO
Source: PASCO Corporation, http://www.pasco.co.jp/eng/products/real/, Date accessed: June 14,
2013, 11:01am
Another type of equipment is the ARAN, and it is a high-speed, multi-functional and diverse road/
infrastructure data acquisition vehicle. It measures pavement condition and distresses for
comprehensive pavement management. User agencies include about 20 countries worldwide and
about 30 states in the United States. Two on-board geometric systems are used. The POS/LV
onboard geometric and orientation system utilizes state-of-the-art military aircraft grade
gyroscopes, accelerometers and global positioning system (GPS) receivers all work together to
provide enhanced precision survey measurements. The ARAN employs GPS to continuously
monitor the ARAN’s absolute position in the XYZ space with an accuracy of 50 to 100m. ARAN
18

employs two road roughness profile measuring systems. The laser SDP employs the use of lasers
instead of ultrasonic sensors. The second road roughness profile measuring system is an inertial
roughness profilometer. The ARAN also uses a smart bar for road rutting measurements. This
smart bar employs up to 37 ultrasonic sensors positioned at 4-inch intervals across the entire
transverse profile. The rut is then measured to an accuracy of 1/32 of an inch. Video logging is
used to collect the data. The ARAN can employ up to six video cameras. The onboard video
logging subsystems are the Right-of-Way (ROW) windshield video and the Pavement View (PV)
video. The ROW video consists of a full color video camera mounted between the driver and the
passenger and looks forward out of the vehicle’s front window to record a continuous video as
seen through the windshield. See figure 7.
Figure 7: ARAN vehicle
Source: Spar Point Group, “FugroRoadware lands two-year, $3m mobile data collection contract”
http://www.sparpointgroup.com/uploadedImages/Images/08.22.11.ARAN.png?maxwidth=800&
maxheight=600&bgcolor=white ,Date accessed: June 14, 2013, 11:20am
The MHM Automated Road Image Analyzer (ARIA) which is another automated pavement
distress collector is capable of measuring faulting, grooving, pavement distress and rut depth. The
19

user vehicle is generally a van, which operates at speeds of about 5-10 mph. The system
components consist of a video camera collecting data, a distance measuring device (DMI) and an
automated digitized processor for analyzing the data collected. It can detect crack widths of about
1/8”-1/16”. The ARIA is used at the local level such as the city of Coriscana, Texas and LaPorte
County, Indiana.
Pavedex Inc. is the supplier of the PAS-1, which is another automated pavement distress collector.
The user vehicle for the PAS-1 is a van that has the capacity to operate at speeds from 0 to 55mph.
The system components consist of five video cameras, 2 on the front, 2 on the rear and one top
and center mounted. The cameras can each cover a span of about 30 square feet with a 50% overlap
at 55mph [i]. The cameras record pavement distress and the system utilizes automated digitized
processing through video imaging to determine cracks. The DMI employed in this system can
measure with an accuracy of about one foot. It is currently being used in 4 cities in western United
States.
Pathway Services Inc. also has the Digital Inspection Vehicle (DIV) which is used by the
Minnesota Department of Transportation (Mn/DOT) for pavement data collection [ixx]. It has
three lasers in the front for profile measurements. There are two lasers in the rear for rut
measurements and four digital cameras mounted on top of the vehicle for capturing distress images
as well as right-of-way images. See figure 8. Measurements are taken at 1/8 of an inch of the
roadway at highway speeds.
20

Figure 8: Pathway Services Inc., Digital Inspection Vehicle (DIV)
Source:http://www.stlouiscountymn.gov/Portals/0/Departments/PublicWorks/internet_files/pathway_van.jpg, Date accessed:7/11/2013, 12:24pm
The images captured by the system are then analyzed using a workstation by two qualified
engineers allowing for better rating consistency.
Table 2 is a summary of some of the automated equipment used and their unique characteristics.
21
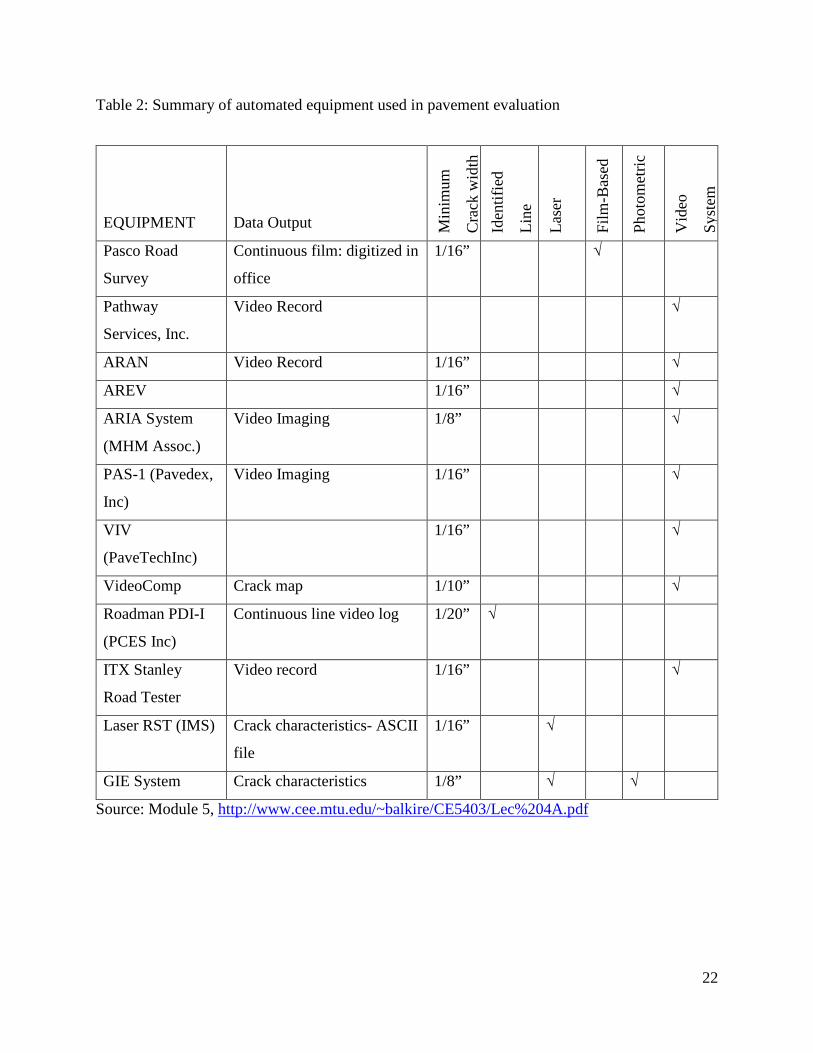
Table 2: Summary of automated equipment used in pavement evaluation
EQUIPMENT Data Output Min
imum
Cra
ck w
idth
Id
entif
ied
Line
La
ser
Film
-Bas
ed
Phot
omet
ric
Vid
eo
Syst
em
Pasco Road
Survey
Continuous film: digitized in
office
1/16” √
Pathway
Services, Inc.
Video Record √
ARAN Video Record 1/16” √
AREV 1/16” √
ARIA System
(MHM Assoc.)
Video Imaging 1/8” √
PAS-1 (Pavedex,
Inc)
Video Imaging 1/16” √
VIV
(PaveTechInc)
1/16” √
VideoComp Crack map 1/10” √
Roadman PDI-I
(PCES Inc)
Continuous line video log 1/20” √
ITX Stanley
Road Tester
Video record 1/16” √
Laser RST (IMS) Crack characteristics- ASCII
file
1/16” √
GIE System Crack characteristics 1/8” √ √
Source: Module 5, http://www.cee.mtu.edu/~balkire/CE5403/Lec%204A.pdf
22

2.3 Condition Rating Systems
The condition rating of a pavement section refers to a score that quantifies the performance. This
rating is based on measures such as roughness, skid resistance, deflection among others obtained
during the data collection process. The condition ratings are used as a basis for comparing the
performance of two road sections. Most importantly, they help agencies to determine the extent
and severity of pavement defects and estimate the cost of repair and rehabilitation and prioritize
treatment procedures. They are also used as a basis for planning budgets. Condition rating indexes
have also in a way reduced the political pressure that formed a greater part of the decision making
process.
2.3.1 Evolution
In the 1950s, pavement condition ratings were done by a panel of raters who drive along the
pavement and subjectively rate the condition of pavements based on a numeric scale or verbal
description. This form of rating, developed by the American Association of State Highway
Officials (AASHO), used a 0-5 scale. It was known as the Present Serviceability Rating (PSR).
Despite the fact that this was simple, the ratings did not provide adequate engineering basis for
prescribing the type and extent of repair and rehabilitation work to be done on damaged pavements.
To deal with this issue, researchers developed mathematical expressions that were able to give the
condition of pavement sections based on the type, severity and extent of distresses. This led to the
development of a more objective means of condition rating in the late 1950s. This index, known
as the Present Serviceability Index (PSI) was based on the relationship between panel ratings and
measurements such as rutting and roughness [xvii]. The equation used to calculate the PSI is shown
in (3) below. This provided an index that can be calculated from objective measurements of
roughness, cracking, patching and the slope variance of the pavement section under consideration.
23

𝑃𝑃𝑃𝑃𝑃𝑃 = 5.03 − log(1 + 𝑃𝑃𝑆𝑆) − 1.38(𝑅𝑅𝑅𝑅)2 − 0.01(𝐶𝐶 + 𝑃𝑃)1/2 (3)
where PSI= Present Serviceability Index
SV=slope variance of section obtained using CHLOE Profilometer
RD= mean rut depth (in)
C=cracking (ft/1000 sq. ft)
P=Patching (sq. ft/1000 sq. ft)
The PSR and PSI were widely accepted among several states. However, during the late 1960s,
states began developing unique indexes to address diverse pavement issues. The US Army Corps
of Engineers also developed the Pavement Condition Index (PCI) in 1976 which is still being
used by several state DOTs. The scales of the condition indexes vary and may sometimes range
between 0-5, 1-5 or in some cases 0-100.
2.3.2 Classes of Condition Indexes
Different States across the country use different approaches towards pavement condition rating.
The condition rating systems can be grouped into two main groups namely estimated condition
ratings and measured condition ratings. The estimated condition rating systems are based on
observed physical conditions of the pavements while the measured condition rating systems are
not only based on observations by trained raters but are also backed by physical measurements
such as roughness and mathematical expressions. Most of the state agencies use the measured
rating systems since they provide a more objective rating of the performance of the pavements.
See figure 9 for examples of rating systems in the two categories.
24

Figure 9 Pavement Condition Rating Systems
2.3.2.1 Estimated Condition Survey
Present Serviceability Rating (PSR)
The most common and fundamental pavement condition rating index is Present Serviceability
Rating (PSR). This is from AASHO and is based on the ride quality as experienced by a panel of
observers riding in a vehicle on a particular section of pavement. The rating scale used is from 0
to 5 as shown below in figure 10. The mean of the individual ratings is the present serviceability
rating [vii].
Figure 10: Present Serviceability Rating
25

Condition Rating Survey (CRS)
The Condition Rating Survey (CRS) is also another estimated condition rating system used by the
Illinois Department of Transportation (IDOT) [vii]. The scale is a 1.0-9.0 scale with increments of
0.1. A value of 1.0 represents total failure while a value of 9.0 represents a newly constructed
pavement. The values are assigned based on a CRS Manual developed in 2004. The manual has
several images that guide the inspector in assigning appropriate values. CRS has evolved over the
years into a measured condition rating at the state level since algorithms have been developed to
incorporate the measured defects into the calculation of condition rating values. Some agencies at
the local level still use the original form of the CRS.
Pavement Surface Evaluation and Rating System (PASER)
Another estimated rating system is the Pavement Surface Evaluation and Rating System (PASER).
It comes under the estimated rating systems since it is also a visual rating of the pavement
conditions based on a 1-10 scale. Similar to the CRS, there is a manual with photographs and
descriptions that guides inspectors to choose the appropriate value on the scale that captures the
conditions accurately. Table 3 shows a general translation of the PASER ratings [vii].
Table 3: PASER ratings and maintenance requirements
PASER Ratings Description of Maintenance
9-10 No maintenance needed
8 Little maintenance
7 Routine maintenance, crack sealing, minor patching
5-6 Seal Coating
3-4 Overlay
1-2 Reconstruction
26

2.3.2.2 Measured Condition Rating
Present Serviceability Index (PSI)
For the measured condition ratings, the Present Serviceability Index (PSI), a 0-5 index is
considered as a measured rating system since it is based on physical measurements of pavement
characteristics in addition to observations from trained raters. The information from the panel of
raters who rated roads in Illinois, Minnesota and Indiana was correlated with the roughness, rut
depth, cracking and patching measurements of the pavement to produce this index. This test and
analyses were carried out by AASHO (American Association of State Highway Officials) between
1958 and 1960 with the aim of providing a much more objective means of establishing pavement
conditions[i]. The pavement measurements were correlated with the observations from the raters
to develop expressions for calculating the PSI.
Distress Index (DI)
Distress Index (DI) is also considered as a measured condition rating system. This is used by the
Michigan Department of Transportation (MDOT). A survey for every 0.1 mile of the pavement is
collected by MDOT through a video survey. The Distress Index is simply a weighted score of the
distress points which are the result of assigning the distresses points based on their type, extent
and severity from the video survey. The expression for DI is
𝑅𝑅𝑃𝑃 = �𝑅𝑅𝑃𝑃 /𝐿𝐿
(4)
where DI = distress index, DP= distress points and L= number of 0.1 mile sections. The DI starts
from a rating of zero with no upper bound. Generally, a DI less than 20 is considered low whilst a
27

DI greater than 40 is considered as high. Medium DI ranges between 20 and 40. A DI of 50 may
indicate zero remaining service life [viii].
Pavement Condition Index (PCI)
The Pavement Condition Index is also a measured condition rating system developed by the US
Army Corps of Engineers and adopted by the American Public Works Association and American
Society for Testing and Materials (ASTM). It is based on a 0-100 scale. See figure 11 for an
illustration [vii]. Each distress identified on the pavement is assigned a value based on the type,
severity and extent. The points are then summed up and deducted from a score of 100 to give the
pavement condition rating. The weighted average of the PCIs for multiple sub-sections is then the
condition of the entire section. There are 39 distresses with 3 levels of severity namely high,
medium and low. There are 20 distresses for asphalt concrete (AC) pavements and 19 distress
types for Portland Cement Concrete pavements (PCC).
Figure 11: PCI Ratings (Illinois Center for Transportation, Implementing Pavement Management
Systems for Local Agencies-State-of-the-Art/ State-of-the-Practice)
28

Overall Pavement Index (OPI)
Some agencies also use the Overall Pavement Index which is based on the Modified Distress
Rating (MDR). The MDR is also based on the PSI which in turn is derived from the IRI. This was
employed in the PMS Implementation for Nigerian Federal Roads [ix]. The following equations
will further explain the OPI.
𝑃𝑃𝑃𝑃𝑃𝑃 = 5𝑒𝑒0.198−0.000261(𝐼𝐼𝐼𝐼𝐼𝐼)
(5)
𝑀𝑀𝑅𝑅𝑅𝑅 = 20(𝑃𝑃𝑃𝑃𝑃𝑃)
(6)
𝑂𝑂𝑃𝑃𝑃𝑃 = 𝑀𝑀𝑅𝑅𝑅𝑅(𝑃𝑃𝑃𝑃𝑅𝑅 5⁄ )0.22
(7)
Surface Rating
This is an index used by the Minnesota Department of Transportation (MNDOT). It is a 0.0-4.0
rating scale. Similar to the PSR the higher ratings correspond to better pavement conditions. Two
raters categorize and measure the distresses on the pavement. This is then converted to percentages
of distresses. The percentages are then weighted according to the type of distresses with the
appropriate weighting factor. The total percentage weighted distress is then converted to Surface
Rating (SR). Table 4 shows the weighting factors for distresses in bituminous pavements. Table 5
and 6 show the weighting factors for concrete pavements and continuously reinforced concrete
pavements respectively. Table 7 shows the total weighting and the corresponding Surface Ratings.
29

Table 4: Bituminous Pavement Weighting Factors
Distress Type Severity Weighting
Transverse Crack Low 0.01
Medium 0.10
High 0.20
Longitudinal Crack Low 0.02
Medium 0.03
High 0.04
Longitudinal Joint
Deterioration
Low 0.02
Medium 0.03
High 0.04
Block Cracking 0.15
Alligator Cracking 0.35
Rutting 0.15
Raveling and Weathering 0.02
Patching 0.04
Table 5: Concrete Pavement Weighting Factors
Distress Type Severity Weighting
Transverse Joint Spalling Low 0.10
High 0.20
Longitudinal Joint Spalling Low 0.10
High 0.20
Cracked/Broken/ Faulted Panel 0.07
Faulted Joints 0.10
100% overlaid Panels 0.00
Patched Panels 0.14
30

D-cracking 0.10
Table 6: Continuously Reinforced Concrete Pavement Weighting Factors
Distress Type Weighting Factor
Patch deterioration 0.30
Localized Distress 0.40
D-cracking 0.05
Transverse cracking 0.25
Table 7: Total weighting and SR
Total Weighting SR Total Weighting SR
0 4.0 21 1.6
1 3.8 22-23 1.5
2 3.6 24 1.4
3 3.4 25-26 1.3
4 3.2 27 1.2
5 3.0 28-29 1.1
8 2.9 30-33 1.0
7 2.8 34-40 0.9
8 2.7 41-47 0.8
9 2.6 48-54 0.7
10 2.5 55-61 0.6
11 2.4 62-68 0.5
12 2.3 69-75 0.4
13 2.2 76-82 0.3
14 2.1 83-89 0.2
15 2.0 90-96 0.1
16-17 1.9
18 1.8
To convert to the SR, table 8 is used.
31

19-20 1.7
Pavement Quality Index (PQI)
PQI is used by the MNDOT and is a combination of the PSR and the SR. It is the square root of
PSR multiplied by SR. It ranges on a scale of 0.0 for failed pavements to 4.5 for no defects.
Pavement Structural Condition (PSC)
The PSC is rating system used by the Washington State DOT to rate pavement conditions [viii].
The scale ranges from 0 for poor conditions to 100 for no distress. Similar to most of the rating
systems, the PSC is also a single value that is used to give an indication of the pavement conditions
in terms of the severity and extent of all distresses. The PSC is calculated differently in rigid and
flexible pavements. The expressions for calculating PSC are below
𝐹𝐹𝐹𝐹𝑒𝑒𝑒𝑒𝑒𝑒𝑒𝑒𝐹𝐹𝑒𝑒 𝑃𝑃𝑃𝑃𝑃𝑃𝑒𝑒𝑃𝑃𝑒𝑒𝑃𝑃𝑃𝑃𝑃𝑃:𝑃𝑃𝑃𝑃𝐶𝐶 = 100 − 15.8𝐸𝐸𝐶𝐶0.5
(8)
𝑅𝑅𝑒𝑒𝑅𝑅𝑒𝑒𝑅𝑅 𝑃𝑃𝑃𝑃𝑃𝑃𝑒𝑒𝑃𝑃𝑒𝑒𝑃𝑃𝑃𝑃𝑃𝑃:𝑃𝑃𝑃𝑃𝐶𝐶 = 100 − 18.6𝐸𝐸𝐶𝐶0.43
(9)
where PSC=Pavement Structural Condition; EC= equivalent cracking
Each distress type is converted to an equivalent cracking number based on the extent and severity.
The EC is the sum of the defects obtained after summing up the defects that have been assigned
numerical values. See table 8. PSC values are categorized as follows in table 9.
32

Table 8: Equivalent Cracking Valuation for Asphalt Concrete
Distress Type Coefficient Coefficient Power
% Length Patching High* 0.75 1 1
% Length Patching Medium* 0.75 0.445 1.15
% Length Patching Low* 0.75 0.13 1.35
% Both Wheel Paths of Alligator
Cracking High
1 1 1
% Both Wheel Paths of Alligator
Cracking Medium
1 0.445 1.15
% Both Wheel Paths of Alligator
Cracking Low
1 0.13 1.35
% Length Transverse Cracking
High
0.8 1 1
% Length Transverse Cracking
Medium
0.8 0.445 1.15
% Length Transverse Cracking
Low
0.8 0.13 1.35
% Length Longitudinal Cracking
High
0.1 1 1
% Length Longitudinal Cracking
Medium
0.1 0.445 1.15
% Length Longitudinal Cracking
Low
0.1 0.13 1.15
Table 9: PSC Categories
Condition PSC Rating
33

Excellent 75-100
Good 50-75
Fair 25-50
Poor 0-25
2.4 Quality Management
Many transportation agencies are developing procedures and guidelines for managing the quality
of pavement data collection activities to ensure that the data collected meets the needs of the
pavement management process. Pavement data quality is receiving increased attention due to fact
that the data quality has a critical effect on the pavement management decisions.
The most efficient way to achieve high-quality pavement condition data collection is to adopt a
comprehensive and systematic quality management approach that includes methods, techniques,
tools and model problem solutions. Quality management involves the specification of data
collection protocols, quality standards, responsibilities of personnel, quality control, quality
acceptance, corrective action and quality management documentation.
Quality control (QC) refers to activities performed to ensure that the equipment and processes
involved in data collection are under control which will in turn ensure that high quality results are
obtained. Quality assurance (QA) is a term that refers to all activities conducted to verify that the
collected pavement condition data meet the quality requirements and specifications. It is usually
conducted by a quality assurance auditor, who checks data management spreadsheets, verifies that
the data is complete and checks a random sample of 2-10% of the data collected. Ideally, QC
procedures must be performed at all phases of the data collection process [x]. At the pre-project
phase, QC procedures ensure the equipment’s accuracy and precision match industry standards.
34

During post-processing, QC is also done to ensure completeness and accuracy. After which QA is
done to further ensure reliability and accuracy of delivered data. Purpose of quality control is to
quantify variability in the process, maintain it within acceptable limits and to take the necessary
actions that can minimize controllable variability. Sources of variability include rater or operator’s
training skills and environmental conditions. Approximately 64% of state and provincial highway
agencies have a formal data collection quality control plan.
The AASHTO Standards, ASTM Standards, Long Term Pavement Performance (LTPP) Guide are
a few of the standards which serve as guidelines for agencies performing data quality management.
These guidelines address quality assurance and control with respect to the qualification of
personnel, validation sections, equipment calibration and additional checks using previous years’
data. However, the guidelines are not very specific but have served as the basis for agencies to
create detailed state-specific data quality management guides.
A key feature of quality management that must be noted is that the variability of the data must be
less than the yearly change of the data. Otherwise, this indicates a high level of “noise” and or bias
which may not yield meaningful results from analysis. Data quality management is the
responsibility of both data collectors and the end user of the data.
Due to the fact that there is always some level of bias and error inherent in the data, quality
assurance guidelines outline tolerance limits to ensure permissible variability of data. Variability
can also be caused by rater inconsistencies and during data referencing, data handling and
processing [xv]. Table 18 shows some of the tolerance limits for data collection used by
PENNDOT. The limits may be in the form of absolute values or percentages.
35

Extensive work has been done in the quality control and quality assurance of data. However, the
quality management of sensor-collected data is more established than distress data. This is due to
the inherent variability in the equipment used in acquiring pavement images as well as the
processing of the images [x].
2.4.1 Quality Management of Distress Data
In most cases, the data collector (whether in-house or outsourced) performs pilot runs and the data
obtained is compared with data obtained from manual surveys. This is the quality management
that is done before data collection and it is used to ensure the equipment is functioning. During
data collection, random sections are chosen and data is compared with manual survey data.
Agencies therefore need to define their limits for acceptable variability in data. This may be done
through in-depth statistical analyses as well as examination of sources of variability.
2.4.2 Quality Management of ride quality data
Ride quality data refers to roughness and profile measurements (See page 5). These are measured
with sensors and lasers. The AASHTO standards for quality management give little detail and so
the agencies are responsible for their own requirements. As a result of extensive studies, guidelines
have been provided to ensure reduced errors in profile data collection [xi]. The tire pressures must
be checked and the lenses must be cleaned before the runs. The profile data must be collected at
speeds recommended by the manufacturer. The measuring devices such as the sensors,
accelerometers and distance measuring devices must be calibrated using the manufacturer’s
specifications. Wet pavements must be avoided during data collection season. Similar to distress
data, pilot runs are also conducted on validation segments before actual data collection takes place.
This is a way of ensuring the equipment’s ability to collect data.
36

In summary, the importance of quality management cannot be overlooked by engineers and other
professionals. Quality management of data and procedures can lead to:
1. Consistent and accurate data;
2. Improved decision support for stakeholders and managers;
3. Reduced costs; and
4. Higher credibility ratings within and outside the organization.
37

3.0 CURRENT PRACTICES IN THE US
DOTs across the nation have different ways of managing their pavement infrastructure. They
employ different methods of data collection during condition monitoring and condition evaluation.
The choice of a particular method depends largely on financial constraints and the qualification of
personnel. It also depends on whether those methods for evaluation and data collection reflect the
needs of the agency. The following sections summarize the methods adopted by some state
agencies in the US. Almost all the states avoid data collection during wet conditions.
Delaware
DelDOT performs pavement condition surveys once every two years. Currently, the data collection
process has been outsourced to Data Transfer Solutions. Data collected depends on the type of
pavement. Tables 10-17 show the types of pavements, pavement defects considered and the levels
of severities and extent. These are used for evaluating the condition of the pavements based on the
Overall Pavement Condition (OPC) which is on a 0-100 scale. IRI and rutting data are collected
but are not factored into OPC calculations. Detailed QA/QC procedures including equipment
calibration, data verification and office data checks are also performed.
38

Severity Levels Describing Failure in Pavements
Table 10: Flexible Pavement Defects and Severity Levels (DelDOT)
Severity Deficiency LOW MEDIUM HIGH Fatigue Cracking Fine parallel
hairline cracks Alligator crack pattern clearly developed
Alligator crack pattern clearly developed with spalling and/or distortion
Transverse Cracking
Crack < 1/4 inch wide
Crack Width > 1/4 and < 3/4 inch and/or spalls less than 3 inches in width or sealed crack with sealant in good condition
Crack Width > 3/4 inch and/or spalls greater than 3 inches in width or significant loss of material
Block Cracking Crack < 1/4 inch wide
Crack Width > 1/4 and < 3/4 inch and/or spalls less than 3 inches in width or sealed crack with sealant in good condition
Crack Width > 3/4 inch and/or spalls greater than 3 inches in width or significant loss of material
Patch Deterioration
Patches showing little or no defects with a smooth ride
Patches showing medium severity defects (e.g. cracking) and/or notable roughness
Patches showing high severity defects and/or distinct roughness
Surface Defects Aggregate has begun to wear away
Aggregate has worn away and surface is becoming rough and/or minor rutting occurring from horse & buggy traffic (less than 1 inch average depth)
Aggregate has worn away and surface is very rough and/or major rutting occurring from horse & buggy traffic (greater than 1 inch average depth)
39
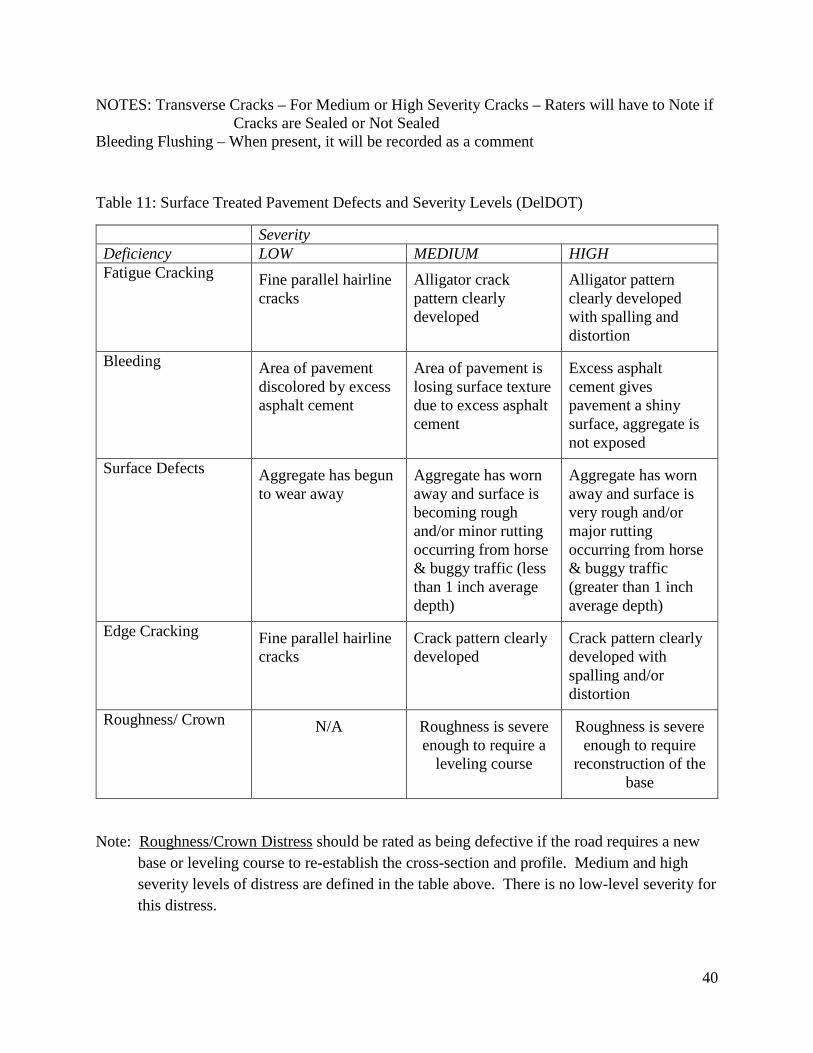
NOTES: Transverse Cracks – For Medium or High Severity Cracks – Raters will have to Note if Cracks are Sealed or Not Sealed
Bleeding Flushing – When present, it will be recorded as a comment
Table 11: Surface Treated Pavement Defects and Severity Levels (DelDOT)
Severity Deficiency LOW MEDIUM HIGH Fatigue Cracking Fine parallel hairline
cracks Alligator crack pattern clearly developed
Alligator pattern clearly developed with spalling and distortion
Bleeding Area of pavement discolored by excess asphalt cement
Area of pavement is losing surface texture due to excess asphalt cement
Excess asphalt cement gives pavement a shiny surface, aggregate is not exposed
Surface Defects Aggregate has begun to wear away
Aggregate has worn away and surface is becoming rough and/or minor rutting occurring from horse & buggy traffic (less than 1 inch average depth)
Aggregate has worn away and surface is very rough and/or major rutting occurring from horse & buggy traffic (greater than 1 inch average depth)
Edge Cracking Fine parallel hairline cracks
Crack pattern clearly developed
Crack pattern clearly developed with spalling and/or distortion
Roughness/ Crown N/A Roughness is severe enough to require a
leveling course
Roughness is severe enough to require
reconstruction of the base
Note: Roughness/Crown Distress should be rated as being defective if the road requires a new base or leveling course to re-establish the cross-section and profile. Medium and high severity levels of distress are defined in the table above. There is no low-level severity for this distress.
40

Table 12: Composite Pavement Defects and Severity Levels (DelDOT)
Severity Deficiency LOW MEDIUM HIGH Fatigue Cracking Fine parallel hairline
cracks Alligator crack pattern clearly developed
Alligator pattern clearly developed with spalling and distortion
Reflective Cracking Crack < 1/4 inch wide Crack Width > 1/4 and < 3/4 inch and/or spalls less than 3 inches in width or sealed crack with sealant in good condition
Crack Width > 3/4 inch and/or spalls greater than 3 inches in width or significant loss of material
Surface Defects Aggregate has begun to wear away
Aggregate has worn away and surface is becoming rough and/or minor rutting occurring from horse & buggy traffic (less than 1 inch average depth)
Aggregate has worn away and surface is very rough and/or major rutting occurring from horse & buggy traffic (greater than 1 inch average depth)
Block Cracking Crack < 1/4 inch wide Crack Width > 1/4 and < 3/4 inch and/or spalls less than 3 inches in width or sealed crack with sealant in good condition
Crack Width > 3/4 inch and/or spalls greater than 3 inches in width
NOTES: Reflective Cracks – For Medium or High Severity Cracks – Raters will have to Note if Cracks
are Sealed or Not Sealed Bleeding Flushing – When present, it will be recorded as a comment
41

Table 13: Rigid Pavement Defects and Severity Levels (DelDOT)
Severity Deficiency LOW MEDIUM HIGH Joint Deterioration Spalls < 3 inches wide
with no significant loss of material
Spalls 3-6 inches wide with loss of material
Spalls > 6 inches wide with significant loss of material
Slab Cracking Crack < 1/4 inch wide Crack width > 1/4 and < 3/4 inch , spalling < 3 inches wide or sealed cracks with sealant in good condition
Crack width > 3/4 inch or spalling > 3 inches wide
Patch Deterioration
Patches showing low severity defects and no measurable faulting
Patches showing medium severity defects and/or faulting up to 1/4 inch
Patches showing high severity defects and/or faulting up to 1/4 inch
ASR Cracks are light with no loose or missing pieces
Cracks are well defined and some small pieces are loose or missing
Cracks are a well developed pattern with a significant amount of loose or missing pieces
Sealant Loss 0-9 % of Joint Loss 10-50 % of Joint Loss > 50 % of Joint Loss
NOTE: Slab Cracks – For Medium or High Severity Cracks – Raters will have to Note if Cracks are
Sealed or Not Sealed
42

43

Extent Levels describing Failure in Pavements
Table 14: Flexible Pavement Defects and Levels of Defect Extents (DelDOT)
Severity Deficiency LOW MEDIUM HIGH Fatigue Cracking 0 - 9% (wheel path) 10 - 25% > 25%
Transverse Cracking > 50 ft spacing 25 ft < spacing <50 ft < 25 ft spacing
Block Cracking 0 - 9% 10 - 25% > 25%
Patch Deterioration 0- 9% 10 - 25% > 25 %
Surface Defects 0- 9% 10 - 25% > 25 %
Table 15: Surface Treated Pavement Defects and Levels of Defect Extents (DelDOT)
Severity Deficiency LOW MEDIUM HIGH Fatigue Cracking 0- 9% (wheel path) 10 - 25% > 25%
Bleeding 0- 9% 10 - 25% > 25%
Surface Defects 0- 9% 10 - 25% > 25 %
Edge Cracking 0- 9% (3 ft Edge) 10 - 25% > 25%
Roughness/Crown 0- 9% 10 - 25% > 25 %
Table 16: Composite Pavement Defects and Levels of Defect Extents (DelDOT)
Severity Deficiency LOW MEDIUM HIGH Fatigue Cracking 0- 9% 10- 25% >25%
Reflective Cracking > 50 ft spacing 25 ft < spacing <50 ft < 25 ft spacing
Surface Defects 0- 9% 10- 25% > 25%
Block Cracking 0- 9% 10- 25% > 25%
44

Table 17: Rigid Pavement Defects & Levels of Defect Extents (DelDOT)
Severity Deficiency LOW MEDIUM HIGH Joint Deterioration 0- 9% of joints 10- 25% of joints >25% of joints
Slab Cracking 0- 9% of slabs 10- 25% of slabs >25% of slabs
Patch Deterioration 0- 9% of area 10-25% of area >25% of area
ASR N/A N/A N/A
Joint Sealant Damage 0- 9% of joints 10- 25% of joints >25% of joints
Maryland
IRI, rutting, friction and cracking data are collected by the Maryland Department of Transportation
(MDOT). MDOT has been using automated means of data collection since 1995. It is done
annually. MDOT does not use a composite rating but provides condition reports and preservation
needs reports to management.
Pennsylvania
Pennsylvania Department of Transportation (PENNDOT) uses automated means to collect data on
IRI, rutting, fatigue cracking, edge deterioration, bituminous patching, transverse joint spalling,
longitudinal joint spalling, transverse joint faulting, broken slab and concrete patching. Data
collection is outsourced to external consultants. Surveys are carried out on all of the National
Highway System (NHS) annually and half of the non-NHS roads. The Overall Pavement Index
(OPI) is used. The OPI for asphalt concrete pavement is calculated from equations below [xviii].
𝑂𝑂𝑃𝑃𝑃𝑃 = (0.15 ∗ 𝐹𝐹𝐶𝐶𝑃𝑃) + (0.125 ∗ 𝑇𝑇𝐶𝐶𝑃𝑃) + (0.10 ∗ 𝑀𝑀𝐶𝐶𝑃𝑃) + (0.10 ∗ 𝐸𝐸𝑅𝑅𝑃𝑃) + (0.05 ∗ 𝐵𝐵𝑃𝑃𝑃𝑃) +
(0.05 ∗ 𝑅𝑅𝑅𝑅𝑃𝑃) + (0.175 ∗ 𝑅𝑅𝑅𝑅𝑇𝑇) + (0.25 ∗ 𝑅𝑅𝑅𝑅𝐹𝐹) (10)
45

PENNDOT also has a well-structured QA program which specifies limits and criteria for accepting
and rejecting data collected. See table 18 below.
Table 18: PENNDOT Data discrepancy tolerances
Data Type Initial
Criteria
% Within Limits Recommended Action
IRI ±25% 95 Reject
Individual Distress
Severity
±30% 90 Feedback on potential bias
Total fatigue ±20% 90 Reject
Total non-fatigue cracking ±20% 90 Reject
Total joint spalling ±20% 90 Reject
Transverse cracking, JCP ±20% 90 Reject
Source: Practical Guide for Quality Management of Pavement Condition Data, USDOT, FHWA
New York
New York State Department of Transportation uses both manual windshield surveys and
automated surveys in collecting data. Distress data is collected manually while ride quality data
are collected using the automated road analyzer system. Windshield surveys conducted annually
on all state highways. The automated survey is also conducted annually on interstates and
biannually on roads with lower functional classes. During QA, 5% of the weekly mileage covered
by the automated surveys are examined. 10% of the mileage covered by windshield surveys are
also examined. A 15% variation is considered acceptable for automated surveys while a 1%
variation is considered for the windshield surveys.
Georgia
46

Similar to DelDOT, Georgia Department of Transportation (GDOT) also conducts surveys on the
entire network annually. However, data collection is not outsourced.Data is collected by trained
staff from the agency. Data collection is done through manual walking surveys. Data collected
include rut depth, load cracking, reflection cracking, block cracking, bleeding, corrugations and
loss of section. GDOT makes use of the Georgia Pavement Management system (GPAM) to report
information to management level staff. The rating index is based on a 0 to 100 scale with a
threshold level of 70.
Minnesota
Mn/DOT uses a Pavement Quality Index (PQI) for condition rating. The PQI is made up of Surface
Rating and Ride Quality Index (RQI). RQI is based on a 0.0-5.0 scale while SR is on a 0.0-4.0
scale. The PQI is also based on a 0.0-4.5 scale. It is calculated as:
𝑃𝑃𝑃𝑃𝑃𝑃 = �𝑃𝑃𝑅𝑅 ∗ 𝑅𝑅𝑃𝑃𝑃𝑃 (11)
RQI is obtained using a correlation between IRI measurements and the perception of roughness by
a rating panel. IRI is converted to PQI using expressions that depend on the type of pavement. See
(12) and (13).
𝑅𝑅𝑃𝑃𝑃𝑃 = 5.697 − 0.264(𝑃𝑃𝑅𝑅𝑃𝑃0.5) (12)
𝑅𝑅𝑃𝑃𝑃𝑃 = 6.634 − 0.353(𝑃𝑃𝑅𝑅𝑃𝑃0.5) (13)
where IRI is in in/mile.
In order to determine SR, pavement images taken by the DIV are analyzed at a workstation by two
engineers. Some of the defects considered are Transverse, longitudinal, alligator, multiple
cracking, longitudinal joint distress, longitudinal and transverse joint spalling, D-cracking, faulted,
47

cracked, broken, patched and overlaid panels. Rating is done on the first 500 ft of sections which
represents 10% of a typical section. The percentage of each distress is then weighted and summed
to obtain the total weighted distress (TWD). The SR can then be calculated from the TWD as
shown in (14)
𝑃𝑃𝑅𝑅 = 𝑒𝑒(1.386−0.045(𝑇𝑇𝑇𝑇𝑇𝑇)) (14)
Texas
Texas Department of Transportation (TxDOT) collects data annually using a combination of
manual and automated survey techniques. Ride quality data such as IRI and rutting are collected
using specialized vans while distress data is collected primarily using manual windshield surveys.
Work is being carried out to transition to a fully-automated method. Data collected include IRI,
ride quality, texture, deflection, patching, rutting, raveling, average crack spacing and apparent
joint spacing. Condition indexes used are the distress score (DS) and the condition score (CS)
[xviii]. The rating scores are obtained from utility functions using (15) and (16) below.
𝑅𝑅𝑃𝑃 = 100 × ∏ 𝑅𝑅𝑖𝑖𝑘𝑘𝑖𝑖=1 (15)
𝐶𝐶𝑃𝑃 = 𝑅𝑅𝑟𝑟𝑖𝑖𝑟𝑟𝑟𝑟 × 𝑅𝑅𝑃𝑃 (16)
where𝑅𝑅𝑖𝑖 is the utility value for distress type i
DS is the distress score
CS is the condition score
𝑅𝑅𝑖𝑖is the utility value obtained from (12) below
48

𝑅𝑅𝑖𝑖 = �1.0 𝑤𝑤ℎ𝑒𝑒𝑃𝑃 𝑅𝑅𝑖𝑖 = 0
1 − 𝛼𝛼𝑒𝑒−�𝜌𝜌𝑑𝑑𝑖𝑖
�𝛽𝛽
𝑤𝑤ℎ𝑒𝑒𝑃𝑃 𝑅𝑅𝑖𝑖 > 0 (17)
𝑅𝑅𝑖𝑖is the density of the distress in the pavement section and 𝛼𝛼, 𝛽𝛽 and 𝜌𝜌 are maximum loss factor,
slope factor and prolongation factor that control the shape of the utility curve. These coefficients
depend on the type of pavement.
Figure 12 shows a typical utility curve.
Figure 12: Typical utility curve
Virginia
VDOT outsources its data collection to Fugro-Roadware[xii].Data collection is fully automated
using the Automatic Road Analyzer (ARAN) van with an annual collection frequency for the
Interstate system, primary system. The secondary system data is collected on a 5-year cycle. Data
collected include alligator cracking, longitudinal cracking, transverse cracking, patching, bleeding,
rutting, and delamination. For QC/QA, a third party consultant known as Quality Engineering
Solutions (QES) reviews results from the control sites. QA is done by Fugro-Roadware, QES and
VDOT.
West Virginia
49

West Virginia Department of Transportation (WVDOT) collects IRI and rutting, faulting and
cracking data. Collection of data follows a 1-year cycle. WVDOT’s QC/QA is based on field
surveys. 1% of the data is selected for auditing using a 3-5% tolerance level for discrepancies.
Data collection is outsourced by WVDOT.
Vermont
Vermont Agency of Transportation (VTran) outsources data collection. It collects IRI, rutting,
wheelpath cracking, transverse and non-wheel path cracking data. The process is fully automated
and is performed every two years using a summary index.This index is reported to management
with the percentage of roads in very poor conditions. The data from the consultants are verified on
selected field sections.
North Carolina
North Carolina Department of Transportation (NCDOT) requires information on IRI, rutting,
alligator cracks, raveling, transverse cracks, bleeding, patching, oxidation, longitudinal cracking,
punchouts, corner breaks, Y cracks, spalling, joint seal, faulting, and skid resistance. Data
collection is occasionally outsourced. Data collection is done through manual walking surveys and
manual windshield surveys. The condition rating index used is based on a 0-100 scale. The
collection takes place only in dry weather. The Interstate system is monitored during the spring
and summer seasons while primary and secondary roads are monitored during winter and spring
seasons.
South Dakota
The South Dakota Department of Transportation (SDDOT) collects data annually without any
form of outsourcing. SDDOT uses a combination of automated and manual data collection
50

methods. Data collected include IRI, rutting, cracking, patch deterioration, faulting, spalling, joint
seal damage and punchouts. The Pavement Management Unit of SDDOT provides repair needs
maps and project analysis reports. The index used for the condition survey is the surface condition
index (SCI). It is a 0 to 5 scale with 5 representing ideal pavement conditions. The SCI is calculated
as follows:
𝑃𝑃𝐶𝐶𝑃𝑃 = 𝜇𝜇 − 1.25𝜎𝜎 (18)
𝜇𝜇is the mean of all individual distress indexes and 𝜎𝜎 is the standard deviation of the individual
distress indexes. The individual distress is calculated as:
𝑃𝑃𝑖𝑖 = 5 − 𝑅𝑅𝑖𝑖 (19)
Where 𝑃𝑃𝑖𝑖 is the index value for distress I and 𝑅𝑅𝑖𝑖 is the deduct value for distress i. The deduct value
is based on its extent and severity.
51

4.0 EVALUATION
In this chapter, the various aspects of condition ratings will be evaluated. Comparisons will be
made based on the methods and types of equipment used for data collection. The data collection
and QC procedures used in the various states will also be compared with each other.
4.1 Network & Project Level Data Collection
As stated earlier, the type of data collected at the network level differs from that collected at the
project level. Usually the project level data is more detailed as compared to the network level.
Both types of data are used for decision-making but the project level data can also be used for
refining network level management system treatment recommendations [xv]. Table 19 compares
network level and project level data collection.
Generally, network level data and modeling are used for activity planning and prioritization. On
the other hand, project level data and modeling are used for establishing specific intervention and
corrective actions.
52

Table 19: Comparison of Network Level and Project Level Data Collection
Network Level Project Level Data Collected 1. IRI
2. Rutting 3. Faulting 4. Cracking 5. Joint Condition 6. Bridges 7. Road signals 8. Geometrics 9. Events (Construction) 10. GPS coordinates
1. Base soils characterization 2. Structural Capacity 3. Joint load transfer 4. Detailed crack mapping 5. Drainage conditions 6. Signs and guard rails data 7. Geometrics
Collection Method Usually automated Manual and automated Uses 1. Budgeting
2. Planning repair and rehab activities
3. Prioritization of projects 4. Mechanistic-Empirical
Pavement Design Guide (MEPDG) Calibration
5. Forecast of future network conditions
1. Refining pavement management treatment recommendations
2. MEPDG calibration 3. Assessing benefits of
alternatives 4. Assessing causes of
deterioration
4.2 Manual & Automated Data Collection
Manual data collection involves walking surveys or windshield surveys where qualified inspectors
identify the distresses present and rate the pavements. Data is recorded on paper and it may be
analyzed either on paper or with a computer after being transcribed into a database. Nowadays,
data can be entered directly onto handheld devices during manual inspections.
Automated surveys are mainly carried out with specialized vans equipped with lasers and high
resolution cameras. These are used in acquiring images and videos. There are semi-automated and
fully-automated methods depending on how the acquired data is processed and analyzed. In semi-
automated methods, the acquired images are analyzed by personnel who go through them to
identify the distresses. In fully-automated methods, pattern recognition software is used to classify
and rate pavement distresses.
53

In recent times, most states are adopting automated data collection methods. This transition may
sometimes result in data inconsistency issues. Other states may rather avoid the automated
methods due to the high initial costs involved. Studies conducted in 2004 and updated in 2008
show that among the 50 states, Puerto Rico, 11 Canadian provinces and the Eastern Federal lands,
44 out of 65 use automated pavement collection. Table 20 is a summary of the findings.
Table 20 Summary of Pavement condition data collection methods [xv]
Method Number of agencies
Agencies Vendors Total
Collection Automated 23 21 44
Manual 19 2 21
Processing Fully-Automated 7 7 14
Semi-automated 16 14 30
4.3 Types of Data Collected & Frequency
State agencies nationwide collect different types of data during condition surveys. Table 21 below
summarizes the types of data collected and frequencies for some of the state agencies.This may
depend on the agency’s definition for the various forms of deterioration and distresses, climate,
data collection technology and the type of pavement under consideration. Generally, pavement
data collection is done annually for most states. The frequency of data collection is mainly
influenced by the agency’s finances.
DOTs may specify different types of cracks depending on the types of distresses that are prevalent
in that area. Some Agencies may outsource data collection due to financial constraints. However,
other agencies strongly argue that data collection be done in-house to ensure better data quality
54

management. Outsourcing is advantageous where contractors have advanced equipment to collect
data efficiently.
Table 21: Data Collected by state agencies and Frequency of Collection
State Data Collected Data Collector Frequency Arizona (ADOT) IRI, rutting, cracking*,
friction, flushing Outsourced 3 years
Arkansas (AHDT) IRI, rutting, faulting, cracking*, raveling
In-house Interstate-1 year Other roads-2 years
Colorado (CDOT) IRI, rutting, cracking*, corner breaks
Outsourced 1 year
Delaware (DelDOT) Patch deterioration, joint seals, bleeding, cracking*
Outsourced 2 years
Georgia (GDOT) Rut depth, cracking*, edge distress, bleeding, corrugations, loss of section
In-house 1 year
Illinois (IDOT) IRI, rutting, surface distress
In-house Interstate-1 year Other roads-2 years
Indiana (INDOT) IRI, rut, cracking*, faulting
Outsourced Interstate-1 year Others-2 years
Kansas (KDOT) IRI, rutting, cracking*, joint distress
In-house 1 year
Maryland (MDOT) IRI, rutting, cracking*, friction
In-house 1 year
Michigan (MDOT) IRI, rutting, cracking*, popouts, raveling, delaminated areas
Outsourcing 2 years
New York (NYSDOT)
IRI, rutting, faulting In-house Interstate-1 year Others-2 years
Oklahoma (ODOT) IRI, rutting, cracking*, patching, faulting, corner breaks, punchouts
Outsourced 2 years
Pennsylvania (PENNDOT)
IRI, rut, cracking*, patching, edge deterioration, joint spalling
Outsourced 1 year
Texas (TxDOT) IRI, ride quality, texture deflection, rut, patching, cracks*, raveling
Outsources manual data collection
1 year
New Jersey (NJDOT)
IRI, rutting, cracking*, shoulder condition, shoulder drop, faults,
State highway-In-house County, municipal- outsourced
2 years
55

longitudinal and transverse joints
*- refers to different forms of cracks that occur in pavements.
4.2 Consistency in Pavement Distress Ratings
The issue of consistency in distress rating is a major one in pavement condition management.
Despite recent advancements in imagery technology and video capture, there is still lack of
consistency in distress ratings since the technologies for identifying and determining extent and
severity of distresses are not fully developed. Distress ratings are usually summarized using
pavement condition indices. Pavement condition indices are a combination of distress rating and
ride quality.
The focus is on distress ratings because subjectivity in measuring ride quality has been eliminated
to a large extent. Ride quality is expressed mainly in terms of the IRI measurements obtained from
various road profilers available on the market.
Pavement distress manifestations are visible pavement surface deterioration resulting from traffic
loading and environmental factors over a period of time [xvi]. Ratings are assigned to distresses
through visual inspection guided by a rating manual. Usually, there is some amount of random and
or bias error. Errors are high when the severities and extents of distresses are not well defined and
as a result leading to confusion on the part of the rater. There is also a high degree of errors when
there are too many points on the distress and severity scales which leads to further confusion.
Studies have been conducted over the years to address the accuracy and precision of pavement
condition indices[xvi].
The diagrams below in figure 13 help in differentiating between precision and accuracy which is
confusing at times.
56

Figure 13: Accuracy and Precision
For accurate and precise measurements, the measured values are closer to the true value and the
variances between the measured values are minimal. For accurate but not precise measurements,
the measured values are closer to the true value but have larger variances between them. Lastly,
precise but not accurate measurements have minimal variances between them but differs largely
from the true value. Efforts have been made to improve the accuracy and precision of distress
ratings.
In transportation agencies nationwide, these efforts can be part of the quality control protocol.
Statistical analyses are made on condition ratings on calibration sites. The analyses involves t-tests
and analysis of variance (ANOVA). The ratings from a group of raters with diverse levels of
experience are compared to that of experienced raters whose results serve as the reference. The
statistical analysis will determine whether the measurements are consistent or whether there is the
need for modifications to the rating system.In the study conducted by the Ministry of
Transportation of Ontario in Canada[xvi], various sources of variation and inconsistency were
identified. It was observed that there was greater consistency in ratings when the points on the
57

distress severity and density scales were reduced. It was also observed that variability among raters
was high with certain types of distresses. Thus, the need to clearly define distress types as stated
earlier.
Also, control sites can be used for data verification to address the issue of inconsistency. These
sample sites are carefully selected to ensure that they represent the population or entire network
fully. Usually, 2-10% of the entire network is used. However, the expression below in (20) can be
used to determine sample size.
𝑃𝑃 = �𝑍𝑍𝜎𝜎
2�𝜎𝜎
𝐸𝐸�2 (20)
where n= sample size
𝑍𝑍𝜎𝜎2�= standard normal distribution
= 1.960 (α = .05)
= 1.645 (α= .10)
E= tolerable bias
σ= standard deviation of population
4.5 Differences among Pavement Condition Indexes
Most pavement condition indexes are based on a 0 to 100 scale. Despite this fact, pavement
condition indexes differ inherently and so comparing indexes from different jurisdictions may
produce misleading results. Studies conducted by Texas Department of Transportation and Federal
Highway Administration [xv] used t-tests and scatter plots to establish this fact. The study involved
the use of selected pavement condition indexes on 9642 pavement sections. The selected indexes
58

were the TxDOT’s Distress Score and Condition Score (CS), Oregon DOT’s Overall Index (OI),
Minnesota DOT’s Surface Rating (SR) and Ohio DOT’s Pavement Condition Rating (PCR).The
t-tests showed that the mean of the measurements when using different indexes were significantly
different when compared. The disagreements between different indexes are due to several reasons.
Firstly, the disagreements are the result of DOTs having different methods of measuring distresses.
For example, the OI uses average rut depth while the DS uses the percentage area in addition to
the severity.
Secondly, the differences are as a result of different weighting factors and mathematical
expressions used to define the condition of the pavements.
Last but not least, the disagreements observed may be indirectly linked to varying agency policies
and climatic conditions. These in turn have an influence on the type of data collected which will
eventually affect the condition rating of the pavement section.
59

5.0 CONCLUSIONS & RECOMMENDATIONS
5.1 Conclusion
Pavement condition surveys are very important in pavement management. This is evident in the
fact that it is performed annually by more than 50% of the state DOTs. Condition surveys inform
management of the actions that need to be taken in order to ensure effective and efficient use of
resources. Due to the level of importance that is associated with the surveys, engineers and
management usually plan these activities in detail. Condition surveys have three main aspects
which are considered namely; data collection, condition rating and quality management.
Data collection is a crucial aspect of condition surveys since the information communicated to
management as to which actions they are required to take are based on it. Thus, the right equipment
and labor with the requisite skills must be employed here. Currently, data collection is more
automated. As a result, it is the agency’s responsibility to use equipment that will meet its needs
while taking into consideration its budget constraints. Data collection is outsourced by some
DOTs. This may help cut down costs to an extent but may make quality control difficult. Agencies
whose data collection is done in-house can monitor the collection process and perform quality
control with relative ease. A greater proportion of DOTs using automated data collection methods
use specialized vans such as ARAN vehicle to acquire pavement images, video and other forms of
data. The data that is collected is usually categorized into four groups namely; ride quality,
structural capacity, distress and skid resistance data.
Condition ratings refer to numerical representations or description of the condition of pavement
sections and or entire networks. The choice of condition rating by a state DOT must be able to
address the data collected by that particular agency. Most importantly, the agency’s personnel must
60

have an understanding of how the rating system works in order to use it effectively. In recent times,
there has been a shift from the PSR to condition rating systems that are backed my mathematical
relations between physical measurements. The condition rating indexes are divided into two main
groups namely estimated and calculated condition ratings. A typical example of the estimated
rating is the Pavement Surface Rating (PSR). Examples of the measured rating indexes in use are
the Overall Pavement Condition (OPC) from Delaware DOT, Surface Rating (SR) from Minnesota
DOT, Oregon DOT’s Overall Index (OI) and Tennessee DOT’s Pavement Distress Index (PDI).
Most of the condition rating indexes that are being used by DOTs in the US are based on the deduct
value approach. These have the ability to capture the effect of the type, extent and severity of
distresses and roughness on the condition of the pavement section. Interestingly, these condition
ratings are inherently different despite the fact that some of them may have similar scales such as
0-100 or 1-100 according to statistical analyses.
Quality Management is performed at all stages in pavement condition surveys to ensure the
accurate information is given to management. Quality control (QC) refers to all activities
performed to ensure that the equipment and processes involved in data collection are in control
which will in turn ensure that high quality results are obtained. Quality assurance (QA) is a term
that refers to all activities conducted to verify that the collected pavement condition data meet the
quality requirements and specifications. Some state agencies employ the AASHTO guidelines as
the basis for QC/QA procedures while others may have their own detailed procedures. As part of
quality management, responsibilities of personnel must be stated and corrective actions such as
rating or calibration must be done again when necessary. Most importantly, all quality
management activities that are undertaken must be documented. This is done in order to optimize
pavement management. Quality management reports must include key personnel carrying out
61

specific tasks, initial and continuing calibration, copies of correspondences, detailed description
of quality standards, analyses of verification site tests results and recommendations for
improvements of the entire process.
5.2 Recommendations
It is recommended that all agencies have detailed quality control and quality assurance programs
to ensure integrity of data. Quality control programs that are already in existence must also be
reviewed at regular intervals since pavement condition survey is constantly evolving. Automated
equipment used in data collection must also be calibrated and monitored constantly to avoid
compromising the quality of the data. Agencies must also choose condition rating indexes that
address issues that are relevant in their jurisdiction rather than using indexes because they are
widely used by several other agencies.
Tolerance limits for data collection must also be reviewed periodically. This can be done using
simple statistical tools and methods such as paired t-tests. In the case of different vendors rating in
the same manner, the data can be analyzed in a time series format together with agency’s data such
that differences in the data are clearly visible. Lastly, all quality management procedures must be
documented to ensure future optimization and enhancement of pavement management.
62

REFERENCES
[i] Pavement interactive. Pavement Condition Rating Systems. PAVIA Systems,
www.pavementinteractive.org/article/pavement-condition-rating-systems/
[ii] Nakamura, V.F., and H.L. Michael. Serviceability Ratings of Highway Pavements: Technical
Paper. Publication FHWA/IN/JHRP-62/18.Joint Highway Research Project, Indiana Department
of Transportation and Purdue University, West Lafayette, Indiana, 1962.Doi:
10.5703/1288284313612
[iii] Timm, D.H., McQueen, J.M. A Study of Manual vs. Automated Pavement Condition
Surveys. Alabama Department of Transportation, Montgomery, AL, Highway Research Center,
Auburn University, Alabama 36849-5337, April 2004
[iv] Pavement Condition Surveys, Module 5,
http://www.cee.mtu.edu/~balkire/CE5403/Lec%204A.pdf, date accessed: 12:05 pm, June 17,
2013.
[v] PASCO Corporation, http://www.pasco.co.jp/eng/products/real/, Date accessed: June 14,
2013, 11:01am
[vi] Source: Spar Point Group, “FugroRoadware lands two-year, $3m mobile data collection
contract”
http://www.sparpointgroup.com/uploadedImages/Images/08.22.11.ARAN.png?maxwidth=800&
maxheight=600&bgcolor=white ,Date accessed: June 14, 2013, 11:20am
63

[vii] Illinois Center for Transportation, Civil Engineering Studies, Implementing Pavement
Management Systems for Local Agencies- State-of-the-Art/ State-of-the-Practice, Research
Report ICT-11-094, UILU-ENG-2011-2020, ISSN: 0197-9191, December 2011
[viii] US Department of Transportation, Federal Highway Administration, Performance
Evaluation of Various Rehabilitation and Preservation Treatments, FHWA-HIF-10-020, January
2010
[ix] Rafiah R., Advanced Pavement Management System Implementation for the Nigerian Federal
Road Network, 7th International Conference on Managing Pavement Assets, 2008
[x] Ong, G., S. Noureldin, and K. C. Sinha. Automated Pavement Condition Data Collection
Quality Control, Quality Assurance, and Reliability.Publication FHWA/IN/JTRP-2009/17.Joint
Transportation Research Program, Indiana Department of Transportation and Purdue University,
West Lafayette, Indiana, 2010.doi: 10.5703/1288284314288.
[xi] Perera, R.W., Kohn S.D. Profiling Errors and How to Avoid Them. Paper Submitted for
Pavement Evaluation 2002. http://pms.nevadadot.com/2002presentations/25.pdf, Date
Accessed:June 19, 2013, 2:30pm
[xii] VDOT Pavement Management Program, presented at Local Government Workgroup
Meeting on January 10th 2012,
http://www.virginiadot.org/business/resources/local_assistance/Microsoft_PowerPoint_-
_Local_Assistance_TC.pdf, Date accessed: June 20, 2013, 3:30pm
[xiii] Oregon State University Class Module. Skid
Resistance.http://classes.engr.oregonstate.edu/cce/winter2012/ce492/Modules/09_pavement_eval
uation/09-4_body.htm , Date accessed: June 21st, 2013, 2:30pm
64

[xiv] Oregon State University Class Module. Surface
Distress.http://classes.engr.oregonstate.edu/cce/winter2012/ce492/Modules/09_pavement_evalua
tion/09-3_body.htm, Date accessed: June 21st, 2013, 2:50pm
[xv] Pierce, L.M., McGovern G., Zimmerman, K.A. Practical Guide for Quality Management of
Pavement Condition Data Collection. US Department of Transportation, Federal Highway
Administration, February 2013.
[xvi] Ponniah, J., Sharma, B.N., Kazmierowski T.J.A Critical Review of an Existing Pavement
Condition Rating System.5th International Conference on Managing Pavements. Pavements and
Foundations Section, Ministry of Transportation, Ontario, August 2001
[xvii] Pavement Condition Indices, Module 6.
http://www.cee.mtu.edu/~balkire/CE5403/Lec12.pdf, Date Accessed: July 1, 2013, 11:56 am
[xviii] Gharaibeh, N.G., Zou, Y. Assessing the Agreement among Pavement Condition Indexes.
Journal of Transportation Engineering, ASCE, August 2010, DOI: 10.1061/(ASCE)TE.1943-
5436.0000141
[ixx] Janisch, D., Pavement Management Engineer. An Overview of Mn/DOT’s Pavement
Condition Rating Procedures and Indices.May 2006.
http://www.dot.state.mn.us/materials/pvmtmgmtdocs/Rating_Overview_State.pdf, Date
accessed: 7/11/2013, 12:27pm
[xx] Zheng, Q., Racca, D.P., Support of Pavement Management Systems at the Delaware
Department of Transportation. Delaware Transportation Institute, Delaware Department of
Transportation, Center for Applied Demography and Survey Research, College of Resources,
Education and Public Policy, Newark, DE 19716, December 1999
65

[xxi] Prozzi, J.A., Madanat, S.M. Development of Pavement Performance Models by Combining
Experimental and Field Data. Journal of Infrastructure Systems. Vol. 10, No. 1. ASCE, ISSN
1076-0342/2004/1-9-22. March 2004
[xxii] LTPP Manual for Profile Measurements and Processing, Chapter 4 Profile Measurements
using the Rod and Level.
http://www.fhwa.dot.gov/publications/research/infrastructure/pavements/ltpp/08056/chapt4.cfm,
Date accessed: July 20, 2013, 3:00pm
[xxiii] LTPP Manual for Profile Measurements and Processing, Chapter 3: Profile Measurements
Using the Face Dipstick.
http://www.fhwa.dot.gov/publications/research/infrastructure/pavements/ltpp/08056/chapt3.cfm
[xxiv] Iowa Dept. of Transportation, Office of Materials. Method of Test Determining Pavement
Profiles with the 25-foot Profilographs.Matls. IM3H. April 2003
66

Delaware Center for Transportation University of Delaware Newark,
Delaware 19716
AN EQUAL OPPORTUNITY/AFFIRMATIVE ACTION EMPLOYER To the extent permitted by applicable State and Federal laws, the University of Delaware is committed to assuring equal opportunity to all persons and does not discriminate on the basis of race, creed, color, sex, age, religion, national origin, veteran or handicapped status, or gender identity and expression, or sexual orientation in its educational programs, activities, admissions, or employment practices as required by Title IX of the Educational Amendments of 1972, Section 504 of the Rehabilitation Act of 1973, Title VII of the Civil Rights Act of 1964, and other applicable statutes. The University of Delaware has designated Karen Mancini, Director of the Office of Disabilities Support Services, as its ADA/Section 504 Coordinator under Federal law. Inquiries concerning Americans with Disabilities Act compliance, Section 504 compliance, campus accessibility, and related issues should be referred to Karen Mancini (302-831-4643) in the Office of Disabilities Support Services. Inquiries concerning Title VII and Title IX compliance and related issues should be referred to the Director of the Office of Equity and Inclusion, Becki Fogerty (302-831-8063).