Embed Size (px)
Citation preview

Paul Sheffield Haydn Mursell
Chief Executive Group Finance Director
Welcome to Kier Group’s
interim results

2
Highlights
Resilient performance
� Underlying profit before tax increased to £34m
� Strong net cash position: £131m
� Dividend increased to 21.5p
� Order book maintained at more than £4bn
What sustained our results
� Stable Group revenue
� Continued focus on cash management
� Risk management and ongoing cost control
� Frameworks & negotiated work account for 60% of awards

3
PropertyConstruction
Key achievements
Awards
� UK building £440m
� Crossrail (JV) £210m
� Hinkley (JV) £100m+
� Plymouth £50m
�Overseas £45m
Awards
� New work £125m
� Renewals & extensions £35m
� Pipeline GDV £700m
� Preferred bidder £200m
Disposals
� PFI assets £8m
� Savile Row £32m
� Housing land £18m
Services
£160m£670m

4
The next 12 monthsConstruction
� 100% of FY12 revenue and 68% of FY13 revenue secure and probable, similar to last year
� Work balance changing: • UK infra and overseas growing
• Frameworks reducing
• Open market more competitive
� Operating margin on target for FY12, tightening for FY13
Services
� Stable order book at £2bn and consistent margin
� Growth slower to come through – Maintenance spend declining
� We seek greater scale in FM and Environmental
Property
� Increased contribution to overall Group
� Continues to pursue largely non-speculative transactions
� Targeted return on capital of 15%

5
Overview: revenue & profitSix months to 31 December 2011
Revenue £1,097mRevenue £1,046m -4%Construction £720mServices £218mProperty £108m
Construction £728mServices £243mProperty £126m
69%
21%
10%
67%
22%
11%
Operating profit* £37.6m +10%Construction £17.8mServices £9.8mProperty £10.0m
47%
26%
27%
Operating profit* £34.1mConstruction £19.8mServices £10.9mProperty £3.4m
58%32%
10%

6
* Excludes Corporate
� Robust Construction revenue of £720m
• Frameworks and negotiated opportunities
• Long-term client relationships
• Intelligent, value-engineered solutions
� Reduced Services revenue of £218m
• Subdued level of public sector activity, particularly in Maintenance, mitigated by improvement in
FM and Environmental
• Public sector contracts taking longer to come to market, and some going back in house
• Continue to pursue FM opportunities for operational synergies that could be realised by increased
scale
� Order books being refilled at broadly the same rate
• Construction: 100% secured for FY12 and 68% for FY13
• Services: 95% secured for FY12, with good forward workload visibility
� Property significantly improved due to:
• Disposals of two PFI investments at 7% discount rate
• Ongoing development of the c.£700m (GDV) pipeline
• Good level of housing unit sales at 476
Overview: revenue & profit - notes

7
+1132.235.6Total operating profit
%2010£m
2011£m
ChangeSix months to 31 December
--6.7Profit on disposal of PFI investments
-1.40.5Joint ventures (JVs)
-30.828.4Operating profit: Group
+929.632.3Profit before tax
+1322.325.3Profit after tax attributable to equity holders
-(0.3)(0.6)Minority interest
-(7.0)(6.4)Taxation
-(1.7)(1.7)Amortisation of intangible assets
+931.334.0Profit before tax, amortisation and exceptional items
-(0.1)(1.4)Net finance cost
+1331.435.4Profit from operations
-(0.1)(0.1)Tax
-(0.7)(0.1)Share of JVs: Finance cost
Income statement

8
� Net finance cost now includes the interest unwind on the deferred consideration following the Lloyds
property portfolio acquisition in April 2011
� Effective tax rate of 20% compares favourably with December 2010 (24%)
� No exceptional items
Income statement - notes

9
Operating profit
-1010.99.8Services
%2010£m
2011£m
Performance by division
ChangeSix months to 31 December
-1019.817.8Construction
1.71.6Homes+194
1.78.4Property: Property & PFI (including profit on disposal of PFI investments)
* Before amortisation of intangible assets
+931.334.0Pre-tax profit*
-(0.1)(0.1)JV tax
-(0.7)(0.1)JV finance cost
-(0.1)(1.4)Net finance cost
+1132.235.6Operating profit*
+5(1.9)(2.0)Corporate

10
� Construction: robust operating margin of 2.5%
� Services: operating margin maintained at 4.5%
� Property:
• Ongoing development at Uxbridge
• Progressing and on track at Savile Row
• PFI disposals at c.7% post-tax discount rate, following our strategy of regular disposal
• Improved housing unit sales of 476
• Completed £18m of land sales, on deferred cash terms
Operating profit - notes

11
%20102011
ChangeSix months to 31 December
* Before amortisation of intangible assets
+820.0p21.5pDividend per share
+1160.3p67.1pBasic earnings per share
+1163.5p70.3pUnderlying earnings per share*
-37.037.7Weighted average number of shares (m)
Earnings per share and dividend

12
� Growth of 11% in underlying EPS to 70.4p (2010: 63.5p)
EPS benefitted from the effective tax rate of 20%
� Interim dividend increased by 8% to 21.5p (December 2010: 20.0p)
� Aiming to maintain 1/3 : 2/3 annualised split
Earnings per share and dividend - notes

13
At 31 December
At 30 June
At 31 December
2010£m£m
2011£m
2011£m
Change
174-34195161Cash
(30)-(30)(30)Long-term borrowings
(63)+4(51)(47)Provisions
(48)-7(22)(29)Pensions (net of deferred tax)
(4)-32926Tax and deferred tax
124-6164158Net assets
(470)+54(520)(466)Other working capital
420-22431409Inventories
28-396Investment in JVs
88+796103Property, plant and equipment
29-22725Intangible assets
Balance sheet summary
14
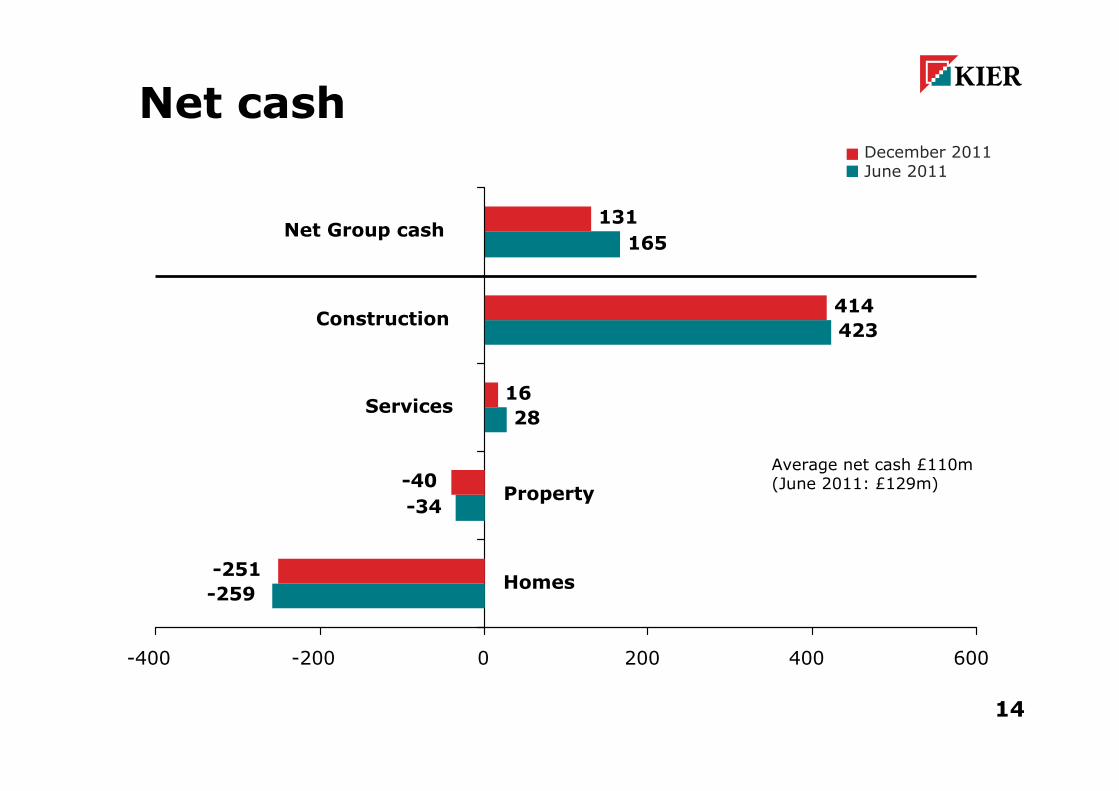
December 2011June 2011
165
131Net Group cash
-259
-34
28
423
-251
-40
16
414
-400 -200 0 200 400 600
Homes
Property
Services
Construction
Average net cash £110m (June 2011: £129m)
Net cash

15
� Capital and investment spend of £33m since June 2011 includes:
• £3m Mining and other Construction
• £10m Plant and vehicles, Environmental Services
• £11m Net Property developments (incl. Solum) Property
• £4m PFI sub-debt injection and other Property
• £5m Private units on Affordable sites Homes
� Redundancy costs incurred in Construction and Services of c.£5m to appropriately size our
operations to suit the current trading conditions
� Tighter payment environment in Construction and Services c.£15m
Net cash - notes

16
At 31 December
At 30 June
At 31 December
2010£m£m
2011£m
2011£m
Change
420-22431409Inventories
54-95243Other work in progress
19+48791Commercial land and work in progress
139-6133127Residential work in progress
208-11159148Residential land
Inventories

17
£22m reduction comprises:
� Housing unit sales
� Land & WIP sales
� WIP for private units on Affordable sites
� Movements on other WIP balances
Residential land comprises 4,412 plots, all with planning permission
Inventories - notes

18
At 31 December
At 30 June
At 31 December
2010£m£m
2011£m
2011£m
Change
(48)-7(22)(29)Total net pension liability
667+37680717Market value of assets
2.8%-0.7%2.7%2.0%Inflation rate – CPI
3.6%-0.7%3.6%2.9%Inflation rate – RPI
5.4%-0.7%5.5%4.8%Key assumptions: Discount rate
--51(4)Net effect of Sheffield Pension Scheme
(48)-2(23)(25)Net pension liability
17-88Deferred tax
(65)-2(31)(33)Deficit in the scheme
(732)-39(711)(750)Present value of liabilities
Kier Group Pension Scheme:
Pensions

19
� The decrease in the discount rate increased the liabilities, mitigated by a reduction in inflation and
the greater than expected return on the assets
� From a sensitivity point of view, for every 0.1% movement in discount rates our liabilities move by
about £11m.
Pensions - notes

20
Summary
� Resilient results
� Operating profit* up 11% to £35.6m
� Average month-end net cash of £110m
� Dividend increased to 21.5p
� Strong order books for Construction and Services at >£4bn
� Significant and sustainable increase in the Property
division’s profit contribution
� Prudent accounting practices underpin the financials
� A balanced and solid platform for the future
* Underlying operating profit and EPS are stated before the amortisation of intangible assets

21
Construction
BIM model - Services distribution for a whole building

22
Construction
423
2,245
2.7%
39.3
1,445
Year to June 2011 £m
6 months to December
-5434414Cash
+52,0962,192Order book (secure and probable)
-2.7%2.5%Operating margin
-1019.817.8Operating profit
-1728720Revenue
Change
%
2010
£m
2011
£m
Revenue - £m Operating profit, £m
Operating margin, %
H1
FY
2007 2008 2009 2010 2011 Dec 11
720
1,585
1,411
1,417
1,492
728
782
675
678
794
1,445
Dec 112007 2008 2009 2010 2011
2.3%
2.6%2.7%
1.6%
2.6%
17.8
19.8
13.9
9.5
16.9
19.0
1.8%
2.5%2.7%
2.5%2.4%
1.4%
21.9
36.6
39.1
36.2
39.3

23
� Performance as anticipated
� £670m new awards in H1, of which 60% via frameworks and similar arrangements
� Outlook
• 68% of FY13 revenue secure and probable
• UK building market declining and increasingly competitive
• Infrastructure and overseas markets growing
� The autumn statement underpins Government support for infrastructure spending, largely post 2013
� Proportion of competitive work increasing as framework spend declines
Construction - notes

24
����5%����3%Hotel and leisure
����18%����0%Power & waste
����3%����13%Overseas
����5%����9%Care home, high-rise affordable housing, student accommodation
����7%����6%Health
����10%����10%Commercial
����11%����13%Transportation
����32%����33%Education
Current expectations
% awards(£0.7bn)
Expectations2012 & 2013
% awards(£1.5bn)
6 months to Dec 2011Year to June 2011Sector
For full chart, see appendix
Construction

25
� Scape framework (up to £1bn over 4 years), in partnership with the Services
division: £100m of opportunities identified
� Kier one of only three contractors appointed to the Welsh Regional NHS
frameworks (£65m p.a.)
� Power and waste awards in H1 12: £100m+ (Kier share)
49%56%
74%
56%48%
51%44%
26%
44%52%
2008 2009 2010 2011 Dec 11
Private
UK public
Public and private awards as a % of total awards
Construction - notesConstruction - notes

26
� New nuclear - Hinkley, £100m+ in JV
� Energy from waste Plymouth, £50m
� Transport - Farringdon station, £210m in JV
� Preferred bidder on a further £110m power & waste projects
Construction – UK infrastructure
Tunnel boring machine (TBM)

27
Awards
� Crossrail: c.£800m of work now secured in JV
� Water: £17m for Thames Water at Oxford secured
Bids
� Gas: Abernedd and Carrington bids during 2012 (£100m estimated work); national gas power station
programme in appendix.
� Hinkley: marine works (£200m)
� SCR*: Aberthaw (1 of 2, c.£100m) and Eggborough (c.£100m)
� * SCR: selective catalytic reduction (coal power station clean-up)
Construction – UK Infrastructure - notesConstruction – UK infrastructure - notes

28
� £440m awarded in H1
� Education: £150m of new academies awarded
� King’s Cross regeneration: preferred bidder on £100m
� Health: preferred bidder on £100m of P21+
� Open market increasingly competitive
Arthouse – Kings Cross regeneration
Construction – UK building

29
� P21+: won £205m out of £935 awarded since inception
� Framework for Academies : 9 schemes entered into contract (£150m) in the 6 months to Dec 11
and 4 more to close (£50m)
� South Lanarkshire Schools framework awarded (1 of 3): £150m over 4 years for primary schools
modernisation
� Government’s £2bn Priority Schools Building Programme; procurement of the first schools start in
Q2 12
� Kier Living, the focal point of Kier’s activities in the care, student accommodation and high rise
affordable housing sectors, is positioned on frameworks valued at c.£2.5bn.
Construction – UK building - notesConstruction – UK Infrastructure - notes

30
Hong Kong� £330m on site
� 5 year pipeline of new activity
Caribbean� Hydroelectric power station project, £20m
� Digicel HQs in Haiti and Jamaica, £24m
� New office in Trinidad to target oil and gas
ME� Saudi economic and social infrastructure opportunities
� Researching adjacent countries for expansion
Prospects
Targeting £150/200m revenue by June 2014
Construction - Overseas
Digicel HQ, Jamaica

31
Middle East
� £130bn National Investment Plan in Saudi
� Currently bidding for bauxite mining and rail work in Saudi
Hong Kong
� New MTR projects are currently targeted for 2012/13 start
� Infrastructure plan, £4bn p.a. for the next 5 years: MTR, airports and transport projects
Construction – Overseas - notesConstruction – Overseas - notes

32
Services

33
Services
Operating profit, £m
Operating margin, %
Revenues, £m
28
2,030
4.5%
21.7
484
Year to June 2011 £m
6 months to December
-503216Cash
01,9821,973Order book (secure and probable)
-4.5%4.5%Operating margin
-1010.99.8Operating profit
-10243218Revenue
Change
%
2010
£m
2011
£m
2007 2008 2009 2010 2011 Dec-11
218
243
179
143
230
224
484
394
316
471
438
2007 2008 2009 2010 2011 Dec-11
9.8
10.9
7.4
5.1
10.1
8.9
12.2
16.2
17.9 21.4
21.7
4.1%4.4% 4.5% 4.5%
3.6%
4.0%
4.1%
4.5% 4.5%
3.9%
4.1%H1
FY

34
� Order book stable at £2bn
� 95% of FY12 revenue and good forward workload visibility
� £12m cash reduction since June 11 comprises:
• £10m of capital and investment spend
• Redundancy costs and tighter payment environment
� Competitive environment but 4.5% margins still achievable
� Local politics are impacting on outsourcing decisions
� Growth in outsourcing, particularly in the public sector, now expected in 2014
Operating profit and margin are before the amortisation of intangible assets
Services - notesServices – Maintenance - notes

35
0
50
100
150
200
250
300
350
400
2013 2014 2015 2016 2017 2018 2019 2020 2021 2022
£m
Potential contract extensions
Order book
Services - Maintenance
� Revenue down 22%, reflecting public sector budget pressures
� No significant contracts to rebid before 2014
� £700m of potential contract extensions if all exercised
� Competitive environment promotes selective bidding
£140m
64%
H1 12 revenue

36
Maintenance: planned and reactive housing maintenance for local authorities and registered providers.
� Reduction in revenue largely driven by more than 40% cuts in local authorities’ capital works
� Strong bid pipeline (see in appendix)
� Pressure on prices mitigated to some extent by cost base reduction in collaboration with our clients.
Services - Maintenance - notesServices – Maintenance - notes

37
Services - FM and Environmental
� Revenue up 22%
� More than £100m of awards
� Private sector growth targeted
� Organic and acquisition-based growth being pursued
H1 12 revenue
£78m
36%

38
� Strong bid pipeline (see in appendix).
� Environmental new contracts and extensions (value p.a.): East Northants and North Norfolk, £6m;
Waltham Forest, £15m; Bromley, £4m.
� FM win: Legal & General, £7m
FM & Environmental: hard and soft FM, M&E, street cleaning, ground maintenance, waste collection and recycling.
Services – FM and Environmental - notesServices – FM and Environmental - notes

39Property

40
Property
� Strong performance in H1
� Cash recovery in H2 on property sales
� Continued investment in the development pipeline
54
311
11.1
4.2
97
153
Year to June 2011 £m
6 months to December
+40
-14
43
347
60
299
Net operating assets
Property and PFI
Homes (land bank: 4,412 units)
+1941.7
1.7
8.4
1.6
Operating profit
Property and PFI (incl. £6.7m disposal profit)Homes
-53
+28
66
60
31
77
Revenue
Property and PFI
Homes
Change
%
2010
£m
2011
£m

41
Land bank reduced from 5,400 to 4,400 units over the last 12 months.
Property - notesProperty - notes

42
Property - Development
� £700m (GDV) development pipeline over 6 years
� 40 schemes in retail, hotels, residential and light industrial
� Non-speculative strategy
� Increase cash investment to c.£80m by June 13
� Targeted return on capital of 15%
Twickenham station redevelopment

43
� Market still buoyant for good quality schemes in London area and key strategic locations further afield
� We continue to manage risk by securing an exit route before committing
� Solum
• 2 schemes on site; completion in 2013, £55m
• Planning achieved at Twickenham, £46m
� Sydenham: lease arrangements with key retailers
� Unique integrated development, construction and maintenance offering is a key differentiator
Property - Development - notesProperty – Development - notes

44
Property
� 2 disposals at 7% post-tax discount rate
� Shortlisted for 4 projects valued at £200m
� Portfolio valuation: £30m at 7.5% discount rate
� £18m land bank sales agreed in H1, £38m to date
� Stable private homes sales
� £200m of affordable contracts awarded in H1
� 3 major regeneration schemes, £190m
Housing
PFI
Western Writhlington School

45
Housing - Regeneration schemes
� Tavy Bridge, London, £40m, start on site in March
� Awarded the Manor & Kingsway site in Derby, £100m; 700 new homes, residential-led mixed-use
development
� Awarded the next development phase at Egg Hill in Birmingham, £50m
PFI
� Disposals: Hinchingbrooke (to Pension Scheme) and West Berkshire hospitals
� Committed equity investment: £18.3m. See portfolio in appendix.
6 months to Dec 2011476 units
280
59%
196
41%
Private sales
Affordable and mixed
Property - Housing - notesProperty – Housing - notes
46
Conclusion
� Good first half performance
� Full year on track
� Macro environment remains challenging
� Growth in public sector outsourcing expected in 2014
� Maturing property business
� Strong cash and balance sheet, great people
47
Featherstone Prison
Appendices

48
Group net cash bridge
+38 -33
-15
-12
131
-5
165
-7
100
120
140
160
180
200
220
June 2011 net
cash
operating cash
inflow (incl PFI
disposals)
capital and
investment related
tighter payment
environment
redundancy costs pension deficit
contributions
tax, interest and
dividends
Dec 2011 net cash
£m

49
Construction - Awards
����5%����3%Hotels and leisure
����32%����33%Education
����18%����0%Power & waste
����11%����13%Transportation
����10%����10%Commercial
����7%����6%Health
����5%����9%Care home, high-rise affordable
housing, student accommodation
����3%����13%Overseas
����3%����4%Retail
2%3%Other
����0%����1%Mixed-use
����2%����2%Custodial
����2%����3%Industrial
Current expectations
% awards(£0.7bn)
Expectations2012 & 2013
% awards(£1.5bn)
6 months to Dec 2011Year to June 2011Sector

50
Construction - CCGT programme
2013Intergen900Corringham
TBAEON1200Drakelow
TBAIberdrola/Scottish Power1000Salt Marshes
TBA Intergen900Spalding ‘B’
2014 Acorn Power900Thorpe Marsh
20142Co Power900Don Valley (was Hatfield)
2013RWE2400Willington
2013Centrica800Kings Lynn
2013Iberdrola/Scottish Power800Damhead ‘2’
2013ESBI860Carrington
2012S&SE450Abernedd
Anticipated start on site
OwnerPowerMW
Station

51
April 2110 + 5£10mIntegrated Service Contracts – responsive, planned and cyclical maintenance, voids, electricity and gas
Gosport BC
January 147 + 3*£20mHousing, grounds & street servicesHarlow DC
March 131 year£11mHousing improvements worksWakefield MBC
Sep 1910 + 5£60mRepairs & maintenance, Decent Homes and construction
North Tyneside
February 18
10 + 5£35mRepairs & maintenance and Decent HomesStoke-on-Trent
April 165 + 5£8mRepairs & maintenance and Decent HomesBarnsley
October 144 + 6£20mRepairs & maintenance and gas servicingHomes for Islington
April 1411£60mRepairs & maintenance and Decent HomesSheffield City Council
Expiry excl. extensions
Duration (years)
Annual revenue
DescriptionContract
Services - Maintenance current contracts
* 7 year contract + 3 year potential extension

52
Services - Division’s current bid pipeline (extract)
January 1460320Harlow DC (extension)
July 1230103Calico Housing Limited
May 126-125 + 21-2Surrey County Council
April 124595East Sussex County Council
April 1250105Accord Housing Association
July 12Up to 5805 + 5Up to 58Circle Anglia
TBC2505+525Housing 21
April 121,00010 + 10*52Oxfordshire County Council
April 127510 + 55Golding Homes
April 13Up to 1,2001065-120MoD National Housing Prime
Nov 1250510High Wycombe
Start DatePotential Gross £m
Duration (years)
Annual value £mCouncil
* 10 year contract + 10 year potential extension

53
Property - PFI portfolio
Green: Kier Construction and Services Red: Kier Construction contractor
Directors’ valuation at 7.5% - £30.3m
£18.3mInvestment
70.01.722ConstructionGloucester Fire Stations
42.53.460ConstructionPolice Investigation Centres
42.51.725OperationalNorth Kent Police HQ
50.00.718OperationalGreenwich Care HomesBlue light
78.47.869OperationalKent BSF PFI 1Education
Operational
Operational
Operational
Status
50.0
50.0
0.7
1.0
14
14
Bournemouth Library
Oldham Library
Local authority
50.01.327Ipswich HospitalHealth
Equity %
Kier equity/loan stock £m
Capital value £m
ProjectSector