Embed Size (px)
Citation preview

Paul GvothEBA-Norfolk, VA
November 18, 2009
Hampton Roads Area INCOSE/SCEA Decision Analysis Conference
Economic Benefits AnalysisThe “Other-Side” of Cost
This document is confidential and is intended solely for the use and information of the client to whom it is addressed.
Economic & Business Analysis - NorfolkPre-Decisional Analysis and Data

2
Economic & Business Analysis - NorfolkBenefits Analysis Brief 11.18.09 HRA SCEA/INCOSE
Agenda
Introduction
Similarities/Differences in Benefits Analysis Approach vs. Cost Analysis
Tiered Approach
Example
References
Pre-Decisional Analysis and Data

3
Economic & Business Analysis - NorfolkBenefits Analysis Brief 11.18.09 HRA SCEA/INCOSE
Introduction
Why this is important?
Acquisition Requirements– Nunn-McCurdy (15% , 25%, ‘82)– Clinger-Cohen (ITMRA –’96, CIO)
GAO Audits and Tracked Recommendations (IG reporting to Congress)
Internal Competition for Resources (POM and FYDP, POPS)
Justification to External Entities
Decision Analysis – Selection of Preferred Alternative among all Viable Alternatives (AoA)
Integral part of an overall Economic Analysis (EA), ROI
Pre-Decisional Analysis and Data

4
Economic & Business Analysis - NorfolkBenefits Analysis Brief 11.18.09 HRA SCEA/INCOSE
Agenda
Introduction
Similarities/Differences in Benefits Analysis Approach vs. Cost Analysis
Tiered Approach
Example
References
Pre-Decisional Analysis and Data
5
Economic & Business Analysis - NorfolkBenefits Analysis Brief 11.18.09 HRA SCEA/INCOSE
Cost Analysis and Benefits Analysis Share Some Technical Points
Cost Analysis– Analogy– Parametric– Engineering Build-Up– Expert Opinion– Extrapolation from Actual– Cost Element Structure (CES)
Benefits Analysis– Analogy– Parametric– Engineering Build-Up– Expert Opinion– Extrapolation from Actual– Benefits Elements Structure (BEM)
Both analyses sensitive to up-front important analytical decisions about allocations and application of economic concepts (NPV, ROI, BE)
Benefits Element Structure
• R&D and T&E• Military Personnel• Operations and
Maintenance• Procurement• Construction
Pre-Decisional Analysis and Data
6
Economic & Business Analysis - NorfolkBenefits Analysis Brief 11.18.09 HRA SCEA/INCOSE
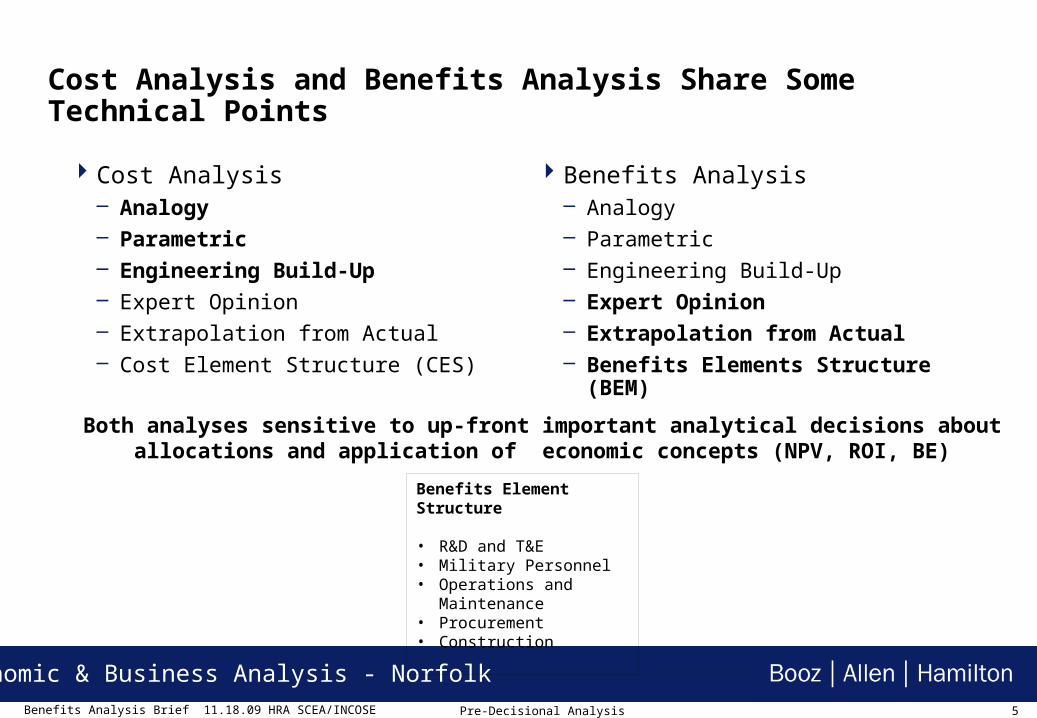
However, there are important differences…
Cost Analysis– Well recognized published sources of cost
information– Risk is better understood (CSPT)– Common Accepted Terms- of-Reference
Across Field– Less Reliance on Expert Opinion– Certification for Analysts– Navy Center for Cost Analysis (NCCA)– Cost Analysis Improvement Group (CAIG)
Benefits Analysis– Analogies for new programs do not exist
and little published benefits data– Parameters are often unknown– Terms-of-Reference– Heavy use of Expert Opinion– Risk not well defined– No organized Benefits Analysis
Community– Quality of Benefits Analysis dependent
upon client environment– Less scrutiny then costs but high impact
on Decision Metrics
Pre-Decisional Analysis and Data

7
Economic & Business Analysis - NorfolkBenefits Analysis Brief 11.18.09 HRA SCEA/INCOSE
Agenda
Introduction
Similarities/Differences in Benefits Analysis Approach vs. Cost Analysis
Tiered Approach
Example
References
Pre-Decisional Analysis and Data
8
Economic & Business Analysis - NorfolkBenefits Analysis Brief 11.18.09 HRA SCEA/INCOSE
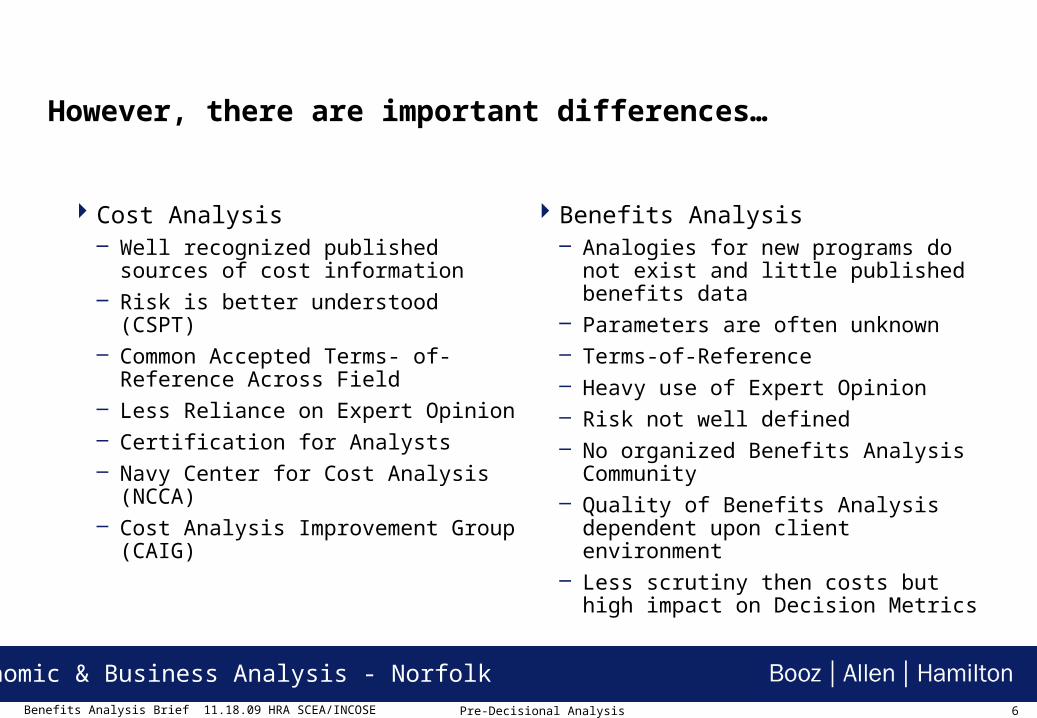
Benefits Analysis Methodology - Four Steps:
Identify the functional capabilities of the Preferred Alternative (PA) and the Status Quo (SQ).
Develop the benefits model by allocating benefits to the four tiers of the framework described below.
Estimate the monetary value of the quantitative benefits by combining the LCCE, cost savings, and operational efficiencies. This will yield an ROI, NPV, and Payback Period calculations.
Address the improved operational capabilities resulting from the preferred alternative’s implementation within the context of risk.
Produce LCCEDevelop Benefits
FrameworkEstimate Benefits
Evaluate Risks
Pre-Decisional Analysis and Data

9
Economic & Business Analysis - NorfolkBenefits Analysis Brief 11.18.09 HRA SCEA/INCOSE
Benefits are Classified According to a 4-tier Approach*
Tier 0 consists of monetary cost savings determined by subtracting the costs associated with the PA from the current cost to maintain the SQ.
Tier 1 includes mission critical operational efficiencies directly related to the drawdown of inventory in terms of cost avoidances.
Tier 2 includes achievable operational efficiencies subordinate to the efficiencies received in Tier 1, but which still provide cost avoidances to the Marine Corps.
Tier 3 consists of qualitative benefits associated with the implementation of the Preferred Alternative.
Cost avoidances account for the bulk of GCSS benefits and is the focus today
*Based on Guidance from OSD PAE: Methodology captures inherent subjectivity and relative risk. Cost savings increase incrementally and cumulatively from “initial outlay” benefits to the inclusion “must have” benefits to the inclusion of “nice to have” benefits.
Cost S
avings/Avo
idance
Pre-Decisional Analysis and Data

10
Economic & Business Analysis - NorfolkBenefits Analysis Brief 11.18.09 HRA SCEA/INCOSE
Benefits Analysis
Qu
alit
ativ
e D
escr
ipti
on
Means of Measure:Qualitative Description
Qualitative Benefits
Tier 3
Improved Capabilities•Supply Management•Capacity and Production•Maintenance Management
Tier 1 Tier 2
Operational Drivers:•Inventory Carrying Costs•Demand Planning/Forecasting
Mission Critical Operational Efficiencies: Costs Avoided
Achievable Operational Efficiencies: Costs avoided
Means of Measure:•Discounted Payback•Net Present Value•Return on Investment
Fin
anci
al A
nal
ysis
Means of Measure:•Discounted Payback•Net Present Value•Return on Investment
Operational Drivers:•Procurement Savings•Military Manpower Reduction
Benefits Analysis
Qu
alit
ativ
e D
escr
ipti
on
Means of Measure:Qualitative Description
Qualitative Benefits
Tier 3
Improved Capabilities•Supply Management•Capacity and Production•Maintenance Management
Qu
alit
ativ
e D
escr
ipti
on
Means of Measure:Qualitative Description
Qualitative Benefits
Tier 3
Improved Capabilities•Supply Management•Capacity and Production•Maintenance Management
Tier 1 Tier 2
Operational Drivers:•Inventory Carrying Costs•Demand Planning/Forecasting
Mission Critical Operational Efficiencies: Costs Avoided
Achievable Operational Efficiencies: Costs avoided
Means of Measure:•Discounted Payback•Net Present Value•Return on Investment
Fin
anci
al A
nal
ysis
Means of Measure:•Discounted Payback•Net Present Value•Return on Investment
Operational Drivers:•Procurement Savings•Military Manpower Reduction
Pre-Decisional Analysis and Data

11
Economic & Business Analysis - NorfolkBenefits Analysis Brief 11.18.09 HRA SCEA/INCOSE
Agenda
Introduction
Similarities/Differences in Benefits Analysis Approach vs. Cost Analysis
Tiered Approach
Example
References
Pre-Decisional Analysis and Data

12
Economic & Business Analysis - NorfolkBenefits Analysis Brief 11.18.09 HRA SCEA/INCOSE
GCSS-MC EA Up-Front Summary
Preliminary ROI calculations demonstrate that sufficient Operational Efficiencies are achievable in GCSS-MC to generate a positive ROI for Block I, and its increments, providing support to proceed with program development
GCSS-MC business value resulting from the investment in new system capabilities is expressed as Operational Efficiencies that can be evaluated using USMC Logistics Chain Management (LCM) Balanced Scorecard Metrics and Joint Staff LCM Metrics
Reconciled NCCA LCCE amounts will be included in future ROI analyses
Benefits Analysis and LCCE will be finalized prior to the MS C decision
Analyzed all that we could gather data on, but not as much as we wanted
Pre-Decisional Analysis and Data

13
Economic & Business Analysis - NorfolkBenefits Analysis Brief 11.18.09 HRA SCEA/INCOSE
Global Combat Support System (GCSS) Marine Corps (MC) Benefits Analysis – Purpose:
Review Preliminary Financial Results of GCSS-MC Economic Benefits Analysis relative to the Marine Corp’s investment in the capabilities set out in the Capabilities Production Document (CPD)
Discuss GCSS-MC Economic Benefits resulting from program investment in Logistics Chain Management (LCM) Capabilities
Review Economic Metrics expressed as monetized business value returning to the USMC from GCSS-MC program investment
Pre-Decisional Analysis and Data

14
Economic & Business Analysis - NorfolkBenefits Analysis Brief 11.18.09 HRA SCEA/INCOSE Pre-Decisional Analysis and Da
ta
Data Sources, Tools, Applied Analysis
Collected Marine Corps data from:
USMC LOGCOM – Albany,
GA, USMC HQ I&L, DC, and from
USMC Maintenance and Supply Records.
Applied business analytics tools such as:
Expert Choice (AHP),
SPSS,
Excel
…to collect capability attribute weights, calculate averages, and graphically display data.

15
Economic & Business Analysis - NorfolkBenefits Analysis Brief 11.18.09 HRA SCEA/INCOSE
Economic Analysis Products
Performance Improvement Metrics Table (PIMT) Effort (Briefed April 2009)– Identified the functional/operational capabilities of the GCSS-MC/LCM Block 1 Alternative and
the SQ sourced from the Capabilities Production Document (CPD)– Developed metrics that are linked to each operational capability
Economic Viability to Support IRB Certification (August/September 2009)– Develop the benefits model by extracting benefits to the benefits analysis framework– Allocate benefits into the four tier break-out of Tier-0, Tier-1, Tier-2, Tier-3 – Estimate the monetary value of the quantitative benefits by combining the Program Office LCCE
(PLCCE), cost savings, metrics results, and operational efficiencies– Calculate the NPV, ROI, and Payback Period calculations using PLCCE data
Milestone C (Through January 2010)– Update the Benefits Analysis, NPV, ROI, and Payback Period calculations with the NCCA-
reconciled LCCE– Achieve OSD PA&E review and approval
Pre-Decisional Analysis and Data

16
Economic & Business Analysis - NorfolkBenefits Analysis Brief 11.18.09 HRA SCEA/INCOSE
Economic Analysis Process
Establish Ground Rules & Assumptions
Establish Economic Analysis Approach
Cost Analysis Requirements
Description (CARD)
Economic Analysis
Development Plan (EADP)
Conduct Benefits Analysis
Develop Status Quo LCCE
Develop Preferred Alternative LCCE
Block 1 Economic Analysis Process
NCCA Reconciliation
Risk & Sensitivity Analysis
Benefits Analysis
Economic Analysis Document
Outputs
PA LCCE
SQ LCCE
Return on Investment (ROI)
Payback
Net Present Value (NPV)
Data Collection
Update
and Finalize
Cost
and
Benefit Analyses
Develop Performance Improvement Metrics Table
Current
Pre-Decisional Analysis and Data

17
Economic & Business Analysis - NorfolkBenefits Analysis Brief 11.18.09 HRA SCEA/INCOSE
Capabilities Linked to Joint and USMC LCM Balanced Score Card Metrics
Capabilities Produced by Investment in GCSS-MC– Investment in GCSS-MC produces capabilities in the following Logistics Chain Management (LCM)
Areas:
• Request Management (22.5%)
• Supply (30.6%)
• Maintenance (30%)
• Finance (5.2 %)
• System Administration (11.%)
New and improved capabilities create performance improvements or operational efficiencies
Performance of capabilities are evaluated using Joint and USMC Balanced Score Card Metrics– GCSS-MC tracks and balances capability performance relative to the scorecard metrics, creating
Operational Efficiencies – The amount of Monetized Economic Benefit derived from the implementation of GCSS-MC Block 1 is
directly related to the degree of Operational Efficiencies generated by the new or improved capability
Pre-Decisional Analysis and Data

18
Economic & Business Analysis - NorfolkBenefits Analysis Brief 11.18.09 HRA SCEA/INCOSE
Capabilities Linked to Balanced Score Card
GCSS-MC Capabilities2
Impact(Weight)
Joint Chiefs of Staff Joint Integrated Capabilities (JIC) Joint Attributes1
Sustainability Responsiveness Survivability Flexibility Economy Attainability
USMC Balanced Scorecard Attributes (Weight)
Readiness(25%)
Responsiveness(20%)
Reliability(20%)
Flexibility(15%)
Expenses(10%)
Assets(10%)
Request ManagementThe system provides the capability to create, update, validate, approve and manage customer requests for logistics support including supply, service, maintenance, and returns or combinations of these requests.
22.5% X X X X XSupplyThe system provides the capability to plan and execute the functions necessary for supply operations. This includes functions related to capacity, operations and fulfillment as it pertains to inventory, warehousing, and asset management.
30.6% X X X X X XMaintenanceThe system provides the capability to plan and execute the functions necessary for maintenance operations. This includes functions to conduct capacity and production management of maintenance resources and to plan and control maintenance execution.
30% X XFinanceThe system provides the capability to conduct financial accounting for assets and inventory. This includes functions to capture costs and other financial data related to inventory and asset values required for Clean Audit compliance.
5.2% XSystem AdministrationThe system provides the capability to support the on-going system setup, configuration, and maintenance required for the GCSS-MC/LCM BLOCK 1 enterprise and deployed environments.
11.7% XTotal 100.0%
1 The “Simplicity” Joint Attribute has been omitted because it does not map to a specific USMC Balanced Scorecard Attribute
2 GCSS-MC Capability Production Document (CPD) Draft October
2008 Pre-Decisional Analysis and Data

19
Economic & Business Analysis - NorfolkBenefits Analysis Brief 11.18.09 HRA SCEA/INCOSE
Performance Improvement Metrics Table (PIMT)
– “The Performance Improvements Metrics Table must reflect metrics which quantify the performance improvements that will result from the modernization as justification for the investment.” – DITPR-DON Tier 1-3* Certification Reporting Requirements
– Shows the performance metrics associated with operational efficiencies (OE) gained by implementing the new system increment
Purely operational improvements – no costs or monetized benefits are associated with the PIMT
Compares operationally the differences between the legacy and future system
Provides the expected time for the improvement
*DoD and DoN Business System Investment Tiers based on total development costs. Tier 1-3 are greater than $1million.
Pre-Decisional Analysis and Data
20
Economic & Business Analysis - NorfolkBenefits Analysis Brief 11.18.09 HRA SCEA/INCOSE
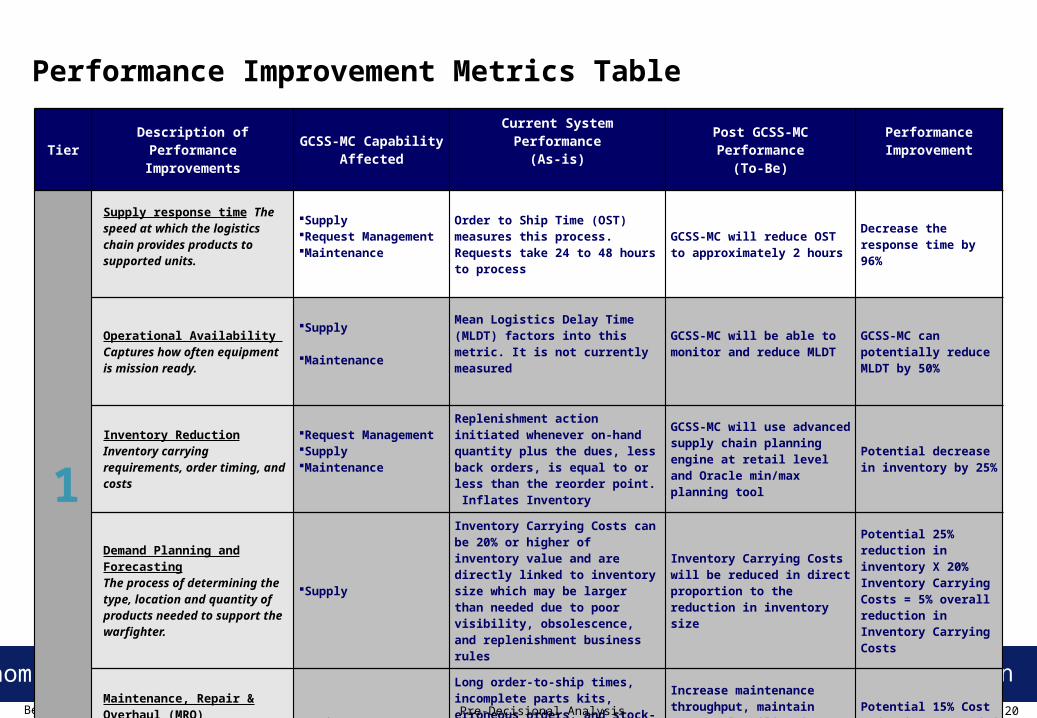
Performance Improvement Metrics Table
TierDescription of Performance
ImprovementsGCSS-MC Capability
Affected
Current System Performance(As-is)
Post GCSS-MCPerformance
(To-Be)
Performance Improvement
1
Supply response time The speed at which the logistics chain provides products to supported units.
Supply Request ManagementMaintenance
Order to Ship Time (OST) measures this process. Requests take 24 to 48 hours to process
GCSS-MC will reduce OST to approximately 2 hours
Decrease the response time by 96%
Operational Availability Captures how often equipment is mission ready.
Supply Maintenance
Mean Logistics Delay Time (MLDT) factors into this metric. It is not currently measured
GCSS-MC will be able to monitor and reduce MLDT
GCSS-MC can potentially reduce MLDT by 50%
Inventory ReductionInventory carrying requirements, order timing, and costs
Request ManagementSupplyMaintenance
Replenishment action initiated whenever on-hand quantity plus the dues, less back orders, is equal to or less than the reorder point. Inflates Inventory
GCSS-MC will use advanced supply chain planning engine at retail level and Oracle min/max planning tool
Potential decrease in inventory by 25%
Demand Planning and Forecasting The process of determining the type, location and quantity of products needed to support the warfighter.
Supply
Inventory Carrying Costs can be 20% or higher of inventory value and are directly linked to inventory size which may be larger than needed due to poor visibility, obsolescence, and replenishment business rules
Inventory Carrying Costs will be reduced in direct proportion to the reduction in inventory size
Potential 25% reduction in inventory X 20% Inventory Carrying Costs = 5% overall reduction in Inventory Carrying Costs
Maintenance, Repair & Overhaul (MRO)Process, support, and downtime for repairable parts operations
• Maintenance
Long order-to-ship times, incomplete parts kits, erroneous orders, and stock-outs all delay maintenance throughput and increase equipment downtime
Increase maintenance throughput, maintain personnel utilization, reduce unneeded parts in pipeline or in storage
Potential 15% Cost Reduction (unneeded Parts)
Pre-Decisional Analysis and Data
21
Economic & Business Analysis - NorfolkBenefits Analysis Brief 11.18.09 HRA SCEA/INCOSE
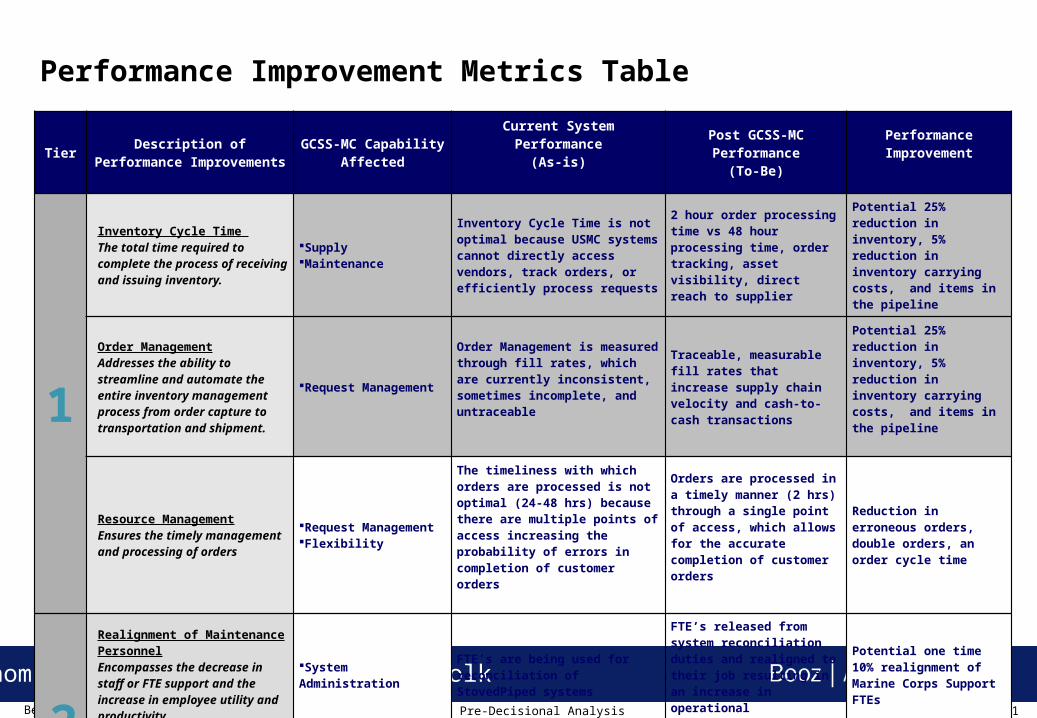
Performance Improvement Metrics Table
TierDescription of Performance
ImprovementsGCSS-MC Capability
Affected
Current System Performance(As-is)
Post GCSS-MCPerformance
(To-Be)
Performance Improvement
1
Inventory Cycle Time The total time required to complete the process of receiving and issuing inventory.
SupplyMaintenance
Inventory Cycle Time is not optimal because USMC systems cannot directly access vendors, track orders, or efficiently process requests
2 hour order processing time vs 48 hour processing time, order tracking, asset visibility, direct reach to supplier
Potential 25% reduction in inventory, 5% reduction in inventory carrying costs, and items in the pipeline
Order Management Addresses the ability to streamline and automate the entire inventory management process from order capture to transportation and shipment.
Request Management
Order Management is measured through fill rates, which are currently inconsistent, sometimes incomplete, and untraceable
Traceable, measurable fill rates that increase supply chain velocity and cash-to-cash transactions
Potential 25% reduction in inventory, 5% reduction in inventory carrying costs, and items in the pipeline
Resource ManagementEnsures the timely management and processing of orders
Request ManagementFlexibility
The timeliness with which orders are processed is not optimal (24-48 hrs) because there are multiple points of access increasing the probability of errors in completion of customer orders
Orders are processed in a timely manner (2 hrs) through a single point of access, which allows for the accurate completion of customer orders
Reduction in erroneous orders, double orders, an order cycle time
2
Realignment of Maintenance PersonnelEncompasses the decrease in staff or FTE support and the increase in employee utility and productivity
System AdministrationFTE’s are being used for reconciliation of StovedPiped systems
FTE’s released from system reconciliation duties and realigned to their job resulting in an increase in operational availability
Potential one time 10% realignment of Marine Corps Support FTEs
Procurement ImprovementIncludes the purchase of equipment, materials, software or hardware to support the logistics process
SupplyFinance
Four legacy systems, many ‘ungoverned’ systems, material handling equipment
Reduction in system and material handling equipment costs as a result of GCSS-MC implementation
Potential additional 5% Reduction in Material Handling Equipment Cost, and Systems Costs
Pre-Decisional Analysis and Data
22
Economic & Business Analysis - NorfolkBenefits Analysis Brief 11.18.09 HRA SCEA/INCOSE
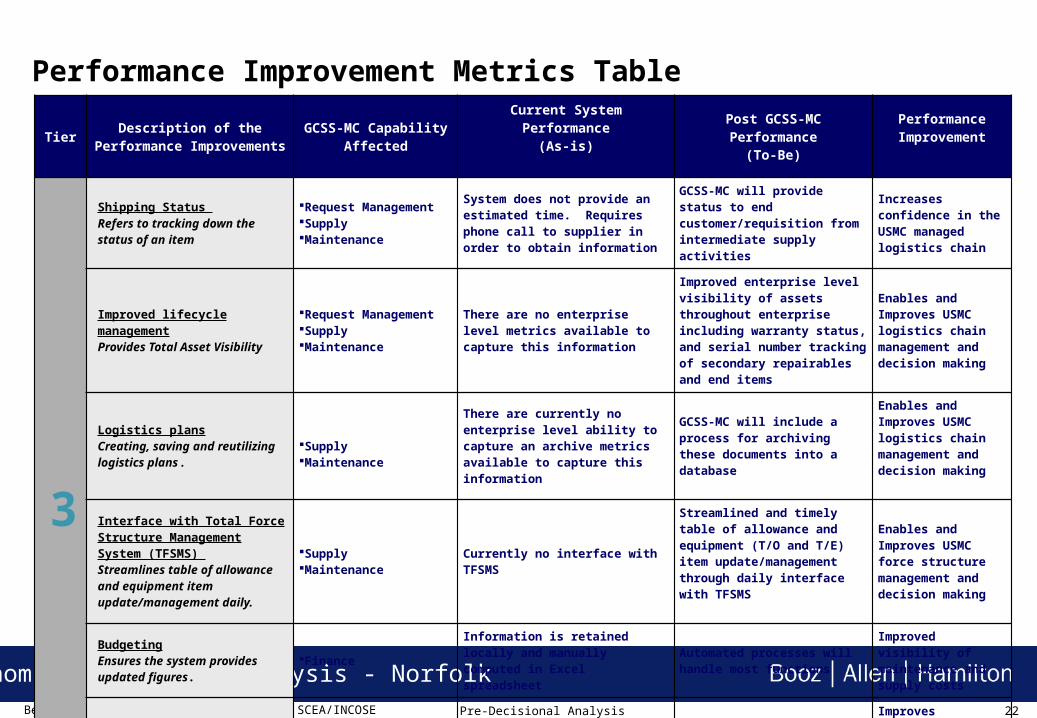
Performance Improvement Metrics Table
TierDescription of the
Performance ImprovementsGCSS-MC Capability
Affected
Current System Performance(As-is)
Post GCSS-MCPerformance
(To-Be)
Performance Improvement
3
Shipping Status Refers to tracking down the status of an item
Request ManagementSupplyMaintenance
System does not provide an estimated time. Requires phone call to supplier in order to obtain information
GCSS-MC will provide status to end customer/requisition from intermediate supply activities
Increases confidence in the USMC managed logistics chain
Improved lifecycle management Provides Total Asset Visibility
Request ManagementSupplyMaintenance
There are no enterprise level metrics available to capture this information
Improved enterprise level visibility of assets throughout enterprise including warranty status, and serial number tracking of secondary repairables and end items
Enables and Improves USMC logistics chain management and decision making
Logistics plans Creating, saving and reutilizing logistics plans .
SupplyMaintenance
There are currently no enterprise level ability to capture an archive metrics available to capture this information
GCSS-MC will include a process for archiving these documents into a database
Enables and Improves USMC logistics chain management and decision making
Interface with Total Force Structure Management System (TFSMS) Streamlines table of allowance and equipment item update/management daily.
SupplyMaintenance
Currently no interface with TFSMS
Streamlined and timely table of allowance and equipment (T/O and T/E) item update/management through daily interface with TFSMS
Enables and Improves USMC force structure management and decision making
Budgeting Ensures the system provides updated figures.
FinanceInformation is retained locally and manually computed in Excel spreadsheet
Automated processes will handle most functions
Improved visibility of maintenance and supply costs
RequirementsUSMC is subject to numerous DOD wide requirements which GCSS-MC will satisfy
•System Administration•Finance
USMC currently adapting to compliance requirements within current system constraints
Enhances USMC Compliancewith:
• JFIMP• SFIS• IUID
Improves processes Increases USMC credibility with internal and external resource reporting requirements
Pre-Decisional Analysis and Data
23
Economic & Business Analysis - NorfolkBenefits Analysis Brief 11.18.09 HRA SCEA/INCOSE
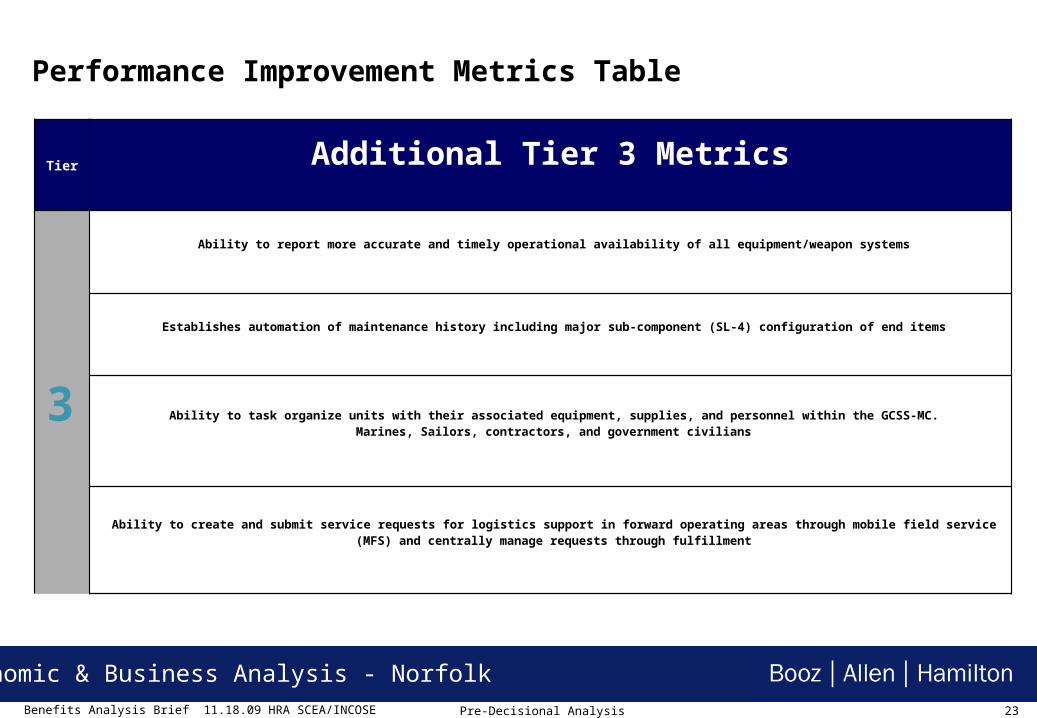
Performance Improvement Metrics Table
Tier Additional Tier 3 Metrics
3
Ability to report more accurate and timely operational availability of all equipment/weapon systems
Establishes automation of maintenance history including major sub-component (SL-4) configuration of end items
Ability to task organize units with their associated equipment, supplies, and personnel within the GCSS-MC.Marines, Sailors, contractors, and government civilians
Ability to create and submit service requests for logistics support in forward operating areas through mobile field service (MFS) and centrally manage requests through fulfillment
Pre-Decisional Analysis and Data

24
Economic & Business Analysis - NorfolkBenefits Analysis Brief 11.18.09 HRA SCEA/INCOSE
($300.000)
($200.000)
($100.000)
$0.000
$100.000
$200.000
$300.000
$400.000
$500.000
$600.000
$700.000
2010 2011 2012 2013 2014 2015 2016 2017 2018 2019 2020 2021 2022 2023
GCSS-MCBlock I Cumulative Net Benefits vs Yearly Program Investment
Yearly Program Investment
Cumulative Net Benefits
Then-Year $ (Discounted)
EA Results - Block I ROI calculated using the Program’s LCCE
Benefits Based on Total Block I (Release 1.1 + Release 1.2)– PV of Benefits: $1,219.07M– PV of Costs: $603.87M– Benefit Cost Ratio: 2.02– ROI: 3.40
Break Even at 2014
Pre-Decisional Analysis and Data

25
Economic & Business Analysis - NorfolkBenefits Analysis Brief 11.18.09 HRA SCEA/INCOSE
Top Ten Benefits
$53M IT Direct Cost Savings
$273.4M Inventory Reduction
$797.4M Inventory Carrying Cost (ICC) Reduction
$191.6M Repair Part Reduction
$196.9M MLDT Reduction (Asset Value Recapture & Availability)
Expanded User Base - GCSS will expand user base to approximately 40 percent of 57,000 potential users
Improved readiness
Enables compliance
Expanded Capability
USMC Integration with Joint Chiefs of Staff Joint Integrated Capabilities (JIC) Joint Attributes for Logistics Chain Management (LCM)
Pre-Decisional Analysis and Data
26
Economic & Business Analysis - NorfolkBenefits Analysis Brief 11.18.09 HRA SCEA/INCOSE
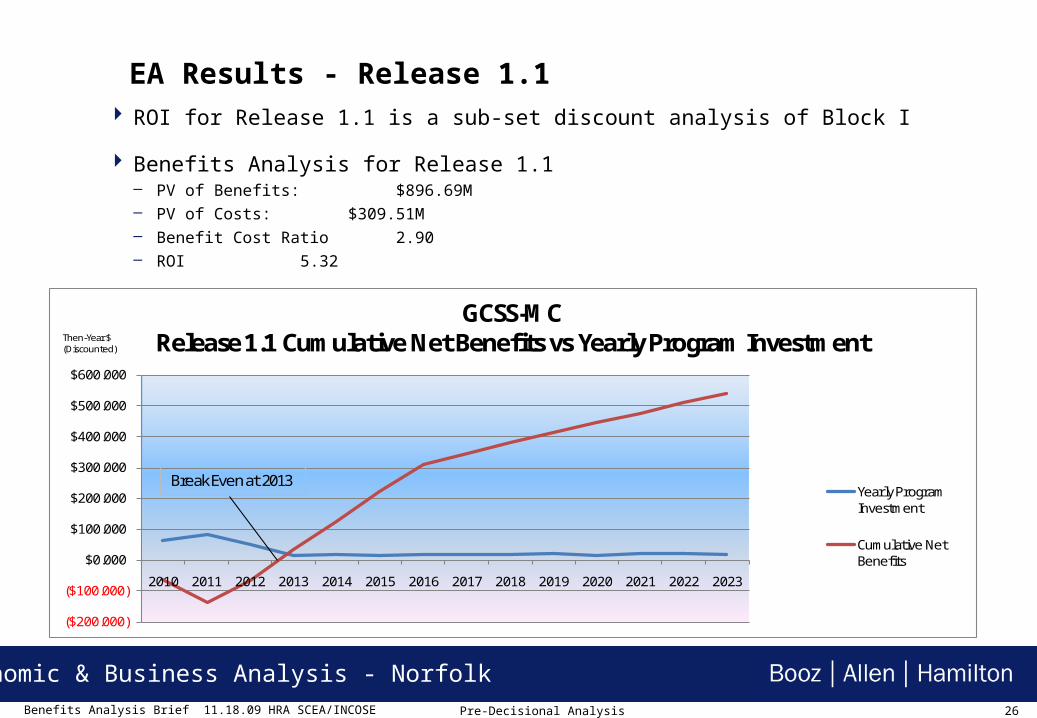
EA Results - Release 1.1 ROI for Release 1.1 is a sub-set discount analysis of Block I
Benefits Analysis for Release 1.1– PV of Benefits: $896.69M– PV of Costs: $309.51M– Benefit Cost Ratio 2.90– ROI 5.32
($200.000)
($100.000)
$0.000
$100.000
$200.000
$300.000
$400.000
$500.000
$600.000
2010 2011 2012 2013 2014 2015 2016 2017 2018 2019 2020 2021 2022 2023
GCSS-MCRelease 1.1 Cumulative Net Benefits vs Yearly Program Investment
Yearly Program Investment
Cumulative Net Benefits
Break Even at 2013
Then-Year $ (Discounted)
Pre-Decisional Analysis and Data

27
Economic & Business Analysis - NorfolkBenefits Analysis Brief 11.18.09 HRA SCEA/INCOSE
($140.000)
($120.000)
($100.000)
($80.000)
($60.000)
($40.000)
($20.000)
$0.000
$20.000
$40.000
$60.000
$80.000
2010 2011 2012 2013 2014 2015 2016 2017 2018 2019 2020 2021 2022 2023
GCSS-MCRelease 1.2 Cumulative Net Benefits vs Yearly Program
Investment
Yearly Program Investment
Cumulative Net Benefits
Break Even at 2019
Then-Year $ (Discounted)
EA Results - Release 1.2
ROI for Release 1.2 is a sub-set discount analysis of Block I
Benefits Analysis for Release 1.2– PV of Benefits: $317.50M– PV of Costs: $293.94M– Benefit Cost Ratio 1.08– ROI 1.20
Pre-Decisional Analysis and Data

28
Economic & Business Analysis - NorfolkBenefits Analysis Brief 11.18.09 HRA SCEA/INCOSE
Direct Cost Savings
$53M IT Cost Savings– After Release 1.2 FOC (FY13), the four legacy systems will be phased out– Approximately $4.5 Million per year after legacy system phase-out – Assume legacy costs will not increase annually due to long term maintainability issues– Researching potential SQ investment and increased sustainment costs due to SW and HW
obsolescence– Initial cost savings are typically negative
Pre-Decisional Analysis and Data
29
Economic & Business Analysis - NorfolkBenefits Analysis Brief 11.18.09 HRA SCEA/INCOSE
Inventory Reduction
$273.4M Inventory Reduction– USMC Class IX inventory estimated at $1.2 Billion– Block I one-time inventory reduction (IR) draw-down estimated between 15% and 25%*– Used 20% figure in PIMT analysis– One time drawdown of inventory for this analysis is spread across the first 5 years after FOC– Inventory is shown to be 90% within the Enterprise, and 10% Deployed – Release 1.1 IR estimate for the ROI is $189.83 Million; Release 1.2 IR Estimate $53.54
Million
*Based on proprietary BAH industry studies and USMC I&L Business Case
Pre-Decisional Analysis and Data

30
Economic & Business Analysis - NorfolkBenefits Analysis Brief 11.18.09 HRA SCEA/INCOSE
Class IX Secondary Repairables Inventory by Location (wholesale & retail)*
Percent Distribution
Location Quantity Cost Quantity Dollar Value
LOGCOM 106,129.30 $702,408,282.91 58.95% 57.72%
Deployed 17,810.80 $119,144,713.19 9.89% 9.79%
Camp Pendleton 14,012.14 $103,607,173.43 7.78% 8.51%
Camp Lejeune 11,546.97 $84,890,792.23 6.41% 6.98%
Okinawa Hawaii 13,811.82 $83,823,358.27 7.67% 6.89%
MFR 7,562.94 $65,063,257.12 4.20% 5.35%
BIC 4,596.96 $25,544,323.91 2.55% 2.10%
29 Palms 2,384.44 $17,215,849.77 1.32% 1.41%
Quantico 2,113.86 $13,695,195.53 1.17% 1.13%
ILC Cycle 68.77 $1,468,656.88 0.04% 0.12%
Total 180,038.00 $1,216,861,603.25 100.00% 100.00%
Inventory Reduction
*Based on proprietary BAH industry studies and USMC I&L Business Case
Pre-Decisional Analysis and Data

31
Economic & Business Analysis - NorfolkBenefits Analysis Brief 11.18.09 HRA SCEA/INCOSE
Inventory Reduction by Release
Pre-Decisional Analysis and Data
Reduction in Class IX Inventory
Inventory Benefit Distribution
100% 78% 22%
FOC 2012 FOC 2013
Block 1 Release 1.1 Release 1.2
Inventory Dollar Value$1,216.9 Million $949.2 Million $267.7 Million
20% Inventory Reduction$243.4 Million $189.8 Million $53.5 Million
Numbers may not add due to rounding
Annual Benefit Over Each of First 5 Years After FOC $48.7 Million $38.00 Million $10.7 Million

32
Economic & Business Analysis - NorfolkBenefits Analysis Brief 11.18.09 HRA SCEA/INCOSE
Inventory Carrying Costs Reduction
$797.4M Inventory Carrying Cost (ICC) Reduction– Inventory Carrying Cost (ICC) factor is 25% of inventory reduction value. ICC is a recurring
cost avoidance that will be used to write down the future investment– Release 1.1 ICC estimate $47.6M; Release 1.2 ICC Estimate $13.39M– ICC avoidance will occur every year after FOC
Pre-Decisional Analysis and Data
33
Economic & Business Analysis - NorfolkBenefits Analysis Brief 11.18.09 HRA SCEA/INCOSE
Inventory Carrying Costs Reduction
Pre-Decisional Analysis and Data
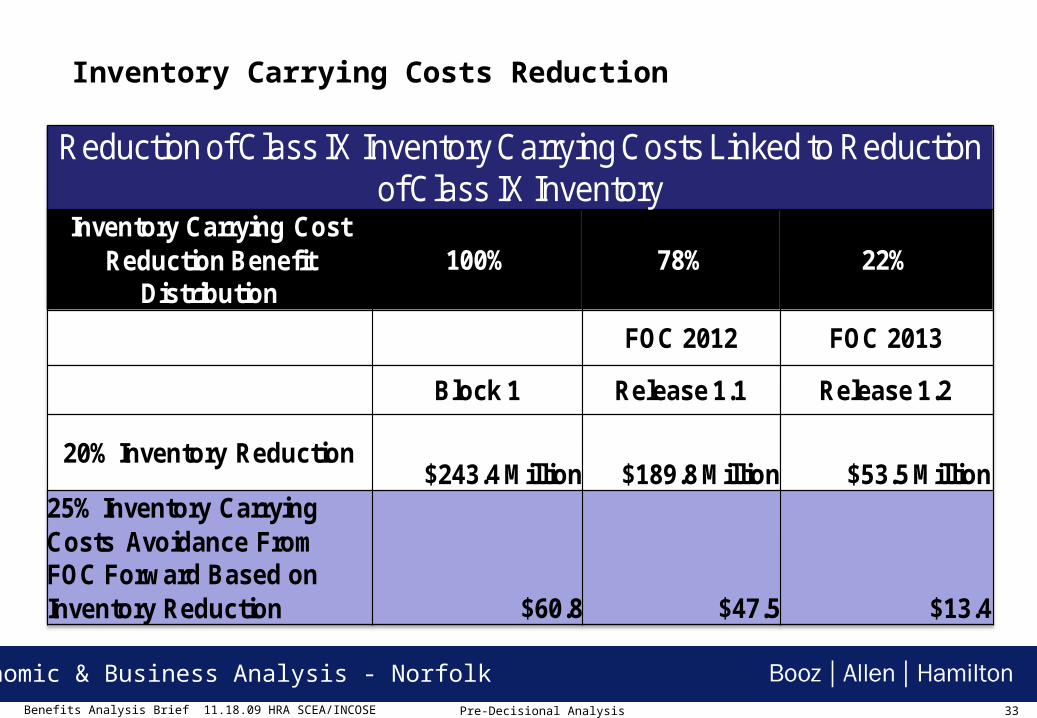
Reduction of Class IX Inventory Carrying Costs Linked to Reduction of Class IX Inventory
Inventory Carrying Cost Reduction Benefit
Distribution100% 78% 22%
FOC 2012 FOC 2013
Block 1 Release 1.1 Release 1.2
20% Inventory Reduction$243.4 Million $189.8 Million $53.5 Million
25% Inventory Carrying Costs Avoidance From FOC Forward Based on Inventory Reduction $60.8 $47.5 $13.4

34
Economic & Business Analysis - NorfolkBenefits Analysis Brief 11.18.09 HRA SCEA/INCOSE
Repair Part Reduction
$191.6M Repair Part Reduction– Analyzed SOE maintenance transactions for the period FY 2007 thru April 2009– 37,480 unique consumable NSNs from maintenance transactions representing 335,648
appearances in 87,500 Equipment Repair Orders (ERO)– 626,677 parts were required, but 948,020 were ordered valued at approximately $551.7
Million – Difference of 321,343 “over-ordered” parts for the period of analysis is valued at
approximately $36.5 Million – Annualized adjustment for the period of analysis indicates that approximately 128,537
extra parts were ordered, valued at $14.6 Million per year, every year– Annual Benefit for Release 1.1 is $11.4M and Release 1.2 is $3.22M– Cost avoidance will occur every year after FOC
Pre-Decisional Analysis and Data
35
Economic & Business Analysis - NorfolkBenefits Analysis Brief 11.18.09 HRA SCEA/INCOSE
Repair Part Reduction
Pre-Decisional Analysis and Data
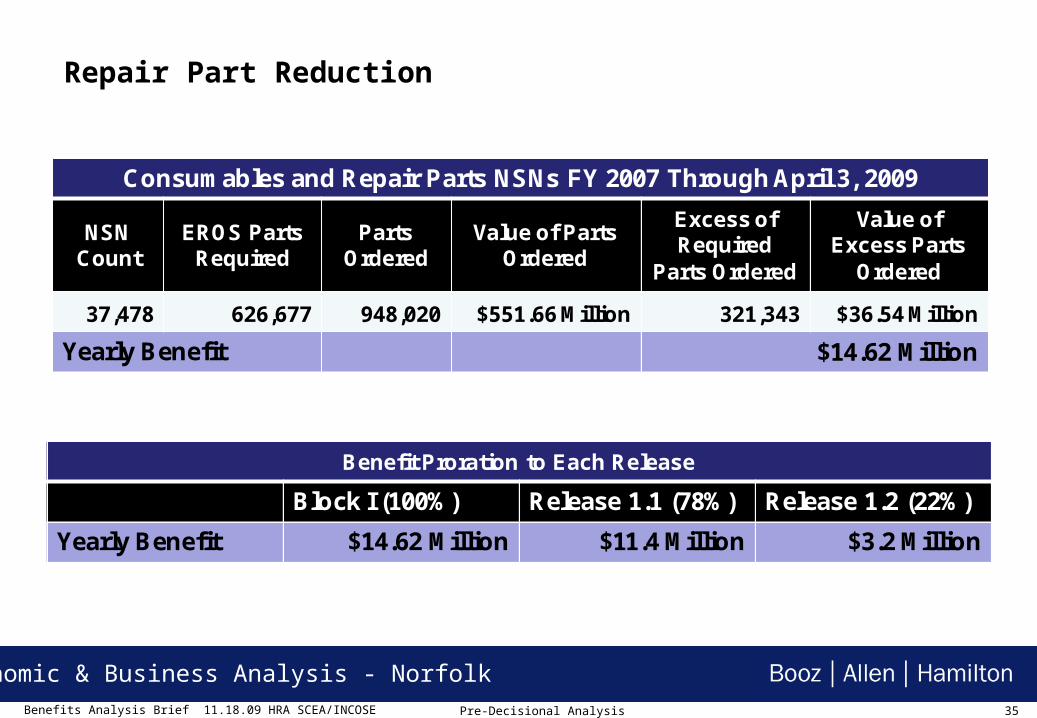
Consumables and Repair Parts NSNs FY 2007 Through April 3, 2009
NSN Count
EROS Parts Required
Parts Ordered
Value of Parts Ordered
Excess ofRequired
Parts Ordered
Value of Excess Parts
Ordered
37,478 626,677 948,020 $551.66 Million 321,343 $36.54 Million
Yearly Benefit $14.62 Million
Benefit Proration to Each Release
Block I (100%) Release 1.1 (78%) Release 1.2 (22%)
Yearly Benefit $14.62 Million $11.4 Million $3.2 Million
36
Economic & Business Analysis - NorfolkBenefits Analysis Brief 11.18.09 HRA SCEA/INCOSE
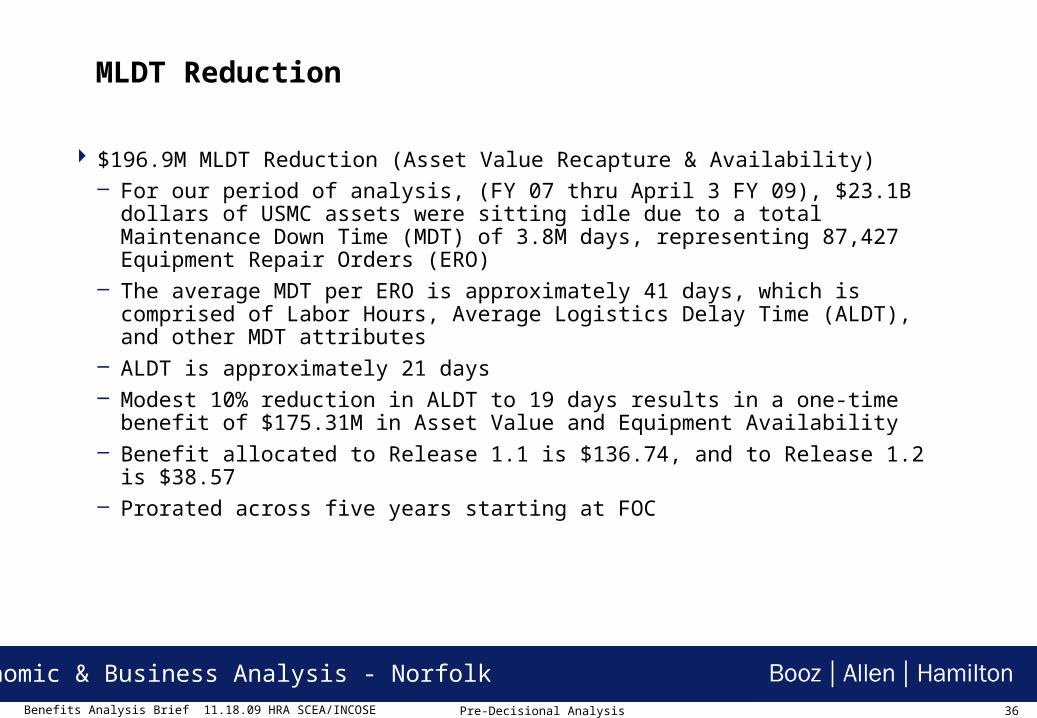
MLDT Reduction
$196.9M MLDT Reduction (Asset Value Recapture & Availability)– For our period of analysis, (FY 07 thru April 3 FY 09), $23.1B dollars of USMC assets
were sitting idle due to a total Maintenance Down Time (MDT) of 3.8M days, representing 87,427 Equipment Repair Orders (ERO)
– The average MDT per ERO is approximately 41 days, which is comprised of Labor Hours, Average Logistics Delay Time (ALDT), and other MDT attributes
– ALDT is approximately 21 days– Modest 10% reduction in ALDT to 19 days results in a one-time benefit of $175.31M in
Asset Value and Equipment Availability– Benefit allocated to Release 1.1 is $136.74, and to Release 1.2 is $38.57– Prorated across five years starting at FOC
Pre-Decisional Analysis and Data

37
Economic & Business Analysis - NorfolkBenefits Analysis Brief 11.18.09 HRA SCEA/INCOSE
MLDT Reduction
Pre-Decisional Analysis and Data
Value of USMC Asset-Availability and Use Loss Due to Maintenance Down Time as Related to Average Logistics Response Time (LRT)
Data Element2.5 FiscalYear’s Data
10% Reduction in Average LRT
Total Number of EROs Analyzed in 2.5 Fiscal Years
FY 2007 thru 1/2 FY 2009 (April 3, 2009) 87,427
All numbers are rounded
EROs Total $ Asset Value in 2.5 Fiscal Years$23,105.125 Million
MDT Total Days3.794 Million
Average asset value in MDT per Day$6,090
Average LRT in Days per EROX 21.14 19
Average Total Value of Assets Unavailable to the USMC for Each ERO due to Average Logistics Response Time (LRT) = $128,730 $115,857
Average Annualized Loss per Fiscal Year/2.5 = $51,492 $46,343
Fiscal Year Annualized Adjusted Average Number ofEROs X 34,047 34,047 Average Estimated Total Asset Value Use-Loss to the USMC for a Fiscal Year that’s Related to Avg. LRT $1,753.143 Million $1,577.829 Million
Release: 1.1 (78%) 1.2 (22%) Block I (100%)
Reduction in Asset Value Loss ($35.1 Million per year benefit each of first 5 years after FOC) $27.4 Million $7.7 Million $35.1 Million
Total One-Time Benefit (annualized delta) $136.7 Million $38.6 Million $175.3 Million

38
Economic & Business Analysis - NorfolkBenefits Analysis Brief 11.18.09 HRA SCEA/INCOSE
User Base Expansion
Expanded user base should increase supply chain velocity through greater user access, increased order accuracy and increased transaction speed.
Current legacy system user base is approximately 13,000
GCSS will potentially expand user base to approximately 56,965
There is no reduction in FTEs resulting from implementation of GCSS-MC.
Pre-Decisional Analysis and Data

39
Economic & Business Analysis - NorfolkBenefits Analysis Brief 11.18.09 HRA SCEA/INCOSE
Readiness and Compliance
Readiness– Improved visibility of assets throughout enterprise including warranty status, and serial
number tracking of secondary repairables and end items– Inventory posture and readiness is visible throughout enterprise allowing for improved
resource allocation and optimal stockage at wholesale, retail and consumer level– Establishes automation of maintenance history including major sub-component (SL-4)
configuration of end items
Compliance– Enables USMC to comply with Joint Financial Management Improvement Program
requirements– Enables USMC to comply with SFIS requirements– Enables USMC to comply with IUID requirements
Pre-Decisional Analysis and Data
40
Economic & Business Analysis - NorfolkBenefits Analysis Brief 11.18.09 HRA SCEA/INCOSE
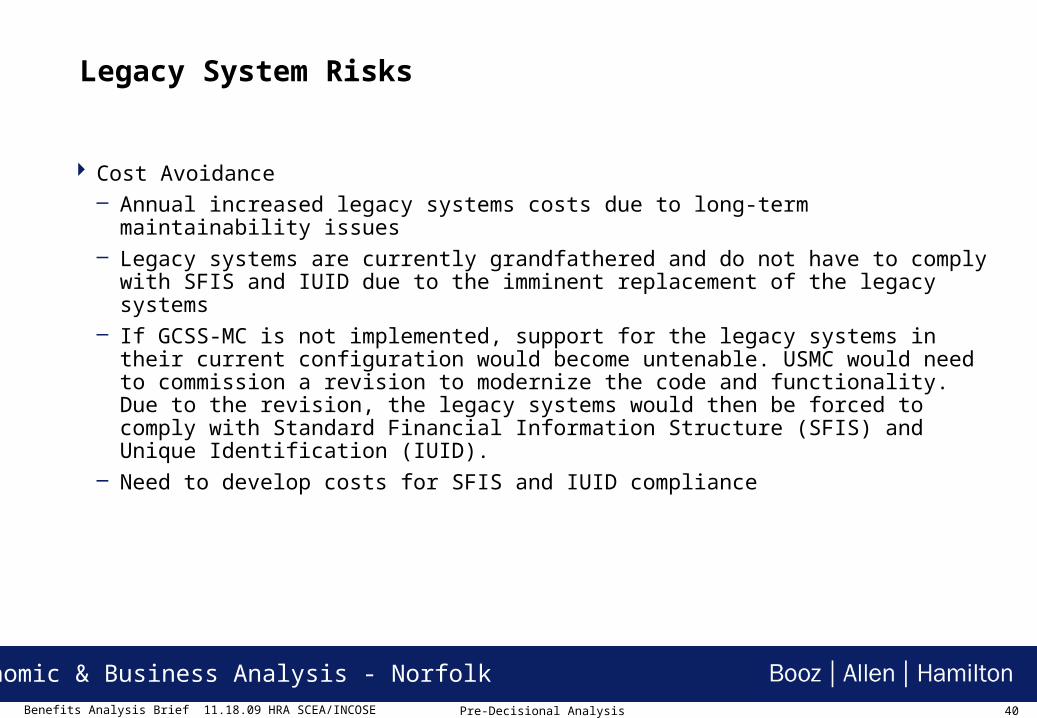
Legacy System Risks
Cost Avoidance– Annual increased legacy systems costs due to long-term maintainability issues– Legacy systems are currently grandfathered and do not have to comply with SFIS and IUID
due to the imminent replacement of the legacy systems– If GCSS-MC is not implemented, support for the legacy systems in their current
configuration would become untenable. USMC would need to commission a revision to modernize the code and functionality. Due to the revision, the legacy systems would then be forced to comply with Standard Financial Information Structure (SFIS) and Unique Identification (IUID).
– Need to develop costs for SFIS and IUID compliance
Pre-Decisional Analysis and Data

41
Economic & Business Analysis - NorfolkBenefits Analysis Brief 11.18.09 HRA SCEA/INCOSE
Additional Capability
Expanded Capability– Ability to report more accurate and timely operational availability of all equipment/weapon
systems– Ability to create, save, and reutilize logistics plans and bills of material for TEEP events and
real world operations– Ability to task organize units with their associated equipment, supplies, and personnel within
the GCSS-MC– Streamlined and timely table of allowance and equipment (T/O and T/E) item
update/management through daily interface with TFSMS– Streamlined budgeting, improved visibility of maintenance costs, ability to establish financial
responsibility at any echelon
Pre-Decisional Analysis and Data

42
Economic & Business Analysis - Norfolk42
Balance Scorecard Attributes(% = Attribute Weight)
USMC LogisticsBalancedScorecard
USMC LogisticsBalancedScorecard
Assets
Asset Utilization
(Internal Efficiency)
Reliability
Quality Order Fulfillment
(Internal Effectiveness)
Readiness
Operational Availability
(External Effectiveness)
Flexibility
Logistics Chain Capacity
(Internal Effectiveness)
Expenses
Total Logistics Chain Expense
(Internal Efficiency)
Responsiveness
Total Logistics Chain Cycle Time
(External Effectiveness)
Logistics Measures of EffectivenessLogistics Measures of EffectivenessLogistics Measures of EffectivenessC
ust
om
erP
roce
s sR
esou
rces
25%
10%
20%
20%
15%
10%

43
Economic & Business Analysis - NorfolkBenefits Analysis Brief 11.18.09 HRA SCEA/INCOSE
43
Attribute: Readiness The Tier 1 performance metric for Readiness is Operational Availability, measured through
lower-tier metrics with the following formula and illustrated in the figure below:
Operational Availability =
___________Uptime__________
Uptime + TTR + SRT + DART
Availab ilitydue to
M aintenance(TTR )
Availab ilitydue toSupply(SR T)
Availab ilitydue to
D istribution and Adm inD elay T im e (D AR T)
O perationalAva ilab ility
44
Economic & Business Analysis - NorfolkBenefits Analysis Brief 11.18.09 HRA SCEA/INCOSE
44
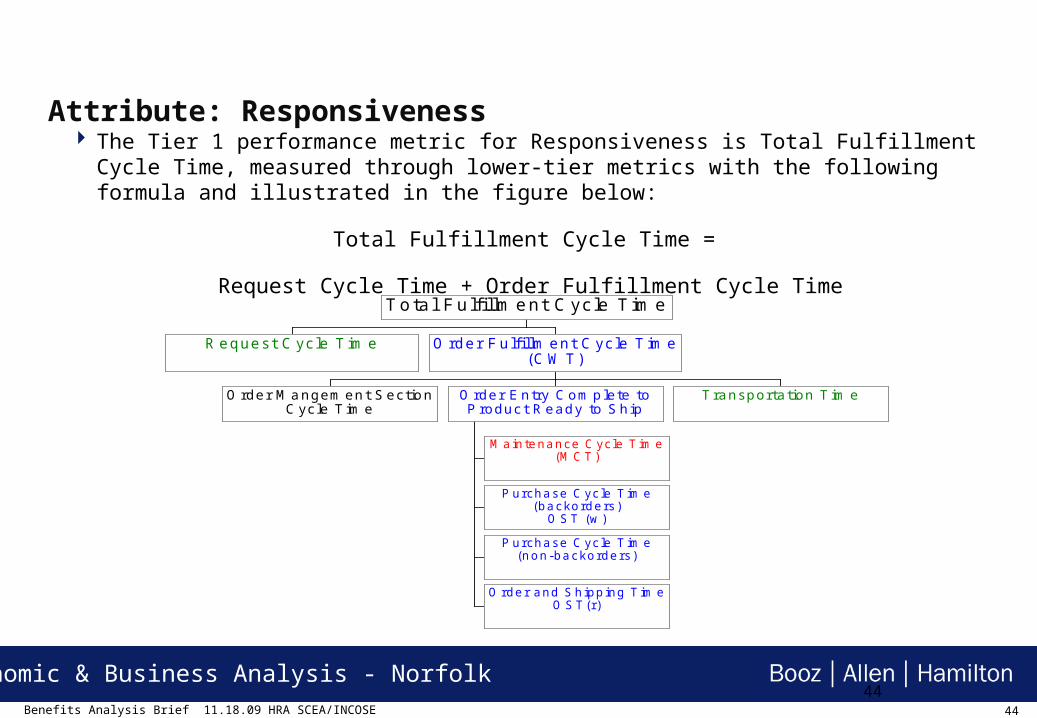
Attribute: Responsiveness The Tier 1 performance metric for Responsiveness is Total Fulfillment Cycle Time, measured
through lower-tier metrics with the following formula and illustrated in the figure below:
Total Fulfillment Cycle Time =
Request Cycle Time + Order Fulfillment Cycle Time
R equest C yc le T im e
Order M angem ent SectionCycle T im e
M aintenance C ycle T im e(M C T)
Purchase C ycle T im e(backorders)
O ST (w )
Purchase C ycle T im e(non-backorders)
O rder and Shipping T im eO ST(r)
Order Entry Com plete toProduct Ready to Ship
Transportation T im e
O rder Fulfillm ent C ycle T im e(C W T)
Total Fulfillm ent Cycle Tim e

45
Economic & Business Analysis - NorfolkBenefits Analysis Brief 11.18.09 HRA SCEA/INCOSE
45
Attribute: Reliability
The Tier 1 performance metric for Reliability is Quality Order Fulfillment, measured through lower-tier metrics with the following formula and illustrated in the figure below:
Quality Order Fulfillment =
[# Repair Orders X %QOF (Maintenance)] + [# Requisitions X %QOF (Supply)]
(# Repair Orders) + (# Requisitions)
O rder deliveredcom ple te
m aintenance
R epairedby agreedupon date
Quality order fufi llm entm aintenance/D istribution
O rder deliveredcom ple te
supply
O rder deliveredby agreed
updon date
Quality order fulfillm entSupply/D istribution
Q uality O rder Fulfillm ent

46
Economic & Business Analysis - NorfolkBenefits Analysis Brief 11.18.09 HRA SCEA/INCOSE
46
Attribute: Flexibility
Flexibility is measured with the Tier 2 metric Fulfillment Capacity, which is the highest-level metric used to measure logistics chain capacity. Fulfillment capacity is measured through lower-tier metrics through the following equation and as illustrated in the figure below:
Fulfillment Capacity =
Upside Make Capacity + Upside Warehouse Capacity + Upside Purchase Capacity + Upside Transportation Capacity
Upside M akeCapacity
U pside W arehouseSpace C apacity
U pside PersonnelC apacity
Upside W arehouseCapacity
Upside P urchaseCapacity
Upside TransportationCapacity
Fulfillm ent Capacity

47
Economic & Business Analysis - NorfolkBenefits Analysis Brief 11.18.09 HRA SCEA/INCOSE
47
Attribute: Expense
The Tier 1 performance metric for Expense is Total Logistics Expense, measured through lower-tier metrics with the following formula and illustrated in the figure below:
Total Logistics Expense =
Total Maintenance Expense + Total Supply Expense + Total Distribution Expense
TotalM aintenance
Expense
TotalSupply
Expense
TotalT ransportation
Expense
T ota l Logis tic sExpense

48
Economic & Business Analysis - NorfolkBenefits Analysis Brief 11.18.09 HRA SCEA/INCOSE
48
Attribute: Asset Utilization The Tier 1 performance metric for Asset Utilization is Asset Utilization, measured through
lower-tier metrics with the following formula and illustrated in the figure below:
Asset Utilization =
(Maintenance Asset Utilization, Supply Asset Utilization, Transportation Asset Utilization)
M aintenancePersonnelU tilization
M aintenanceSpace
U tilization
M aintenanceEquipm entU tilization
M aintenanceAsset
U tilization
SupplyPersonnelM anning
SupplyPersonnel
T im e
SupplyPersonnelU tilization
W arehouseSpace
U tilization
InventoryAsset
U tilization
SupplyAsset
U tilization
TransportationPersonnelU tilization
TransportationEquipm entU tilization
TransportationAsset
U tilization
Asset U tilization

49
Economic & Business Analysis - NorfolkBenefits Analysis Brief 11.18.09 HRA SCEA/INCOSE
Way Forward
Expanded Risk Analysis
Life Cycle Return on Investment Analysis
Optimized Benefits Relative to Cost
Post Investment Analysis
Pre-Decisional Analysis and Data

50
Economic & Business Analysis - NorfolkBenefits Analysis Brief 11.18.09 HRA SCEA/INCOSE
Agenda
Introduction
Similarities/Differences in Benefits Analysis Approach vs. Cost Analysis
Tiered Approach
Example
References
Pre-Decisional Analysis and Data

51
Economic & Business Analysis - NorfolkBenefits Analysis Brief 11.18.09 HRA SCEA/INCOSE
References DFAS ROI Calculator; www.dfas.mil/technology/pal/ssps/slc/roinpvcomputation.xls
Department of the Army - Economic Analysis Manual; www.asafm.army.mil/pubs/cdfs/manual/economic.pdf
DoD Automated Information Systems Economic Analysis Guide – 1995; http://www.ncca.navy.mil/resources/DoD_AIS_EA_Guide_1995_DRAFT_RCW.pdf
Analysis of Alternatives (AoA) Handbook: Practical Guide to Analyses of Alternatives, July 2008, Office of Aerospace Studies, Air Force Materiel Command (AFMC) OAS/A9,1655 1st Street SE, Kirtland AFB, NM 87117-5522; http://www.oas.kirtland.af.mil/
Benchmarking Cost Savings & Cost Avoidance - NASPO BENCHMARKING WORKGROUP Research Brief September 2007; http://www.naspo.org/old_site/whitepapers/documents/BenchmarkingCostSavingsandCostAvoidance.pdf
There are many more resources, but these are a good start.
Pre-Decisional Analysis and Data

52
Economic & Business Analysis - NorfolkBenefits Analysis Brief 11.18.09 HRA SCEA/INCOSE
Paul Gvoth Associate
Booz | Allen | Hamilton Suite 400 5800 Lake Wright Drive Norfolk, VA 23502 Mobile (757) 646-4762 [email protected]
Paul Gvoth Associate
Booz | Allen | Hamilton Suite 400 5800 Lake Wright Drive Norfolk, VA 23502 Mobile (757) 646-4762 [email protected]
Pre-Decisional Analysis and Data