Embed Size (px)
Citation preview
Paul Deram April 8, 2011 Justin Dougherty Laura Gilbert Guillaume Lamoureux
Scheduling and Modelling of a Cranberry Liqueur Plant
Design 3 Project
Table of Contents Executive summary ................................................................................................................................... 3
Introduction ................................................................................................................................................. 3
Raw Materials .............................................................................................................................................. 4
Delivery ..................................................................................................................................................... 4
Ingredients ............................................................................................................................................... 5
Machines ........................................................................................................................................................ 5
Masher........................................................................................................................................................ 5
Press ............................................................................................................................................................ 5
Mixing Tank ............................................................................................................................................. 6
Fermentation Vat .................................................................................................................................. 6
Filter ............................................................................................................................................................ 6
Bottling ...................................................................................................................................................... 6
Capping ...................................................................................................................................................... 7
Labeling ..................................................................................................................................................... 7
Other ........................................................................................................................................................... 7
Scheduling ..................................................................................................................................................... 7
Flowchart ....................................................................................................................................................... 8
Fermentation ............................................................................................................................................... 8
Fermentation Model Literature ...................................................................................................... 8
Designed Fermentation Model ..................................................................................................... 12
Feasibility ................................................................................................................................................... 15
Annual Revenue .................................................................................................................................. 15
Variable Costs ...................................................................................................................................... 15
Table 3 – Variable Costs Generated by Production of 1Million Liters of Liqueur ......................................................................................................................................................................... 15
Table 4 – Annual Fixed Costs ......................................................................................................... 16
Table 5 – Yearly Expected Profit When Operation at Full Production Rate ....... 16
Table 6 – Provincial and Federal Tax Rates .......................................................................... 17
Table 7 – Initial Investment ........................................................................................................... 17
Table 8 – Prices of Raw Materials per Unit with a 30% Production Rate ............ 18
Table 9 – Annual Cost of Production for the First 8 Years ............................................ 18
Conclusion .................................................................................................................................................. 21
Bibliography .............................................................................................................................................. 21
Appendix 1 – Reference Table for Rates and Prices of Material ......................................... 22
Appendix 2 – design3.m ....................................................................................................................... 23
Appendix 3 – Design_Liqueur.m ....................................................................................................... 26
Appendix 4 – Cranberry Liqueur Production: Feasibility of a Large Scale Production Plant .............................................................................................................................................................. 29
Executive summary Cranberries and liqueurs are a highly consumed product in the Quebec
market; however, the two have not yet been combined into a single entity. Following our previous design paper, the production of cranberry liqueur through alcoholic fermentation was deemed feasible on 1) an economical 2) a general conceptualization of the process and 3) a study of target markets; we decided to focus on the process line in more depth, with particular attention given to the fermentation process. A model of this process was created, as well as a detailed report of the required machinery for a successful industrial alcoholic operation.
Introduction The design aspect of this paper builds upon the previous work written for
Design II, in which we attempted to judge the feasibility and designing the elements required to operate a cranberry liqueur production plant. All previous work and analysis is assumed to be correct and relevant, in order to continue with the project. The economic feasibility study will be updated afterwards, in order to check for its validity.
The Design II report explains that choosing fermentation over maceration of the fruit is more feasible, thus our operation concentrates solely on the fermentation process. It was also shown that fermentation gives more leeway for expansion and is a more versatile process. Being able to diversify the production line is a major factor in the construction of an alcohol producing plant, since the operating time of the plant suffers through long periods (4 months of fermentation and close to 7 months of maceration) in which very little happens.
The overall yearly production will be looked into (1 Million Litres), as opposed to the production of 1000 L described in the previous paper. 1 Million liters was decided upon because it would correlate to 1% of the total market of liqueurs in North America, but could easily be expanded upon or reduced to fulfill the needs of the producing company. Recommendations were made regarding the handling of waste and the efficiency of production in the previous study and thus will not be looked into for the scope of this project; they are assumed to be valid and implemented in the process.
This Design III project focuses therefore on the simulation of the implementation of a mass-production process of cranberry liqueur through fermentation, in Quebec. Machines will be selected for each step of the industrial process described in the Design II paper, sized based on the final required capacity of 1 Million liters. No considerations will be made regarding the construction of the infrastructure required to house such an industrial process, such as building requirements and standards. Finally, the fermentation process will be modeled in more detail, since it is the only non-linear process in the production line, as well as the most important step in the production of good quality cranberry liqueurs. The recipe and yeasts are assumed to produce a high quality alcoholic taste for the product, which will be widely accepted by our target consumers.
Raw Materials A liqueur is described by French law as an alcoholic beverage containing
more than 100 grams of sugar per liter and an alcohol content between 15 and 25%. In this case, for 1000L of cranberry liqueur it will contain 300kg of sugar and 23% alcohol content per volume. The recipe used to make the cranberry liqueur is a simple one that might require refinement for added taste.
Cost reduction could be done by being able to produce the pure alcohol in the production plant instead of purchasing it from an external supplier. This would come with its own risks yet could be cost saving solution.
Delivery Only fresh cranberries will be used for the liqueur production. Considering that cranberries are harvested in September and October each year, all of the fruit needed for production will be coming in during this time.
Knowing that it takes 11000 kg of cranberries to make 1000L and that our end goal production is 1 million liters, 1100 tonnes of cranberries will be used yearly. Given a density of cranberries of 0.5g/cm3 and the volume of a truck being 150m3, the maximum carrying capacity of a truck filled with cranberries is 75 tonnes. Unfortunately, according to Quebec’s Highway Safety Code, no truck carrying a load of more than 55 tonnes is allowed on Quebec highways. The production is therefore limited by Quebec’s regulations. Given these numbers, twenty trucks of cranberries at a maximum capacity of 55 tonnes will be needed. This represents one truck per business day for 4 weeks during the harvest period. During transport, fruits can become damaged due to compaction. Since all the cranberries will be turned to juice, there is no need to remove the damaged ones and we can therefore assume that all the fruits coming in will be used in the process.
The timing of the arrival of the cranberries will be the limiting factor for the process. Therefore all other ingredients should arrive before the cranberries. Since
the other ingredients (sugar, yeast and alcohol) can all be stored at room temperature, this will not be an issue.
Ingredients The table below displays the ingredients required for the production of 1000L of liqueur. Ingredients will be added at different steps in the production. For more information on the process, refer to the flowchart.
Table 1 – Raw Materials per 1000L of Liqueur Produced
Since yeast is expensive, it is purchased in small quantities and then bred in tanks. The inoculum is the mixture containing the yeast. Depending on the length of fermentation, the inoculum should represent from 1 to 5% of the volume being fermented. For the conditions at hand, 2% was appropriate, with a 12.5% yeast content by weight of inoculum.
Machines
Masher The first machine that the raw cranberries will go through is the masher.
This is responsible for mashing or grinding up the raw cranberries. As the cranberries are already of a small individual size and there isn’t a necessary size to have them for the next part of the process. This is just to break them apart so that surface area will be generally increased to be able to maximise the efficiency of the next machine. There would be a need to have 2 of these machines at a production rate of 4.2 tonnes an hour to be able to handle the total amount of raw cranberries that would be needed to be process all 55 tonnes of raw cranberries that are received per day. The machine listing can be found in the bibliography for this machine and all the machines.
Press A machine that works on the basics that if force is applied to a fruit from one
side and the other side is a small membrane there will be juice. Like the masher there would need to be 2 of these machines that can handle 4.2 tonnes per hour. The press would work under an efficiency of 70%. This would lead to 3.85 tonnes of
Ingredients Rate (per 1000L of Liqueur) Entry Point Cranberries 11000 kg Masher Sugar 7.31 kg
269.53 kg Mixing Rectification
Inoculum 2% of volume, 20L Mixing Yeast 12.5% of inoculum, 2.5 kg Mixing 95% Alcohol 104.36 L Rectification
juice per hours with 1.65 tonnes of waste. The juice would be sent to the mixing tank whereas the waste would be sent to be composted.
Mixing Tank A tank is needed to be able to hold all the cranberry juice along with the
added yeast and sugar, which come out to 39.46 cubic meters per day. The same tank has to be able to agitate the solution to obtain a homogenous mixture before placing in the fermentation vats. This would be done as a bulk process at certain points in the day. The tanks were designed to be able to hold the 50 cubic meters. This is above the 39.46 cubic meters needed for the day of production. This is so that the reclarification process can also take place in the same tanks. The reclarification process would add 10.924 tonnes per day along with 4 118 liters of 95% alcohol. The agitation will be from a simple stirrer with a blade from the middle. This will provide enough agitation for the amount of sugar and yeast.
Fermentation Vat The tanks for fermentation would be able to hold 30 cubic meters at max capacity. For our project it was found that for best efficiency they should only be used to 70% capacity. If two were to be used a day to store the days’ worth of liquid to be fermented they would be filled to 65% capacity, this is under the capacity of 70% that was determined to be optimal. If there are two used a day there would be a need for a total of 40 fermentation vats.
Filter The filtration process that will transpire is Membrane Filtration. Membrane
Filtration is defined a vacuum-driven separation process in which particulate matter larger than 1 mm is rejected by an engineered barrier. The size of the membrane that has been chosen to be used is that of ultra-filtration where the pore sizes in the membrane is in the general range of 0.01 – 0.05 um
Bottling This equipment should be able to handle the volume coming out of 2 of the fermentation vats, 39 460 liters divided by the size of the bottles needed. The case of the 750 mL bottle is considered here so that there is an over estimation; 39460L/.75L= 52 613 bottles. To be able to account for this number of bottles in a single day the machine would need to be able to handle 53613bottle/10 hours in a day/60 minutes per hour. This gives 88 bottles a minute. The type of machine that was chosen for our operation is automatic head piston filler where each piston draws from a storage tank to before dispensing into the bottle. The nozzle is a simple plunger that is lifted then lowered after a set time, allowing a set amount of

fluid to flow past. The dimensions of the machine are 120” x 56” x 96”. It will contain 12 pistons heads allowing a rate of 120 CPM (Counts per minute).
Capping This machine is just to put the caps on the bottles after they have been filled
to the required limit. This will have to be able to keep pace with the number of bottles per hour that the bottling machine can do so 88 bottles a minute would be the minimum number and any ability above that would be used for expansion of the plant.
Labeling We chose to go with 2 labels per bottle one for front and back so that we would have the ability to change the size of bottle while still using the same labels and thus gives reassurance that if there was a change in supplier of the bottles we would not have to change labels. The reason is that a labeler that only uses one label per bottle is dependent on the bottle size and doesn’t have the range of sizes that would be preferred.
Other Apart from the machines mentioned above, piping connection the different components would be needed as well as pumps to move liquids from one place to another. This would require a 4inch pipe with a 50 gal/min flow. This flow rate was chosen as an intermediate between the very large pipes that could cost more yet have less flow and smaller pipe size that would increase the flow rate.
Scheduling A simple MATLAB (Appendix 3) program was made to keep track of values for the schedule. Although it only does simple calculations, it is a convenient way to store all the variables in the scheduling. If one of these should change, then the program could quickly recalculate the production rates required at each step to meet the total annual production rate of 1million liters. For example, if one of the mashers were to break, then the capacity could be changed to see what the new outputs would be.
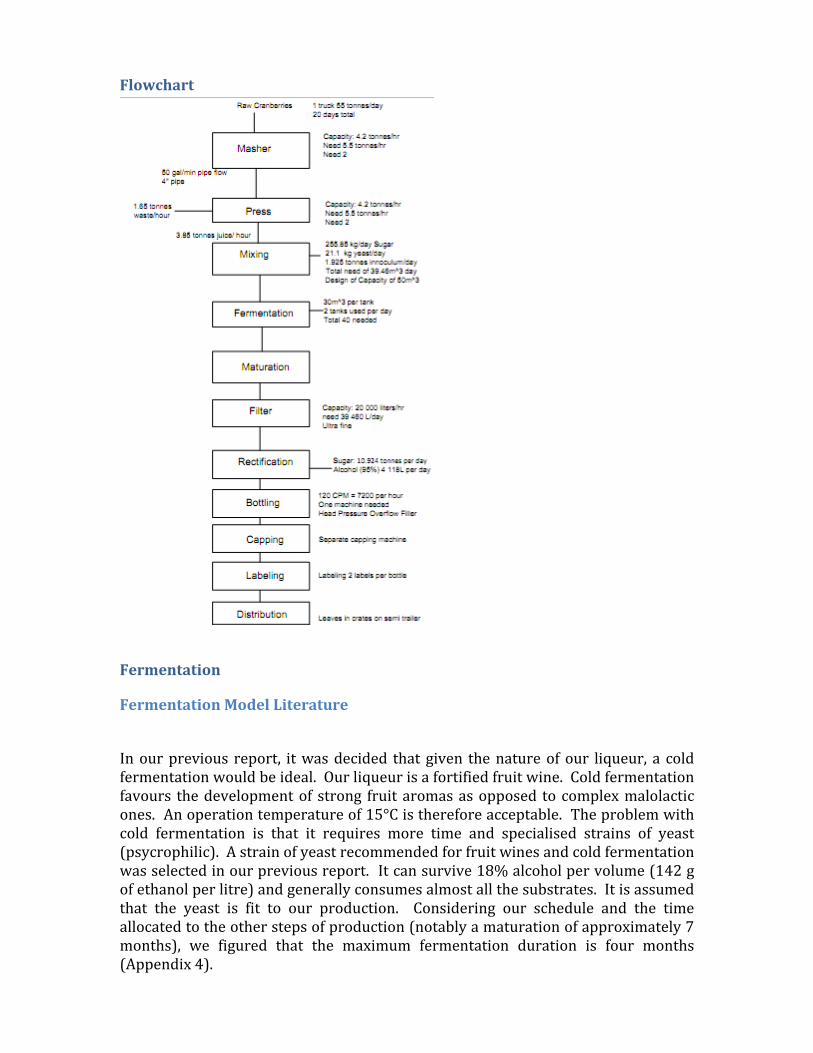
Flowchart
Fermentation
Fermentation Model Literature
In our previous report, it was decided that given the nature of our liqueur, a cold fermentation would be ideal. Our liqueur is a fortified fruit wine. Cold fermentation favours the development of strong fruit aromas as opposed to complex malolactic ones. An operation temperature of 15°C is therefore acceptable. The problem with cold fermentation is that it requires more time and specialised strains of yeast (psycrophilic). A strain of yeast recommended for fruit wines and cold fermentation was selected in our previous report. It can survive 18% alcohol per volume (142 g of ethanol per litre) and generally consumes almost all the substrates. It is assumed that the yeast is fit to our production. Considering our schedule and the time allocated to the other steps of production (notably a maturation of approximately 7 months), we figured that the maximum fermentation duration is four months (Appendix 4).
After analysing various published wine fermentation model, we decided to use the work of Pérez and Cantero. Their study, Development of a Kinetic Model for the Alcoholic Fermentation of Must, was published in 1991 in Biotechnology and Bioengineering. Numerous aspects of their work are relevant to our case.
Scope: Without being too simplistic, their model does not address aspects of wine fermentation related to quality and sophistication. We assumed that our product is good. Their study addresses our main concern: the fermentation kinetics.
Generic substrate: Their model uses a substrate that is representative of the average industrially produced wine. Since our project is theoretical, the particular composition of our fermentation substrate is not precisely defined. By using a model that is generic, the model should not demonstrate variations associated to very specific types of wine (sparkling, desert wines...).
Similar operating conditions: Their model is based on three different sources: i) literature, both for first principles and for experimental data, ii) laboratory experiments and 3) industrial scale experiments. Not only did they collaborate with the industrial sector, their laboratory fermenter was a scaled-down model of the industrial fermenter used. Luckily for us, the industrial fermenter used in their study is only slightly smaller than the ones we selected (25 m3 versus 30 m3). This confirms that our sizing is representative of the industry. Also, they affirm that their results are representative of a considerable range of operating conditions. Our planned operating conditions are all included in those ranges.
The goal of Pérez and Cantore was to create a model that would be representative of the conditions found in industrial wine production. They define those conditions as:
“batch fermentation of a complex media, anaerobic conditions, commonly used yeast (Saccharomyces cerevisae var. cerevisae), low media pH (3 to 3.6), addition of bisulfite ions, mixed substrate (glucose and fructose), generation of inhibitory product (80 to 120 g/L ethanol)” (Caro, Pérez and Cantero p.742) .
The only operating conditions that are not representative of our model is their strain of yeast and the use of sulphites. Given their results, their yeast cannot reach more than about 100 g of ethanol per litre, while our strain can survive 142. Also, we had assumed that given the cold fermentation and the nature of our substrate, none of the yeasts present in the cranberries could thrive before the specialised strain we selected take over. This allowed to avoid the use of sulfites (Appendix 4). We must assume that the presence of sulphites in their experiment does not affect the fermentation other than by initially killing the presence of wild yeasts.
Their model focuses on three major components: evolution of ethanol, CO2 and substrate with respect to time. Basically, microorganisms consume glucose (the substrate) which produces ethanol and CO2. As the concentration of substrate decreases, the ethanol and CO2 concentrations increase; all of which limits the activity of the microorganisms. All three concentrations follow a logistic curve. At the time, their model was improving upon previous ones that did not account for the effect of substrate assimilation and microbial respiration (Caro, Pérez and Cantero
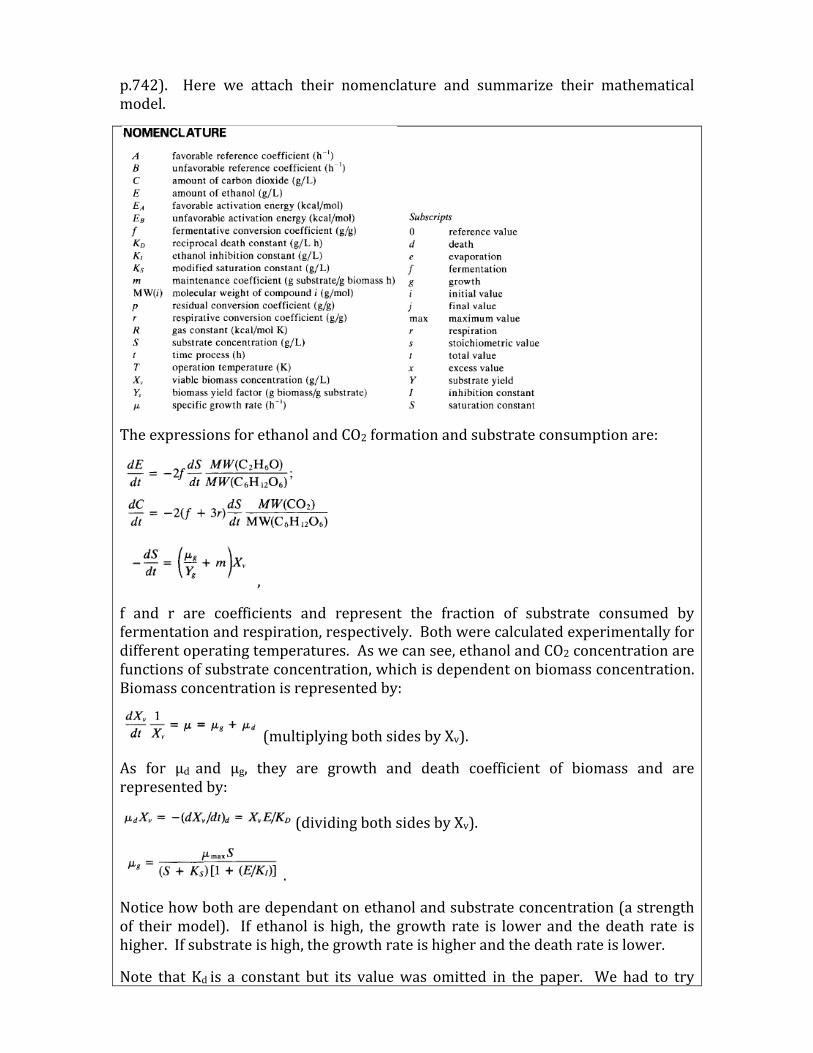
p.742). Here we attach their nomenclature and summarize their mathematical model.
The expressions for ethanol and CO2 formation and substrate consumption are:
,
f and r are coefficients and represent the fraction of substrate consumed by fermentation and respiration, respectively. Both were calculated experimentally for different operating temperatures. As we can see, ethanol and CO2 concentration are functions of substrate concentration, which is dependent on biomass concentration. Biomass concentration is represented by:
(multiplying both sides by Xv).
As for μd and μg, they are growth and death coefficient of biomass and are represented by:
(dividing both sides by Xv).
.
Notice how both are dependant on ethanol and substrate concentration (a strength of their model). If ethanol is high, the growth rate is lower and the death rate is higher. If substrate is high, the growth rate is higher and the death rate is lower.
Note that Kd is a constant but its value was omitted in the paper. We had to try
various values. Once we arrived at results that were similar to the ones computed with their reference operating conditions, we knew our value for Kd was similar to the one they used (Kd = 150).
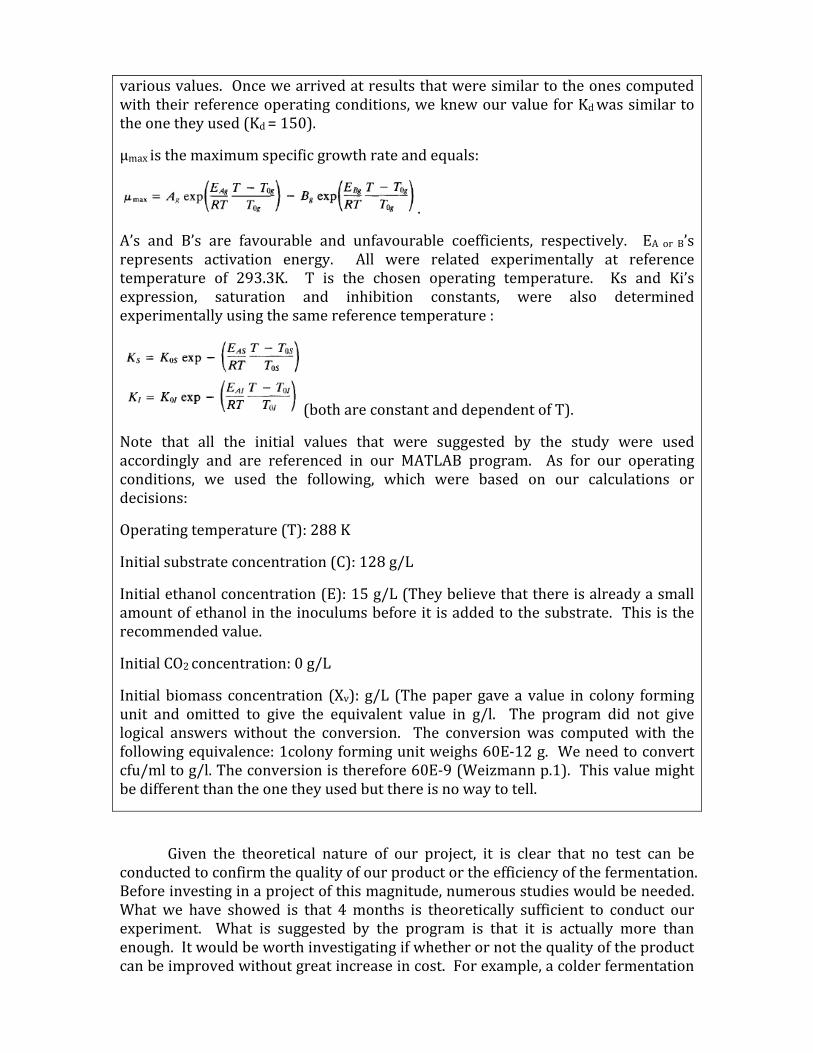
μmax is the maximum specific growth rate and equals:
.
A’s and B’s are favourable and unfavourable coefficients, respectively. EA or B’s represents activation energy. All were related experimentally at reference temperature of 293.3K. T is the chosen operating temperature. Ks and Ki’s expression, saturation and inhibition constants, were also determined experimentally using the same reference temperature :
(both are constant and dependent of T).
Note that all the initial values that were suggested by the study were used accordingly and are referenced in our MATLAB program. As for our operating conditions, we used the following, which were based on our calculations or decisions:
Operating temperature (T): 288 K
Initial substrate concentration (C): 128 g/L
Initial ethanol concentration (E): 15 g/L (They believe that there is already a small amount of ethanol in the inoculums before it is added to the substrate. This is the recommended value.
Initial CO2 concentration: 0 g/L
Initial biomass concentration (Xv): g/L (The paper gave a value in colony forming unit and omitted to give the equivalent value in g/l. The program did not give logical answers without the conversion. The conversion was computed with the following equivalence: 1colony forming unit weighs 60E-12 g. We need to convert cfu/ml to g/l. The conversion is therefore 60E-9 (Weizmann p.1). This value might be different than the one they used but there is no way to tell.
Given the theoretical nature of our project, it is clear that no test can be conducted to confirm the quality of our product or the efficiency of the fermentation. Before investing in a project of this magnitude, numerous studies would be needed. What we have showed is that 4 months is theoretically sufficient to conduct our experiment. What is suggested by the program is that it is actually more than enough. It would be worth investigating if whether or not the quality of the product can be improved without great increase in cost. For example, a colder fermentation
could potentially increase the quality of the product. Such a modification could require refrigeration, which demands higher energy input. Cost analysis would be required to see if it is beneficial.
As for potential fermentation issues (like stock fermentation, contamination, variations in final product), our decision to use 40 fermenters brings a certain level of safety; problems could occur in a few fermenters without having fatal consequences on the production. As for flavor variation, all matured fermentation products would be mixed and rectified in a single mixing vat prior to bottling.
There exist fermentation monitoring instruments; once again, cost analyses could show what is worth investing in.
Designed Fermentation Model After understanding the Caro et al. model of a fermentation process, we decided to
implement the differential equation calculations in order to properly model a cold fermentation of cranberries. Having a colder temperature slows the process significantly, and having chosen an extremely ethanol tolerate yeast gives us a thorough process.
Our Design II paper explains that two percent of the sugar present during fermentation will not be transformed into alcohol. In order to account for this, we decided to lower the available substrate by 2%, down to 125 g/L. It was calculated in the design II report that 128 g/L would be present.
After clearing the workspace entirely, our program sets values for the time, (time step of 0.001 hours and total time of 4000 hours), and creates a time matrix.
Values for the molecular weights of ethanol, sugar and CO2 are then made constant. All the constants and variables needed in the Caro et al. model are then defined. Matrices for microbiological population (yeasts), Ethanol Concentration, CO2 concentration and Substrate levels are then pre-allocated (creating large matrices of zeros) for speed.
The initial growth and death factors are then set, equivalent to the available substrate levels and ethanol levels. This is a large simplification, since our microbial population death only occurs due to high levels of ethanol.
The program then calculates corresponding values for all necessary matrices in a loop running from 2 to tc (the total number of 0.001 steps in 4000 hours) and finally plots the values of substrate level, ethanol content and CO2 content present in the product at each time, since these are the required parameters for our study. A simplification was made in order to correctly model the fermentation process over 4000 hours, since the original model is limited to 100 hours only. For this, the substrate level does not depend on the growth and death factors of the yeast population (as seen in Caro et al.), but on a constant value of 0.004, in order to correctly
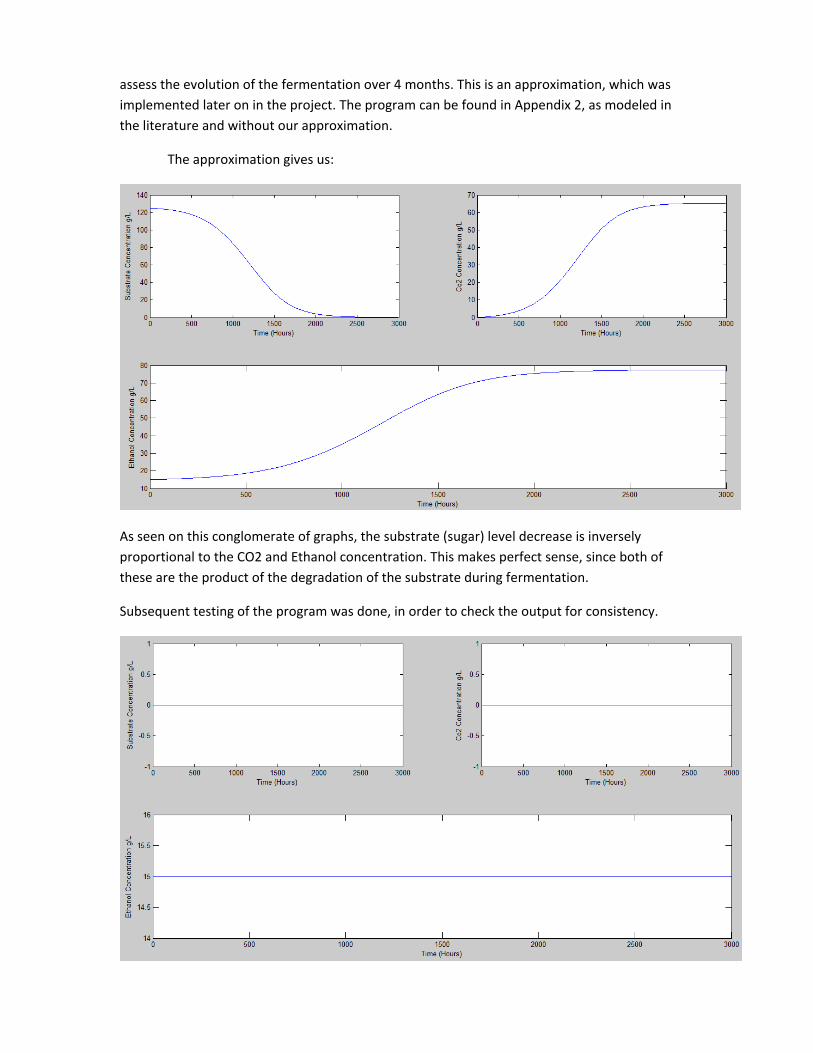
assess the evolution of the fermentation over 4 months. This is an approximation, which was implemented later on in the project. The program can be found in Appendix 2, as modeled in the literature and without our approximation.
The approximation gives us:
As seen on this conglomerate of graphs, the substrate (sugar) level decrease is inversely proportional to the CO2 and Ethanol concentration. This makes perfect sense, since both of these are the product of the degradation of the substrate during fermentation.
Subsequent testing of the program was done, in order to check the output for consistency.
At zero substrate level, the Ethanol is set as 15 g/L (as set in the program) and the CO2 level does not change, as expected.
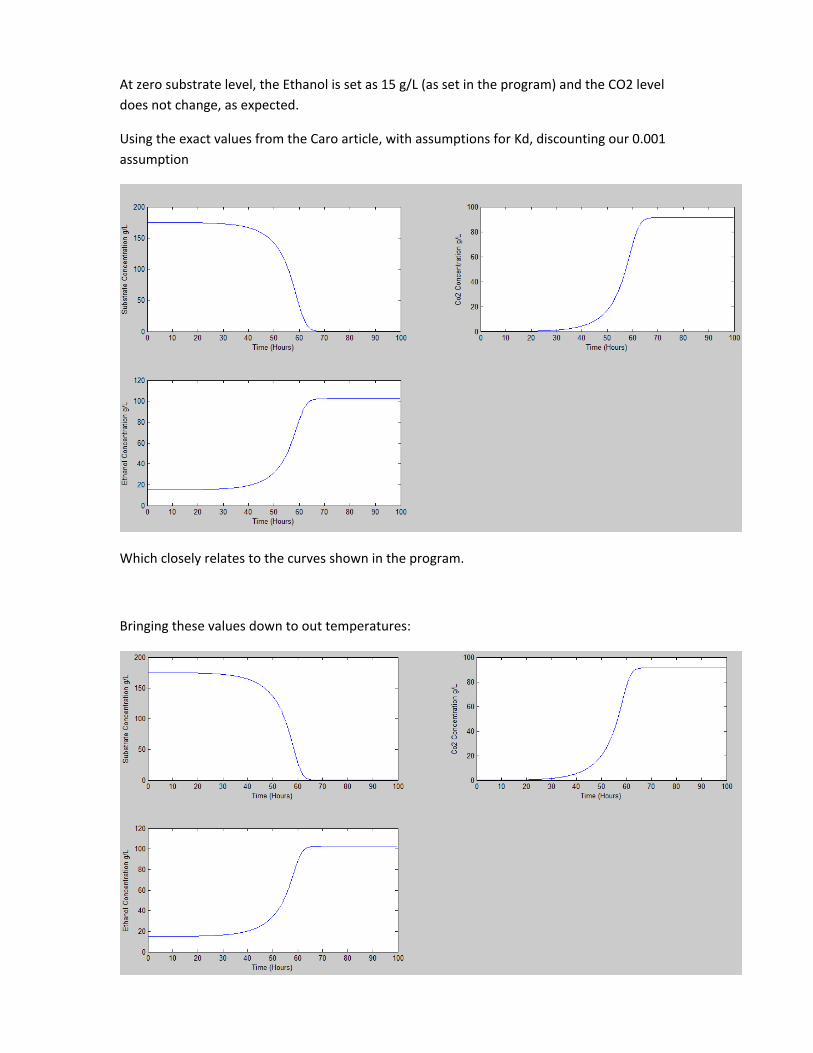
Using the exact values from the Caro article, with assumptions for Kd, discounting our 0.001 assumption
Which closely relates to the curves shown in the program.
Bringing these values down to out temperatures:
Which shows a slight increase in time needed. Our model produces extremely similar results to the ones from the article, and was therefore considered validated.
The model produces consistent results over a wide variation of values.
Feasibility A thorough feasibility assessment was conducted as part of the Design II, but after careful consideration, the 4 million dollars amount allocated to the purchase of machines was underestimated. Below is a summary of the Design II (in Appendix 4) findings, as well as a corrected initial investment and return period. First revenues are calculated and then variable and fixed costs are deducted to give an annual profit. From this, the tax bracket of the company can be calculated. The cost analysis will also include the preproduction years of the factory and the initial investment required for the purchase of the infrastructure and machinery.
Annual Revenue The annual revenue generated by the sale of 1 million litres of liqueur was calculated based on the selling price of a bottle and knowing the plant’s production rate. The results have been tabulated below. For detailed calculations, please refer to Appendix 4.
Table 2 – Yearly Revenue Generated from Liqueur Sale
Variable Costs Variable costs represent purchases whose price varies with production. The
prices were based on bulk price purchases. Full reference for the prices used can be found in Appendix 1. The table below is taken from the Design II paper and summarizes the variable costs incurred in the production of 1 million litres of cranberry liqueur. Table 3 – Variable Costs Generated by Production of 1Million Liters of Liqueur Name Quantity Rate Total Cost ($) Ingredients Sugar 284g/L 366.00$/ton 103,944.00 Dry Yeast 12.5g/L 376.50$/kg 23,719.50
Parameter 750 ml Bottles 1.14 L Bottles Retail Price ($) 24.95 34.95 Revenue per Bottle ($) 11.03 16.69 Quantity of bottles Sold (Yearly) 530,100.00 527,180.00 Revenue Generated ($) 5,847,003.00 8,805,320.20 Total Revenue Generated 14,652,313.20
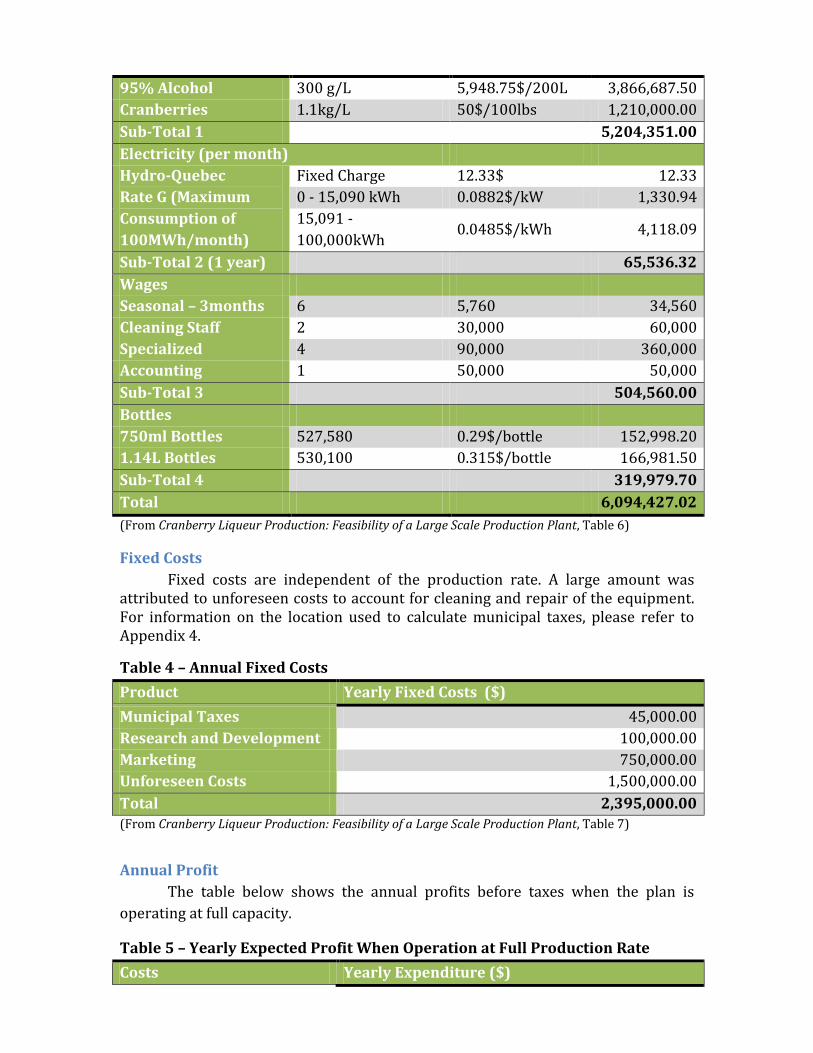
95% Alcohol 300 g/L 5,948.75$/200L 3,866,687.50 Cranberries 1.1kg/L 50$/100lbs 1,210,000.00 Sub-Total 1 5,204,351.00 Electricity (per month) Hydro-Quebec Rate G (Maximum Consumption of 100MWh/month)
Fixed Charge 12.33$ 12.33 0 - 15,090 kWh 0.0882$/kW 1,330.94 15,091 - 100,000kWh
0.0485$/kWh 4,118.09
Sub-Total 2 (1 year) 65,536.32 Wages Seasonal – 3months 6 5,760 34,560 Cleaning Staff 2 30,000 60,000 Specialized 4 90,000 360,000 Accounting 1 50,000 50,000 Sub-Total 3 504,560.00 Bottles 750ml Bottles 527,580 0.29$/bottle 152,998.20 1.14L Bottles 530,100 0.315$/bottle 166,981.50 Sub-Total 4 319,979.70 Total 6,094,427.02 (From Cranberry Liqueur Production: Feasibility of a Large Scale Production Plant, Table 6)
Fixed Costs Fixed costs are independent of the production rate. A large amount was attributed to unforeseen costs to account for cleaning and repair of the equipment. For information on the location used to calculate municipal taxes, please refer to Appendix 4.
Table 4 – Annual Fixed Costs Product Yearly Fixed Costs ($) Municipal Taxes 45,000.00 Research and Development 100,000.00 Marketing 750,000.00 Unforeseen Costs 1,500,000.00 Total 2,395,000.00 (From Cranberry Liqueur Production: Feasibility of a Large Scale Production Plant, Table 7)
Annual Profit The table below shows the annual profits before taxes when the plan is
operating at full capacity.
Table 5 – Yearly Expected Profit When Operation at Full Production Rate Costs Yearly Expenditure ($)
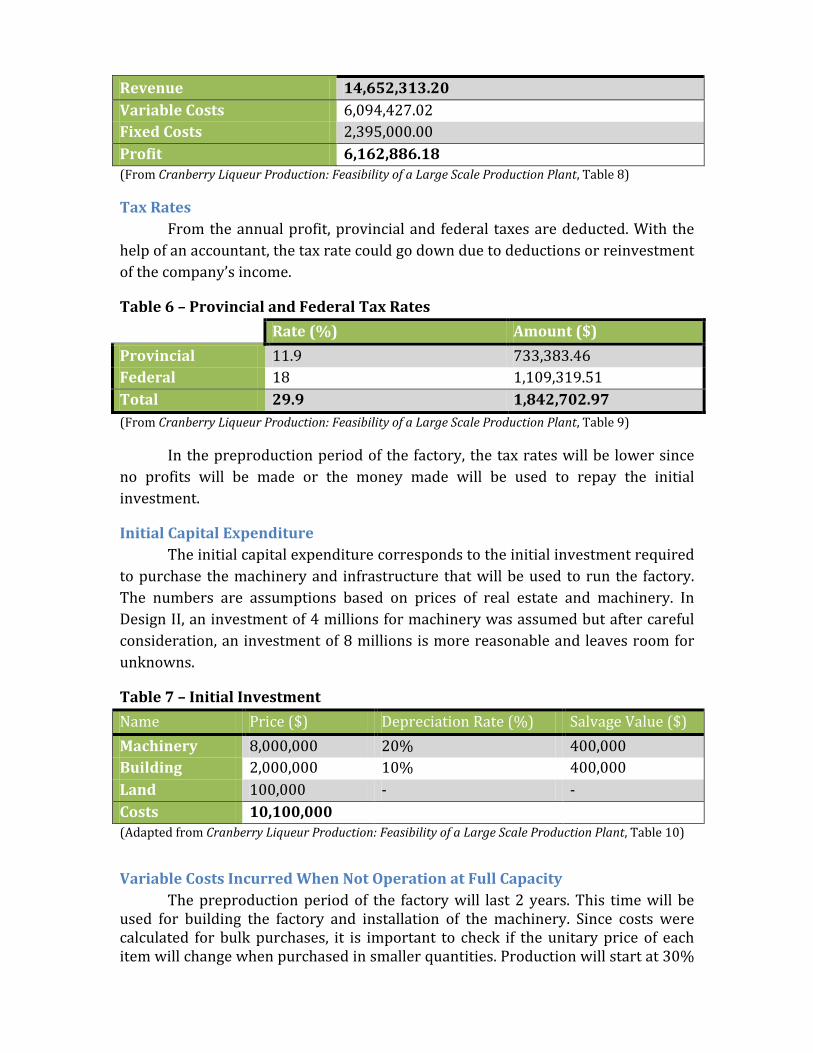
Revenue 14,652,313.20 Variable Costs 6,094,427.02 Fixed Costs 2,395,000.00 Profit 6,162,886.18 (From Cranberry Liqueur Production: Feasibility of a Large Scale Production Plant, Table 8)
Tax Rates From the annual profit, provincial and federal taxes are deducted. With the help of an accountant, the tax rate could go down due to deductions or reinvestment of the company’s income.
Table 6 – Provincial and Federal Tax Rates Rate (%) Amount ($) Provincial 11.9 733,383.46 Federal 18 1,109,319.51 Total 29.9 1,842,702.97 (From Cranberry Liqueur Production: Feasibility of a Large Scale Production Plant, Table 9)
In the preproduction period of the factory, the tax rates will be lower since no profits will be made or the money made will be used to repay the initial investment.
Initial Capital Expenditure The initial capital expenditure corresponds to the initial investment required to purchase the machinery and infrastructure that will be used to run the factory. The numbers are assumptions based on prices of real estate and machinery. In Design II, an investment of 4 millions for machinery was assumed but after careful consideration, an investment of 8 millions is more reasonable and leaves room for unknowns.
Table 7 – Initial Investment Name Price ($) Depreciation Rate (%) Salvage Value ($) Machinery 8,000,000 20% 400,000 Building 2,000,000 10% 400,000 Land 100,000 - - Costs 10,100,000 (Adapted from Cranberry Liqueur Production: Feasibility of a Large Scale Production Plant, Table 10)
Variable Costs Incurred When Not Operation at Full Capacity The preproduction period of the factory will last 2 years. This time will be
used for building the factory and installation of the machinery. Since costs were calculated for bulk purchases, it is important to check if the unitary price of each item will change when purchased in smaller quantities. Production will start at 30%
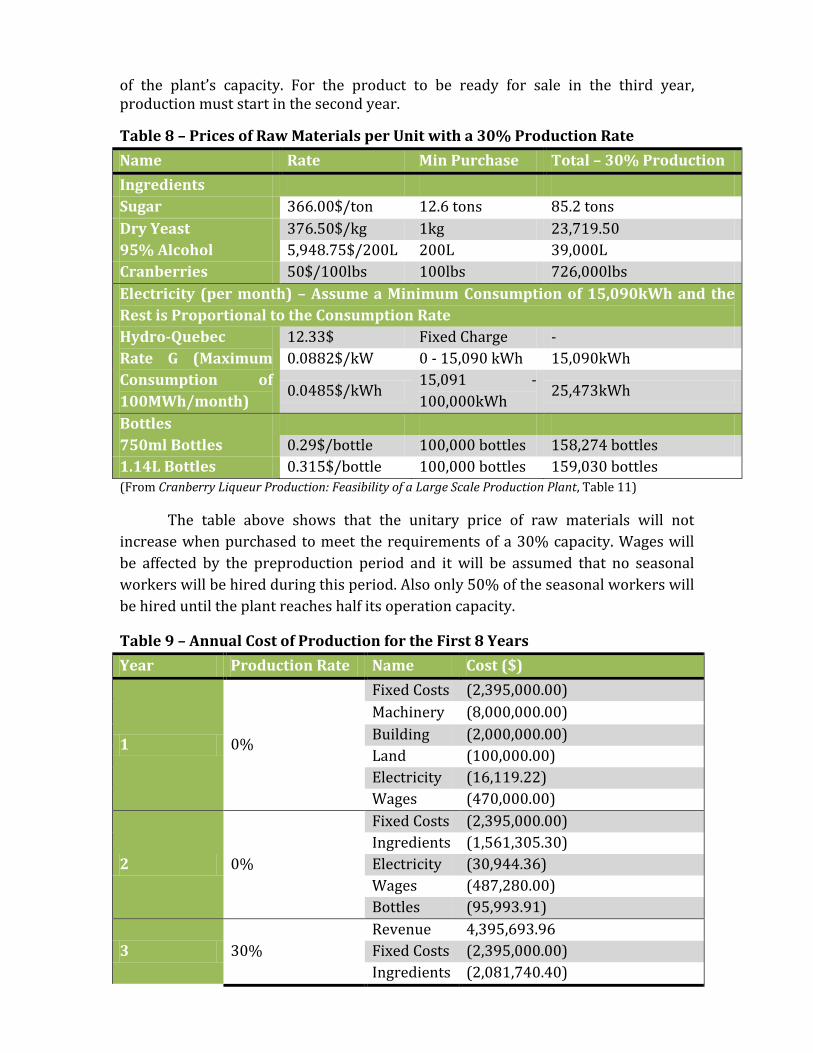
of the plant’s capacity. For the product to be ready for sale in the third year, production must start in the second year.
Table 8 – Prices of Raw Materials per Unit with a 30% Production Rate Name Rate Min Purchase Total – 30% Production Ingredients Sugar 366.00$/ton 12.6 tons 85.2 tons Dry Yeast 376.50$/kg 1kg 23,719.50 95% Alcohol 5,948.75$/200L 200L 39,000L Cranberries 50$/100lbs 100lbs 726,000lbs Electricity (per month) – Assume a Minimum Consumption of 15,090kWh and the Rest is Proportional to the Consumption Rate Hydro-Quebec Rate G (Maximum Consumption of 100MWh/month)
12.33$ Fixed Charge - 0.0882$/kW 0 - 15,090 kWh 15,090kWh
0.0485$/kWh 15,091 - 100,000kWh
25,473kWh
Bottles 750ml Bottles 0.29$/bottle 100,000 bottles 158,274 bottles 1.14L Bottles 0.315$/bottle 100,000 bottles 159,030 bottles (From Cranberry Liqueur Production: Feasibility of a Large Scale Production Plant, Table 11)
The table above shows that the unitary price of raw materials will not increase when purchased to meet the requirements of a 30% capacity. Wages will be affected by the preproduction period and it will be assumed that no seasonal workers will be hired during this period. Also only 50% of the seasonal workers will be hired until the plant reaches half its operation capacity.
Table 9 – Annual Cost of Production for the First 8 Years Year Production Rate Name Cost ($)
1 0%
Fixed Costs (2,395,000.00) Machinery (8,000,000.00) Building (2,000,000.00) Land (100,000.00) Electricity (16,119.22) Wages (470,000.00)
2 0%
Fixed Costs (2,395,000.00) Ingredients (1,561,305.30) Electricity (30,944.36) Wages (487,280.00) Bottles (95,993.91)
3 30% Revenue 4,395,693.96 Fixed Costs (2,395,000.00) Ingredients (2,081,740.40)
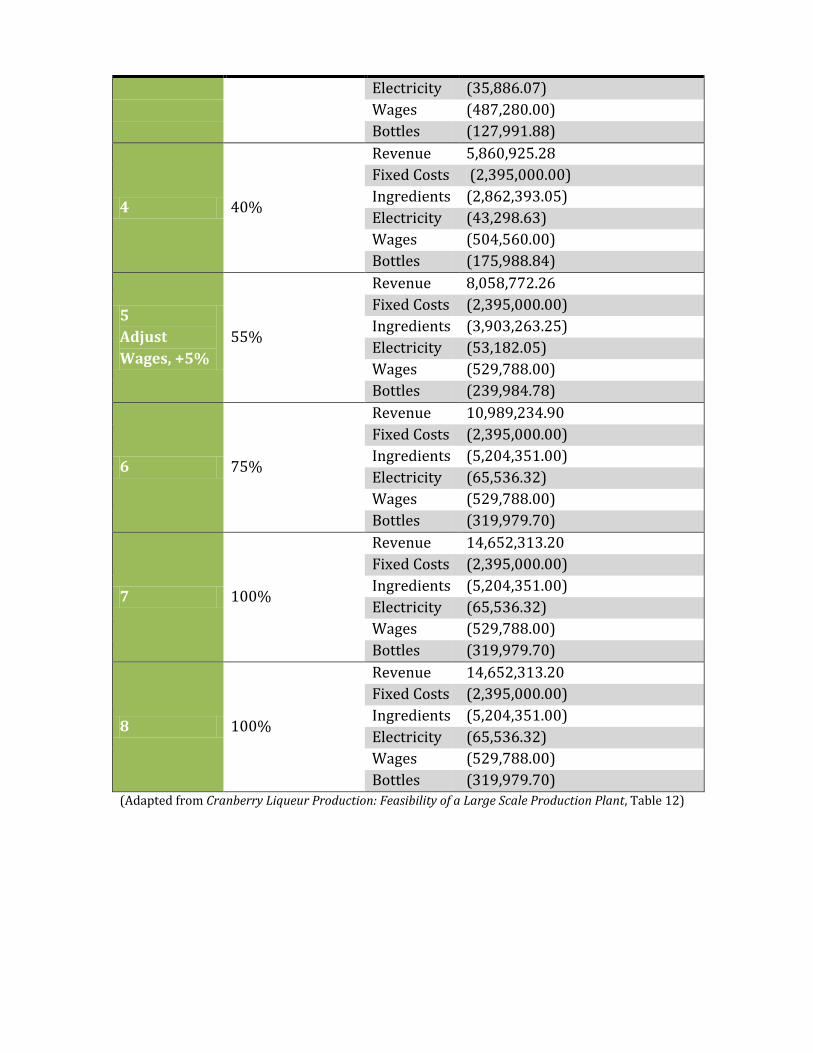
Electricity (35,886.07) Wages (487,280.00) Bottles (127,991.88)
4 40%
Revenue 5,860,925.28 Fixed Costs (2,395,000.00) Ingredients (2,862,393.05) Electricity (43,298.63) Wages (504,560.00) Bottles (175,988.84)
5 Adjust Wages, +5%
55%
Revenue 8,058,772.26 Fixed Costs (2,395,000.00) Ingredients (3,903,263.25) Electricity (53,182.05) Wages (529,788.00) Bottles (239,984.78)
6 75%
Revenue 10,989,234.90 Fixed Costs (2,395,000.00) Ingredients (5,204,351.00) Electricity (65,536.32) Wages (529,788.00) Bottles (319,979.70)
7 100%
Revenue 14,652,313.20 Fixed Costs (2,395,000.00) Ingredients (5,204,351.00) Electricity (65,536.32) Wages (529,788.00) Bottles (319,979.70)
8 100%
Revenue 14,652,313.20 Fixed Costs (2,395,000.00) Ingredients (5,204,351.00) Electricity (65,536.32) Wages (529,788.00) Bottles (319,979.70)
(Adapted from Cranberry Liqueur Production: Feasibility of a Large Scale Production Plant, Table 12)
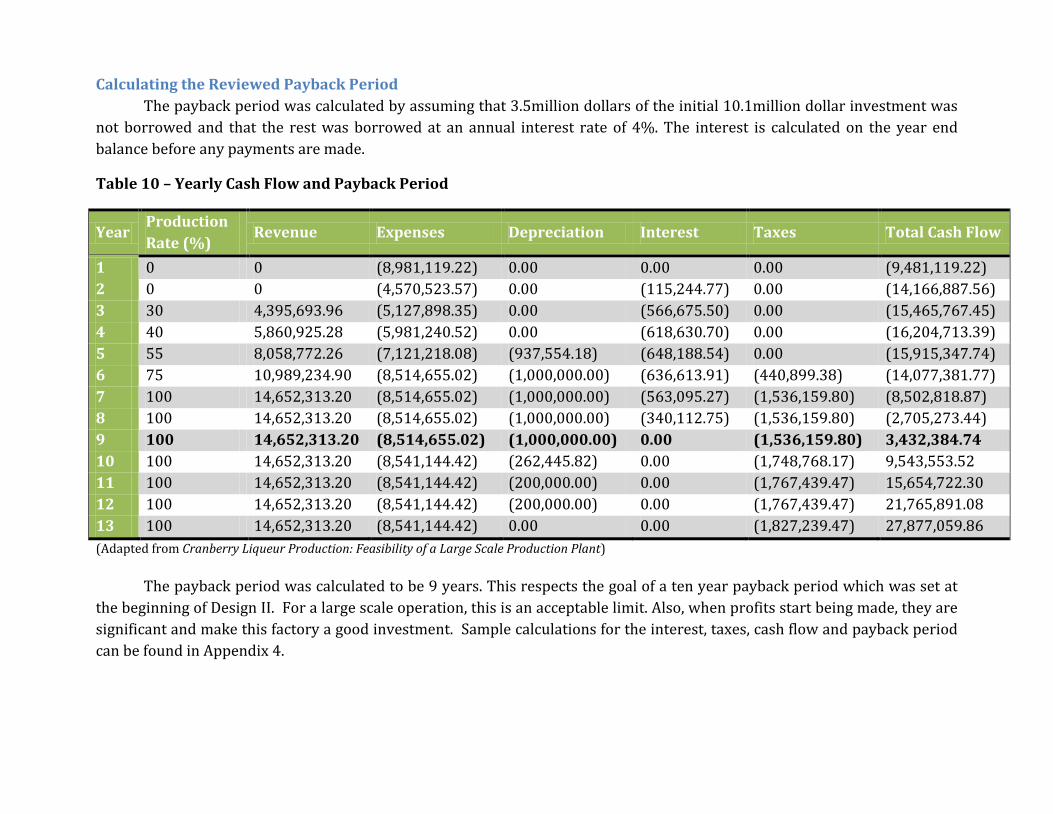
Calculating the Reviewed Payback Period The payback period was calculated by assuming that 3.5million dollars of the initial 10.1million dollar investment was not borrowed and that the rest was borrowed at an annual interest rate of 4%. The interest is calculated on the year end balance before any payments are made.
Table 10 – Yearly Cash Flow and Payback Period
Year Production Rate (%)
Revenue Expenses Depreciation Interest Taxes Total Cash Flow
1 0 0 (8,981,119.22) 0.00 0.00 0.00 (9,481,119.22) 2 0 0 (4,570,523.57) 0.00 (115,244.77) 0.00 (14,166,887.56) 3 30 4,395,693.96 (5,127,898.35) 0.00 (566,675.50) 0.00 (15,465,767.45) 4 40 5,860,925.28 (5,981,240.52) 0.00 (618,630.70) 0.00 (16,204,713.39) 5 55 8,058,772.26 (7,121,218.08) (937,554.18) (648,188.54) 0.00 (15,915,347.74) 6 75 10,989,234.90 (8,514,655.02) (1,000,000.00) (636,613.91) (440,899.38) (14,077,381.77) 7 100 14,652,313.20 (8,514,655.02) (1,000,000.00) (563,095.27) (1,536,159.80) (8,502,818.87) 8 100 14,652,313.20 (8,514,655.02) (1,000,000.00) (340,112.75) (1,536,159.80) (2,705,273.44) 9 100 14,652,313.20 (8,514,655.02) (1,000,000.00) 0.00 (1,536,159.80) 3,432,384.74 10 100 14,652,313.20 (8,541,144.42) (262,445.82) 0.00 (1,748,768.17) 9,543,553.52 11 100 14,652,313.20 (8,541,144.42) (200,000.00) 0.00 (1,767,439.47) 15,654,722.30 12 100 14,652,313.20 (8,541,144.42) (200,000.00) 0.00 (1,767,439.47) 21,765,891.08 13 100 14,652,313.20 (8,541,144.42) 0.00 0.00 (1,827,239.47) 27,877,059.86 (Adapted from Cranberry Liqueur Production: Feasibility of a Large Scale Production Plant)
The payback period was calculated to be 9 years. This respects the goal of a ten year payback period which was set at the beginning of Design II. For a large scale operation, this is an acceptable limit. Also, when profits start being made, they are significant and make this factory a good investment. Sample calculations for the interest, taxes, cash flow and payback period can be found in Appendix 4.
Conclusion
This design project showed that cranberry, because of its multiple properties and overall popularity in North-America, is an excellent fruit to use in the production and commercialisation of liqueur.
With the equipment sized, a production schedule set and an updated expenses and payback period this project is still economically feasible within the limits sets. From the modeling it has been shown that the cold fermentation process is obtainable. The overall process has been found to work given the set parameters.
Bibliography Cranberry. (2010, November 24). Retrieved November 24, 2010, from Wikipedia:
http://en.wikipedia.org/wiki/Cranberry
Cranberry Properties. (2010, June 28). Retrieved November 24, 2010, from Wolfram Alpha: http://www.wolframalpha.com/entities/common_materials/cranberries/y9/cn/xa
Crème de Cassis. (2010, November 17). Retrieved November 25, 2010, from Wikipedia France: http://fr.wikipedia.org/wiki/Cr%C3%A8me_de_cassis
Armstrong, S., Deram, P., Thompson, R., & Yank, A. (2010). Alcohol and Cranberry Maceration. Montreal.
Arthey, D., & Ashurst, P. R. (2001). Fruit Processing: Nutrition, Products, and Qualitity Management. Second Edition. Gaithersburg: Aspen Publishers.
Cali, S., & Aydin, C. (2004). Some physico-mechanic properties of cherry laurel (Prunus lauracerasus L.) fruits. Journal of Food Engineering, 65:145-150.
Deram, P., & Lamoureux, G. (2010). Cranberry Liqueur Production Through a Fermentation Process. Montreal.
Holstein-Brennereien. (2010). Retrieved November 25, 2010, from Holstein-Brennereien: http://holstein-brennereien.com/uploads/media/Holstein_Zubehoer_e.pdf
Hornsey, I. (2007). The Chemistry and Biology of Wine Making. Cambridge: The Royal Society of Chemistry.
LE CONSEIL DES COMMUNAUTÉS EUROPÉENNES. (1989, May 29). RÈGLEMENT (CEE) N° 1576/89. Règles générales relatives à la définition, à la désignation et à la présentation des boissons spiritueuses .
Özgen, M., Workmaster, B. A., & Palta, J. P. (n.d.). Relationship between Fruit Color (ripening) and Shelf Life of Cranberries: Physiological and Anatomical Explanation. Madison, WI: Department of Horticulture, University of Wisconsin.
Top Cordial and Liqueur Brands, 2008. (2011). [828]. (2010).
Handbook Advance, Annual 2009, p.62
Johnson-White B, Buquo L, Zeinali M, Ligler FS. (2006). Prevention of nonspecific bacterial cell adhesion in immunoassays by use of cranberry juice. Analytical Chemistry. 78(3),853-7
Halvorsen, BL, Carlsen MH, Phillips KM, Bohn, SK, Holte K, Jacobs DR, and Blomhoff R. (2006). Content of redox-active compounds (i.e. antioxidants) in foods consumed in the United States. American Journal of Clinical Nutrition, 84(1), 95-135
Vilsack, Tom. (2009). United States Summary and State. Data Retrieved November 19, 2010, from http://www.usda.gov/wps/portal/usda/usdahome
AVF. (n.d.). avf . Retrieved april 3, 2011, from accutek packing equpment: http://www.accutekpackaging.com/specsheets/AVF_Series-2009.pdf
United States Environmental Protection Agency. (2005, November). MEMBRANE FILTRATION GUIDANCE MANUAL. Retrieved march 11, 20011, from http://www.epa.gov/ogwdw/disinfection/lt2/pdfs/guide_lt2_membranefiltration_final.pdf
AVF. (n.d.). avf . Retrieved april 3, 2011, from accutek packing equpment: http://www.accutekpackaging.com/specsheets/AVF_Series-2009.pdf
Appendix 1 – Reference Table for Rates and Prices of Material Product Price Source Top 5 liqueurs
Varies SAQ Website: http://www.saq.com/
Quebec Alcohol Tax Rates
Varies Revenue Québec, Form VDZ-498-V Return Respecting the Specific Tax on Alcoholic Beverages, version 2010-04
PST 7.5% Revenue Québec Website: h ttp://www.revenu.gouv.qc.ca/

GST 5% Canada Revenue Agency Website: http://www.cra-arc.gc.ca
Profit Margin of Liqueur Stores
32.3% Canadian Industry Statistics (CIS) Website for Beer, Wine and Liquor Stores (NAICS 4453): http://www.ic.gc.ca/
Cost of Goods in Liqueur Stores
78% Canadian Industry Statistics (CIS) Website for Beer, Wine and Liquor Stores (NAICS 4453): http://www.ic.gc.ca/
Sugar 366.00$ /ton
Nazco Distributors Website: http://www.cooking-oil-fuel.com/
Dry Yeast 376.50$/kg Nappa Fermentation Website: http://www.napafermentation.com/
95% Alcohol 5,948.75$/200L
Spectrum Chemical Website: https://www.spectrumchemical.com/
Cranberries 50$/100lbs Noncitrus Fruits and Nuts – 2009 Summary, July 7, 2010, National Agricultural Statistics Service, USDA
Electricity Varies Hydro Québec Website: http://www.hydroquebec.com/business/
Bottles Varies Ms. Vicki Yu / sales manager, GLASS MANUFACTURING & CUSTOM PACKAGING, SHANGHAI BOTTLELINK PACKAGING PRODUCTS CO.,LTD.
Municipal Taxes
Colliers International Website, farm for sale in Drummondville: www.colliers.com
Provincial Tax Rate
11.9% Revenue Québec Website: http://www.revenu.gouv.qc.ca/en/entreprise/impot/
Federal Tax Rates
18% Canada Revenue Agency: http://www.cra-arc.gc.ca/
Appendix 2 – design3.m % design3.M % This program calculates the kinetics of the cold fermentation process % used in our design paper, with regards to all the constants and equations % described in Caro et al. 1991. % Paul Deram % Justin Dougherty % Laura Gilbert % Guillaume Lamoureux % BREE 495 - Design III
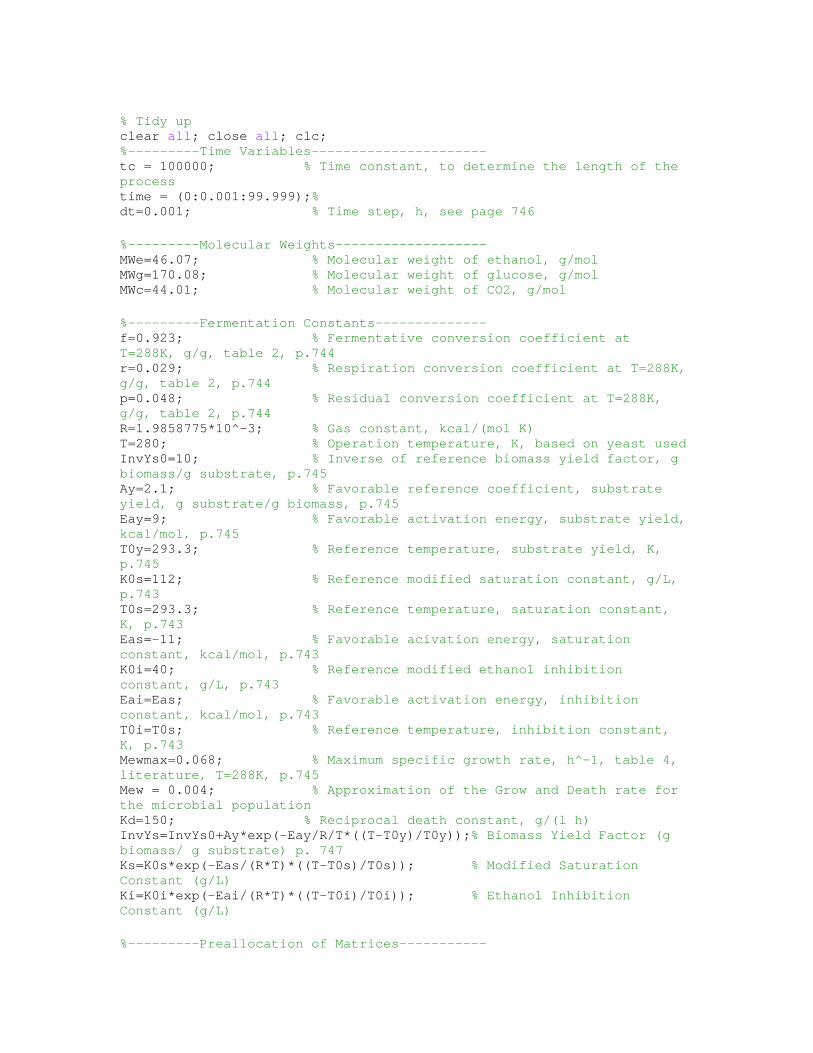
% Tidy up clear all; close all; clc; %---------Time Variables---------------------- tc = 100000; % Time constant, to determine the length of the process time = (0:0.001:99.999);% dt=0.001; % Time step, h, see page 746 %---------Molecular Weights------------------- MWe=46.07; % Molecular weight of ethanol, g/mol MWg=170.08; % Molecular weight of glucose, g/mol MWc=44.01; % Molecular weight of CO2, g/mol %---------Fermentation Constants-------------- f=0.923; % Fermentative conversion coefficient at T=288K, g/g, table 2, p.744 r=0.029; % Respiration conversion coefficient at T=288K, g/g, table 2, p.744 p=0.048; % Residual conversion coefficient at T=288K, g/g, table 2, p.744 R=1.9858775*10^-3; % Gas constant, kcal/(mol K) T=280; % Operation temperature, K, based on yeast used InvYs0=10; % Inverse of reference biomass yield factor, g biomass/g substrate, p.745 Ay=2.1; % Favorable reference coefficient, substrate yield, g substrate/g biomass, p.745 Eay=9; % Favorable activation energy, substrate yield, kcal/mol, p.745 T0y=293.3; % Reference temperature, substrate yield, K, p.745 K0s=112; % Reference modified saturation constant, g/L, p.743 T0s=293.3; % Reference temperature, saturation constant, K, p.743 Eas=-11; % Favorable acivation energy, saturation constant, kcal/mol, p.743 K0i=40; % Reference modified ethanol inhibition constant, g/L, p.743 Eai=Eas; % Favorable activation energy, inhibition constant, kcal/mol, p.743 T0i=T0s; % Reference temperature, inhibition constant, K, p.743 Mewmax=0.068; % Maximum specific growth rate, h^-1, table 4, literature, T=288K, p.745 Mew = 0.004; % Approximation of the Grow and Death rate for the microbial population Kd=150; % Reciprocal death constant, g/(l h) InvYs=InvYs0+Ay*exp(-Eay/R/T*((T-T0y)/T0y));% Biomass Yield Factor (g biomass/ g substrate) p. 747 Ks=K0s*exp(-Eas/(R*T)*((T-T0s)/T0s)); % Modified Saturation Constant (g/L) Ki=K0i*exp(-Eai/(R*T)*((T-T0i)/T0i)); % Ethanol Inhibition Constant (g/L) %---------Preallocation of Matrices-----------
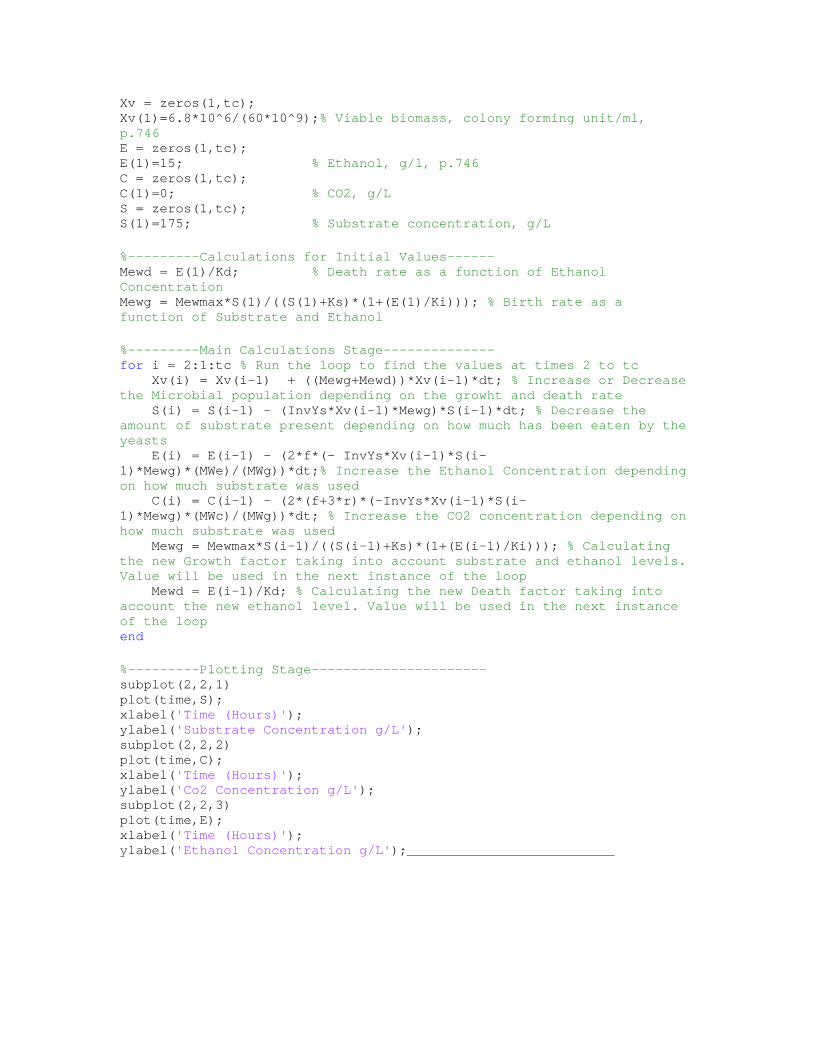
Xv = zeros(1,tc); Xv(1)=6.8*10^6/(60*10^9);% Viable biomass, colony forming unit/ml, p.746 E = zeros(1,tc); E(1)=15; % Ethanol, g/l, p.746 C = zeros(1,tc); C(1)=0; % CO2, g/L S = zeros(1,tc); S(1)=175; % Substrate concentration, g/L %---------Calculations for Initial Values------ Mewd = E(1)/Kd; % Death rate as a function of Ethanol Concentration Mewg = Mewmax*S(1)/((S(1)+Ks)*(1+(E(1)/Ki))); % Birth rate as a function of Substrate and Ethanol %---------Main Calculations Stage-------------- for i = 2:1:tc % Run the loop to find the values at times 2 to tc Xv(i) = Xv(i-1) + ((Mewg+Mewd))*Xv(i-1)*dt; % Increase or Decrease the Microbial population depending on the growht and death rate S(i) = S(i-1) - (InvYs*Xv(i-1)*Mewg)*S(i-1)*dt; % Decrease the amount of substrate present depending on how much has been eaten by the yeasts E(i) = E(i-1) - (2*f*(- InvYs*Xv(i-1)*S(i-1)*Mewg)*(MWe)/(MWg))*dt;% Increase the Ethanol Concentration depending on how much substrate was used C(i) = C(i-1) - (2*(f+3*r)*(-InvYs*Xv(i-1)*S(i-1)*Mewg)*(MWc)/(MWg))*dt; % Increase the CO2 concentration depending on how much substrate was used Mewg = Mewmax*S(i-1)/((S(i-1)+Ks)*(1+(E(i-1)/Ki))); % Calculating the new Growth factor taking into account substrate and ethanol levels. Value will be used in the next instance of the loop Mewd = E(i-1)/Kd; % Calculating the new Death factor taking into account the new ethanol level. Value will be used in the next instance of the loop end %---------Plotting Stage---------------------- subplot(2,2,1) plot(time,S); xlabel('Time (Hours)'); ylabel('Substrate Concentration g/L'); subplot(2,2,2) plot(time,C); xlabel('Time (Hours)'); ylabel('Co2 Concentration g/L'); subplot(2,2,3) plot(time,E); xlabel('Time (Hours)'); ylabel('Ethanol Concentration g/L');__________________________
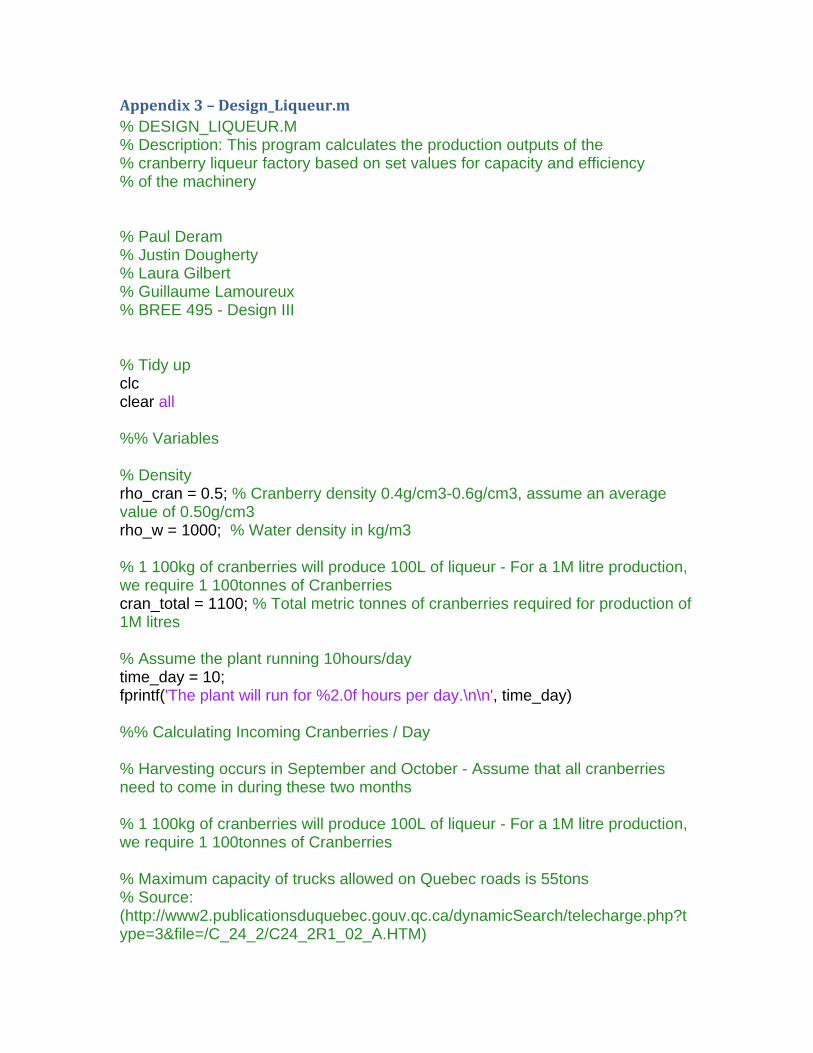
Appendix 3 – Design_Liqueur.m % DESIGN_LIQUEUR.M % Description: This program calculates the production outputs of the % cranberry liqueur factory based on set values for capacity and efficiency % of the machinery % Paul Deram % Justin Dougherty % Laura Gilbert % Guillaume Lamoureux % BREE 495 - Design III % Tidy up clc clear all %% Variables % Density rho_cran = 0.5; % Cranberry density 0.4g/cm3-0.6g/cm3, assume an average value of 0.50g/cm3 rho_w = 1000; % Water density in kg/m3 % 1 100kg of cranberries will produce 100L of liqueur - For a 1M litre production, we require 1 100tonnes of Cranberries cran_total = 1100; % Total metric tonnes of cranberries required for production of 1M litres % Assume the plant running 10hours/day time_day = 10; fprintf('The plant will run for %2.0f hours per day.\n\n', time_day) %% Calculating Incoming Cranberries / Day % Harvesting occurs in September and October - Assume that all cranberries need to come in during these two months % 1 100kg of cranberries will produce 100L of liqueur - For a 1M litre production, we require 1 100tonnes of Cranberries % Maximum capacity of trucks allowed on Quebec roads is 55tons % Source: (http://www2.publicationsduquebec.gouv.qc.ca/dynamicSearch/telecharge.php?type=3&file=/C_24_2/C24_2R1_02_A.HTM)
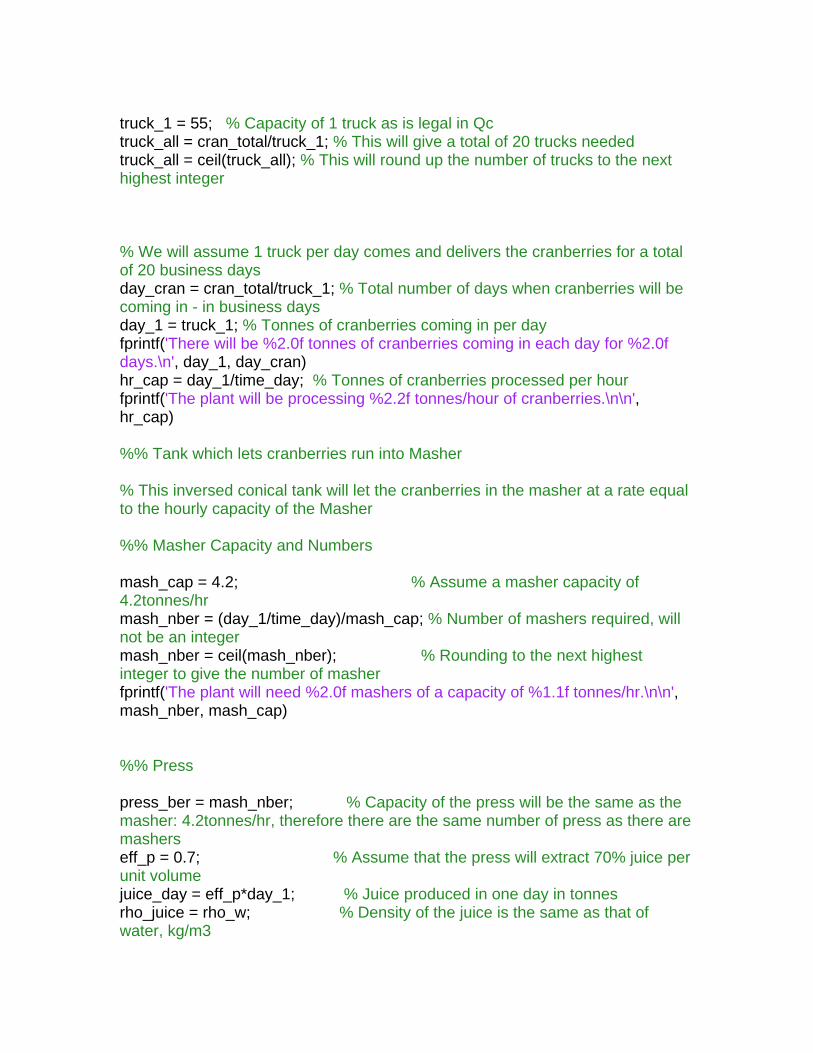
truck_1 = 55; % Capacity of 1 truck as is legal in Qc truck_all = cran_total/truck_1; % This will give a total of 20 trucks needed truck_all = ceil(truck_all); % This will round up the number of trucks to the next highest integer % We will assume 1 truck per day comes and delivers the cranberries for a total of 20 business days day_cran = cran_total/truck_1; % Total number of days when cranberries will be coming in - in business days day_1 = truck_1; % Tonnes of cranberries coming in per day fprintf('There will be %2.0f tonnes of cranberries coming in each day for %2.0f days.\n', day_1, day_cran) hr_cap = day_1/time_day; % Tonnes of cranberries processed per hour fprintf('The plant will be processing %2.2f tonnes/hour of cranberries.\n\n', hr_cap) %% Tank which lets cranberries run into Masher % This inversed conical tank will let the cranberries in the masher at a rate equal to the hourly capacity of the Masher %% Masher Capacity and Numbers mash_cap = 4.2; % Assume a masher capacity of 4.2tonnes/hr mash_nber = (day_1/time_day)/mash_cap; % Number of mashers required, will not be an integer mash_nber = ceil(mash_nber); % Rounding to the next highest integer to give the number of masher fprintf('The plant will need %2.0f mashers of a capacity of %1.1f tonnes/hr.\n\n', mash_nber, mash_cap) %% Press press_ber = mash_nber; % Capacity of the press will be the same as the masher: 4.2tonnes/hr, therefore there are the same number of press as there are mashers eff_p = 0.7; % Assume that the press will extract 70% juice per unit volume juice_day = eff_p*day_1; % Juice produced in one day in tonnes rho_juice = rho_w; % Density of the juice is the same as that of water, kg/m3
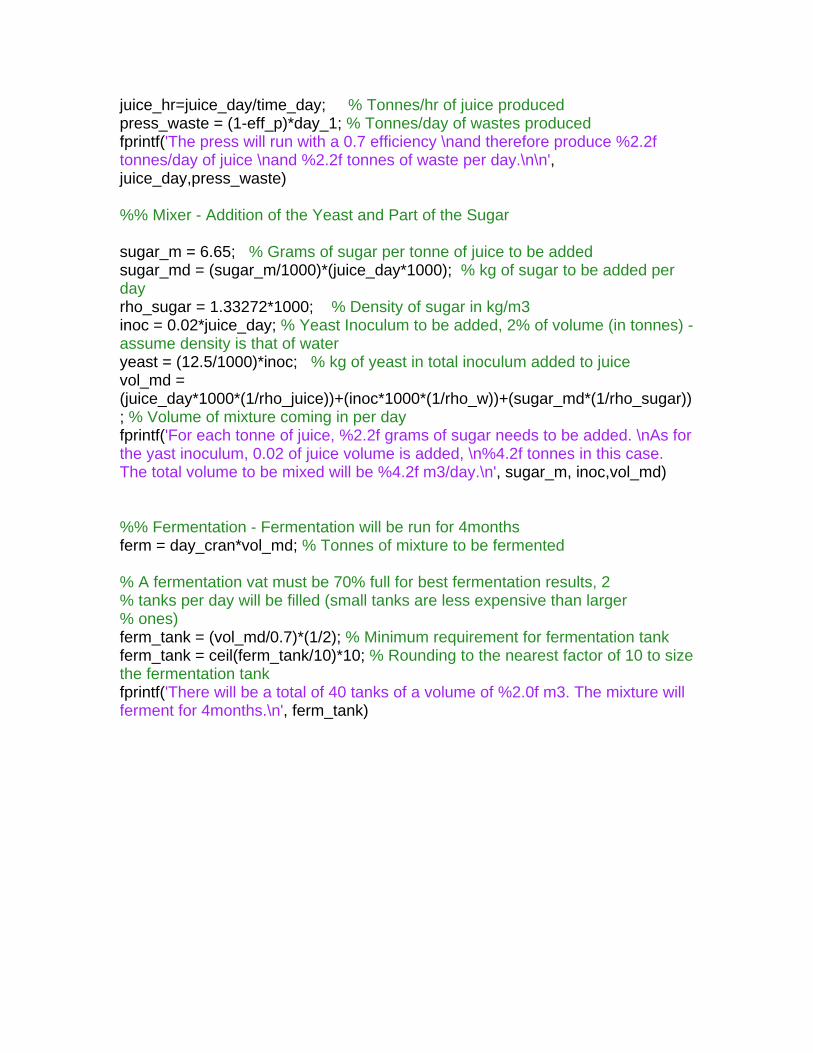
juice_hr=juice_day/time_day; % Tonnes/hr of juice produced press_waste = (1-eff_p)*day_1; % Tonnes/day of wastes produced fprintf('The press will run with a 0.7 efficiency \nand therefore produce %2.2f tonnes/day of juice \nand %2.2f tonnes of waste per day.\n\n', juice_day,press_waste) %% Mixer - Addition of the Yeast and Part of the Sugar sugar_m = 6.65; % Grams of sugar per tonne of juice to be added sugar_md = (sugar_m/1000)*(juice_day*1000); % kg of sugar to be added per day rho_sugar = 1.33272*1000; % Density of sugar in kg/m3 inoc = 0.02*juice_day; % Yeast Inoculum to be added, 2% of volume (in tonnes) - assume density is that of water yeast = (12.5/1000)*inoc; % kg of yeast in total inoculum added to juice vol_md = (juice_day*1000*(1/rho_juice))+(inoc*1000*(1/rho_w))+(sugar_md*(1/rho_sugar)); % Volume of mixture coming in per day fprintf('For each tonne of juice, %2.2f grams of sugar needs to be added. \nAs for the yast inoculum, 0.02 of juice volume is added, \n%4.2f tonnes in this case. The total volume to be mixed will be %4.2f m3/day.\n', sugar_m, inoc,vol_md) %% Fermentation - Fermentation will be run for 4months ferm = day_cran*vol_md; % Tonnes of mixture to be fermented % A fermentation vat must be 70% full for best fermentation results, 2 % tanks per day will be filled (small tanks are less expensive than larger % ones) ferm_tank = (vol_md/0.7)*(1/2); % Minimum requirement for fermentation tank ferm_tank = ceil(ferm_tank/10)*10; % Rounding to the nearest factor of 10 to size the fermentation tank fprintf('There will be a total of 40 tanks of a volume of %2.0f m3. The mixture will ferment for 4months.\n', ferm_tank)
Appendix 4 – Cranberry Liqueur Production: Feasibility of a Large Scale Production Plant Paul Deram December 03, 2010 Justin Dougherty Laura Gilbert Guillaume Lamoureux Cranberry Liqueur Production: Feasibility of a Large Scale Production Plant
Design 2 Project
Table of Contents Executive summary ................................................................................................................................ 31
Introduction .............................................................................................................................................. 31
Why Cranberries? ................................................................................................................................... 32
Handling ................................................................................................................................................. 33
Market ..................................................................................................................................................... 33
Health Benefits .................................................................................................................................... 33
Analysis of Production Methods ....................................................................................................... 33
Fermentation........................................................................................................................................ 34
Advantages and Disadvantages of Fermentation ................................................................. 35
Maceration ............................................................................................................................................ 37
Advantages and Disadvantages of Maceration ...................................................................... 37
Chosen mean of production ........................................................................................................... 38
Processing Plant Equipment and Layout (Addendum) .......................................................... 38
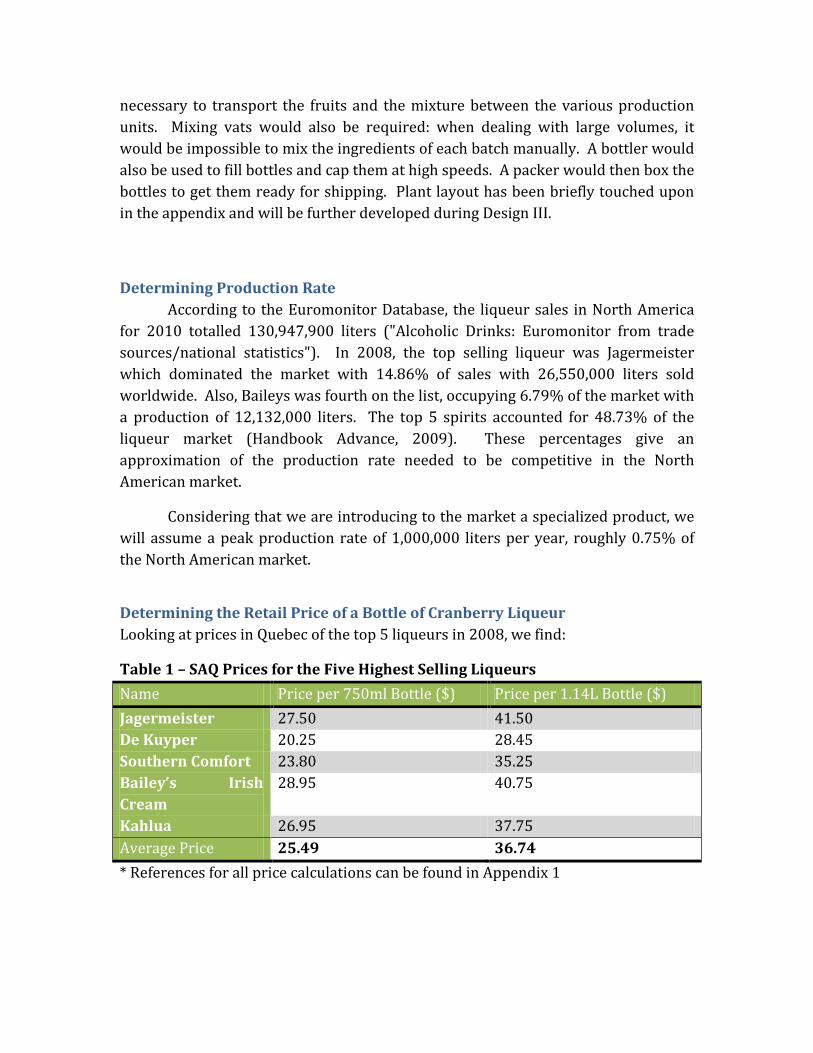
Determining Production Rate ............................................................................................................ 39
Determining the Retail Price of a Bottle of Cranberry Liqueur ........................................... 39
Table 1 – SAQ Prices for the Five Highest Selling Liqueurs .......................................... 39
Table 2 – Estimated Cranberry Liqueur Retail Price ....................................................... 40
Determining the Sale Price of a Bottle of Cranberry Liqueur .............................................. 40
Table 3 – Alcohol Tax Rates in Quebec ..................................................................................... 40
Table 4 – Revenue Generated from the Sale of a Cranberry Liqueur Bottle ...... 41
Yearly Production of Each Bottle Size ............................................................................................ 41
Yearly Revenue ........................................................................................................................................ 42
Table 5 – Yearly Revenue Generated by Sale of 1M Liters of Liqueur ................... 42
Variable Costs ........................................................................................................................................... 42
Table 6 – Variable Costs Generated by Production of 1M Liters of Liqueur ...... 43
Fixed Costs ................................................................................................................................................. 43
Table 7 – Annual Fixed Costs ......................................................................................................... 44
Annual Profit ............................................................................................................................................. 44
Table 8 – Yearly Expected Profit When Operation at Full Production Rate ....... 44
Tax Rates ..................................................................................................................................................... 44
Table 9 – Provincial and Federal Tax Rates .......................................................................... 44
Capital Expenditure................................................................................................................................ 45
Table 10 – Initial Investment ......................................................................................................... 45
Determining Expenses When Plant Is Not Operating at Full Capacity ............................ 45
Table 11 – Prices of Raw Materials per Unit with a 30% Production Rate ......... 45
Table 12 – Annual Cost of Production for the First 8 Years ......................................... 46
Calculating the Payback Period ......................................................................................................... 48
Sample Calculations ............................................................................................................................... 49
Depreciation ......................................................................................................................................... 49
Taxes ........................................................................................................................................................ 50
Interest .................................................................................................................................................... 50
Total Cash Flow ................................................................................................................................... 50
Conclusion .................................................................................................................................................. 51
Bibliography .............................................................................................................................................. 51
Appendix 2 – Cranberry Liqueur Production through a Fermentation Process . Error! Bookmark not defined. Appendix 3 – Cranberry Liqueur Production through Maceration .. Error! Bookmark not defined.
Executive summary Cranberries and liqueurs are a highly consumed product in the Quebec
market; however, the two have not yet been combined into a single entity. We have attempted to solve this situation by designing and assessing the elements required to operate a cranberry liqueur production plant. The analysis at hand will include a market study and an economic feasibility investigation allowing optimization of production rate parameters. Two production processes, fermentation and maceration, will be analyzed to determine the most efficient method.
Introduction A fruit liqueur is defined by French law as an alcoholic beverage containing
between 15 and 25% alcohol by volume and a minimum of 100 grams of sugar per liter. Any fruit liqueur containing more than 250 grams of sugar per liter can be called “crème”, with the exception of “crème de cassis” (black currant cream) that must contain at least 400 grams of sugar per liter (LE CONSEIL DES COMMUNAUTÉS EUROPÉENNES, 1989). The product emulated in this design project is Crème de Cassis de Dijon Lejay-Lagoute. Lejay-Lagoute is France’s biggest currant liqueur exporter and one of the world’s leaders in black current liqueur production, each year selling more than 10 million litres. This liqueur of international rank is found
in numerous cocktail recipes, is classically mixed with white wine or sparkling wine and also with a wide range of beers, from pale ales to dark stouts.
This Design II project is an evaluation of the feasibility of the mass-production of a similar product in Quebec, using a fruit familiar to the North-American palate and climate. Cranberries have many similarities with black currants. Their acidic taste and distinct tannins are probably well suited to the making of a similar liqueur. More is said about this fruit and the reasons why it was chosen to design a local production aimed at reaching the Quebec, Canadian and American markets.
There are two general methods used in the production of liqueurs, namely maceration and fermentation. Maceration is generally recognized as the simpler of the two. In the case of fruit liqueur making, maceration means that fruit, fruit pulp or fruit juice is blended with pure alcohol. Fermentation on the other hand, is a more complex process. A wine is first made from fruit juice inoculated with yeasts. A fortification is then needed if one is to produce liqueur. Most yeast used in the production of alcohol are either destroyed or incapacitated in concentration of approximately 18% alcohol by volume and more. The wine can either be distilled or blended with pure alcohol. Analyses of both methods were conducted in two other classes, Food Processing Engineering and Bio-Material Property. The goal of those assignments was to describe the necessary unit operations involved in the production of cranberry liqueur, starting from harvest and going up to the distribution of a finished product. Particular attention was to be given to the various food properties important to the successful completion of the process. The two projects can be found in this report’s appendices. Both are used as reference in the analysis of the two methods and guided the selection of fermentation as a mean of production. Technical as well as personal motives support the use of fermentation. The analysis is part of this report.
The most important part of the project resides in the feasibility assessment of the production. First a market study will support the use of cranberry for fermentation and the annual production volume selected, followed by a cost analysis of the final production line. A 10 to 12 year payback period was aimed at. This is a typical time span for a large scale production of this type.
Why Cranberries? The use of cranberries for liqueur making comes from the decision to create
a unique product that would not have to compete with similar products. After
analyzing cranberry properties, they were found to be a suitable fruit for liqueur production.
Handling Cranberry is a robust fruit which makes it easy to handle and simplifies the its storage requirement. One of the main characteristics of the fruit is that it has a lower density then water. Fields are therefore flooded during harvest in order for the fruits to float to the surface and be easily harvested. The fruits are destemmed, cleaned and placed in barrels (generally 100lbs) by specialised processing plants. Harvest happens annually from September to November.
Market Cranberries are one of the few native berries of North America to be commercially grown. The market is currently expanding but is primarily in North America. There are currently no cranberry based liqueurs on the market although cranberry flavoured beers are slowly gaining in popularity. Cranberry production is increasing and the United States Department of Agriculture reported that the production reached 7,350,000 barrels in the United States in 2009 and 80,000 barrels in Canada.
Health Benefits Reported health benefits of cranberries are still under investigation and not yet approved by the FDA (US Food and Drug Administration) or the CFIA (Canadian Food Inspection Agency). Studies show that cranberries contain high levels of proanthocyanidins which are believed to prevent bacteria from adhering to cell walls, helping in the prevention of stomach ulcers and urinary tract infections (Johnson-White et al, 2006). Another important health benefit of cranberries is their high concentration of antioxidants which is calculated to be five times higher than the average concentration found in foods (Halvorsen et al, 2006). It is uncertain whether the proanthocyanidins would remain in the liqueur but the antioxidants will still be present.
Analysis of Production Methods One of the most important assumptions made regarding this project is that
the product under study is of great quality, regardless of how it is produced. This might seem to be a simple assumption. The reality is that the production of a marketable liqueur or wine is very challenging. Wine or liqueur making is, for a lot of people, a great hobby. To an entire industry, it is a science. University departments are concerned solely with oenology (the science of wine making). Some attention will be given to general details regarding good liqueur making
practice, but not all factors affecting quality can be accounted for. The ultimate goal of this project is not to design the recipe and fabrication of a cranberry liqueur. Rather, it is to design a cranberry liqueur factory that, as much as it is deemed feasible, addresses, through its production, current energetic and environmental concerns.
The analysis is conducted as follows. First, the important steps regarding both types of production will be enumerated. Then, the advantages and disadvantages associated with each method will be listed. Finally, the arguments in favour of the selection of fermentation will be presented. Note that at this point, no quantitative economic analysis is drawn upon. Rather, the choice of fermentation is based on technical facts and qualitative arguments. The economic feasibility of this process will be demonstrated later. Had it been found impossible, a feasibility assessment of the maceration process would have been conducted.
Fermentation In Cranberry Liqueur Production through a Fermentation Process, a review of
wine, cider and fruit wine making is conducted in order to establish a possible way of producing cranberry liqueur. Note that, even though all three sections are concerned with the making of alcohol by fruit fermentation, the subject of each type is presented separately. Arguably, apple cider, perry and other fruit wines (sometimes referred to as country wines) are wines, i.e. the product of controlled fruit juice fermentation. Although conventionally, the term wine is reserved to grape wine, cider to apple wine and perry to pear wine. The product of other fruits ‘fermentation is referred to as fruit wine or country wine. Undoubtedly, wine is the most popular, and then follows cider. Books are dedicated entirely to the production of wine and cider. The making of fruit wine is not documented as thoroughly. Conceivably, the same chemical principles guiding the intricate making of wine could be emulated in the making of any other type of fruit wine. In the long run, the results would most probably be “fruitful”. The idea to be grasped here is that the general guidelines regarding the fermentation of fruits are applicable to all types of fruits and can successfully lead to the making of an alcoholic fruit beverage. The intricacies regarding each fruit are, on the other hand, important to consider in the making of a fine product. The final method and recipe chosen in Cranberry Liqueur Production Through a Fermentation Process come from an amalgam of principles found in all types of production.
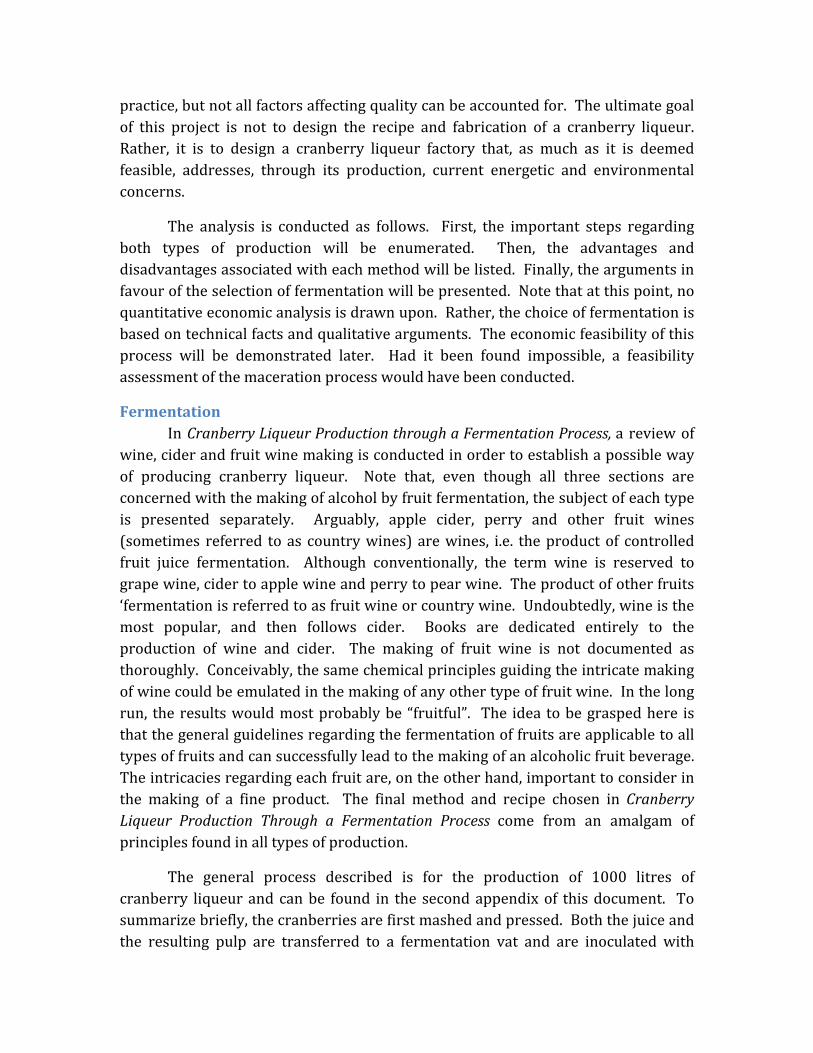
The general process described is for the production of 1000 litres of cranberry liqueur and can be found in the second appendix of this document. To summarize briefly, the cranberries are first mashed and pressed. Both the juice and the resulting pulp are transferred to a fermentation vat and are inoculated with
psychrophilic yeast (yeast able to digest sugars at relatively low temperature). Once the fermentation is complete (approximately 4 months later), the lees and the upper cake are removed. The mixture is transferred to a maturation vat. Bimonthly, the wine is racked off (the upper cake forming at the surface is removed). This operation enables a small amount of oxygen to enter the wine and facilitates malo-lactic fermentation, a chemical process responsible for the development of desirable and complex flavours. Maturation is conducted for approximately 7 months. Once over, the lees are removed one last time. The wine is then filtered and microfiltered. Alcohol and sugar are added in order to reach the desired concentration. Finally, 11 months after the beginning of the process, the liqueur is bottled.
Advantages and Disadvantages of Fermentation The advantages and disadvantages associated with using the fermentation method can all be linked to the activity and control of 1) the undesirable yeasts present before, during parts of, or throughout the fermentation, and 2) the yeast chosen to conduct the fermentation. In Cranberry Liqueur Production through a Fermentation Process, the following assumption was made to facilitate the design of a potential production:
“It is important to notice that no pasteurization or addition of sulphites is necessary to the production. The strong levels of alcohols that will be reached during fermentation are sufficient to disable the activity of any undesired indigenous yeasts. The underlined assumption is that the product of the early fermentation of indigenous yeast would not be considerable enough to negatively
Cranberries Mashing Pressing
Yeast and
fermentation sugar addition
Fermentatio
n Maturation, bi-monthly
racking
Filtration,
micro-filtration
Final rectification Bottling
affect the final flavour of the wine. This is possible due to the high efficiency of the selected commercial yeast in low temperature and its ability to resist high alcohol content. Most indigenous yeasts are activated in warmer conditions and are only able to produce and sustain low alcohol concentrations.”
The assumption made is also supported by the fact that a final microfiltration acts as pasteurization. The concern with this assumption is rather related to the initial presence of indigenous yeasts. Tests would need to be conducted in order to prove that even the slightest amount of fermentation by indigenous yeasts early in the process has consistently no impact on the quality of the final product. While this assumption may hold true, most wines produced today contain controlling agents like sulphites.
If fermentation is properly and knowledgably controlled, the flavours produced by the digestion of sugars are believed to be rich and appealing to wine lovers. A quick example taken from oenology can clarify what is meant here. Particular flavours often sensed during wine tasting are coriander or spices like cinnamon and clove. This does not mean of course that these particular ingredients were used in the production. The presence of these flavours is the result of complex chemical reactions associated with fermentation.
Using fermentation to produce a liqueur also reduces the amount of pure alcohol purchased. The strain of yeast used in the article can thrive in concentration of 18% alcohol by volume.
Finally, the apparatus needed for the making of liqueur (in this case fortified wine) allows for a greater variety of production. If the company would ultimately want to diversify its production, the same facility could produce various types of wine, beer as well as carbonated or non-carbonated juice. In order to produce spirits, distillation equipment would be required.
Of course, fermentation for wine production is a sensitive and lengthy process. Particular attentions need to be considered regarding the chemical composition of the mixture inoculated as well as the temperature of the fermentation through all steps of the process. Fermentation also involves multiple. Both these factors have an important impact on the level of qualification required from the employees involved in the supervision of the production and total labour required. Depending on the quality and the level of standardisation desired, the machinery needed can be specialized and costly. As an example, if a variation of a few degrees can negatively impact the quality of the product, precise heating equipment is required for monitoring the process. Similarly, if subtle chemical variations can affect the properties of the final product, the monitoring and
rectification needed to insure the production of a standard liqueur is necessary. Once again, these operations require precise tools and knowledgeable technicians if they are to be accomplished successfully (Deram, P., & Lamoureux, G. (2010)).
Maceration In Cranberry Liqueur production through Maceration, a review of current
technological methods in fruit maceration in pure alcohol is conducted, in order to assess the feasibility of creating cranberry liqueur through that process. It was found that the alcoholic maceration of cranberries would potentially produce a high quality liqueur, with a high consumer appeal.
Throughout the paper, two maceration techniques are studied, in order to achieve a more efficient overall process. The final technique used consists of the more linear method, in which a higher efficiency and product quality are achieved. The main difference between the two processes is the localization of the enzymatic maceration in the process.
Enzymatic maceration is a process involving the breakdown of cellular walls by enzymes prior to a press operation, in order to increase the efficiency of said press. It was found in the literature that this process is mostly effective before the first pressing process, thus explaining why the second process analysed was chosen. Also, removing a certain amount of the product line to be treated separately and then re-entered into the main feed line would most likely skew the homogeneity of the overall product.
The final production line included a crusher, to break the fruit skin and expose the pulp, followed by the enzymatic maceration. Once these two unit operations have gone through, the fruit pulp will be most highly exposed, with a large percentage of the cell walls broken down. Therefore, adding the alcohol in the next step gives the highest penetration rate of alcohol in the pulp. The alcohol will then pick up the juice and the vitamins from the fruit. Sugar is also added at this stage, and after a few weeks of maceration, the product can be pressed. The Press will separate the fruit liqueur from the fruit pulp.
Methods were discussed in order to properly handle the organic waste produced during this process, but this is not the not the focus of our design. The final product can be bottled directly after the pressing stage, and sold on the market.
Advantages and Disadvantages of Maceration One of the main advantages of maceration over fermentation is the greatly reduced processing time needed in the process. A full maceration, from fresh fruit to finished liqueur, can be done in less than four weeks, while the fermentation
process requires months of fermentation followed by more than double this time in maturation of the alcohol. Due to the relative simplicity of the process, much less labour and specialized labour is needed in the maturation process than in the fermentation process.
Another advantage is discussed in the Cranberry Liqueur production through Maceration paper, and involves the health benefits found in fruits. Anthocyanins are arguably the main health enhancing components of cranberries, and are not broken down by alcohol. They are on the other hand oxidized during the maturation time needed in the fermentation process, and therefore are present in much higher quantities in a maturation based liqueur.
Disadvantages do arise, notably due to the much higher costs. In liqueur production through fermentation, over half of the costs of the primary materials come from adding pure alcohol. In maceration, since the entire volume of alcohol comes from adding pure alcohol, instead of getting most of the alcohol from the yeasts, the price rises considerably.
Also, the depth and the variability of flavours in the final product tend to be blander in a maceration base liqueur, since most of the flavours in fermentation based liqueur come from the yeasts. This can give a lesser quality to the final product (Armstrong, S., Deram, P., Thompson, R., & Yank, A. (2010)).
Chosen mean of production First, due to the fact that cranberries are only harvested during the months of
October and November, we can only get fresh cranberries for a couple of months of the year. Our production must therefore occur during these months. Time is therefore not an issue, giving a higher weight to the fermentation process than the maceration. Second, the versatility provided by the fermentation process was a key factor in the final decision. The ability to expand the production horizon more readily is beneficial to long term operation plans. Third, the quality of the fermented product is proven to be higher than that of the macerated product, due to the development of more complex flavours. Finally, fermentation is a more interesting process as the final product is greatly influenced by the manufacturers decisions and monitoring processes, therefore bringing in more depth to the process.
Processing Plant Equipment and Layout (Addendum) Multiple machines are needed for the processing of cranberry liqueur. On top of the equipment already mentioned, conveyer belts and pumps would be
necessary to transport the fruits and the mixture between the various production units. Mixing vats would also be required: when dealing with large volumes, it would be impossible to mix the ingredients of each batch manually. A bottler would also be used to fill bottles and cap them at high speeds. A packer would then box the bottles to get them ready for shipping. Plant layout has been briefly touched upon in the appendix and will be further developed during Design III.
Determining Production Rate According to the Euromonitor Database, the liqueur sales in North America
for 2010 totalled 130,947,900 liters ("Alcoholic Drinks: Euromonitor from trade sources/national statistics"). In 2008, the top selling liqueur was Jagermeister which dominated the market with 14.86% of sales with 26,550,000 liters sold worldwide. Also, Baileys was fourth on the list, occupying 6.79% of the market with a production of 12,132,000 liters. The top 5 spirits accounted for 48.73% of the liqueur market (Handbook Advance, 2009). These percentages give an approximation of the production rate needed to be competitive in the North American market.
Considering that we are introducing to the market a specialized product, we will assume a peak production rate of 1,000,000 liters per year, roughly 0.75% of the North American market.
Determining the Retail Price of a Bottle of Cranberry Liqueur Looking at prices in Quebec of the top 5 liqueurs in 2008, we find:
Table 1 – SAQ Prices for the Five Highest Selling Liqueurs Name Price per 750ml Bottle ($) Price per 1.14L Bottle ($) Jagermeister 27.50 41.50 De Kuyper 20.25 28.45 Southern Comfort 23.80 35.25 Bailey’s Irish Cream
28.95 40.75
Kahlua 26.95 37.75 Average Price 25.49 36.74 * References for all price calculations can be found in Appendix 1
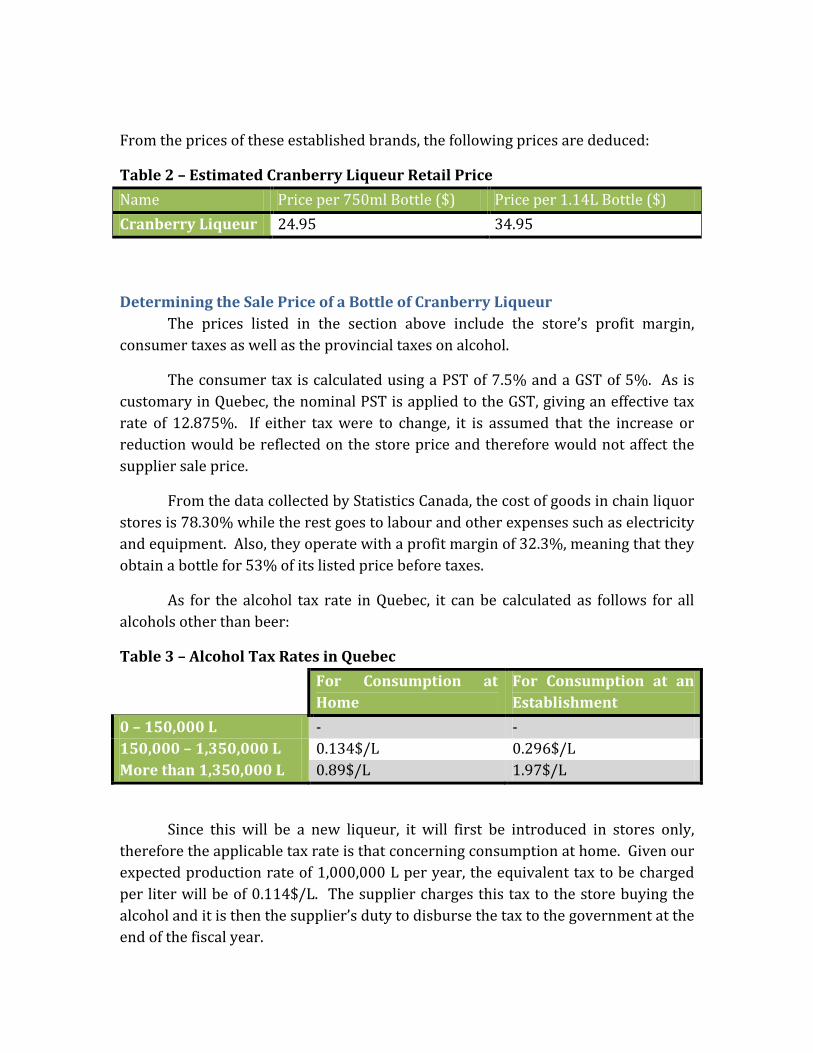
From the prices of these established brands, the following prices are deduced:
Table 2 – Estimated Cranberry Liqueur Retail Price Name Price per 750ml Bottle ($) Price per 1.14L Bottle ($) Cranberry Liqueur 24.95 34.95
Determining the Sale Price of a Bottle of Cranberry Liqueur The prices listed in the section above include the store’s profit margin, consumer taxes as well as the provincial taxes on alcohol.
The consumer tax is calculated using a PST of 7.5% and a GST of 5%. As is customary in Quebec, the nominal PST is applied to the GST, giving an effective tax rate of 12.875%. If either tax were to change, it is assumed that the increase or reduction would be reflected on the store price and therefore would not affect the supplier sale price.
From the data collected by Statistics Canada, the cost of goods in chain liquor stores is 78.30% while the rest goes to labour and other expenses such as electricity and equipment. Also, they operate with a profit margin of 32.3%, meaning that they obtain a bottle for 53% of its listed price before taxes.
As for the alcohol tax rate in Quebec, it can be calculated as follows for all alcohols other than beer:
Table 3 – Alcohol Tax Rates in Quebec For Consumption at
Home For Consumption at an Establishment
0 – 150,000 L - - 150,000 – 1,350,000 L 0.134$/L 0.296$/L More than 1,350,000 L 0.89$/L 1.97$/L
Since this will be a new liqueur, it will first be introduced in stores only, therefore the applicable tax rate is that concerning consumption at home. Given our expected production rate of 1,000,000 L per year, the equivalent tax to be charged per liter will be of 0.114$/L. The supplier charges this tax to the store buying the alcohol and it is then the supplier’s duty to disburse the tax to the government at the end of the fiscal year.
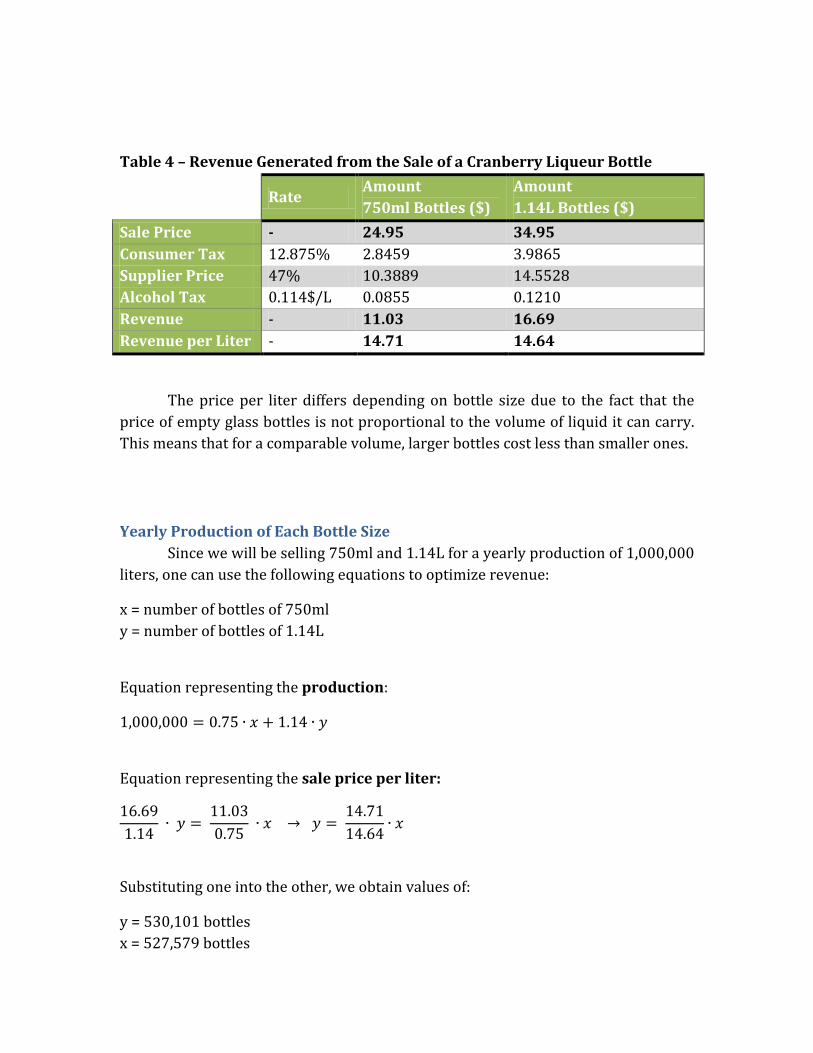
Table 4 – Revenue Generated from the Sale of a Cranberry Liqueur Bottle
Rate Amount 750ml Bottles ($)
Amount 1.14L Bottles ($)
Sale Price - 24.95 34.95 Consumer Tax 12.875% 2.8459 3.9865 Supplier Price 47% 10.3889 14.5528 Alcohol Tax 0.114$/L 0.0855 0.1210 Revenue - 11.03 16.69 Revenue per Liter - 14.71 14.64
The price per liter differs depending on bottle size due to the fact that the price of empty glass bottles is not proportional to the volume of liquid it can carry. This means that for a comparable volume, larger bottles cost less than smaller ones.
Yearly Production of Each Bottle Size Since we will be selling 750ml and 1.14L for a yearly production of 1,000,000
liters, one can use the following equations to optimize revenue:
x = number of bottles of 750ml y = number of bottles of 1.14L
Equation representing the production:
1,000,000 = 0.75 ∙ 𝑥 + 1.14 ∙ 𝑦
Equation representing the sale price per liter:
16.691.14
∙ 𝑦 = 11.030.75
∙ 𝑥 → 𝑦 = 14.7114.64
∙ 𝑥
Substituting one into the other, we obtain values of:
y = 530,101 bottles x = 527,579 bottles
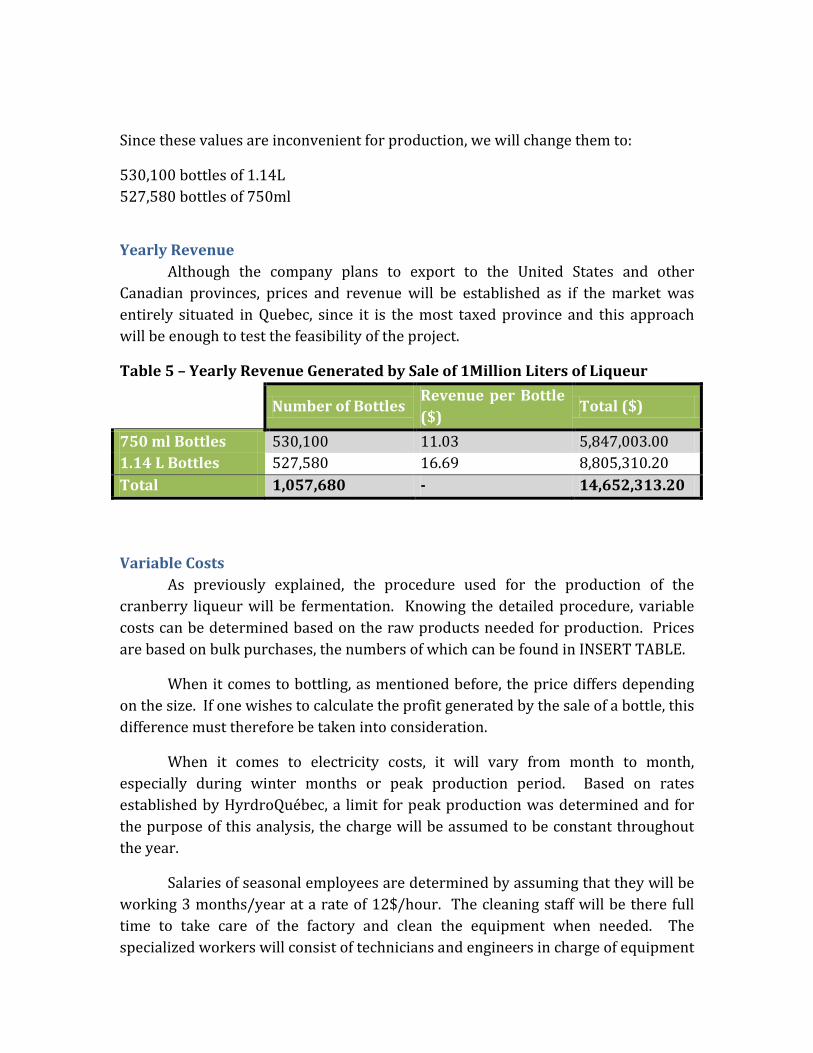
Since these values are inconvenient for production, we will change them to:
530,100 bottles of 1.14L 527,580 bottles of 750ml
Yearly Revenue Although the company plans to export to the United States and other
Canadian provinces, prices and revenue will be established as if the market was entirely situated in Quebec, since it is the most taxed province and this approach will be enough to test the feasibility of the project.
Table 5 – Yearly Revenue Generated by Sale of 1Million Liters of Liqueur
Number of Bottles Revenue per Bottle ($)
Total ($)
750 ml Bottles 530,100 11.03 5,847,003.00 1.14 L Bottles 527,580 16.69 8,805,310.20 Total 1,057,680 - 14,652,313.20
Variable Costs As previously explained, the procedure used for the production of the cranberry liqueur will be fermentation. Knowing the detailed procedure, variable costs can be determined based on the raw products needed for production. Prices are based on bulk purchases, the numbers of which can be found in INSERT TABLE.
When it comes to bottling, as mentioned before, the price differs depending on the size. If one wishes to calculate the profit generated by the sale of a bottle, this difference must therefore be taken into consideration.
When it comes to electricity costs, it will vary from month to month, especially during winter months or peak production period. Based on rates established by HyrdroQuébec, a limit for peak production was determined and for the purpose of this analysis, the charge will be assumed to be constant throughout the year.
Salaries of seasonal employees are determined by assuming that they will be working 3 months/year at a rate of 12$/hour. The cleaning staff will be there full time to take care of the factory and clean the equipment when needed. The specialized workers will consist of technicians and engineers in charge of equipment
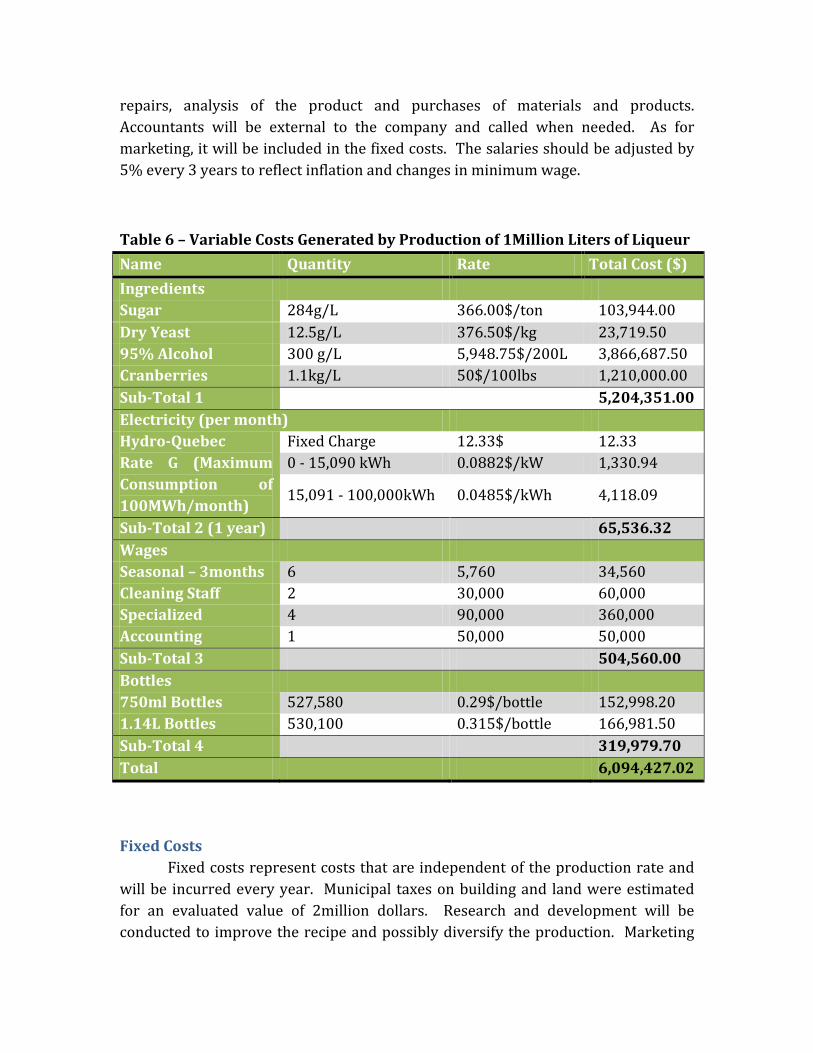
repairs, analysis of the product and purchases of materials and products. Accountants will be external to the company and called when needed. As for marketing, it will be included in the fixed costs. The salaries should be adjusted by 5% every 3 years to reflect inflation and changes in minimum wage.
Table 6 – Variable Costs Generated by Production of 1Million Liters of Liqueur Name Quantity Rate Total Cost ($) Ingredients Sugar 284g/L 366.00$/ton 103,944.00 Dry Yeast 12.5g/L 376.50$/kg 23,719.50 95% Alcohol 300 g/L 5,948.75$/200L 3,866,687.50 Cranberries 1.1kg/L 50$/100lbs 1,210,000.00 Sub-Total 1 5,204,351.00 Electricity (per month) Hydro-Quebec Rate G (Maximum Consumption of 100MWh/month)
Fixed Charge 12.33$ 12.33 0 - 15,090 kWh 0.0882$/kW 1,330.94
15,091 - 100,000kWh 0.0485$/kWh 4,118.09
Sub-Total 2 (1 year) 65,536.32 Wages Seasonal – 3months 6 5,760 34,560 Cleaning Staff 2 30,000 60,000 Specialized 4 90,000 360,000 Accounting 1 50,000 50,000 Sub-Total 3 504,560.00 Bottles 750ml Bottles 527,580 0.29$/bottle 152,998.20 1.14L Bottles 530,100 0.315$/bottle 166,981.50 Sub-Total 4 319,979.70 Total 6,094,427.02
Fixed Costs Fixed costs represent costs that are independent of the production rate and will be incurred every year. Municipal taxes on building and land were estimated for an evaluated value of 2million dollars. Research and development will be conducted to improve the recipe and possibly diversify the production. Marketing
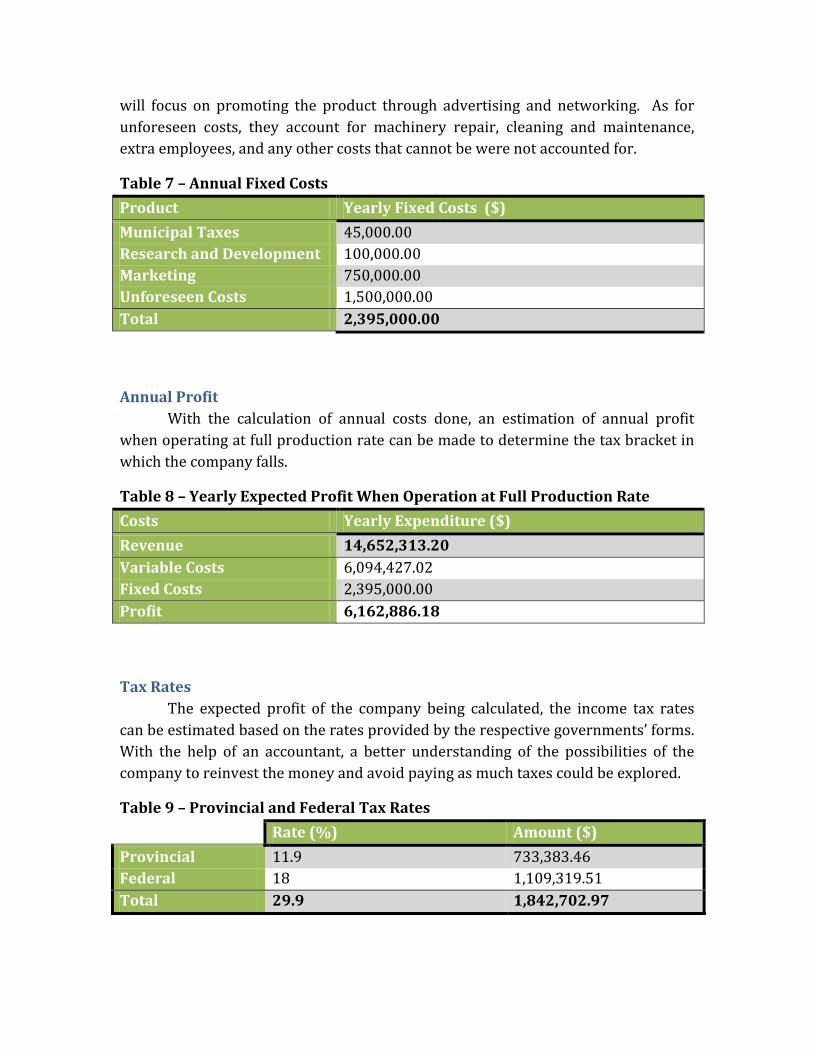
will focus on promoting the product through advertising and networking. As for unforeseen costs, they account for machinery repair, cleaning and maintenance, extra employees, and any other costs that cannot be were not accounted for.
Table 7 – Annual Fixed Costs Product Yearly Fixed Costs ($) Municipal Taxes 45,000.00 Research and Development 100,000.00 Marketing 750,000.00 Unforeseen Costs 1,500,000.00 Total 2,395,000.00
Annual Profit With the calculation of annual costs done, an estimation of annual profit
when operating at full production rate can be made to determine the tax bracket in which the company falls.
Table 8 – Yearly Expected Profit When Operation at Full Production Rate Costs Yearly Expenditure ($) Revenue 14,652,313.20 Variable Costs 6,094,427.02 Fixed Costs 2,395,000.00 Profit 6,162,886.18
Tax Rates The expected profit of the company being calculated, the income tax rates can be estimated based on the rates provided by the respective governments’ forms. With the help of an accountant, a better understanding of the possibilities of the company to reinvest the money and avoid paying as much taxes could be explored.
Table 9 – Provincial and Federal Tax Rates Rate (%) Amount ($) Provincial 11.9 733,383.46 Federal 18 1,109,319.51 Total 29.9 1,842,702.97
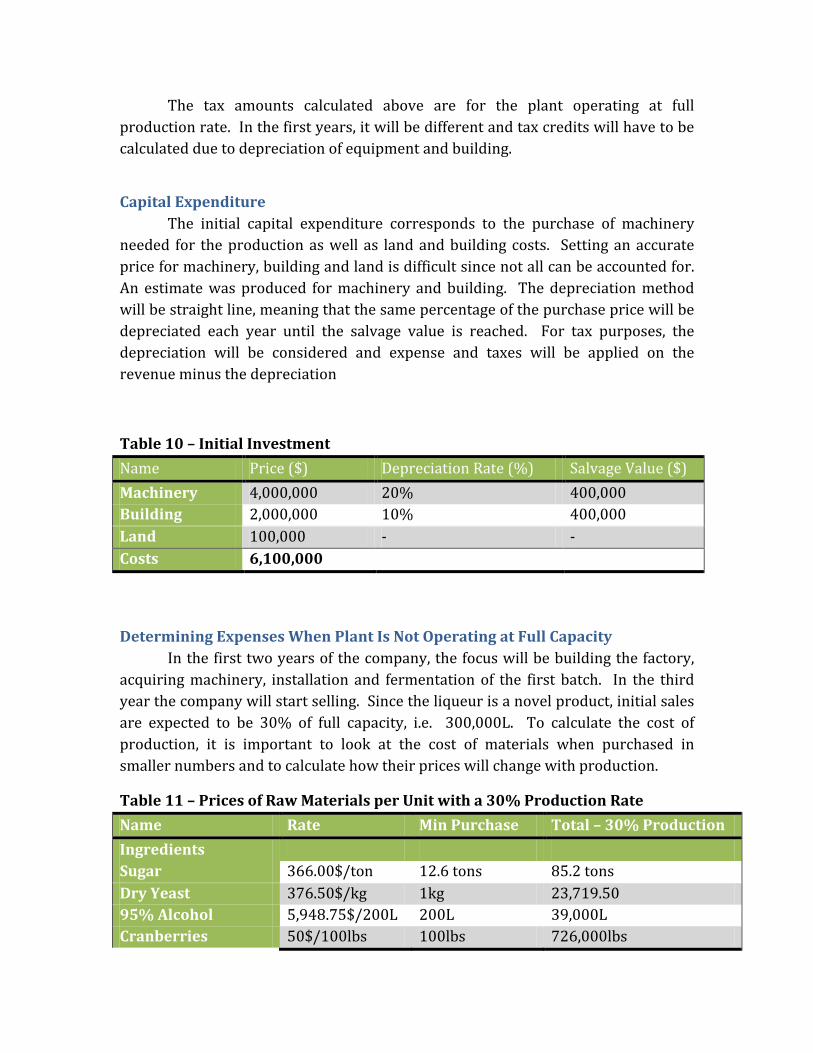
The tax amounts calculated above are for the plant operating at full production rate. In the first years, it will be different and tax credits will have to be calculated due to depreciation of equipment and building.
Capital Expenditure The initial capital expenditure corresponds to the purchase of machinery needed for the production as well as land and building costs. Setting an accurate price for machinery, building and land is difficult since not all can be accounted for. An estimate was produced for machinery and building. The depreciation method will be straight line, meaning that the same percentage of the purchase price will be depreciated each year until the salvage value is reached. For tax purposes, the depreciation will be considered and expense and taxes will be applied on the revenue minus the depreciation
Table 10 – Initial Investment Name Price ($) Depreciation Rate (%) Salvage Value ($) Machinery 4,000,000 20% 400,000 Building 2,000,000 10% 400,000 Land 100,000 - - Costs 6,100,000
Determining Expenses When Plant Is Not Operating at Full Capacity In the first two years of the company, the focus will be building the factory,
acquiring machinery, installation and fermentation of the first batch. In the third year the company will start selling. Since the liqueur is a novel product, initial sales are expected to be 30% of full capacity, i.e. 300,000L. To calculate the cost of production, it is important to look at the cost of materials when purchased in smaller numbers and to calculate how their prices will change with production.
Table 11 – Prices of Raw Materials per Unit with a 30% Production Rate Name Rate Min Purchase Total – 30% Production Ingredients Sugar 366.00$/ton 12.6 tons 85.2 tons Dry Yeast 376.50$/kg 1kg 23,719.50 95% Alcohol 5,948.75$/200L 200L 39,000L Cranberries 50$/100lbs 100lbs 726,000lbs
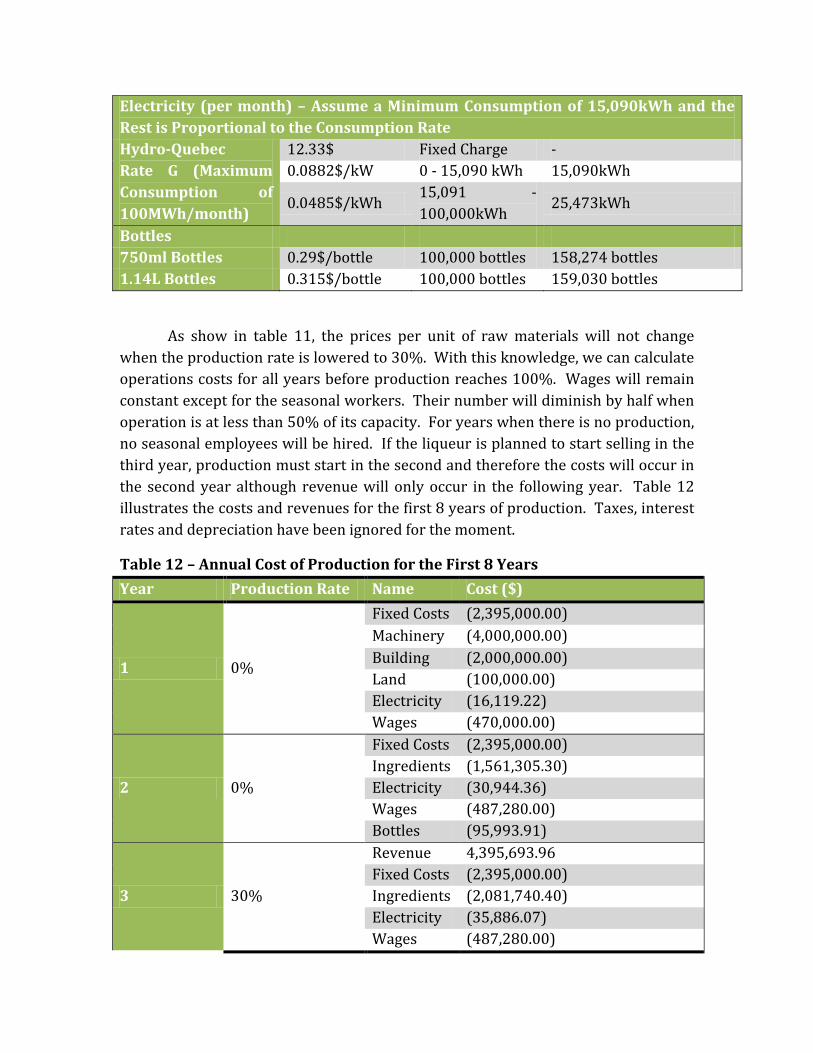
Electricity (per month) – Assume a Minimum Consumption of 15,090kWh and the Rest is Proportional to the Consumption Rate Hydro-Quebec Rate G (Maximum Consumption of 100MWh/month)
12.33$ Fixed Charge - 0.0882$/kW 0 - 15,090 kWh 15,090kWh
0.0485$/kWh 15,091 - 100,000kWh
25,473kWh
Bottles 750ml Bottles 0.29$/bottle 100,000 bottles 158,274 bottles 1.14L Bottles 0.315$/bottle 100,000 bottles 159,030 bottles
As show in table 11, the prices per unit of raw materials will not change when the production rate is lowered to 30%. With this knowledge, we can calculate operations costs for all years before production reaches 100%. Wages will remain constant except for the seasonal workers. Their number will diminish by half when operation is at less than 50% of its capacity. For years when there is no production, no seasonal employees will be hired. If the liqueur is planned to start selling in the third year, production must start in the second and therefore the costs will occur in the second year although revenue will only occur in the following year. Table 12 illustrates the costs and revenues for the first 8 years of production. Taxes, interest rates and depreciation have been ignored for the moment.
Table 12 – Annual Cost of Production for the First 8 Years Year Production Rate Name Cost ($)
1 0%
Fixed Costs (2,395,000.00) Machinery (4,000,000.00) Building (2,000,000.00) Land (100,000.00) Electricity (16,119.22) Wages (470,000.00)
2 0%
Fixed Costs (2,395,000.00) Ingredients (1,561,305.30) Electricity (30,944.36) Wages (487,280.00) Bottles (95,993.91)
3 30%
Revenue 4,395,693.96 Fixed Costs (2,395,000.00) Ingredients (2,081,740.40) Electricity (35,886.07) Wages (487,280.00)
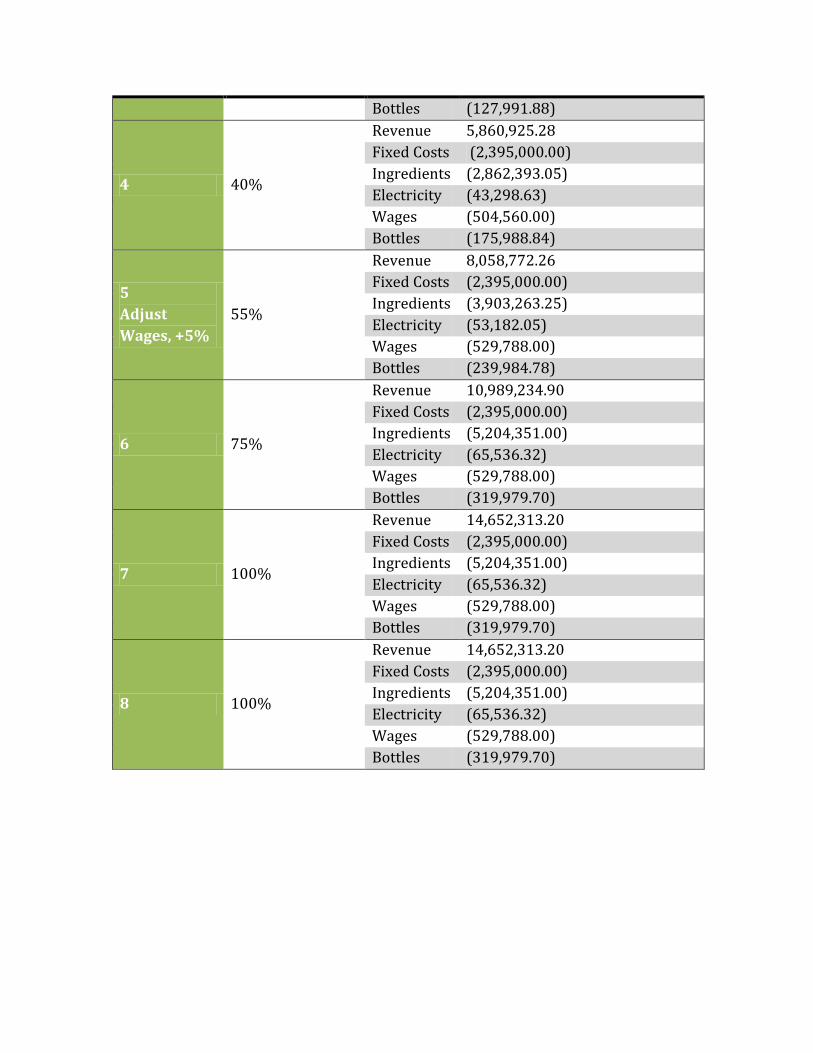
Bottles (127,991.88)
4 40%
Revenue 5,860,925.28 Fixed Costs (2,395,000.00) Ingredients (2,862,393.05) Electricity (43,298.63) Wages (504,560.00) Bottles (175,988.84)
5 Adjust Wages, +5%
55%
Revenue 8,058,772.26 Fixed Costs (2,395,000.00) Ingredients (3,903,263.25) Electricity (53,182.05) Wages (529,788.00) Bottles (239,984.78)
6 75%
Revenue 10,989,234.90 Fixed Costs (2,395,000.00) Ingredients (5,204,351.00) Electricity (65,536.32) Wages (529,788.00) Bottles (319,979.70)
7 100%
Revenue 14,652,313.20 Fixed Costs (2,395,000.00) Ingredients (5,204,351.00) Electricity (65,536.32) Wages (529,788.00) Bottles (319,979.70)
8 100%
Revenue 14,652,313.20 Fixed Costs (2,395,000.00) Ingredients (5,204,351.00) Electricity (65,536.32) Wages (529,788.00) Bottles (319,979.70)
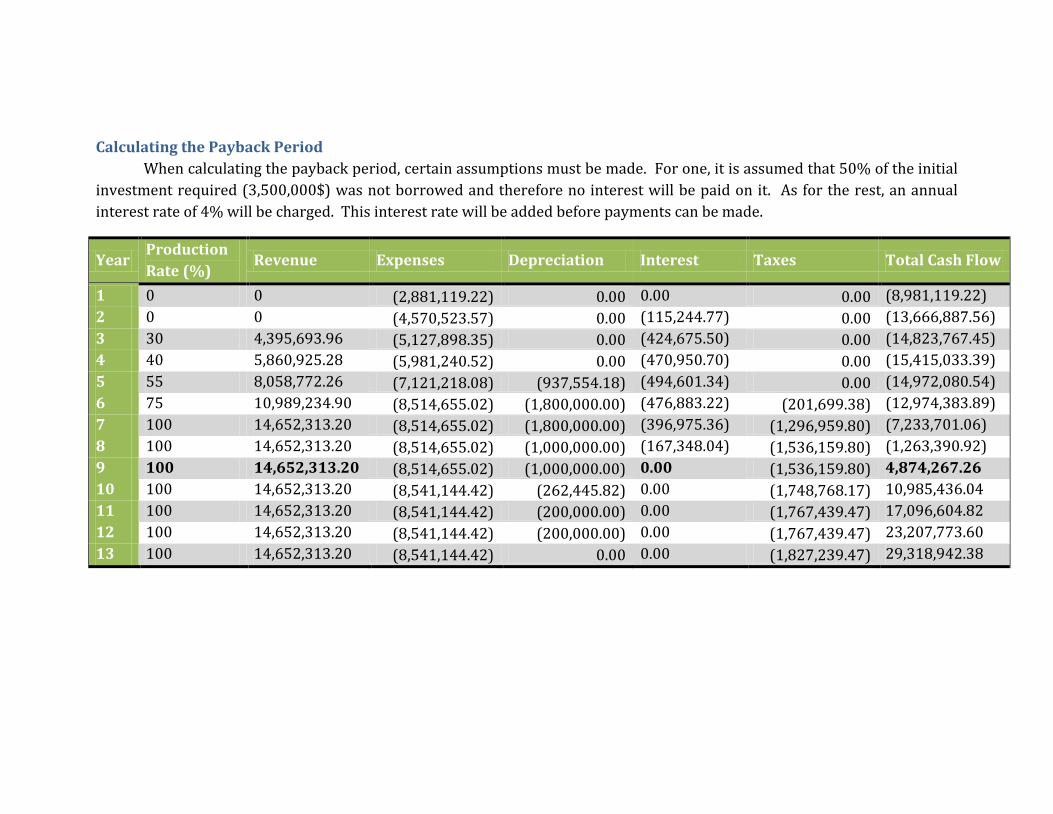
Calculating the Payback Period When calculating the payback period, certain assumptions must be made. For one, it is assumed that 50% of the initial investment required (3,500,000$) was not borrowed and therefore no interest will be paid on it. As for the rest, an annual interest rate of 4% will be charged. This interest rate will be added before payments can be made.
Year Production Rate (%)
Revenue Expenses Depreciation Interest Taxes Total Cash Flow
1 0 0 (2,881,119.22) 0.00 0.00 0.00 (8,981,119.22) 2 0 0 (4,570,523.57) 0.00 (115,244.77) 0.00 (13,666,887.56) 3 30 4,395,693.96 (5,127,898.35) 0.00 (424,675.50) 0.00 (14,823,767.45) 4 40 5,860,925.28 (5,981,240.52) 0.00 (470,950.70) 0.00 (15,415,033.39) 5 55 8,058,772.26 (7,121,218.08) (937,554.18) (494,601.34) 0.00 (14,972,080.54) 6 75 10,989,234.90 (8,514,655.02) (1,800,000.00) (476,883.22) (201,699.38) (12,974,383.89) 7 100 14,652,313.20 (8,514,655.02) (1,800,000.00) (396,975.36) (1,296,959.80) (7,233,701.06) 8 100 14,652,313.20 (8,514,655.02) (1,000,000.00) (167,348.04) (1,536,159.80) (1,263,390.92) 9 100 14,652,313.20 (8,514,655.02) (1,000,000.00) 0.00 (1,536,159.80) 4,874,267.26 10 100 14,652,313.20 (8,541,144.42) (262,445.82) 0.00 (1,748,768.17) 10,985,436.04 11 100 14,652,313.20 (8,541,144.42) (200,000.00) 0.00 (1,767,439.47) 17,096,604.82 12 100 14,652,313.20 (8,541,144.42) (200,000.00) 0.00 (1,767,439.47) 23,207,773.60 13 100 14,652,313.20 (8,541,144.42) 0.00 0.00 (1,827,239.47) 29,318,942.38
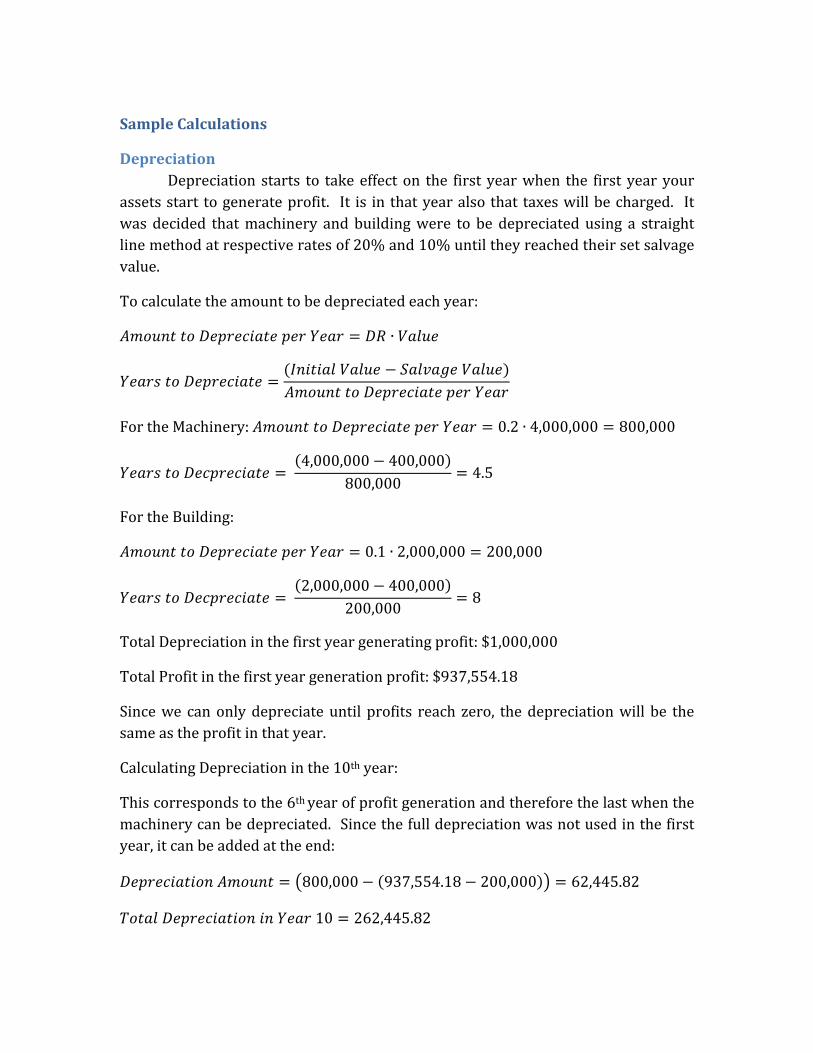
Sample Calculations
Depreciation Depreciation starts to take effect on the first year when the first year your
assets start to generate profit. It is in that year also that taxes will be charged. It was decided that machinery and building were to be depreciated using a straight line method at respective rates of 20% and 10% until they reached their set salvage value.
To calculate the amount to be depreciated each year:
𝐴𝑚𝑜𝑢𝑛𝑡 𝑡𝑜 𝐷𝑒𝑝𝑟𝑒𝑐𝑖𝑎𝑡𝑒 𝑝𝑒𝑟 𝑌𝑒𝑎𝑟 = 𝐷𝑅 ∙ 𝑉𝑎𝑙𝑢𝑒
𝑌𝑒𝑎𝑟𝑠 𝑡𝑜 𝐷𝑒𝑝𝑟𝑒𝑐𝑖𝑎𝑡𝑒 =(𝐼𝑛𝑖𝑡𝑖𝑎𝑙 𝑉𝑎𝑙𝑢𝑒 − 𝑆𝑎𝑙𝑣𝑎𝑔𝑒 𝑉𝑎𝑙𝑢𝑒)𝐴𝑚𝑜𝑢𝑛𝑡 𝑡𝑜 𝐷𝑒𝑝𝑟𝑒𝑐𝑖𝑎𝑡𝑒 𝑝𝑒𝑟 𝑌𝑒𝑎𝑟
For the Machinery: 𝐴𝑚𝑜𝑢𝑛𝑡 𝑡𝑜 𝐷𝑒𝑝𝑟𝑒𝑐𝑖𝑎𝑡𝑒 𝑝𝑒𝑟 𝑌𝑒𝑎𝑟 = 0.2 ∙ 4,000,000 = 800,000
𝑌𝑒𝑎𝑟𝑠 𝑡𝑜 𝐷𝑒𝑐𝑝𝑟𝑒𝑐𝑖𝑎𝑡𝑒 = (4,000,000 − 400,000)
800,000= 4.5
For the Building:
𝐴𝑚𝑜𝑢𝑛𝑡 𝑡𝑜 𝐷𝑒𝑝𝑟𝑒𝑐𝑖𝑎𝑡𝑒 𝑝𝑒𝑟 𝑌𝑒𝑎𝑟 = 0.1 ∙ 2,000,000 = 200,000
𝑌𝑒𝑎𝑟𝑠 𝑡𝑜 𝐷𝑒𝑐𝑝𝑟𝑒𝑐𝑖𝑎𝑡𝑒 = (2,000,000 − 400,000)
200,000= 8
Total Depreciation in the first year generating profit: $1,000,000
Total Profit in the first year generation profit: $937,554.18
Since we can only depreciate until profits reach zero, the depreciation will be the same as the profit in that year.
Calculating Depreciation in the 10th year:
This corresponds to the 6th year of profit generation and therefore the last when the machinery can be depreciated. Since the full depreciation was not used in the first year, it can be added at the end:
𝐷𝑒𝑝𝑟𝑒𝑐𝑖𝑎𝑡𝑖𝑜𝑛 𝐴𝑚𝑜𝑢𝑛𝑡 = �800,000 − (937,554.18 − 200,000)� = 62,445.82
𝑇𝑜𝑡𝑎𝑙 𝐷𝑒𝑝𝑟𝑒𝑐𝑖𝑎𝑡𝑖𝑜𝑛 𝑖𝑛 𝑌𝑒𝑎𝑟 10 = 262,445.82
Taxes The taxes are applied to:
𝑅𝑒𝑣𝑒𝑛𝑢𝑒 − (𝐸𝑥𝑝𝑒𝑛𝑠𝑒𝑠 + 𝐷𝑒𝑝𝑟𝑒𝑐𝑖𝑎𝑡𝑖𝑜𝑛)
At a fixed rate of t=0.299
Therefore taxes in the 7th year are calculated to be:
𝑇𝑎𝑥𝑒𝑠 𝑖𝑛 𝑡ℎ𝑒 7𝑡ℎ 𝑦𝑒𝑎𝑟 = 0.299 ∙ [10,989,234.90 − (8,514,655.02 + 1,000,000)]
= 440,99.38
Interest The interest rate is fixed at i=4% annually and is applied to all negative total
cash flows (TCF) excluding the half of the initial capital expenditure. Interest in a given year corresponds to the interest rate applied to the total cash flow of the previous year.
To find the interest in year x:
𝐼𝑛𝑡𝑒𝑟𝑒𝑠𝑡𝑥 = 0.04 ∙ (𝑇𝐶𝐹𝑥−1 + 0.5 ∙ 6,100,000)
In the 6th year we could have:
𝐼𝑛𝑡𝑒𝑟𝑒𝑠𝑡 = 0.04 ∙ [(−14,972,080.54) + 0.5 ∙ 6,100,000] = 476,883.22
Total Cash Flow The total cash flow in year x corresponds to:
𝑇𝐶𝐹𝑥 = 𝑇𝐶𝐹𝑥−1 + 𝑅𝑒𝑣𝑒𝑛𝑢𝑒𝑥 − 𝐸𝑥𝑝𝑒𝑛𝑠𝑒𝑠𝑥 − 𝐼𝑛𝑡𝑒𝑟𝑒𝑠𝑡𝑥 − 𝑇𝑎𝑥𝑒𝑠𝑥
In year 6, we have a total cash flow of:
𝑇𝐶𝐹6= (−14,972,080.54) + 10,989,234.00 − 8,514,655.02 − 476,883.22 − 440,899.38
= −12,974,383.89
Conclusion
This design project showed that cranberry, because of its multiple properties and overall popularity in North-America, is an excellent fruit to use in the production and commercialisation of liqueur. It was demonstrated that given the production goals that were set, and to the extent of the economic assumptions that were made, the mass-production of cranberry liqueur using fermentation is feasible in the province of Quebec.
In Design III, the facility required to conduct this production will be designed. Throughout this elaboration, the main focus will be to minimize the plant’s energy requirement and its impact on the environment.
Bibliography Cranberry. (2010, November 24). Retrieved November 24, 2010, from Wikipedia:
http://en.wikipedia.org/wiki/Cranberry
Cranberry Properties. (2010, June 28). Retrieved November 24, 2010, from Wolfram Alpha: http://www.wolframalpha.com/entities/common_materials/cranberries/y9/cn/xa
Crème de Cassis. (2010, November 17). Retrieved November 25, 2010, from Wikipedia France: http://fr.wikipedia.org/wiki/Cr%C3%A8me_de_cassis
Armstrong, S., Deram, P., Thompson, R., & Yank, A. (2010). Alcohol and Cranberry Maceration. Montreal.
Arthey, D., & Ashurst, P. R. (2001). Fruit Processing: Nutrition, Products, and Qualitity Management. Second Edition. Gaithersburg: Aspen Publishers.
Cali, S., & Aydin, C. (2004). Some physico-mechanic properties of cherry laurel (Prunus lauracerasus L.) fruits. Journal of Food Engineering, 65:145-150.
Deram, P., & Lamoureux, G. (2010). Cranberry Liqueur Production Through a Fermentation Process. Montreal.
Holstein-Brennereien. (2010). Retrieved November 25, 2010, from Holstein-Brennereien: http://holstein-brennereien.com/uploads/media/Holstein_Zubehoer_e.pdf
Hornsey, I. (2007). The Chemistry and Biology of Wine Making. Cambridge: The Royal Society of Chemistry.
LE CONSEIL DES COMMUNAUTÉS EUROPÉENNES. (1989, May 29). RÈGLEMENT (CEE) N° 1576/89. Règles générales relatives à la définition, à la désignation et à la présentation des boissons spiritueuses .
Özgen, M., Workmaster, B. A., & Palta, J. P. (n.d.). Relationship between Fruit Color (ripening) and Shelf Life of Cranberries: Physiological and Anatomical Explanation. Madison, WI: Department of Horticulture, University of Wisconsin.
Top Cordial and Liqueur Brands, 2008. (2011). [828]. (2010).
Handbook Advance, Annual 2009, p.62
Johnson-White B, Buquo L, Zeinali M, Ligler FS. (2006). Prevention of nonspecific bacterial cell adhesion in immunoassays by use of cranberry juice. Analytical Chemistry. 78(3),853-7
Halvorsen, BL, Carlsen MH, Phillips KM, Bohn, SK, Holte K, Jacobs DR, and Blomhoff R. (2006). Content of redox-active compounds (i.e. antioxidants) in foods consumed in the United States. American Journal of Clinical Nutrition, 84(1), 95-135
Vilsack, Tom. (2009). United States Summary and State. Data Retrieved November 19, 2010, from http://www.usda.gov/wps/portal/usda/usdahome