Embed Size (px)
Citation preview

Pattie, C., Hartman, T., & Johnston, R. (2017). Incumbent parties, incumbentMPs and the effectiveness of constituency campaigns: Evidence from the2015 British general election. British Journal of Politics and InternationalRelations, 19(4), 824-841. DOI: 10.1177/1369148117718710
Peer reviewed version
Link to published version (if available):10.1177/1369148117718710
Link to publication record in Explore Bristol ResearchPDF-document
This is the author accepted manuscript (AAM). The final published version (version of record) is available onlinevia Sage at http://journals.sagepub.com/doi/10.1177/1369148117718710. Please refer to any applicable termsof use of the publisher.
University of Bristol - Explore Bristol ResearchGeneral rights
This document is made available in accordance with publisher policies. Please cite only the publishedversion using the reference above. Full terms of use are available:http://www.bristol.ac.uk/pure/about/ebr-terms
1
Incumbent parties, incumbent MPs and the effectiveness of constituency
campaigns: evidence from the 2015 UK general election
Abstract:
Parties’ local campaign efforts can yield electoral dividends in plurality elections; in general,
the harder they campaign, the more votes they receive. However, this is not invariably the
case. Different parties’ campaigns can have different effects. What is more, the particular
status of a candidacy can also influence how effective the local campaign might be. Analyses
of constituency campaigning at the 2015 UK General Election reveal inter-party variations in
campaign effectiveness. But looking more closely at how a party was placed tactically in a
seat prior to the election, and at whether sitting MPs stood again for their party or retired,
reveals distinct variations in what parties stand to gain from their local campaigns in different
circumstances.

2
Incumbent parties, incumbent MPs and the effectiveness of constituency
campaigns: evidence from the 2015 UK general election
Local election campaigns matter. A vast international literature shows that, on the whole, the
harder parties work on their local campaign in an election, the greater the dividends in terms
of vote share (e.g. Denver and Hands, 1997a; Green et al., 2016; Jacobson, 2015; CITATION
REMOVED; Benoit and Marsh, 2003). For instance, campaigning can increase turnout
among supporters and swing undecided voters to a party. Yet, there is little evidence that
those who previously voted for another party are won over by the doorstep canvassing
characteristic of local British campaigns. As such, a persistent topic for analysis within the
literature concerns the relative efficacy of campaigns conducted by incumbents and their
challengers. In a now-classic analysis of US Congressional elections, Jacobson (1978)
demonstrated that incumbents standing for re-election received much smaller benefits from
their campaign expenditure than did challengers. Since Jacobson’s pioneering paper, his
claim has been subject to repeated scrutiny, with some studies corroborating his findings, and
others challenging them. Consensus remains elusive.
What is more, much of that research effort has focussed on campaigns in systems dominated
by two political parties (or, in multi-party polities, on the two most competitive parties in an
area). A question mark hangs, therefore, not only over the relative effectiveness of
challengers’ and incumbents’ campaigns, but also over whether all challengers in a seat gain
similar advantages. Moreover, incumbent races can be split into those which involve an
incumbent candidate seeking re-election versus those where only party incumbency is
involved (i.e., where the incumbent representative has retired before the election).
In this paper, we extend the literature on challenger and incumbency campaign effects by
examining how they vary across parties and different types of candidates in Great Britain.
Using data from the 2015 UK General Election,1 we show that not all challengers were
equally advantaged by intensive campaigns, and not all parties defending a seat were equally
disadvantaged by such campaigns (much depended on whether their incumbent MP stood
again). But surprisingly, the effects of the campaign also differed significantly depending on
which party we consider – the effects vary, both in size and (in some cases) direction from
party to party.
Campaign effects for incumbents and challengers: past research
Much of the debate over the relative merits of incumbents’ and challengers’ campaigns stems
from Jacobson’s (1978) paper on US Congressional elections in the 1970s, in which he
showed that incumbents enjoyed far smaller electoral gains from their campaigns than did
challengers. The difference, he argued, reflected the candidates’ relative positions.
Incumbents were already relatively well-known within their districts as a result of their
legislative records, work for their districts, and local media coverage. In contrast, most
challengers were much less well known initially. Their campaigns provided an opportunity to
introduce themselves to the electorate and to increase their name recognition. Incumbents,
therefore, had relatively little to gain from campaigning hard, as they already enjoyed wide
1 The analyses reported below examine the effects of campaign spending in almost all constituencies in Scotland,
England and Wales. Northern Ireland is excluded from our analysis because it has a separate party system from
the rest of the UK. The Speaker’s constituency is also excluded, as by convention the main political parties do
not campaign there.
3
recognition; challengers, meanwhile, had much to gain as the campaign helped raise their
local profile. Indeed, for incumbent candidates, having to campaign hard might even
represent weakness rather than strength, as it reflected a closer-than-expected race generated
by a particularly strong challenger.
Some have challenged Jacobson’s core finding, arguing that incumbent campaign spending
actually has a substantial influence on voting (e.g. Green and Krasno, 1988, 1990; Thomas,
1989; Compston, 1993; Erikson and Palfrey, 1998; Gerber, 1998; Samuels, 2001; Benoit and
Marsh, 2008; Magee, 2012). But other work, across a range of elections and polities, supports
Jacobson’s claim, suggesting that incumbents’ campaigns are less effective than their
challengers’ (e.g. Jacobson, 1990; Kenny and McBurnett, 1992; Palda and Palda, 1998;
Gerber, 2004; Jacobson, 2006; Benoit and Marsh, 2010); note, however, Levitt’s (1994;
Levitt and Dubner, 2005) claim that the only ‘true’ test of the impact of campaign spending is
where the same pair of candidates contested two successive elections (Jacobson, 2006;
CITATION REMOVED). In sum, a consensus has yet to emerge.
A notable feature of the literature, however, is how dominated it is by the particular example
of elections in the United States. While there are studies in countries such as France (Palda
and Palda, 1998), Ireland (Benoit and Marsh, 2003, 2008, 2010) and Brazil (Samuels, 2001),
they are very much in the minority. Yet, US elections are unusual in at least two important
ways. First, in accordance with Duverger’s law, the US has a two-party system (Duverger,
1964); hence, there are only two viable candidates in most races for the House of
Representatives, Senate, and state legislatures. What is more, the growing cohesiveness of the
major political parties notwithstanding (on the effects on candidate campaigning, see Kim
and Leveck, 2013), US elections tend to be more candidate-centred than elections in most
other countries.
These unique features may have consequences for debates over challenger and incumbent
campaigns. In a two-party, two-candidate world, campaigning begins to approximate a zero-
sum game: one candidate’s gain is the rival candidate’s loss. In a multi-party system,
however, things are more complicated, and several candidates can gain in the same contest by
using their campaigns to squeeze the support of less viable candidates in the same race. We
might expect, therefore, that ‘challenger effects’ depend critically on the viability of the
challenger. In a multi-party world, challengers representing parties which are in second place
in a seat stand some chance of winning that seat, as they ‘only’ have the incumbent party to
beat. Candidates of parties in third place or worse in the race have a much harder job as their
campaigns have to take them past at least two other locally successful parties if they are to
have a chance of winning. (There are very few three-way marginal contests in the UK:
CITATION REMOVED.)
Past research in multi-party polities also suggests that different parties are more or less
successful in running their local campaigns. In the UK, for instance, the centre-ground
Liberal Democrats have long enjoyed a reputation for particularly effective local
campaigning, working hard through grassroots organisations to build support in particular
areas, which they then converted into MPs who enjoyed substantial incumbency advantages
(Dorling et al., 1998; Russell and Fieldhouse, 2005; Cutts, 2006). Labour, too, developed a
reputation for effective constituency campaigns, focussing its efforts on marginal seats the
party needed to win elections and gaining votes in consequence (though to a lesser degree
than the Liberal Democrats: CITATION REMOVED).

4
But not all British parties have been so effective. For many years, the efficacy of the
Conservative party’s constituency campaigning underwhelmed, as the party focussed efforts
most heavily in its safest seats, where support was already nearly as high as it could go and
where no further Parliamentary representation could be gained (CITATION REMOVED;
Denver and Hands, 1996, 1997b; CITATION REMOVED). This is because virtually all of
the money spent on constituency campaigns in the UK is raised locally by the candidates’
local party organisations. Although the parties’ central and regional offices have become
increasingly more involved in the local campaigns, this has rarely meant that money has been
transferred from central to local budgets (CITATION REMOVED). Instead, the central party
offices undertake complementary activities, such as canvassing potential supporters by post,
email and social media. The intensity of a candidate’s campaign thus depends on the
constituency party’s available funds. In marginal seats, they will work hard to raise the
needed amount; in safer seats, it may be that the local party is relatively affluent and can
afford to spend on the campaign even though victory is virtually ensured – and this latter
situation has applied mainly to local Conservative parties in the past.
These inter-party differences in campaign effectiveness are not set in stone, however. The
Conservatives’ poor performance depended in part on a relatively archaic party structure,
which left local constituency associations largely independent of the national party. Reforms
in the early 2000s made it easier for the national party to co-ordinate local efforts to greater
effect by focussing (like its rivals) more on the battle in marginal seats (CITATION
REMOVED). In the run-up to the 2005 General Election, several large donors to the
Conservatives provided substantial sums of money to local parties where it seemed these
could deliver electoral success, such donations being in response to solicited business plans
submitted by the local parties (CITATION REMOVED). For the 2010 election, this became a
programme sponsored by the national party to direct central funds to key marginal seats in
order to improve the party’s chances (CITATION REMOVED). In more recent elections, the
Conservative constituency campaign has begun to gain the party votes, especially in the
marginal seats where such additional support can help the party most.
At the same time, other parties’ campaigns can falter. Between 1997 and 2005, for instance,
the impact of Labour campaign spending on the party’s constituency vote share diminished as
it moved from being the challenger party at the previous four elections to the incumbent,
disappearing entirely in 2005 (CITATION REMOVED); it recovered somewhat at the 2010
General Election when Labour was expected to lose power and its main focus was on
retaining as many of its marginal seats as possible (CITATION REMOVED). In multi-party
polities, therefore, we need to pay attention to which party is campaigning and how well its
campaign might work. Thus, we expect challengers to benefit more from their campaign
efforts than incumbents – but in a multi-party world, challengers representing some parties
may enjoy greater campaign benefits than challengers from other parties.
We also differentiate between seats defended by a party and whether the incumbent MP
stands again for re-election or retires. In the former contests, we expect limited campaign
effects, in line with Jacobson’s (1978) classic results. In the latter, however, we expect the
incumbent party to benefit from its local campaign, since it can use the campaign to promote
a new and unknown candidate to the electorate.
In the remainder of the paper, we explore these expectations using data on constituency
campaigning at the 2015 UK General Election. We analyse variations in the impact of the
intensity of local campaigns according to the nature of the contest in each constituency. Did

5
incumbent parties and MPs benefit less from their expenditure than their challengers, for
example, and were there inter-party differences in the size of those benefits?
‘Short campaign’ constituency spending in 2015
The UK’s three major parties – Conservative, Labour and Liberal Democrat – all had good
reason to focus on their constituency campaign strategies for the country’s 2015 General
Election.2 With pre-election opinion polls suggested a close race between Labour and the
Conservatives, every vote potentially counted, especially in marginal seats which might
change hands if one party out-campaigned another. At the start of the year, Labour’s leader
set his party the goal of talking to up to four million voters over the course of the campaign
(Watson, 2015).3 The Conservatives, meanwhile, targeted 80 key constituencies which they
had to win to gain an overall majority in the House of Commons: 40 seats where they had lost
narrowly in 2010, and 40 they held narrowly then – and in the former group they targeted not
only seats held by their Labour opponents but also by the Liberal Democrats, their coalition
partners in the 2010-15 government (Bale and Webb, 2015). While Labour’s approach
emphasised ‘volume’, contacting as many voters as possible, the Conservatives micro-
targeted their message to suit particularly salient groups of voters (Cowley and Kavanagh,
2015, 255ff; Barwell, 2016). As for the Liberal Democrats, polls suggested that the costs of
joining the Conservatives in the 2010-15 coalition government would be severe. A sharp fall
in the party’s vote and hence in its parliamentary representation was therefore anticipated.
They turned their attention to holding on to those seats they already held, in the hope that a
mixture of campaign effort and incumbency effects might mean fewer losses than the polls
suggested.
We follow previous studies by using candidate spending during the so-called ‘short campaign’
(the four weeks or so of the official election campaign, from the date on which parliament is
prorogued to polling day itself). While not a perfect measure of campaign effort by each party
in each seat (the increasingly important work of unpaid volunteers, for instance, is not well
captured in the data: CITATION REMOVED), campaign spending does correlate well with
other independent measures of campaign effort (Denver and Hands, 1997a, 242ff;
CITATIONS REMOVED). The more parties spend, the more intensive other aspects of their
campaigns, such as the number of activists recruited to undertake doorstep canvassing. The
spending data also have the distinct advantage of providing extensive coverage, in a
standardised form, of almost all campaigns across the UK. Candidates are required by law to
provide local Electoral Administrators (local government officials charged with running
elections in their areas) details of their campaign expenditures for both the short and ‘long’
campaign (the latter begins four months before Parliament is prorogued). In recent years,
Returning Officers have then lodged the data with the UK’s Electoral Commission, which
2 In the following analyses, we focus only on the constituency campaigns for the Conservatives, Labour and the
Liberal Democrats. We do not examine the effects of the Scottish Nationalist Party and Plaid Cymru
constituency campaigns (or at the Greens or UKIP).Our intention in this paper is not to provide a comprehensive
account of constituency campaigning at the 2015 UK General Election, but to focus on the extent to which each
party’s campaign rewards varied depending on whether a seat was defended by the incumbent MP, was an ‘open
race (where the party is defending but has a new candidate), or was one where the party was a challenger (i.e. its
candidate did not win there at the preceding general election; subsequent by-elections are not taken in to
account). None of the other parties in 2015 had sufficient incumbent MPs standing for re-election (6 for the SNP,
2 for Plaid Cymru and one each for the Greens and for UKIP); nor were there sufficient open races (none for the
SNP, UKIP and the Greens, and only 1 for Plaid) to make this analysis possible. 3 http://www.politics.co.uk/comment-analysis/2015/01/05/ed-miliband-election-campaign-launch-speech-in-full.

6
makes them available in a standardised form to all interested citizens.4 We draw on these data
in the following analyses.
Before embarking on those analyses, however, we need to discuss two quirks of the data.
First, local spending on both the long and short campaigns is legally capped, with potentially
severe penalties for candidates who exceed the spending limits.5 Those limits are a function
of each constituency’s electorate and of whether the constituency is a borough (urban) or
county (more rural) seat.6 We therefore express each candidate’s 2015 campaign expenditure
as a percentage of the legal maximum in their seat. Second, while candidates are legally
required to declare their spending to Returning Officers, there is no equivalent requirement
for Returning Officers to forward this information to the Electoral Commission. In previous
elections, this was unproblematic. Yet, in 2015, it seems that some Returning Officers did not
forward spending data to the Electoral Commission;7 in these instances, the data shows a
candidate as having spent £0 on the campaign. While a few constituency campaigns really do
spend nothing (usually in seats where the party has no chance of winning, but where it wants
to be seen to field a candidate), more candidates for the three leading parties are recorded as
making a £0 return in 2015 than was the case in 2010.8 We are therefore unable to
differentiate between so-called ‘paper candidates’ (for whom a £0 return is genuine) and real
candidates who did spend on their 2015 campaigns but whose spending did not make it into
the Commission’s data. We err on the side of caution and treat all £0 returns as missing data.9
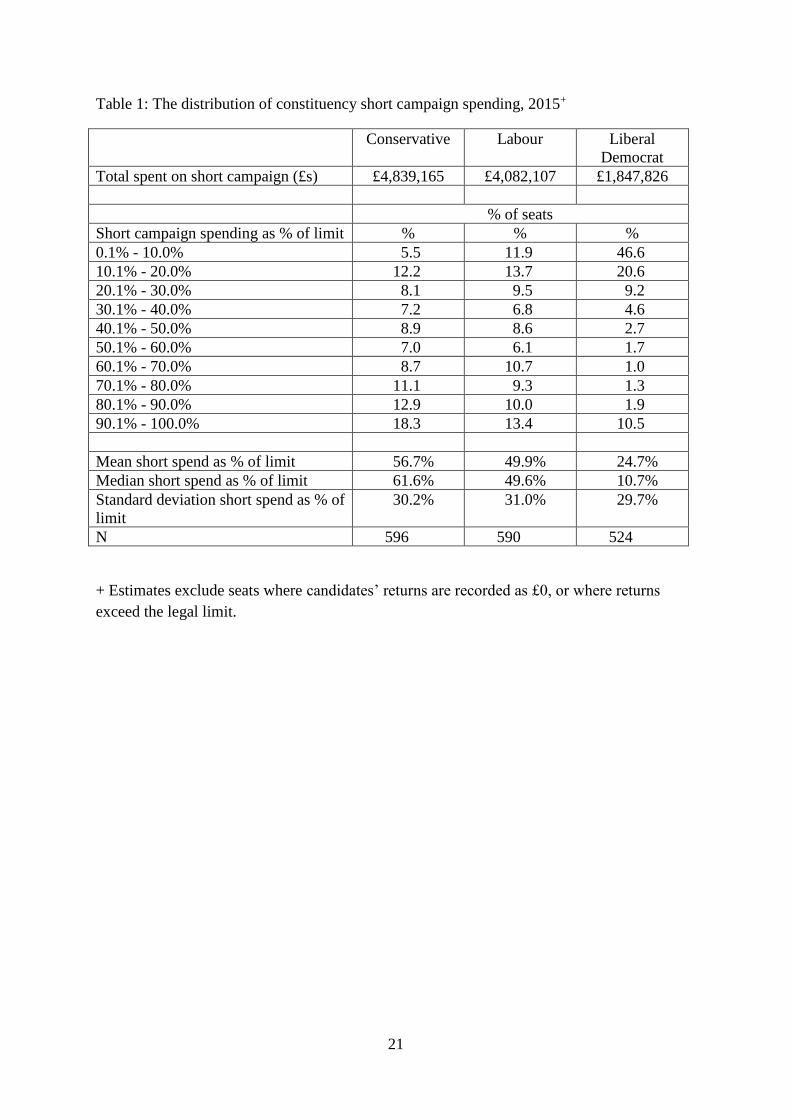
Table 1 shows how much the Conservatives, Labour and the Liberal Democrats spent on their
short campaign in those seats for which we have reasonable data. Conservatives spent £4.8
million on their ‘short’ campaigns, compared to £4.1million by Labour and £1.8 million by
Liberal Democrats. How widely this expenditure was spread across constituency campaigns
varied substantially among the parties, as indicated not only by the mean and median levels
of spending but also by the percentage of constituencies in each spending bracket. The
average Conservative constituency party spent 57% of the permitted maximum, compared to
4 http://www.electoralcommission.org.uk/find-information-by-subject/elections-and-referendums/past-elections-
and-referendums/uk-general-elections/candidate-election-spending. 5 Technically, all expenditure in constituencies campaigns is incurred by candidates, not by local party
organisations. Only candidates are mentioned in the legislation governing local campaign spending in the UK,
and it is the candidates who are legally responsible for keeping within the spending limits, for returning their
accounts, and so on. 6 In 2015, the ‘long campaign’ legal limit for a candidate was £30,700 plus 9p per elector in county seats and 6p
per elector in a borough seat. During the ‘short campaign’, it was £8,700 plus 9p (for county) or 6p (if borough)
per elector. 7 We have some anecdotal evidence that this may be a result of austerity measures affecting local government
budgets during the 2010-15 parliament, forcing local authorities to make savings wherever possible. 8 In 2015, 17.1% of Conservative candidates were recorded as spending £0 on their long campaigns, as were 5.5%
on the short campaign: the equivalent percentages for 2010 were 12% and 1% respectively. For Labour, the per
cents with £0 long and short campaign expenditures were 18.5% and 6.0% (compared to 13% and 2% in 2010).
And for the Liberal Democrats, the 2015 percentages were 49.2% and 16.6% (compared to 24% and 6% in
2010). 9 The problem is particularly acute for long campaign spending, where we lose nearly 50% of Liberal Democrat
candidates if we treat £0 expenditure as missing data. We concentrate on expenditure during the ‘short’
campaign, a period for which we have spending data for about 95% of Conservative and Labour candidates, and
for 85% of Liberal Democrat candidates. To further preserve our sample sizes, we look at the effect of each
candidate’s short campaign expenditure on its own vote, and do not consider how each campaign affected other
parties. We also omit a small number of candidates (three Labour and two Liberal Democrat) whose short
campaign spending returns suggest they spent over the legal limit in their seat (this was most likely a reporting
error). We have, however, rerun our analyses including these cases: our results are much the same, whether we
include or exclude them.

7
50% for the average Labour constituency party and just 25% for the average Liberal
Democrat. Most Liberal Democrat constituency parties spent very little: Two-thirds spent less
than 20% of the limit. The party’s constituency campaign resources, such as they were, were
intensely focused in just a few seats: 12% of local campaigns spent more than 80% of the
limit. Far fewer Labour and Conservative constituency parties spent almost nothing, while
rather more spent close to the maximum: 18% of Conservative and 26% of Labour
constituency parties spent under 20% of the limit, while 31% of Conservative and 23% of
Labour local parties spent over 80% of the limit.
To examine how the parties targeted their campaign resources, we regressed each party’s
2015 short campaign expenditure on the marginality and status of each seat, as well as their
interaction. Marginality is measured by the absolute difference between a party’s 2010 vote
share in a seat and the share of either (where the party won the seat) the party in second place,
or (where the party lost) the winning party. Thus, the most marginal seats for each party have
scores closest to zero. Seat status differentiates among three types of contest for each party:
seats where it lost in 2010 and was a challenger in 2015; seats it won in 2010 and was
defending in 2015 but where its MP had retired (we term these ‘open’ contests, in keeping
with usage in the American literature); and seats won in 2010 where its MP was seeking re-
election (incumbent seats).10 The interaction allows us to test whether the effect of seat
marginality is conditional on whether a party is contesting as an incumbent, challenger, or
open seat.
The results from our campaign spending regression models for each party are presented in
Table 2 and graphically in Figure 1.11 First, all three parties’ constituency campaign resources
were targeted rationally, on the most marginal races. The negative coefficients for absolute
marginality in 2010 reveal that the parties spent less on safer, incumbent held seats.12 For
instance, where incumbents stood for re-election, Conservative incumbents spent 0.74 less (as
a percent of the legal limit) for each additional point in marginality; the coefficients for
Labour and the Liberal Democrats are -0.35 and -0.27, respectively (although the latter
coefficient is not statistically significant). For challengers, the effects of seat marginality are
magnified: the coefficient is -0.57 for Conservatives, -1.42 for Labour, and -0.71 for Liberal
Democrats. Finally, the effects of open seats seem to fall somewhere in between, but none of
the interactions are statistically significant.
Figure 1, which plots the marginal effects, confirms that deploying substantial campaign
resources in the ‘wrong’ seats was not an issue for any of the three major parties in 2015. All
three spent relatively little in seats where they were far behind the winner, and more in seats
where they lost in 2010 but where the margin of defeat was small. Indeed, for all three, there
is a fairly clear divide in the seats they had lost in 2010 between those where they spent little
10 In 2015, the Conservatives fought 268 constituencies where their incumbent MP ran again, 38 ‘open’ races
where they were defending a seat but with a new candidate, and 325 constituencies where they were the
challenger. Labour, meanwhile, fought 218 incumbent races, 40 open races, and 373 challenger races. For the
Liberal Democrats, there were 47 incumbent seats, 10 open seats and 574 challenger seats. 11 Models were fitted, and figures were produced, using R (R Development Core Team, 2013). Replication data
and code are available for download on Github: LINK REMOVED. 12 Since the models interact marginality with party position, the main effect for marginality indicates the effect
of marginality when both ‘party position’ dummy variables have a value of 0. This happens when the party’s
candidate in the seat is the incumbent MP. The effects of marginality for challenger candidates is derived by
adding the main effect of marginality with the coefficient for the interaction between ‘challenger’ and
marginality. The effect of marginality in open races is derived in the same way, by adding the main effect
coefficient for marginality to the coefficient for the interaction between open races and marginality.

8
and those where they spent a lot: they spent a middling amount in relatively few ‘lost’ seats.
These seats were divided into places where there was a reasonable prospect of making a gain,
and places where there was not. While intense campaigns were fought in the former, only
limited campaigns were fought in the latter. And when we look at seats each party won in
2010 and was defending in 2015, there is a clear tendency to spend more in seats that were
won by narrow margins than in seats where the party was safe – though more so for Labour
and the Conservatives than for the Liberal Democrats, who had fewer truly safe seats and
were fearful that their poor poll ratings might presage defeats for even their best-established
MPs.
The effects of campaign spending on vote share
But did this campaign effort make a difference? Our initial models analyse the parties’ 2015
vote shares across all constituencies (Table 3). Each model controls for that party’s 2010
constituency vote share, taking into account the tendency for parties’ vote shares at one
election to correlate strongly with their vote at previous contests (thereby capturing many of
the underlying influences on the geography of the vote other than campaign effects). Not
surprisingly, the coefficients for 2010 vote share are invariably positive and statistically
significant. The better a party performed in a seat in 2010, the better (relatively) it performed
there again in 2015.
Turning to the local campaign impacts, there are striking disparities between Labour and the
other parties. The more that the Conservative and Liberal Democrats spent (the great majority
of which went on printed materials to be distributed to potential voters13), the more votes they
gained, controlling for their past strength in the seat. Other things being equal, every extra
percentage point towards the legal limit spent by the Conservatives raised their vote share by
an average of 0.04 percentage points. This represents a 4 percentage point increase in vote
share from spending nothing to spending right up to the limit. Such shifts are sufficient to win
in marginal seats where the party lost in 2010 (or to lose in a seat won then).
For the Liberal Democrats, the positive effect of campaign effort was much greater. Other
things being equal, increasing spending from nothing up to the legal limit would increase its
vote share in a seat by an average of 14 percentage points. Given the party’s dismal
performance in 2015, however, this apparent success should be interpreted in a more muted
light: rather than indicating strength, it suggests that in general the harder the Liberal
Democrats campaigned in a seat, the less ground they lost in 2015. The campaign, where it
was in full swing, helped minimise the damage.
Both patterns are consistent with previous research (CITATION REMOVED; Fisher et al.,
2011; Russell and Fieldhouse, 2005). But the most striking result is the absence of a
constituency campaign effect for Labour in 2015: the coefficient is very small and falls well
short of conventional levels of statistical significance. This is unusual, to say the least, as
Labour’s constituency campaigns have generally (2005 excepted: CITATION REMOVED)
worked in the party’s favour at elections since at least the late 1980s (CITATION
REMOVED; Denver and Hands, 1997a).
13 Just under 67% of all candidate spending in 2015 went on the production of unsolicited materials (primarily
leaflets) to be sent to electors (Electoral Commission, 2016, p. 33).

9
All three parties had counted on their local campaigns in 2015. All had good reasons, based
on past (and long-standing, in the case of Labour and the Liberal Democrats) experience, to
suspect that local effort in key seats might help them outperform predictions from national
polls. But these expectations were vindicated for only two of the parties. Why was Labour’s
2015 constituency campaign so conspicuously different in its effectiveness from its two rivals?
Anecdotal evidence suggests that the issue was not a simple function of resources. Rather, the
parties seemed to have differed in how they targeted their messages. Labour a focussed on
volume of contacts in 2015, while the Conservatives especially deployed micro-targeting,
with different messages aimed at different voter demographics within marginal seats (Cowley
and Kavanagh, 2015, chapter 10). To some extent, then, the differences in campaign
effectiveness may reflect the relative finesse with which parties deployed their resources. But
it may also be a function of the rather different tactical challenges facing each party in those
seats where it was a challenger, where it was defending, and so on. Labour and the
Conservatives, for instance, both had to defend seats they currently held, and had to take
others from their rivals if they were to obtain a Parliamentary majority. The Liberal
Democrats, meanwhile, had little prospect of winning new seats, and the polls suggested that
going into the election they faced losing many of those seats they held. Did seat status affect
how effective each party’s local campaign was?
Campaign effects for incumbent MPs, incumbent parties and challengers
To answer that question, this section turns to the effects of context (in particular, the contrast
between being the incumbent party in a seat and being a challenger) on the effectiveness of
constituency campaigning. We repeat the regression models reported in table 3, but add
dummy variables for challenger and open seats: the comparators for these dummies are
incumbent seats (as defined above). To test whether constituency campaigns had different
effects in various local tactical contexts, we also include terms for the interaction between
each dummy variable and the party’s short campaign spending.
The results show that past party strength remains (unsurprisingly) a clear predictor of 2015
vote share in a constituency (table 4), and is controlled for in all subsequent discussions.14 In
line with past research, incumbent MPs standing for re-election enjoy some electoral
advantages (Cain et al., 1987; Wood and Norton, 1992), but the size of that incumbent
advantage varies. When spending is held at its minimum, Conservative MPs standing for re-
election enjoyed a relatively modest advantage of 8.5 percentage points over candidates
fighting in seats where their party was a challenger. Labour incumbents did rather better,
gaining an extra 21 percentage points on average over Labour challengers. And Liberal
Democrat MPs seeking re-election enjoyed by far the most substantial incumbency advantage,
an average boost of 23.3 percentage points (a finding also in line with past research: Russell
and Fieldhouse, 2005; Whiteley et al., 2006; Smith, 2013). In open seats, however, the three
parties’ candidates fared rather differently compared to their counterparts standing for re-
election. Conservative candidates did slightly better (by about 5 percentage points on average)
in 2015 than did Conservative MPs who sought re-election when spending is set to its
minimum. For Labour, the average difference in vote share between open seat candidates and
incumbent MPs was very small and not statistically significant. But the Liberal Democrats’
sitting MPs seeking re-election fared much better (by 35.4 percentage points on average) than
their candidates in open seats: given the party’s travails in 2015, being a well-known MP
14 The interpretation of the main effects and interaction terms in these models is based on the same
considerations as the analyses reported in table 2.

10
helped minimise losses (though still not enough to prevent several prominent Liberal
Democrats losing their seats).
Our main interest, however, is in how effective campaign efforts were in different contexts.
The interaction terms can be used to test for these relationships, and we have used the results
for each party to visualise the marginal effects of short campaign spending on party support
in ‘challenger’ and in ‘open’ seats, compared to ‘incumbent’ seats.
The main effect for spending shows whether it influenced the outcome in seats where each
party was defending a seat, and where the incumbent MP was standing again. Combining the
coefficient for the main effect of spending with each interaction term gives the effect of
spending on 2015 vote share (controlling for 2010 vote), where each party was a challenger
going into the 2015 election, and where it was defending a seat but had a new candidate.
Consistent with past research, stemming back to Jacobson’s (1978, 1990) seminal work,
spending by incumbent MPs does not seem to have helped them (and in some cases, more
intensive campaigning was associated with poorer performances at the ballot box). For
Conservative and Liberal Democrat incumbents, there was no significant campaign effect.
For Labour incumbents, more dramatically, the effect was negative – and substantial. The
more Labour incumbents spent on their re-election, the worse they did (and, other things
being equal, the vote share for a Labour incumbent who spent the maximum possible would
have been, on average, 11 percentage points lower than would have been the case for another
incumbent who spent nothing on their re-election). There is almost certainly a selection effect
here. Incumbents, as we have seen, enjoy advantages. As a result, they almost certainly only
have to campaign hard when faced with more effective and intense campaigns from their
local rivals, and hence are already in some trouble politically. For Labour incumbents,
campaigning hard was a sign of local weakness, therefore, and not a sign of strength.
Unlike incumbents seeking re-election, all three parties’ challengers enjoyed benefits from
their campaign efforts (all the relevant interaction terms in table 4 are positive and
statistically significant). Again, this is consistent with past research. Campaigning raises
challengers’ profiles: the harder they worked in 2015, the more they stood to gain.
The benefit was smallest for Conservative challengers: other things being equal, every extra
percentage point spent boosted their vote share by an average of 0.06 percentage points (this
combines the main effect for short campaign spend with the effect for the short
spend*challenger interaction: slope = 0.00 + 0.06Challenger). It was more substantial for
Liberal Democrat challengers, whose vote shares increased by an average of 0.09 percentage
points (slope = -0.04 + 0.13Challenger) for every percentage point increase in short campaign
spending. And it was largest for Labour challengers, whose average vote ‘boost’ from each
percentage point increase in spending was 0.11 percentage points (slope = -0.11 +
0.22Challenger).
It is also striking that the average ‘boost’ Labour challengers obtained from their 2015
constituency campaigns was roughly the same size (albeit in the opposite direction) as the
effect of local campaign spending on Labour incumbents’ vote shares (0.11 versus -0.11).
This gives us some insight into why Labour’s 2015 constituency campaign seemed to have no
overall effect (see table 2): the benefits enjoyed by the party’s challengers were cancelled by
the disadvantages suffered by its incumbents.

11
The marginal effects are shown graphically in the ‘challenger versus incumbent’ graphs in
figure 2 (for Conservatives), figure 3 (for Labour) and figure 4 (for the Liberal Democrats).
In each graph, the X-axis displays the amount spent on the short campaign, and the Y-axis
shows the marginal effect on party vote share; the dashed horizontal line represents
‘incumbent’ seats while the solid line shows the marginal effect of campaigning in
‘challenger’ seats. In addition, the figures show the 95% confidence intervals around the
marginal effects and also show histograms of the number of seats at each point along the
campaign spending axis.
In all three cases, the ‘challenger’ line is positive, showing that increased spending improved
their marginal returns in terms of votes vis-à-vis their party’s incumbent MPs. For the
Conservatives and Liberal Democrats (figures 2 and 4), the challenger line (and its
confidence interval) never crosses the ‘zero’ incumbent line, suggesting that as challengers
spend more their marginal return in vote share approaches, but never equals, that of
incumbents spending at the same level. For Labour, however, challengers and incumbent
MPs spending at over around 80% of the campaign limit enjoyed similar marginal returns
(figure 3). But for all three parties, the marginal effects of increased spending for ‘challenger’
candidates (shown on the vertical axes) are always negative, suggesting they do less well in
vote share than incumbent candidates spending at the same level. But the gap between
challengers and incumbents narrows in all three cases as spending increases (and at high
levels of spending, Labour challengers catch up with their incumbent peers).
In open races, meanwhile, the three parties experienced rather different outcomes. New
Conservative candidates standing in seats the party held actually experienced negative
campaign effects. On average, every extra percentage point spent on their short campaigns
was associated with a fall in vote share of 0.09 percentage points.
Campaign effects for Labour in that party’s open races were not significantly different from
those experienced by Labour incumbents. But since (as already seen) Labour incumbents’
campaign effects were negative, this was not good news for the party. The harder it
campaigned, the worse it did. On average, each extra percentage point spent by Labour on its
open race short campaigns was associated with a drop of 0.18 percentage points in its vote
share.
Both the Conservatives’ and Labour’s constituency campaigns in their open race seats had
the effect predicted by Jacobson (1978, 1990), albeit applied to incumbent parties, not
incumbent candidates. The harder they campaigned, the worse they did in vote share. Once
again, the logic would seem to be that, in seats a party already holds, its candidates only need
to campaign relatively hard when they are under pressure from strong opponents – a sign of
weakness, not strength.
But Liberal Democrat campaigns in that party’s open races had a very different experience.
For them, harder work on their local campaign yielded rich dividends, significantly boosting
their vote shares. On average, every extra percentage point spent on an open Liberal
Democrat race boosted the party’s 2015 vote by 0.27 (slope = -0.04 + 0.31Open) percentage
points. Only a small number of Liberal Democrat MPs (10 of the 56) stood down before the
2015 election to create open races for the party, however. Even so, this implies that in these
‘open’ Liberal Democrat races the party’s vote share would increase by 27 percentage points
on average if it increased its campaign spending from nothing to the permitted limit. This is
the largest ‘campaign effect’ discussed in this paper. In 2015, the Liberal Democrats faced an

12
electoral near-wipe-out as many voters punished them for joining the Conservative-Liberal
Democrat coalition government in 2010. Hard-fought local campaigns in seats the party was
defending in 2015 could not prevent the steep decline in the party’s support. But greater
campaign efforts there did apparently prevent even deeper losses. And where the party
fielded new candidates in open races, who were untainted by personal involvement in the
coalition, that local campaign effort was even more effective in offsetting the general decline.
The graphs of the marginal effects of campaigning in open races, compared to incumbent
MPs seeking re-election, reveal further nuances. The marginal effects for Labour and
Conservative candidates in open races are negative, while those for Liberal Democrats are
positive (relative to the effects for incumbents). But the confidence intervals reveal further
detail. At relatively low levels of spending (below around 50% of the limit), the marginal
effects for open races compared to incumbent races are indistinguishable for both Labour and
Conservative campaigns (figures 2 and 3: the relevant confidence intervals enveloping the
‘incumbent’ horizontal line). But at higher levels of expenditure (over 50% for Labour, over
75% for the Conservatives), the marginal effects on vote share begin to differ, with
candidates in open races falling behind incumbents who spend at similar levels. For Liberal
Democrats in open races, however, increasing spending always brings improving vote share
relative to the party’s incumbents seeking re-election (figure 4). The effects are always
negative, suggesting that, overall, Liberal Democrats in open races always do worse than
Liberal Democrat incumbents. But the gap narrows rapidly as both sets of candidates spend
more.
Conclusions
The results discussed above throw new light on the debate over differential campaign effects
for challengers and incumbents. As expected from past research, challengers benefitted from
the intensity of their candidates’ campaigns (basically, the amount spent on campaign
literature), while at least some incumbents experienced negative campaign effects. The most
widely-cited explanation for this effect is that campaigning helps challengers by raising their
profile while incumbents (whether incumbent parties or candidates) already enjoy strong
recognition within their seats and so have little to gain by campaigning more intensively.
Incumbents only have to campaign hard, it is argued, when they face a strong challenge and
so campaign more as their position weakens. Indeed, they may even see their vote fall more
the harder they campaign (almost certainly because they are forced into more active
campaigns by strong local challengers who threaten their hold on the seat).
But, in an electoral system with more than just two viable parties, a simple
incumbent/challenger dichotomy does not fully capture the diversity of campaign effects.
Where candidates were running as challengers, how viable their challenge was generally
mattered – but not equally so for all parties. Similarly, where a party was defending a seat,
whether or not the existing MP was seeking re-election affected the relationship between
campaign effort and vote share. Incumbents seeking re-election either gained no advantage
from their campaign (in the case of the Conservatives) or – as Jacobson (1978) argued – saw
their vote share drop the more they campaigned. Incumbents campaigned harder where they
faced stronger challenges from challengers, and as we have seen, challengers’ spending
boosted their vote share. But as the competition for vote share in a seat is a zero sum game,
an increase in vote share for the challenger is likely to result in a decreasing vote share for the
incumbent. It isn’t the incumbents’ own campaigns which lose them votes: it is the
challengers’ campaigns which take votes from them. But where new candidates stood in seats

13
their party was defending, they fared rather differently – and the difference depended on
which party they represented. Conservative and Labour candidates in open races defended by
the party saw their vote fall the harder they campaigned (and fell faster than for incumbent
MPs from each party seeking re-election); where parties fielded new candidates in seats they
were defending their opponents were able to gain an advantage by intensive campaigning
which the defending parties’ own campaigns did not counter. But Liberal Democrat
candidates in open Liberal Democrat races experienced strong positive benefits from their
campaigning.
For Labour and Conservative candidates defending their parties’ own seats in 2015, therefore,
this meant that increasing levels of campaign spending widened the electoral advantage
incumbent MPs seeking re-election enjoyed over new candidates in open races. But for the
Liberal Democrats, the opposite was true: the more they campaigned, the more ‘open seat’
Liberal Democrat candidates caught up, in vote share, with Liberal Democrat incumbents.
To fully understand campaign effects, therefore, we need to go beyond analysing all seats
together and differentiate incumbent from challenger effects. We also need to differentiate
between party incumbency and candidate incumbency: ‘incumbent seat’ effects can be very
different in open races compared to races where the existing MP runs again. And, in party
systems with more than two parties, we need to take into account inter-party variations.
14
References
Bale, T. and Webb, P. 2015. The Conservatives: their sweetest victory? In Geddes, A. and
Tonge, J. (eds.) Britain Votes 2015. Oxford: Oxford University Press.
Barwell, G. 2016. How to Win a Marginal Seat: My Year Fighting for My Political Life.
London: Biteback Books.
Benoit, K. and Marsh, M. 2003. For a few Euros more: campaign spending effects in the Irish
local elections on 1999. Party Politics. 9, 561-582.
Benoit, K. and Marsh, M. 2008. The campaign value of incumbency: a new solution to the
puzzle of less effective incumbent spending. American Journal of Political Science. 52,
874-890.
Benoit, K. and Marsh, M. 2010. Incumbent and challenger campaign spending effects in
proportional electoral systems: the Irish elections of 2002. Political Research Quarterly.
63, 159-173.
Cain, B.E., Ferejohn, J. and Fiorina, M.P. 1987. The Personal Vote: Constituency Service and
Electoral Independence. Cambridge, Mass.: Harvard University Press.
Compston, H. 1993. Campaign spending and US House elections: a reconsideration.
Electoral Studies. 12, 225-233.
Cowley, P. and Kavanagh, D. 2015. The British General Election of 2015. Basingstoke:
Palgrave Macmillan.
Cutts, D. 2006. Continuous campaigning and electoral outcomes: the Liberal Democrats in
Bath. Political Geography. 25, 72-88.
Denver, D. and Hands. G. 1996. Constituency campaigning in the 1992 General Election: the
peculiar case of the Conservatives. In Farrell, D.M., Broughton, D., Denver, D. and
Fisher, J. (eds.). British Elections and Parties Yearbook 1996. London: Frank Cass.
Denver, D. and Hands. G. 1997a. Modern Constituency Electioneering: Local Campaigning
in the 1992 General Election. London: Frank Cass.
Denver, D. and Hands, G. 1997b. Challengers, incumbents and the impact of constituency
campaigning in Britain. Electoral Studies. 16, 175-193.
Dorling, D., Rallings, C. and Thrasher, M. 1998. The epidemiology of the Liberal Democrat
vote. Political Geography. 17, 45-70.
Duverger, M. 1964. Political Parties: Their organization and Activity in the Modern State.
Cambridge University Press.
Electoral Commission. 2016. UK Parliamentary General Election 2015: Campaign Spending
Report. London: The Electoral Commission.
Erikson, R.S. and Palfrey, T.R. 1998. Campaign spending and incumbency: an alternative
simultaneous equations approach. The Journal of Politics. 60, 355-373.

15
Fisher, J., Cutts, D. and Fieldhouse, E. 2011. The electoral effectiveness of constituency
campaigning in the 2010 British General Election: the ‘triumph’ of Labour? Electoral
Studies. 30, 816-828.
Gerber, A. 1998. Estimating the effect of campaign spending on Senate election outcomes
using instrumental variables. American Political Science Review. 92, 401-411.
Gerber, A. 2004. Does campaign spending work? Field experiments and suggestive new
theory. American Behavioral Scientist. 47, 541-574.
Green, D.P. and Krasno, J.S. 1988. Salvation for the spendthrift incumbent: reestimating the
effects of campaign spending in House elections. American Journal of Political Science.
32, 884-907.
Green, D.P. and Krasno, J.S. 1990. Rebuttal to Jacobson’s “New evidence for old
arguments”. American Journal of Political Science. 34, 363-372.
Green, D.P., Krasno, J.S., Coppock, A., Farrer, B.D., Lenoir, B. and Zingher, J.N. 2016. The
effect of lawn signs on vote outcomes: results from four randomized field experiments.
Electoral Studies. 41, 143-150.
Jacobson, G.C. 1978. The effects of campaign spending in Congressional elections. American
Political Science Review. 72, 469-491.
Jacobson, G.C. 1990. The effects of campaign spending in House elections: new evidence for
old arguments. American Journal of Political Science. 34, 334-362.
Jacobson, G.C. 2006. Campaign spending in US Senate elections: evidence from the National
Annenberg Election Survey. Electoral Studies. 25, 195-226.
Jacobson, G.C. 2015. How do campaigns matter? Annual Review of Political Science. 18, 31-
47.
Kenny, C. and McBurnett, M. 1992. A dynamic model o the effect of campaign spending on
Congressional vote choice. American Journal of Political Science. 36, 923-937.
Kim, H.A. and Leveck, B.L. 2013. Money, reputation and incumbency in US House elections,
or why marginals have become more expensive. American Political Science Review. 107,
492-504.
Levitt, S. D. 1994. Using repeat challengers to estimate the effect of campaign spending on
election outcomes in the U.S. House. Journal of Political Economy, 102, 777-798.
Levitt, S. D. and Dubner, S. J. 2005. Freakonomics: A Rogue Economist Explores the Hidden
Side of Everything. London: Penguin Books.
Magee, C.S.P. 2012. The incumbent spending puzzle. Social Science Quarterly. 93, 932-949.
Palda, F. and Palda, K. 1998. The impact of campaign expenditures on political competition
in the French legislative elections of 1993. Public Choice. 94, 157-174.

16
R Development Core Team 2013. R: A Language and Environment for Statistical Computing.
R Foundation for Statistical Computing, Vienna, Austria. http://www.R-project.org.
Russell, A. and Fieldhouse, E. 2005. Neither Left Nor Right? The Liberal Democrats and the
Electorate. Manchester: Manchester University Press.
Samuels, D. 2001. Incumbent and challengers on a level playing field: assessing the impact
of campaign finance in Brazil. The Journal of Politics. 63, 569-584.
Smith, T.H. 2013. Are you sitting comfortably? Estimating incumbency advantage in the UK:
1983 – 2010 – A research note. Electoral Studies. 32, 167-173.
Thomas, S.J. 1989. Do incumbent campaign expenditures matter? Journal of Politics. 51,
965-976.
Watson, I. 2015. Five Million Conversations: How Labour Lost an Election and
Rediscovered its Roots. Edinburgh: Luath Press Limited.
Whiteley, P., Seyd, P. and Billinghurst, A. 2006. Third Force Politics: Liberal Democrats at
the Grassroots. Oxford: Oxford University Press.
Wood, P. and Norton, P. 1992. Do candidates matter? Constituency-specific vote changes for
incumbent MPs, 1983-1987. Political Studies. 40, 227-238.

17
Figure 1: Effect of Seat Marginality on Campaign Spending Conditional on Seat Status

18
Figure 2: Effect of campaign spending on vote share conditional on seat status (Conservatives)

19
Figure 3: Effect of campaign spending on vote share conditional on seat status (Labour)

20
Figure 4: Effect of campaign spending on vote share conditional on seat status (Liberal Democrats)
21
Table 1: The distribution of constituency short campaign spending, 2015+
Conservative Labour Liberal
Democrat
Total spent on short campaign (£s) £4,839,165 £4,082,107 £1,847,826
% of seats
Short campaign spending as % of limit % % %
0.1% - 10.0% 5.5 11.9 46.6
10.1% - 20.0% 12.2 13.7 20.6
20.1% - 30.0% 8.1 9.5 9.2
30.1% - 40.0% 7.2 6.8 4.6
40.1% - 50.0% 8.9 8.6 2.7
50.1% - 60.0% 7.0 6.1 1.7
60.1% - 70.0% 8.7 10.7 1.0
70.1% - 80.0% 11.1 9.3 1.3
80.1% - 90.0% 12.9 10.0 1.9
90.1% - 100.0% 18.3 13.4 10.5
Mean short spend as % of limit 56.7% 49.9% 24.7%
Median short spend as % of limit 61.6% 49.6% 10.7%
Standard deviation short spend as % of
limit
30.2% 31.0% 29.7%
N 596 590 524
+ Estimates exclude seats where candidates’ returns are recorded as £0, or where returns
exceed the legal limit.

22
Table 2: The effect of seat marginality and status on campaign spending by all 3 parties in
2015: OLS regressions (standard errors in brackets)
Short Campaign Spending in 2015
Conservative Labour Lib Dem
Constant 85.06**
(2.60)
69.93**
(2.43)
95.84**
(4.21)
2010 Seat Marginality -0.74**
(0.12)
-0.35**
(0.11)
-0.27
(0.26)
Party position (comparison = Incumbent: won 2010, MP stands again)
Challenger (lost 2010) -15.33**
(3.45)
18.39**
(3.26)
-53.98**
(4.69)
Open (won 2010, MP retires) -0.20
(8.46)
4.36
(6.85)
-13.54
(10.13)
Marginality * Challenger -0.57**
(0.15)
-1.42**
(0.13)
-0.71*
(0.27)
Marginality * Open 0.28
(0.33)
-0.17
(0.29)
0.91
(0.73)
R2 .48 .59 .67
N 596 590 524
* significant at p = 0.05
** significant at p = 0.01

23
Table 3: The effect of short campaign spending on vote share: OLS regressions (standard
errors in brackets)
Party % vote share 2015
Conservative Labour Lib Dem
Constant -2.21**
(0.41)
3.70**
(0.73)
-4.76**
(0.44)
Party % vote share 2010 1.03**
(0.01)
0.98**
(0.03)
0.40**
(0.02)
Party % short campaign spend,
2015
0.04**
(0.01)
0.01
(0.01)
0.14**
(0.01)
R2 0.95 0.78 0.85
N 596 590 524
* significant at p = 0.05
** significant at p = 0.01

24
Table 4: The effect of short campaign spending and seat status on vote share: OLS
regressions (standard errors in brackets)
Party % vote share 2015
Conservative Labour Lib Dem
Constant 8.49**
(1.49)
26.21**
(2.65)
20.63**
(3.87)
Party % vote share 2010 0.88**
(0.02)
0.62**
(0.04)
0.33**
(0.02)
Party % short campaign spend 2015 0.00
(0.01)
-0.11**
(0.02)
-0.04
(0.04)
Party position (comparison = Incumbent: won 2010, MP stands again)
Challenger (lost 2010) -8.52**
(1.26)
-21.02**
(2.55)
-23.29**
(3.80)
Open (won 2010, MP retires) 5.01*
(2.37)
1.41
(4.12)
-35.39**
(5.41)
Short spend * Challenger 0.06**
(0.01)
0.22**
(0.03)
0.13**
(0.04)
Short spend * Open -0.09**
(0.03)
-0.07
(0.06)
0.31**
(0.06)
R2 0.96 0.81 0.91
N 596 590 524
* significant at p = 0.05
** significant at p = 0.01