Embed Size (px)
Citation preview
Patterns of Ventricular Filling and Emptying From lnterframe dv/dt Changes: Preliminary Report
George A. Lis, Vernice D. Cowell, and Said M. Zu'bi
Baystate Medical Center-Springfield Hospital Unit, Springfield, Massachusetts
Multigated cardiac studies were computer processed to produce cine mode images of change in volume with change in time, dvldt. In a twenty frame gated blood pool study, both positive and negative volume changes are quantified from interframe differences. Using this data, a cinematic display of the functional pattern of filling and emptying may be created to provide the user with a different perspective on cardiac chamber dynamics. Preliminary results indicate that the cinematic display of the change in volume with time permits visuali1Jllion of cardiac blood pool filling and emptying, delineates such structures as the pulmonary artery and beating atria, and may prove useful in the visuali'OIIion of asynergies, bundle branch blocks, and other conduction abnormalities.
Cardiac stroke volume and paradox images (1) are both representations of the change in volume (activity) from the dia-
For reprints contact: G. A. Lis, Baystate Medical Center-Springfield Hospital Unit, 759 Chestnut Street, Springfield, MA 01107.
stolic and systolic frames. With our technique, negative volume changes between adjacent frames (dv/dt) are combined to construct a cinematic display of the pattern of emptying. Conversely, positive volume changes between adjacent frames can be combined for a cinematic display of the pattern of filling. A dynamic representation of the positive and negative changes in volume with time and space results when the pattern of filling is added to a constant grey field with simultaneous subtraction of the pattern of emptying. A black wave of emptying pattern results when the emptying phase is subtracted from the routine gated blood pool study.
Materials and Methods Multigated equilibrium cardiac blood pool scans were per
formed on patients with and without conduction abnormalities after equilibration of 20 mCi Tc-99m red blood cells
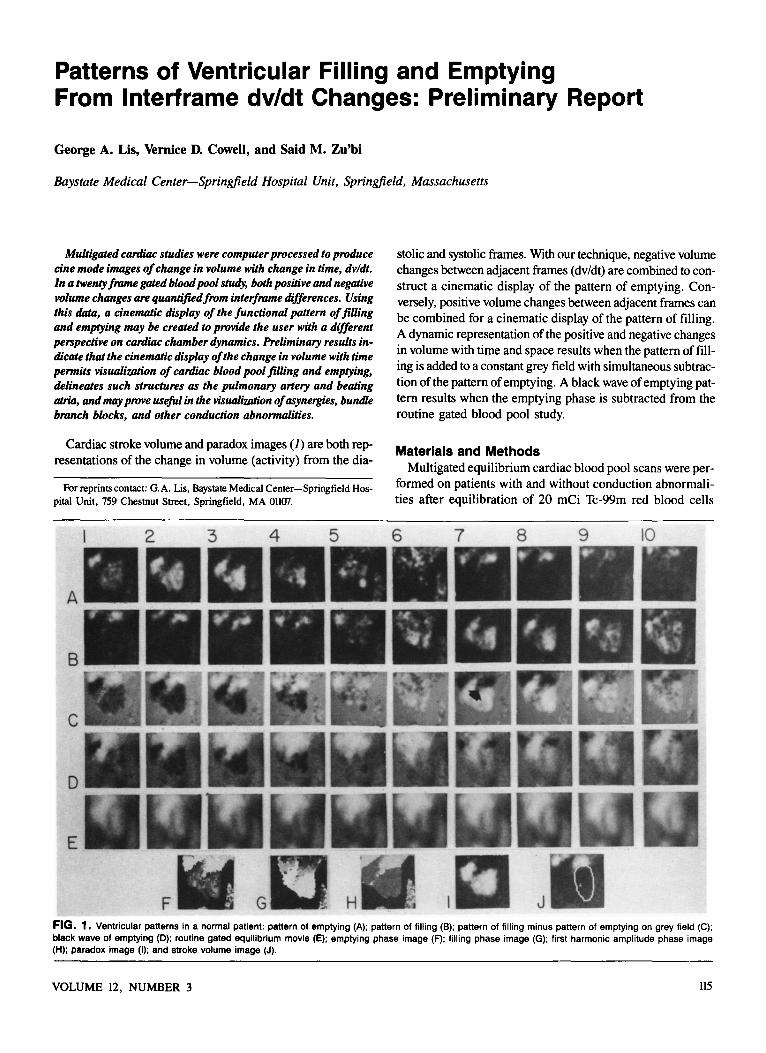
FIG. 1. Ventricular patterns in a normal patient: pattern of emptying (A); pattern of filling (B); pattern of filling minus pattern of emptying on grey field (C); black wave of emptying (D);. routine gated equilibrium movie (E); emptying phase image (F); filling phase image (G); first harmonic amplitude phase image (H); paradox image (I); and stroke volume image (J).
VOLUME 12, NUMBER 3 us
labeled in vivo. A standard scintillation camera with a 30 o
slant-hole collimator was interfaced to a nuclear medicine computer to acquire 600 cardiac cycles of data. Each patient was positioned in the left anterior oblique projection to demonstrate the best ventricular separation. A frame duration of up to 40 msec was used to collect a 20 frame, 64 X 64 study.
A 35% background cutoff was found to be an optimal background subtract for display. Each of the 20 frames was spatially smoothed with a standard weighted nine point smooth (2). Finally, a weighted temporal 1:2:1 smoothing function was performed to generate 20 processed frames Fl to F20 (Fig. IE shows the gated study compressed to 10 frames). The positive remainder of processed frame one (Fl) minus frame two (F2) yields a functional image of those pixels whose time activity curves have a negative slope. Visual perception of regional negative volume changes as a function of time are thereby enhanced. Because the difference in counts between two adjacent frames is statistically poor, the positive difference of three groups of frames are merged for each cine mode frame with an additional spatial smooth. Display frame one combines three difference groups (Fl-F2) + (F2-F3) + (F3-F4). It is essential that only the positive remainders of adjacent frames, as given, rather than nonadjacent frames; i.e., (Fl-F4), are combined. Pixels filling in later frames may otherwise overtake pixels emptying in earlier frames and result in data loss. The second display frame is formed from the third difference group and combines (F3-F4) + (F4-F5) + (F5-F6). Thesequence described above is continued until a ten frame cine-
matic pattern of emptying as a function of time evolves (Fig. lA). It should be noted that the tenth movie frame combines (F19-F20) + (F20-Fl) + (Fl-F2) to form a continuous cine loop.
Conversely, the positive remainder of frame two minus frame one will yield a functional image of the positive time derivative of each pixel between frame one and two. By compounding these positive differences of three groups of frames for each movie frame, as before, a ten frame movie of the pattern of cardiac filling as a function of time is produced (Fig. lB). The interframe noise is significantly reduced through the improved statistics of compounding three groups of frames, smoothing, and background cutoff.
The filling pattern (Fig. lB) can be added to a grey field of 60 counts per pixel with simultaneous subtraction of the pattern of emptying (Fig. lA). We found sixty counts per pixel to be representative of the maximum contraction velocity seen when combining three difference groups into a movie frame. The movie produced by this manipulation displays regional positive volume changes in light grey to white, regional negative volume changes in dark grey to black, and zero volume change in neutral gray (Fig. lC). The degree of cardiac blood pool filling and emptying with time is visually enhanced and regions out of phase with each other are well delineated.
The cinematic display of the black wave of emptying (Fig. lD) similar to that introduced by Verba, et al (3) can be obtained as follows: the original20 frame gated blood pool study is processed, as before, combined into a ten frame movie (Fig.
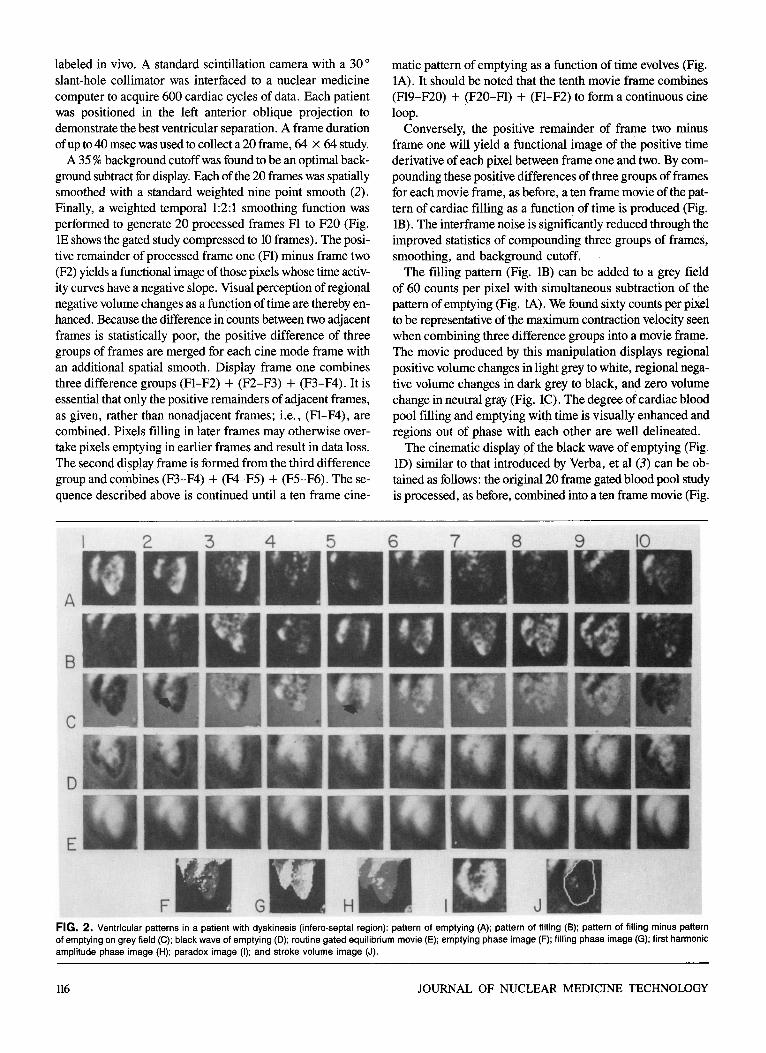
FIG. 2. Ventricular patterns in a patient with dyskinesis (infero-septal region): pattern of emptying (A); pattern of filling (B); pattern of filling minus pattern of emptying on grey field (C); black wave of emptying (D); routine gated equilibrium movie (E); emptying phase image (F); filling phase image (G); first harmonic amplitude phase image (H); paradox image (I); and stroke volume image (J).
116 JOURNAL OF NUCLEAR MEDICINE TECHNOLOGY
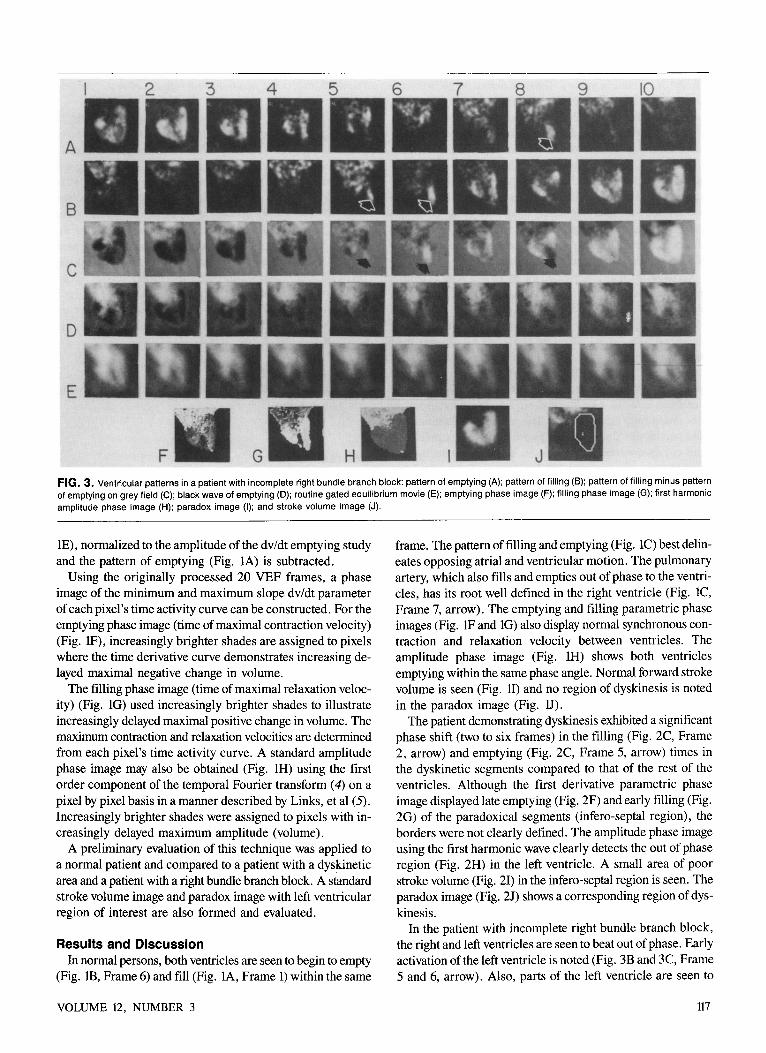
FIG. 3. Ventricular patterns in a patient with incomplete right bundle branch block: pattern of emptying (A); pattern of filling (B); pattern of filling minus pattern of emptying on grey field (C); black wave of emptying (D); routine gated equilibrium movie (E); emptying phase image (F); filling phase image (G); first harmonic amplitude phase image (H); paradox image (I); and stroke volume image (J).
lE), normalized to the amplitude of the dv/dt emptying study and the pattern of emptying (Fig. lA) is subtracted.
Using the originally processed 20 VEF frames, a phase image of the minimum and maximum slope dv/dt parameter of each pixel's time activity curve can be constructed. For the emptying phase image (time of maximal contraction velocity) (Fig. lF), increasingly brighter shades are assigned to pixels where the time derivative curve demonstrates increasing delayed maximal negative change in volume.
The filling phase image (time of maximal relaxation velocity) (Fig. lG) used increasingly brighter shades to illustrate increasingly delayed maximal positive change in volume. The maximum contraction and relaxation velocities are determined from each pixel's time activity curve. A standard amplitude phase image may also be obtained (Fig. lH) using the first order component of the temporal Fourier transform ( 4) on a pixel by pixel basis in a manner described by Links, et al (5). Increasingly brighter shades were assigned to pixels with increasingly delayed maximum amplitude (volume).
A preliminary evaluation of this technique was applied to a normal patient and compared to a patient with a dyskinetic area and a patient with a right bundle branch block. A standard stroke volume image and paradox image with left ventricular region of interest are also formed and evaluated.
Results and Discussion In normal persons, both ventricles are seen to begin to empty
(Fig. lB, Frame 6) and fill (Fig. lA, Frame 1) within the same
VOLUME 12, NUMBER 3
frame. The pattern of filling and emptying (Fig. lC) best delineates opposing atrial and ventricular motion. The pulmonary artery, which also fills and empties out of phase to the ventricles, has its root well defined in the right ventricle (Fig. lC, Frame 7, arrow). The emptying and filling parametric phase images (Fig. lF and lG) also display normal synchronous contraction and relaxation velocity between ventricles. The amplitude phase image (Fig. lH) shows both ventricles emptying within the same phase angle. Normal forward stroke volume is seen (Fig. 11) and no region of dyskinesis is noted in the paradox image (Fig. D).
The patient demonstrating dyskinesis exhibited a significant phase shift (two to six frames) in the filling (Fig. 2C, Frame 2, arrow) and emptying (Fig. 2C, Frame 5, arrow) times in the dyskinetic segments compared to that of the rest of the ventricles. Although the first derivative parametric phase image displayed late emptying (Fig. 2F) and early filling (Fig. 2G) of the paradoxical segments (infero-septal region), the borders were not clearly defined. The amplitude phase image using the first harmonic wave clearly detects the out of phase region (Fig. 2H) in the left ventricle. A small area of poor stroke volume (Fig. 2I) in the infero-septal region is seen. The paradox image (Fig. 2J) shows a corresponding region of dyskinesis.
In the patient with incomplete right bundle branch block, the right and left ventricles are seen to beat out of phase. Early activation of the left ventricle is noted (Fig. 3B and 3C, Frame 5 and 6, arrow). Also, parts of the left ventricle are seen to
117
empty out of synchrony with the rest of the left ventricle (Fig. 3A and 3C, Frame 8, arrow). The time derivative phase image displayed the left ventricle with late apical emptying (Fig. 3F), early apical filling (Fig. 3G), and poor delineation of the out of phase region. The late frame apical emptying actually represents early activation of the left ventricle before the next cardiac cycle. The amplitude phase image (Fig. 3H) inadequately depicts the asynchrony in this patient. Although the degree of out of phase filling and emptying is seen to span two to three frames in magnitude, there is no evidence of dyskinesis on the paradox image (Fig. 3J). Also, a normal stroke volume pattern (Fig. 31) is noted, as expected, since the asynchrony occurs after mechanical systole.
Verba, et a! (3) has introduced the spreading wave of emptying display in cinematic format. Our method differs from Verba's in that both the positive and negative first derivatives of a time-activity curve from a temporally and spatially smoothed background corrected study are used rather than the negative first derivative of a Fourier filtered time activity curve. With Verba's method, the total Fourier transform of each pixel is multiplied by a filter function and then the inverse transform is taken. Our method requires a very reasonable processing time (ten minutes). The amplitude phase images obtained by the first harmonic Fourier analysis of pixel volume curves may contain significant inaccuracies intrinsic to the first harmonic approach (6). Links, eta! (5) has noted that the point at which the fundamental frequency curve is maximally positive does not correspond exactly with end diastole in normal persons displaying clear diastasis. Wendt, eta! (6) observed that the first harmonic phase parameter may not always be related to the onset of mechanical systole. Thesequence of emptying is not accurately described. These inaccuracies stem from the inability of the first harmonic wave to accurately fit each pixel's time activity curve for every patient. With our technique, the interval of diastasis during ventricular filling and the equilibrium phase during atrial emptying (7) as well as the point of true diastole and systole and true sequence emptying of each pixel, will be accurately preserved since each pixel's time activity curve is accurately represented. Preliminary results indicate that smoothed compounded interframe dv/dt cinematic functional images may prove useful in the study of asynergies and other wall motion abnormalities.
Our technique is intended to be performed on a standard gated equilibrium cardiac study using 600 cardiac cycles so
118
that no modification of our present acquisition procedure is required, except the additional ten minutes of computer processing.
Although ten frames per cardiac cycle may not be sufficient to analyze subtle temporal abnormalities, increasing the frame rate would yield interframe differences that are statistically poor. Doubling the number of cardiac cycles, however, will result in improved statistics and permit a frame rate of 20 frames per cardiac cycle for improved temporal resolution. Also, the elementary spatial and temporal smoothing algorithms, as well as the 35% background cutoff could be improved by more sophisticated smoothing and filtering techniques, such as frequency impulse response ( 8) and Weiner (9) or Metz (10) filters. However, these further enhancements of the interframe difference technique (which are under investigation) require additional patient acquisition time, approximately four times the processing time, and are beyond the scope of this preliminary report.
Acknowledgment Special thanks to Louise Williams for her help in preparing
this manuscript.
References I. Holman BL, Wynne J, Iodine J, et al. The paradox image: A noninvasive
index of regional left-ventricular dyskinesis. J Nuc/ Med 1979;20:1237-42. 2. Digital Equipment Corp. Nine Point Smooth Command (S9). In Gamma-
11 Operaror:1· Guide AA-2I85C-Tc Ji>rsion 3, 1980, Sec. 5-45. 3. Verba JW, Bornstein I, Alazraki NP, et al. Onset and progression of
mechanical systole derived from gated radionuclide techniques and displayed in cine format. J Nuc/ Med 1979;20:P625-26.
4. Champhney DC. Fourier Transforms and Their Physical Applications.
New York, Academic Press, 1973:8-21. 5. LinksJM, Douglass KH, Wagner Jr. HN. Patternsofventricularempty
ing by Fourier analysis of gated blood pool studies. J Nuc/ Med 1980;21:978-82. 6 Wendt RE, Murphy PH, Clark Jr. JW, et al. Inaccuracies in multi-gated
Fourier functional images. J Nuc/ Med 1982;23:P66. 7. Marmor A, Biello DR, Sampathkumaran KS, et al. A new scintigraphic
technique for assessment of right atrial function. Radiology 1981;139:719-23. 8. Todd-Pokropek A. Image processing in nuclear medicine. IEEE Trans
Nuc/ Sci 1980;NS-27:1080-94. 9. Miller TR, Sampathl.:umaran KS. Design and application of finite impulse
response digital filters. Eur J Nuc/ Med: (in press). IO. Metz CE, Beck RN. Quantitative effects of stationary linear image pro
cessing on noise and resolution of structure in radionuclide images. J Nuc/
Med 1974;15:164-70.
JOURNAL OF NUCLEAR MEDICINE TECHNOLOGY