Embed Size (px)
Citation preview
Patterns of research collaboration in a digital library forEconomics
Nisa BakkalbasiYale University, PO Box 208240, New Haven, Connecticut06520 [email protected]
Thomas KrichelPalmer School of Library and Information Science, Long Island University 720Northern Boulevard, Brookville, New York 11548 [email protected]
RePEc (Research Papers in Economics) has been conceived and developed topromote scholarly communication and to enhance the dissemination of researchfindings in the field of economics. RePEc offers the RePEc Author Service (RAS)where economics authors can claim authorship of the research papers that aredescribed in RePEc archives. The data from this service forms a high-qualityauthorship database. We investigate the structure of research collaborations withinRePEc by applying social network analysis to the co-authorship network formed bythe RAS registrants. We perform a component size analysis and calculate centralitymetrics. Our findings imply that the RAS registrant population is made up of highlyactive academics that are well connected to each other. In addition, RAS registrantsappear to have a broad range of coauthors, with most individuals having only a fewcoauthors, whereas a few have many. We compare and contrast results from anumber of recent studies of similar scope on co-authorship networks.
Introduction and motivation
Even though the roots of present day digital libraries may be traced to the informationretrieval systems of the 1960s, digital libraries, as we know them today, have emerged onlyin the past decade to serve different constituencies and communities (Fox & Urs, 2002).RePEc (Research Papers in Economics), one of the earliest digital libraries in existence,has been conceived and developed to document scholarly communication and enhance thedissemination of research findings in the field of economics (Walshe, 2001). RePEc is acollaborative effort of hundreds of volunteers in 51 countries. As of this writing, RePEcdescribes over 362,000 items of interest such as working papers, journal articles, software

components, and instructional datasets. All RePEc data, freely available online, arecontributed by academic departments, institutions involved in economics research (e.g.central banks), publishers, and individuals. Barrueco Cruz and Krichel (2001), earlypioneers of RePEc, provide a detailed discussion of their approach towards building thedigital library and summarize the basic principles.
RePEc is based on three concepts: “archive,” “site,” and “service.” A service is defined as a“rendering of RePEc data in a form that is available to the end user.” The definition can beexpanded to include activities such as mining the archive data, discovering potentiallyuseful information about the users, and presenting it in a form that is meaningful to theresearch community. To facilitate some of these activities, RePEc provides severalinnovative user services:
“NEP: New Economics Papers,” at http://nep.repec.org , is a human-mediated currentawareness service.“LogEc,” at http://logec.repec.org , gives detailed access statistics for RePEc itemsand authors. “CitEc,” at http://citec.ier.hit-u.ac.jp , gives citations from items in the RePEcdatabase. The “RePEc Author Service,” at http://authors.repec.org , is an author registrationservice.
This study focuses on the RePEc Author Service (RAS), a user service that maintainspersonal data, which enables analysis related to the association between authors anddocuments.
In all bibliometric studies, the availability of complete and correct authorship data remains asignificant obstacle in obtaining statistically accurate results. Although bibliographic datacontain author names, a name does not necessarily identify an author uniquely. A numberof factors contribute to the variety of ways author names appear in standard bibliographicdata. Several authors may share the same name, a name can be written in various formsand the use of initials, accents or capitalizations may be inconsistent. To illustrate, here isan example of three names referring to the same author:
Phillips, P C BPeter C.B. PhillipsPeter Phillips
Additional problems are introduced by the transliterations from non-Roman to Romanalphabets. (e.g., Chaykovskiy, Tchaikovsky). In general, raw author name data have to beput through a long and arduous cleaning process before they can be used for authorshipanalyses. The RAS provides utilities for an author to register, provide a profile and codifyhis/her own authorship data in its database. The RAS database, therefore, contains

high-quality authorship data for analysis.
This paper analyzes the patterns of authorships and incidence of collaborative relationshipsamong all RAS registrants. The remainder of the paper is organized as follows. In sectiontwo we discuss the RAS in more detail. In particular, we assess its completeness. Insection three we study co-authorship among RAS registrants using social network analysis(SNA) methodology. In section four we provide our conclusions and suggest future work.
The RePEc Author Service (RAS)
Overview and operation
To the best of our knowledge, the RAS is a one-of-a-kind service with much potential incultivating collaboration and cooperation among “digital library” users, promotinginformation sharing and creating a sense of community in a digital environment. Eachauthor registers himself/herself voluntarily and creates a professional profile. Then, theauthor provides contact information, affiliation, and publications. Following is an extract of arecord from the RAS database:
Template-Type: ReDIF-Person 1.0Name-First: ChristianName-Last: ZimmermannName-Full: Christian ZimmermannWorkplace-Organization: RePEc:edi:deuctusEmail: [email protected]: http://ideas.repec.org/zimm/Author-Paper: repec:cre:crefwp:33Author-Paper: repec:mtl:montde:2000-05Author-Software: repec:dge:qmrbcd:99Author-Software: repec:dge:qmrbcd:97Author-Paper: repec:uct:uconnp:2005-01Author-Article: repec:eee:jcecon:v:33:y:2005:i:1:p:88-106Author-Article: repec:eee:jmacro:v:26:y:2004:i:4:p:637-659Author-Paper: repec:sce:scecf5:372Author-Paper: repec:red:sed005:561Short-Id: pzi1Handle: repec:per:1964-12-14:christian_zimmermannLast-Login-Date: 2005-11-21 15:25:20 -0500Registered-Date: 2004-02-29 17:36:09 -0600
Figure 1 provides a screenshot of a web page that renders this data on the web.

Figure 1. Author web page for Christian Zimmermann from the EconPapers service.
Registered authors receive a monthly notification, which includes statistics on abstractviews and downloads of their works.
Assessment of RAS Data
In order to assess document and author coverage in RAS, we perform basic statisticalanalysis on two databases: RePEc and RAS. RePEc contains 362,080 documents. RAScontains 124,447 documents that have been claimed by at least one registered author. Thisobservation indicates that roughly one in three papers in RePEc is included in the RASdatabase. Furthermore, the number of authorships in RAS is 152,072, whereas thecorresponding number is 609,225 in RePEc, suggesting that about one in four authorshipsin RePEc are covered in the RAS.
At a disaggregated level, we examine how many registered authors have claimed to be anauthor of a paper. Table 1 furnishes a list of the number of authors on a paper and thecorresponding number of papers in the entire RePEc database vs. RAS database. RePEccontains 180,716 (49.91%) documents with a single author, whereas RAS contains 99,562(80%) documents with one registered author. It is quite possible that a document may havemore than one author, but only one may have registered in the RAS. In RePEc, there are

1.68 authors per document whereas in RAS, there are 1.22 authors per document. Whilethe maximum number of authors for a single document reaches 24 in RePEc database, thisnumber remains at a maximum of 8 in the RAS database.
Table 1. Distribution of the number of authors per paper in RePEc and RAS
Number of authors Number of papers
RePEc RAS
1 180716 (49.91%) 99562 (80.00%)
2 129638 (35.80%) 22315 (17.93%)
3 42427 (11.72%) 2425 (1.95%)
4 7021 (1.94%) 130 (0.10%)
5 1338 (0.37%) 9 (0.01%)
6 425 (0.12%) 4 (0.00%)
7 193 (0.05%) 1 (0.00%)
8 99 (0.03%) 1 (0.00%)
Table 2 provides basic statistics for RAS registrants. Of the 12,381 registrants in the RASdatabase, 8,666 have claimed at least one document while the remaining 3,715 haveclaimed none. It is difficult to explain why some individuals have registered for the RAS butnot claimed any papers. Therefore, such records are excluded from further analysis. Theaverage number of papers per registered author is 17.55, which is significantly higher thanthe average number of papers per author in various academic fields reported in othersimilar studies. For example, Newman (2004b) reports that the average number of papersper author is 6.4 in biology, 5.1 in physics, and 6.9 in mathematics based on the number ofauthors in Medline, Physics E-print archive, and Mathematical Reviews, respectively. Thereare possible explanations for the difference. First and foremost, RAS registrants are likelyto be active in research and publication, evidenced by their interest in the service, andhence more prolific than an average author found in an indexing and abstracting database.Second, RePEc covers both journal articles and working papers, and might contain boththe working version(s) and formally-published form of a document. Finally, it is likely thatthe prior studies underestimated the averages due to the difficulties outlined above inreliably distinguishing variations of the name of the same author.
Table 2. Summary statistics for RAS registrants
Number of RAS registrants 12381
Number of registrants who did not claim a paper 3715
Number of registrants who claim at least one paper 8666

Number of authorships 152072
Average number of papers/author 17.55
Figure 2 provides the frequency distribution of authors by number of documents they claim.A close examination of data reveals a tendency for authors who have claimed a largenumber of documents to register with RAS. In particular, three RAS registrants claim over300 documents, fifteen registrants claim between 200 and 300 documents, and so on. Itcan be seen from the data that the percentage of authors with two or more articles is 87%,the authors with three or more articles is 76%, the authors with four or more articles is 69%.
Figure 2. Frequency distribution of authors by number of documents
According to the well known Lotka’s Law of scientific productivity, about 60%of the authors publish only once (Egghe, 2005), which is not the case here.Using the software program LOTKA (Rousseau and Rousseau, 2000), wetest whether Lotka’s Law is valid for RAS registrants. We find that:
where f(y)denotes the relative number of authors with y publications. According toKolmogorov-Smirnov statistic (Dmax=0.2022), the observed author publication frequenciescannot be described by the Lotka distribution. This indicates that interest in RAS is morewide spread among researchers who are highly productive. Prolific authors also act ashubs in the co-authorship network, as we will demonstrate in our analyses.
RAS co-authorship analysis

In this section, we investigate the structure of research collaborations within theco-authorship network of RAS using social network analysis methodology.
Introduction to social network analysis
Social network analysis is concerned with understanding the linkages among social entitiesand the implications of these linkages (Wasserman & Faust, 1994). A social networkconsists of a set of social entities and the relations defined on them, referred to as "actors"and "ties" respectively. A network can be presented as a graph, which consists of points (ornodes) to represent actors and lines (or edges) to represent ties or relations. An example ofa social network diagram is given below.
Figure 3. A social network diagram
Co-authorship network studies
In recent years, there has been a vivid interest in the co-authorship networks to examinethe patterns of collaborations within an academic community and determine the status andinfluence of individual researchers. Recent studies of research collaboration in a number ofacademic fields demonstrate that social network analysis plays a critical role in determining
how well-connected a research community is. The academic fields range from physics,biomedical research, mathematics, computer science (Newman, 2004a; Newman, 2004b),neuroscience (Barabasi, Jeong, Neda, Ravasz, Schubert, & Vicsek, 2005), to digital libraryresearch community (Liu, Bollen, Nelson, & Van de Sompel, 2005) and economics (Goyal,van der Leij, Moraga-Gonzalez, 2004) and information sciences (Otte & Rousseau, 2002).
RAS co-authorship network
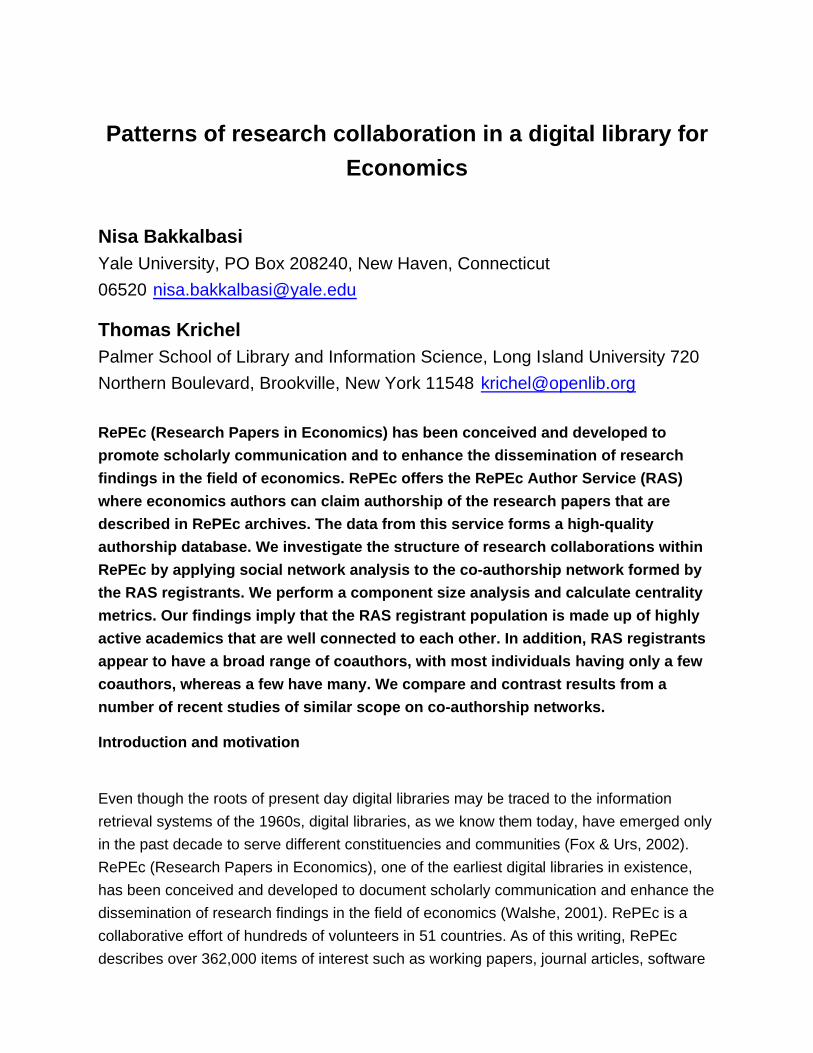
In the co-authorship network model for this study, nodes represent authors and an edgeconnects two authors if they coauthored one or more papers. We build a binary graphrepresenting a nondirectional dichotomous relationship, that is a tie is either present orabsent between each pair of authors. In this study, we do not take the frequency ofco-authorship between authors into account. We plan to investigate weighted co-authorshipnetworks in the future. Table 3 shows the summary statistics for RAS co-authorshipnetworks.
Table 3. Summary statistics for RAS authors and co-authorship networks
Number of authorships by co-authors 137550
Number of authors with at least one co-author 5661
Number of authorships with at least one co-author 109924
Average number of collaborators/co-author 2.05
Size of the largest component 4659
Number of components 382
Network Diameter 22
To better understand the nature of collaboration patterns both on a micro- (i.e., immediateconnections between authors) and a macro-scale (i.e., connections to the larger network),we first consider a number of basic statistics. The average number of collaborators perauthor is 2.05, which is smaller than the numbers observed in other disciplines. Forexample, Newman (2004b) reported, on average, 18.1 collaborators for biology, 9.7collaborators for physics, and 3.9 collaborators for mathematics. The most highlyconnected RAS author has 27 collaborators, which is lower than the number reported inother studies. For example, the Goyal et al. study reports that, for the 1990-1999 period inEconLit database, the average number of collaborators is 1.67 while the maximallyconnected economist has more than 50 collaborators. Table 4 furnishes a list of the 25highest ranking economists according to the number of their collaborators found in RAS. Aquick visual scan of Table 4 demonstrates wide differences among the authors. Forexample, Randall Wright has the most number of collaborators with 27 co-authors, and has

claimed 106 documents. On the other hand, Barry Eichengreen has fewer collaboratorswith 19, but has claimed almost three times more documents (i.e., 323). A further ad hocsearch reveals similar observations. For example, Gert Wagner ranks within the top 25 with19 collaborators, but has claimed only 46 papers, whereas Jeffrey Frankel (who does notappear among the top 25 in Table 4) has 15 collaborators but has claimed 234 papers.
Table 4. Authors ranked according to the number of co-authors
Rank Author Co-authors Papers
1 Randall Wright 27 106
2 Joseph Stiglitz 26 320
3 Clive Granger 25 165
4 James Stock 23 111
5 Pierre Chiappori 23 91
6 Martin Feldstein 22 259
7 Philip Franses 22 163
8 Robert Hubbard 22 116
9 Francis Diebold 21 189
10 Stephen Jenkins 21 138
11 Ronald MacDonald 21 137
12 Costas Meghir 21 86
13 Peter Phillips 20 315
14 Thomas Sargent 20 128
15 Fabio Schiantarelli 20 81
16 Barry Eichengreen 19 323
17 Hashem Pesaran 19 272
18 Andrew Rose 19 179
19 Olivier Blanchard 19 144
20 Edward Prescott 19 110
21 Carlo Favero 19 80
22 Gert Wagner 19 46
23 Eric Ghysels 18 195
24 Robert Engle 18 157
25 Francesco Giavazzi 18 80
The RAS co-authorship network is not a single connected graph but partitioned into one

large component and many smaller components (i.e., groups of authors who arecollectively linked by collaboration paths). The entire co-authorship network is composed of382 components. The largest component has 4,659 authors (82% of the network, 53% ofthe population), the second largest component has 18 authors, the third largest componenthas 12, and so on. Figure 4 gives the component size distribution.
Figure 4. Component size distribution
Centrality metrics
To examine the structural position of authors within the network, we calculate threecentrality metrics for the network: degree, betweenness, and closeness. Table 5 gives theranking of top 25 authors based on each of the metrics.
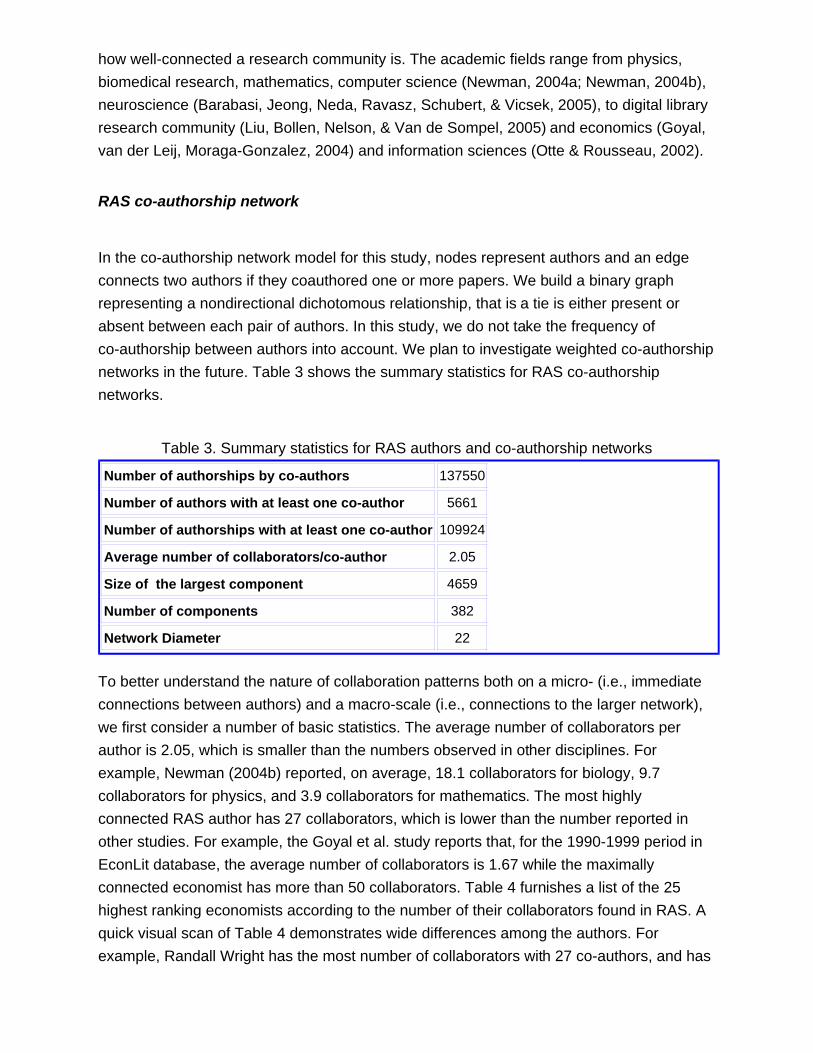
Degree:The degree centrality is the number of adjacent edges a node (i.e., an author) has, and canbe considered a measure of “activity.” We used the sna package of R to obtain degreecentrality (using Freeman’s approach) for our network. It turns out that Randall Wright hasthe highest number of immediate edges. Appendix A shows the local network for RandallWright drawn with Pajek (Package for Large Network Analysis). He is followed by twowinners of the Bank of Sweden Prize in the memory of Alfred Nobel (henceforth Nobelprize): Joseph Stiglitz, recipient of Nobel prize in 2001, and Clive Granger, the recipientNobel prize in 2003. The degree centrality distribution, as shown in Figure 5, indicates thatonly a few authors have a high degree of connection while many others have a low degree.

Closeness:Closeness indicates an author’s connection to all others through the length of a path in thecorresponding social network. If we call the length of the shortest path between two authorsthe “distance,” then the average of the distance between an author and all other authors inthe same component measures the “closeness” of an author. To calculate the path length,we wrote a Perl script that implements the shortest-path algorithm by Newman (2001).Please note that, in any given network, there may be several shortest paths, albeit of equallength. In our network, Nobel prize winner Joseph Stiglitz ranks highest in closenessmeasure. This is not surprising given his prominent standing in the field.

Betweeness:While the degree is a measure of direct connectedness within the immediate network,betweenness is a measure of indirect connectedness to the larger network. Betweenness ismeasured by the number of times an author appears on the shortest paths between twoother authors. If n designates the number of all shortest paths between authors A and B,and the author C may appear on p of them (p ? n), then the fraction p/n indicates the betweenness of author C between authors A and B. Therefore, betweenness measure ofthe author C is the sum of betweenness measures among all author pairs A and B.Therefore all authors who have only collaborated with one other registered author have abetweenness of 0. In our study, Joseph Stiglitz has the highest betweenness measure, andit is dramatically larger than everyone else.
It is noteworthy that there are the differences between closeness and betweenessmeasures among the authors. Some authors rank high on both counts. These are thescholars who have written a lot of papers with a lot of collaborators. There are also authorswho score high on betweeness but relatively low on closeness. These are the authors whoact as a bridge between sub-communities and the larger collaboration group. Suchsub-communities may be regional in character. For example, Gert Wagner appears to actas a bridge for Latin American authors. Sub-communities can also be discipline-based. Forexample, Hashem Pesaran’s work straddles macroeconomics and econometrics. Similarly,Andrew Postlewaite’s work bridges game theory and microeconomics.
For this particular network, we observed that the diameter (i.e., the largest geodesicdistance between any pair of nodes in the graph) is 22 which is smaller than 29 reported inGoyal et al study based on articles in EconLit for the 90’s period.
Table 5. Authors ranked according to centrality measure
Rank Degree Betweenness Closeness
1 Randall Wright 54 Joseph Stiglitz 903758.86 Joseph Stiglitz 4.8199
2 Joseph Stiglitz 52 Fabio Schiantarelli 700949.47 Olivier Blanchard 4.8952
3 Clive Granger 50 Juergen von Hagen 699927.26 James Stock 4.9594
4 Pierre Chiappori 46 Costas Meghir 626284.35 Fabio Schiantarelli 4.9972
5 James Stock 46 Clive Granger 587076.57 Martin Feldstein 5.0004
6 Martin Feldstein 44 Gert Wagner 579692.04 Juergen von Hagen 5.0453
7 Philip Franses 44 Mark Taylor 551873.68 Costas Meghir 5.0459
8 Robert Hubbard 44 Olivier Blanchard 541855.20 Barry Eichengreen 5.0711
9 Francis Diebold 42 Pierre Chiappori 530045.41 Marcus Miller 5.0805

10 Stephen Jenkins 42 Klaus Zimmermann 504285.85 Alison Booth 5.0893
11 Ronald MacDonald 42 Thierry Verdier 468907.77 Robert Hubbard 5.0910
12 Costas Meghir 42 Friedrich Schneider 446818.87 Michael Rothschild 5.0988
13 Peter Phillips 40 James Stock 442058.12 William Brock 5.1136
14 Thomas Sargent 40 Alison Booth 440886.92 Mark Gertler 5.1166
15 Fabio Schiantarelli 40 Harald Uhlig 429068.93 Mark Taylor 5.1280
16 Olivier Blanchard 38 Hashem Pesaran 423172.90 Randall Wright 5.1353
17 Barry Eichengreen 38 Martin Feldstein 419839.19 Pierre Chiappori 5.1361
18 Carlo Favero 38 Andrew Postlewaite 410989.36 Paul Beaudry 5.1533
19 Hashem Pesaran 38 John List 410771.01 Michael Devereux 5.1569
20 Edward Prescott 38 Stephen Jenkins 409343.06 Lars Svensson 5.1651
21 Andrew Rose 38 Ronald MacDonald 400140.56 Thierry Verdier 5.1707
22 Gert Wagner 38 Paul Beaudry 396126.25 Andrew Rose 5.1730
23 Robert Engle 36 Francis Diebold 394494.57 Francesco Giavazzi 5.1730
24 Eric Ghysels 36 Eric Ghysels 385767.44 Gregory Mankiw 5.1748
25 Francesco Giavazzi 36 Randall Wright 384312.69 Michael Woodford 5.1767
Conclusion and Future Work
In this paper, we take a broad look at the patterns of research collaboration in RePEc, alarge digital library for Economics. The data used to construct the co-authorship network forthis study is not complete due to those authors who have not documented all their papers intheir profiles and/or their co-authors are not RAS registrants. However, the database fromRePEc yields high-quality authorship data from 8,666 registrants who claim at least onepaper, and 152,072 corresponding authorship records.
In general we observe that authors who have written a large number of papers tend toregister with RAS. In terms of information productivity, the 80/20 Rule (i.e., 80% of theinformation productivity is generated by 20% of the information resources), does not applyto RAS authors. In addition, RAS registrants appear to have a broad range of coauthors,with most having only a few coauthors, whereas a few having many. Although the averagenumber of collaborators per author in RAS appears to be lower compared to otherdisciplines, it is observed to be higher when compared with another similar study ineconomics. Our findings imply that the RAS population is made up of highly activeacademics that are well connected to each other.
Although the author profiles maintain valuable information at an individual level (e.g., the

number of downloads, references to citing articles, etc.), they lack information at a broaderlevel (i.e, the co-authorship relations within the research community). The latter informationcan be extracted from the archive and incorporated into the profiles. We believe this willadd significant value to the service as we analyze the social dimension of scholarlyresearch which can be best understood by examining it within a network context.Consequently, insights gained from this study will help RePEc team in developing astrategic plan to expand and improve the service in the near future. Ultimately, our goal isto make this source of information available for the RePEc digital library community andothers interested in the phenomenon of research collaboration in the field of economics.One possible direction for future work is to build a user service where authors examine thepaths that lead them to other authors.
Finally, the results reported here represent only a small portion of what can be done withthis data. The RePEc database not only identifies the authors but their affiliations (e.g.,universities, research institutions) as well. In order to understand the nature ofconnectedness better, we propose to study author affiliations.
References
Barabasi, A.L., Jeong, H., Neda, Z., Ravasz, E., Schubert, A. & Vicsek, T. (2005) Evolutionof the social network of scientific collaborations arXiv:cond-mat/0104162v1
Barrueco Cruz, José Manuel, & Krichel, Thomas. (2000) Cataloging economics preprints:An introduction to the RePEc project Journal of Internet Cataloging 3(3), 227 -241
Egghe, Leo. (2005) Power laws in the information production process: lotkaianinformetrics Elsevier Academic Press
Fox, Edward A. & Urs Shalini R. (2002) Digital libraries Annual Review of InformationScience and Technology 36 (1), 502-589
Goyal, Sanjeev, van der Leij, Marco J. & Moraga, José-Luis (2004) Economics: AnEmerging Small World? CESifo Working Paper Series No. 1287; FEEM Working PaperNo. 84.04; Tinbergen Institute Discussion Paper No. 04-001/1
Liu, Xiaoming; Bollen, Johan; Nelson, Michael L. & Van de Sompel, Herbert.(2005) Co-authorship networks in the digital library research community InformationProcessing & Management 41 (6), 1462-1480
Newman, M.E.J. (2004a) Who is the best connected scientist? A study of scientific coauthorship networks Lecture Notes in Physics 650, 337-3370
Newman, M.E.J. (2004b) Co-authorship networks and patterns of scientificcollaboration Proceedings Of The National Academy Of Sciences Of The United StatesOf America. 101 (Suppl. 1) 5200 - 5205
Newman, M. E. J. (2001) Scientific collaboration networks. II. Shortest paths, weightednetworks, and centrality Physical Review E 64, 016132
Otte, Evelien & Rousseau, Ronald. (2002) Social network analysis: a powerful strategy,also for the information sciences Journal of Information Science 28(6), 441-453
Rousseau, B. & Rousseau, R. (2000) LOTKA: a program to fit a power law distribution toobserved frequency data Cybermetrics 4(4). Available at http://www.cindoc.csic.es/cybermetrics/articles/v4i1p4.html
Walshe, Emily (2001) Creating an academic self-documentation system through digitallibrary interoperability: the RePEc model The New Review of Information Networking 7, 43-58
Wasserman, S., & Faust, K. (1994) Social network analysis: methods andapplications Cambridge University Press
Appendix A. Local network for Randall Wright