Embed Size (px)
Citation preview
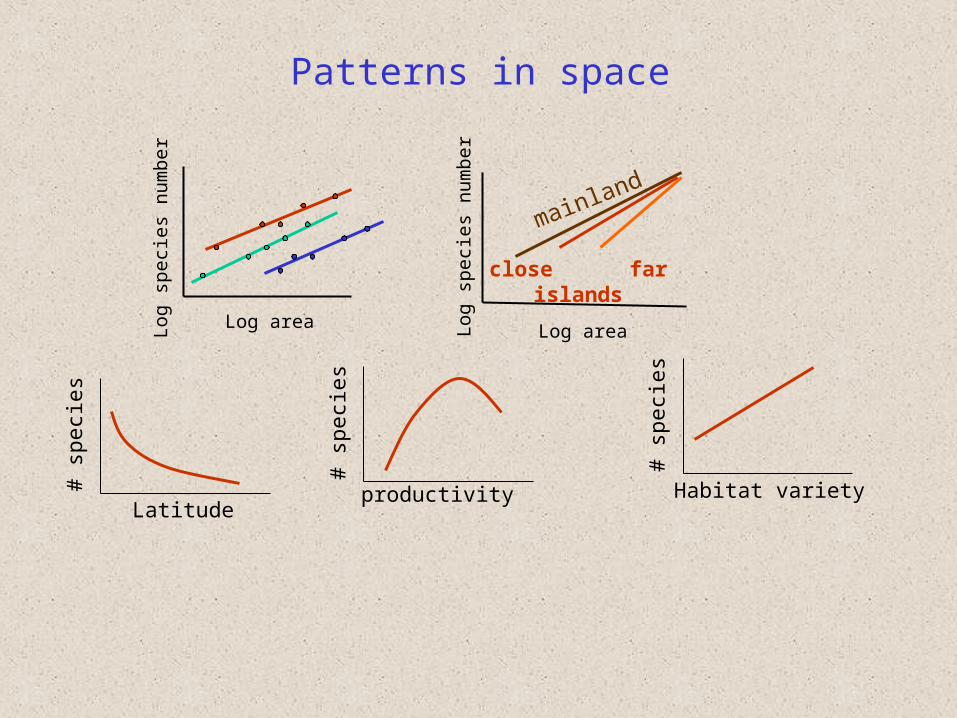
Patterns in space
Log areaLog
spe
cies
num
ber
productivity
# sp
ecie
s
Habitat variety
# sp
ecie
s
Latitude
# sp
ecie
s
mainland
Log area
Log
spe
cies
num
ber
close farislands
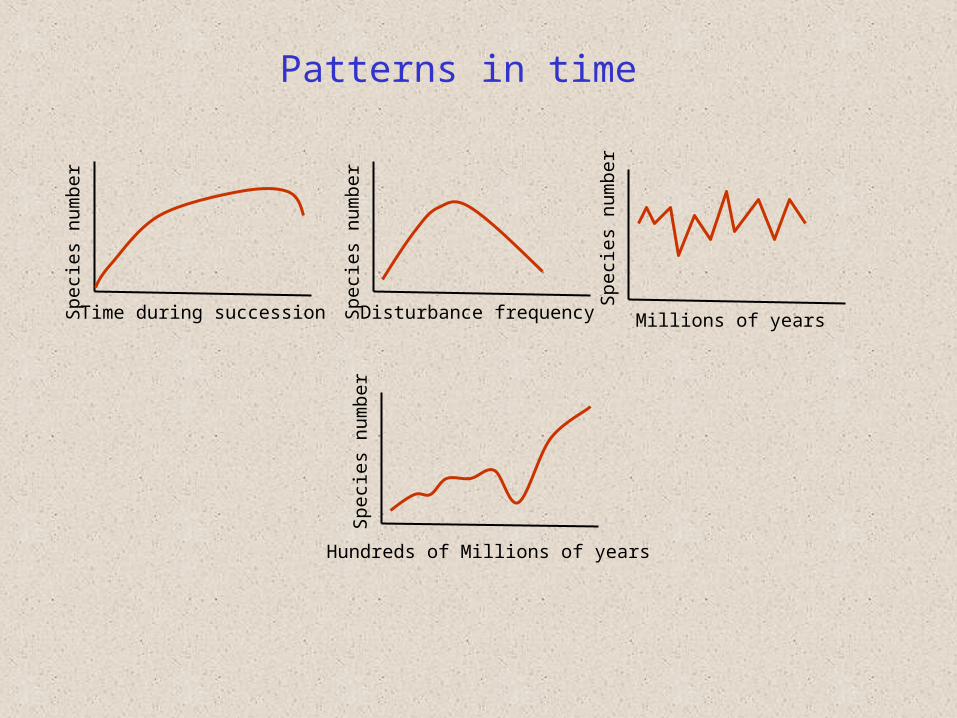
Time during successionSpe
cie
s nu
mbe
r
Disturbance frequencySpe
cie
s nu
mbe
r
Millions of years
Spe
cie
s nu
mbe
r
Patterns in time
Hundreds of Millions of years
Spe
cie
s nu
mbe
r
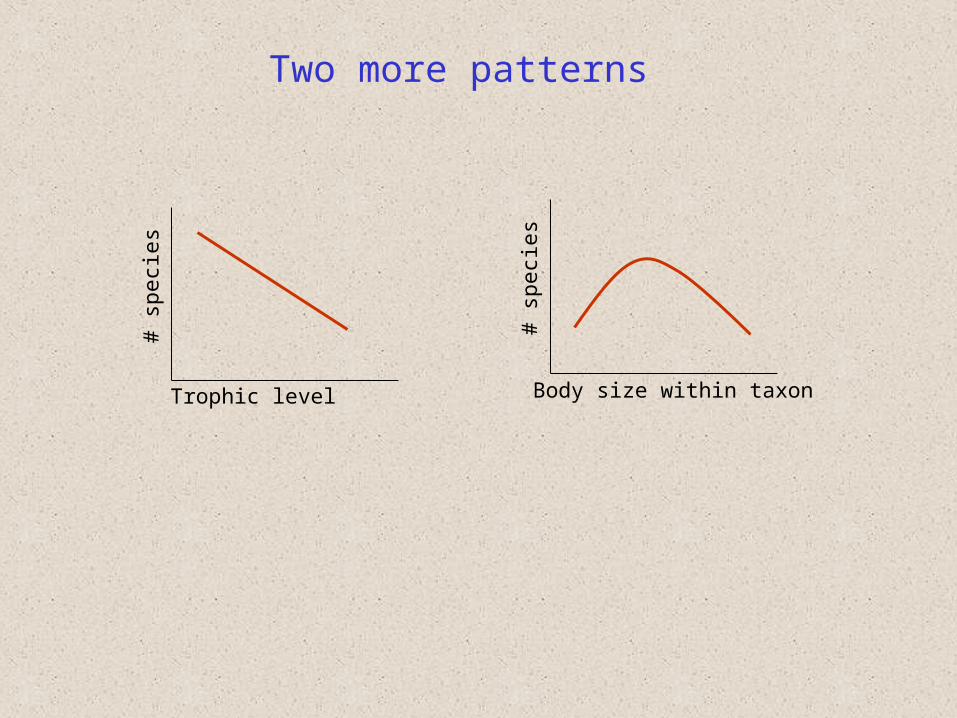
Trophic level
# sp
ecie
s
Two more patterns
Body size within taxon
# sp
ecie
s
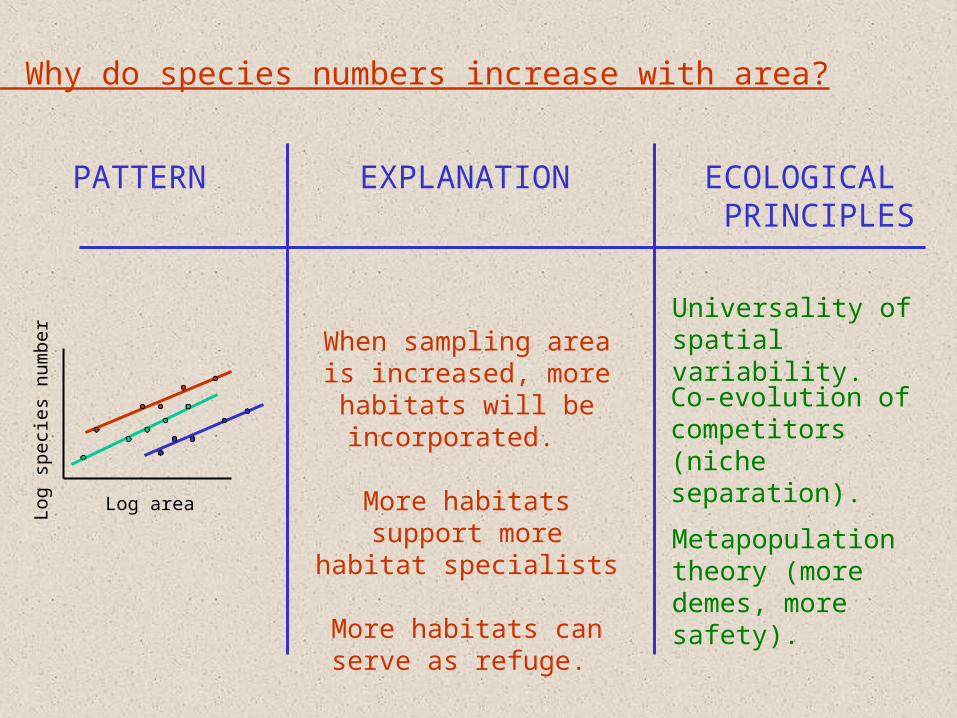
1) Why do species numbers increase with area?
Log areaLog
spe
cies
num
ber
PATTERN EXPLANATION ECOLOGICAL PRINCIPLES
When sampling area is increased, more habitats
will be incorporated.
More habitats support more habitat specialists
More habitats can serve as refuge.
Co-evolution of competitors (niche separation).
Universality of spatial variability.
Metapopulation theory (more demes, more safety).
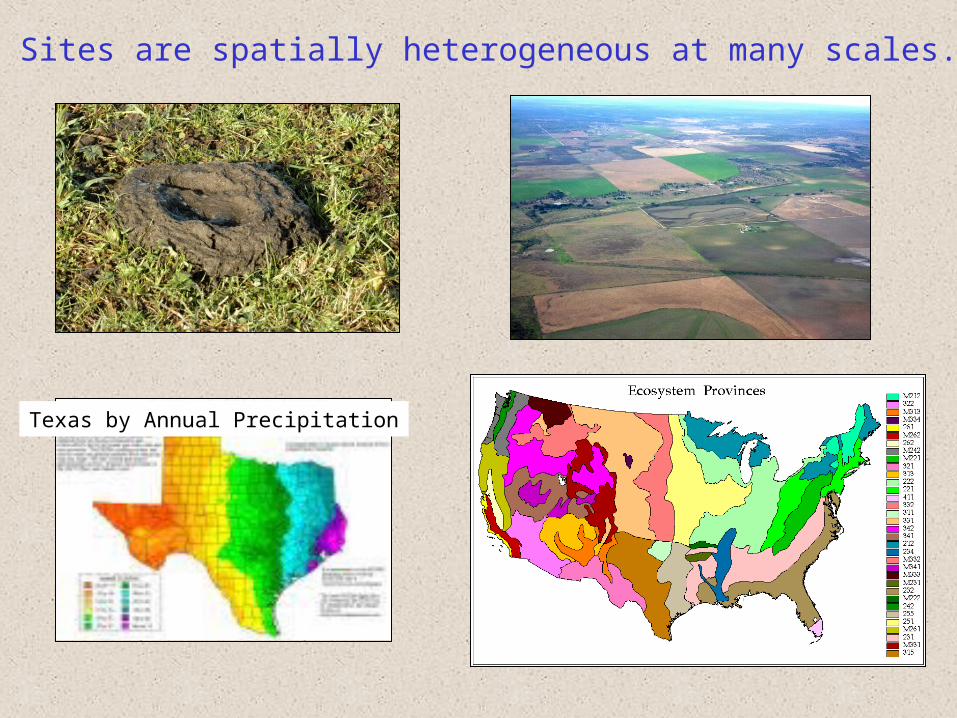
Sites are spatially heterogeneous at many scales.
Texas by Annual Precipitation

2) Diversity generally increases with productivity.
PATTERN EXPLANATION ECOLOGICAL PRINCIPLES
Higher productivity supports more individuals
(biomass). Therefore, more species can attain
the minimal viable population size.
Most productive environments exclude weak competitors??
Makes some PP relationships unstable??
Minimal viable population size (through demographic stochasticity, Allee effects, genetic drift).
productivity
# sp
ecie
s
Competitive exclusion principle.
Paradox of enrichment.
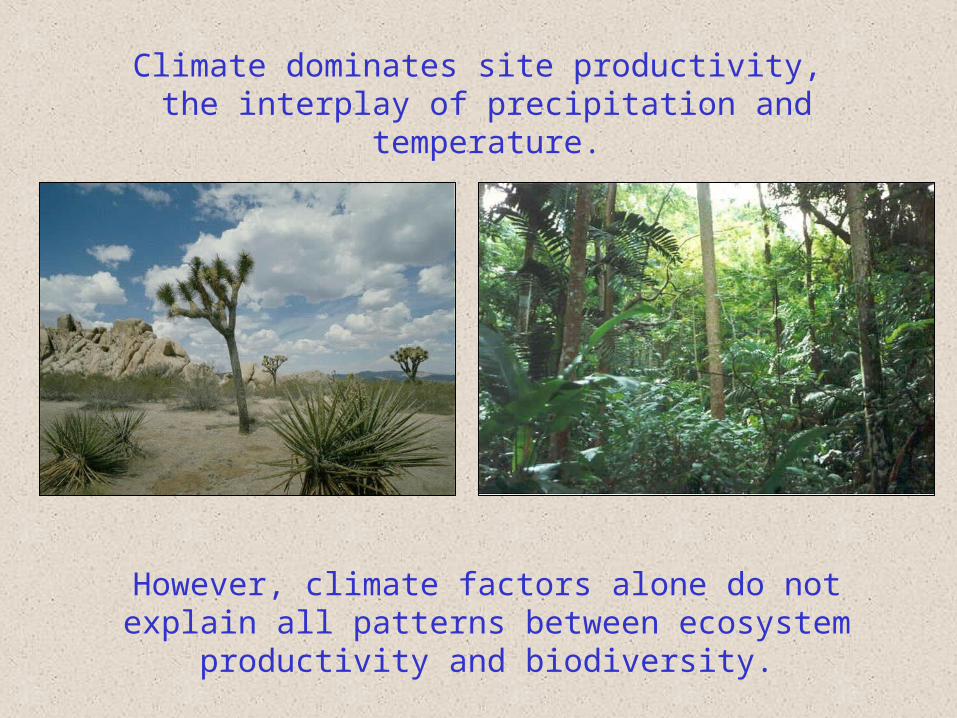
Climate dominates site productivity, the interplay of precipitation and temperature.
However, climate factors alone do not explain all patterns between ecosystem productivity and biodiversity.

3) A more spatially variable habitat has more species per area.
PATTERN EXPLANATION ECOLOGICAL PRINCIPLES
Habitat variety
# sp
ecie
s
More habitats support more habitat specialists.
Co-evolution of competitors (niche separation).

4) Biodiversity decreases between the species-rich equatorial tropics and the species-poor polar regions.
PATTERN EXPLANATION ECOLOGICAL PRINCIPLES
Latitude
# sp
ecie
s
Higher productivity supports more individuals
(biomass), therefore, more species.
Minimal viable population size (through demographic stochasticity, Allee effects, genetic drift).

Mercator projection
Equal-area projection
John Terborgh recognized (1973) that the tropics are the largest contiguous earth biome.


4) Biodiversity decreases between the species-rich equatorial tropics and the species-poor polar regions.
PATTERN EXPLANATION ECOLOGICAL PRINCIPLES
Latitude
# sp
ecie
s
Higher productivity supports more individuals
(biomass), therefore, more species.
The tropics are larger than any another biome, therefore species have
lower extinction rates and more opportunities for
speciation.
Larger ranges are bigger targets for geographical barriers (speciation).
Minimal viable population size.
Metapopulation theory (more demes, more safety).
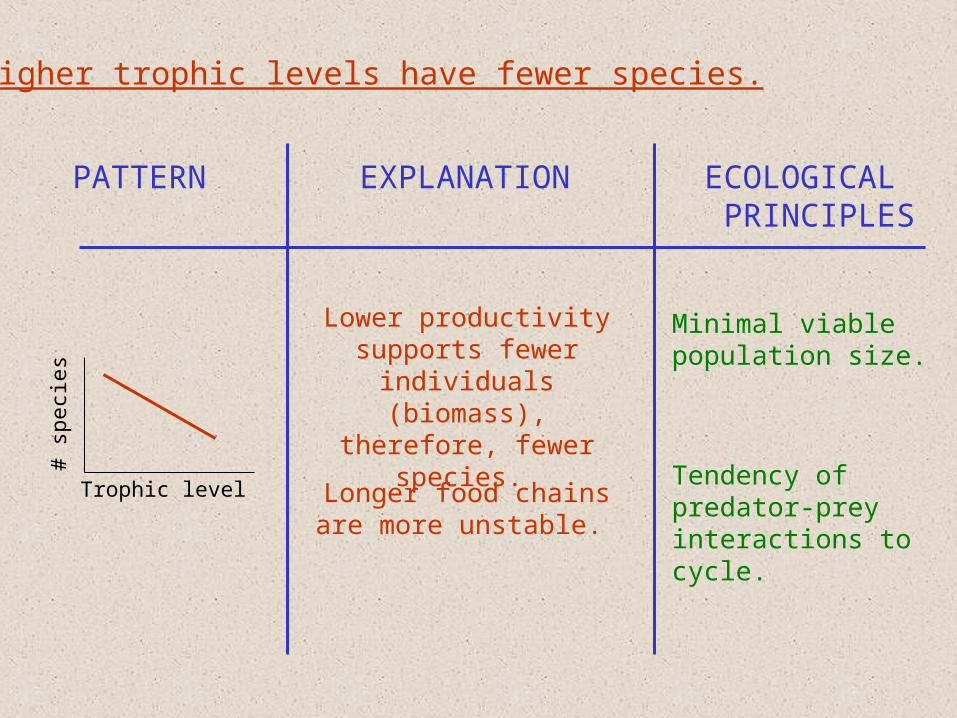
5) Higher trophic levels have fewer species.
PATTERN EXPLANATION ECOLOGICAL PRINCIPLES
Trophic level
# sp
ecie
s
Lower productivity supports fewer individuals
(biomass), therefore, fewer species.
Longer food chains are more unstable.
Tendency of predator-prey interactions to cycle.
Minimal viable population size.

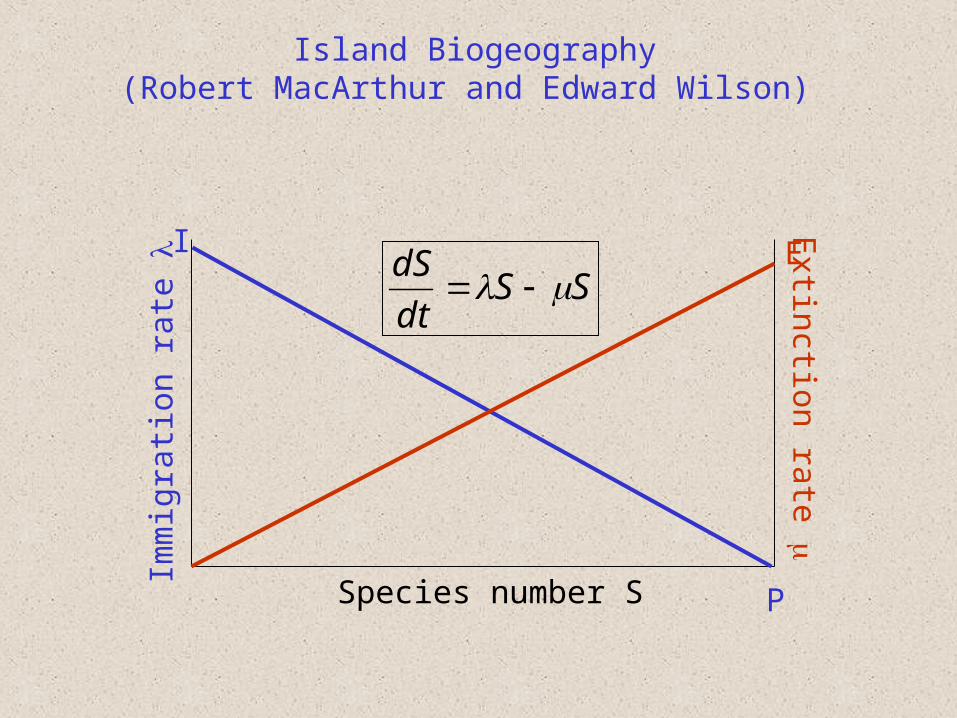
6) Islands have fewer species than mainlands.7) Farther islands have fewer species than closer islands.
PATTERN EXPLANATION ECOLOGICAL PRINCIPLES
Species numbers on islands are regulated through the rates of immigration (from
mainland) and local extinction.
Farther islands have reduced immigration rates.
Islands do not have sink species.
Metapopulation dynamics. Species numbers are at equilibrium (extinction rates = immigration rates).
Source-sink populations.
mainland
Log area
Log
spe
cies
num
ber
close farislands
Imm
igra
tion
rate
E
xtinction rate
Species number S
I
P
ESS
dt
dS
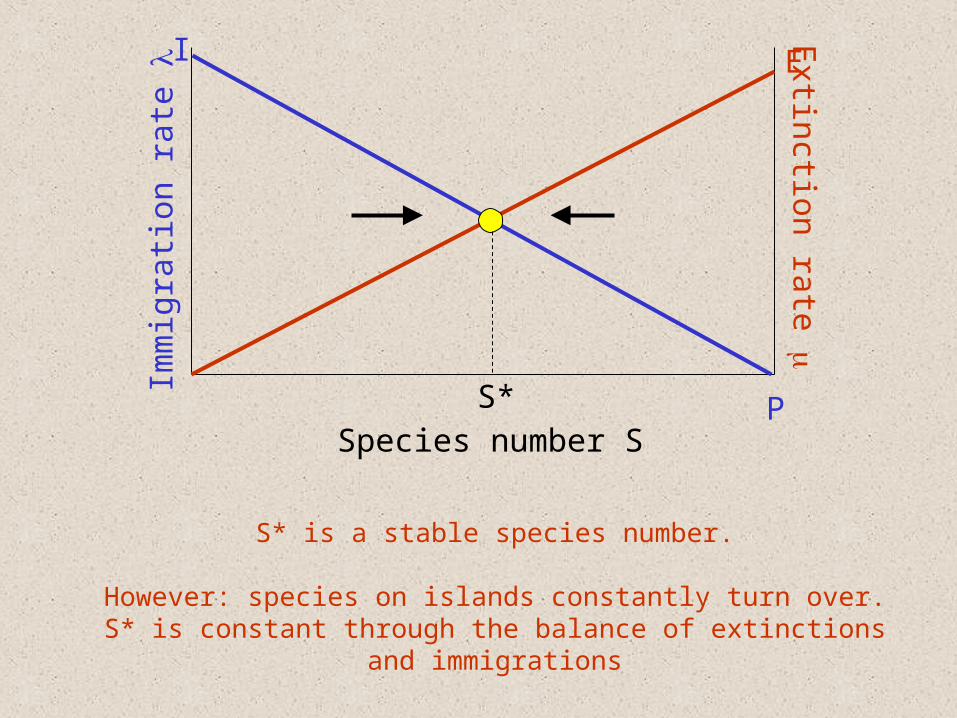
Island Biogeography(Robert MacArthur and Edward Wilson)
Imm
igra
tion
rate
E
xtinction rate
Species number S
I
P
E
S*
S* is a stable species number.
However: species on islands constantly turn over. S* is constant through the balance of extinctions and immigrations
Imm
igra
tion
rate
E
xtinction rate
Species number S
I
P
E
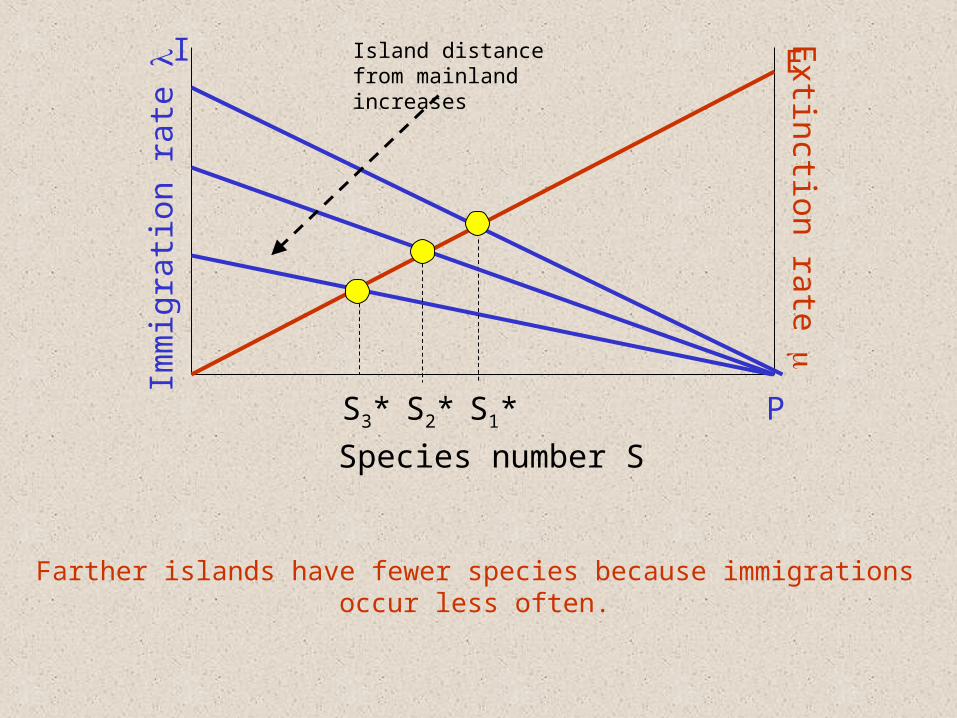
S1*
Farther islands have fewer species because immigrations occur less often.
S3* S2*
Island distance from mainland increases

Imm
igra
tion
rate
E
xtinction rate
Species number S
I
P
E
S1*
Larger islands have lower extinction rates than smaller islands (because population sizes are larger).
S3*S2*
Island size increases
Imm
igra
tion
rate
E
xtinction rate
Species number S
I
P
E
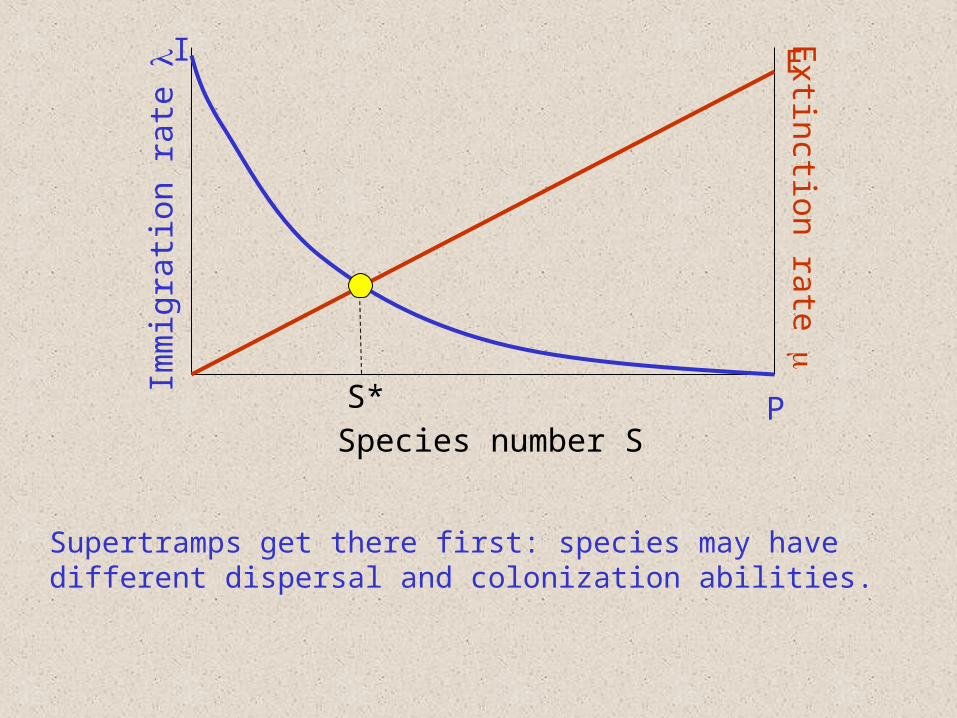
Supertramps get there first: species may have different dispersal and colonization abilities.
S*

Extinction rate accelerates with species number: some species may begin to compete or some species may eat another to extinction upon arrival.
Imm
igra
tion
rate
E
xtinction rate
Species number S
I
P
E
S*
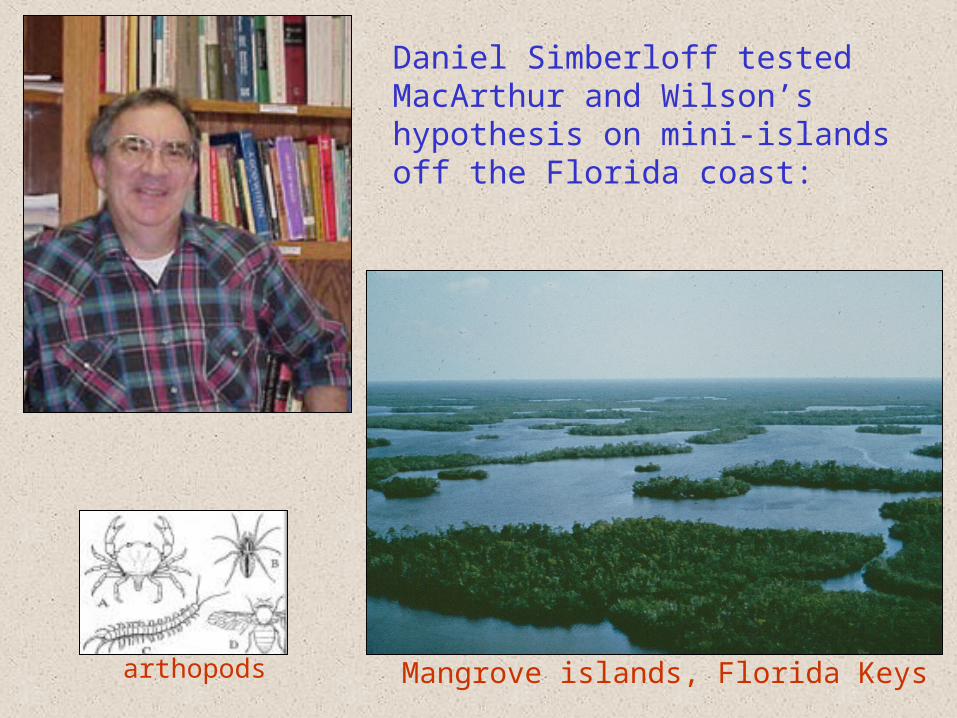
Mangrove islands, Florida Keys
Daniel Simberloff tested MacArthur and Wilson’s hypothesis on mini-islands off the Florida coast:
arthopods

Do species turn over? – Yes.
In 1970, Simberloff defaunated four small islands.
Islands: Years 0-1 Years 1- 2 Years 2-3
E1 0.100 0.194 0.219
E2 0.196 0.263 0.239
E3 0.190 0.225 0.250
ST2 0.395 0.514 0.341
Species held in common between the time before defaunation and subsequent censuses (as fractions):

Does island size affect species number? – Yes.
Simberloff reduced island size, by cutting down mangrove trees and counted species before and one year after.
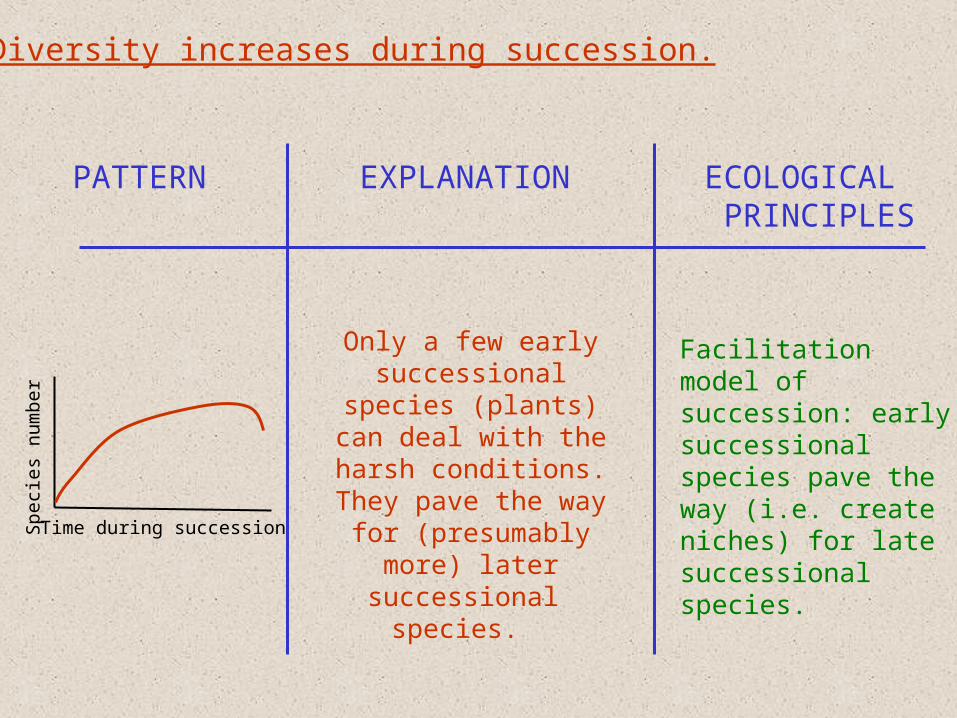
8) Diversity increases during succession.
PATTERN EXPLANATION ECOLOGICAL PRINCIPLES
Only a few early successional species
(plants) can deal with the harsh conditions. They
pave the way for (presumably more) later
successional species.
Facilitation model of succession: early successional species pave the way (i.e. create niches) for late successional species.
Time during successionSpe
cie
s nu
mbe
r

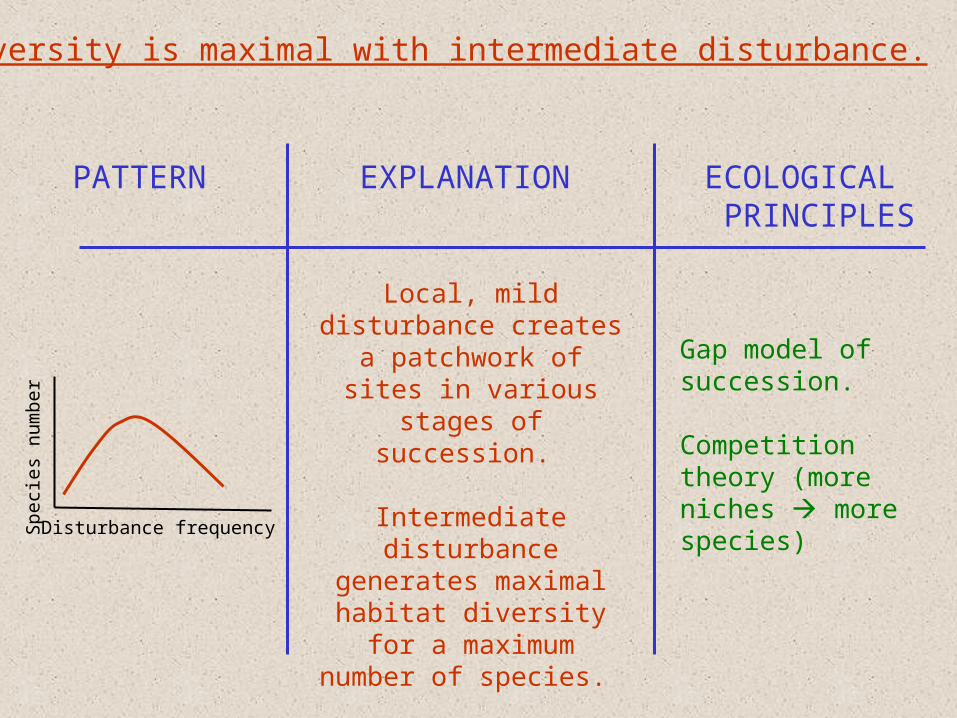
9) Diversity is maximal with intermediate disturbance.
PATTERN EXPLANATION ECOLOGICAL PRINCIPLES
Local, mild disturbance creates a patchwork of
sites in various stages of succession.
Intermediate disturbance generates maximal habitat
diversity for a maximum number of species.
Gap model of succession.
Competition theory (more niches more species)
Disturbance frequencySpe
cie
s nu
mbe
r

10) Over millions of years, diversity stays constant.
PATTERN EXPLANATION ECOLOGICAL PRINCIPLES
Mainland diversity may (like island diversity) track a stable equilibrium where extinction rates balance
speciation rates.
Metapopulation theory (for the extinction part)
Co-evolution of competitors: empty niches tend to fill.Millions of years
Spe
cie
s nu
mbe
r w
ithin
tax
on
Spe
ciat
ion
rate
Extinction rate
Species number S
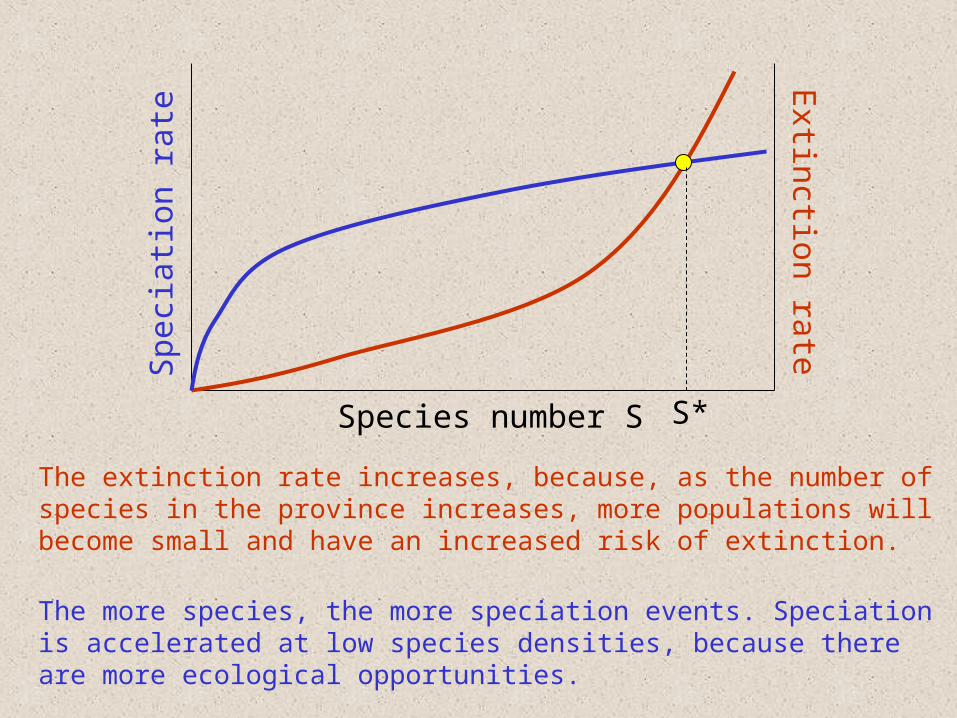
The more species, the more speciation events. Speciation is accelerated at low species densities, because there are more ecological opportunities.
The extinction rate increases, because, as the number of species in the province increases, more populations will become small and have an increased risk of extinction.
S*
Spe
ciat
ion
rate
Extinction rate
Species number S
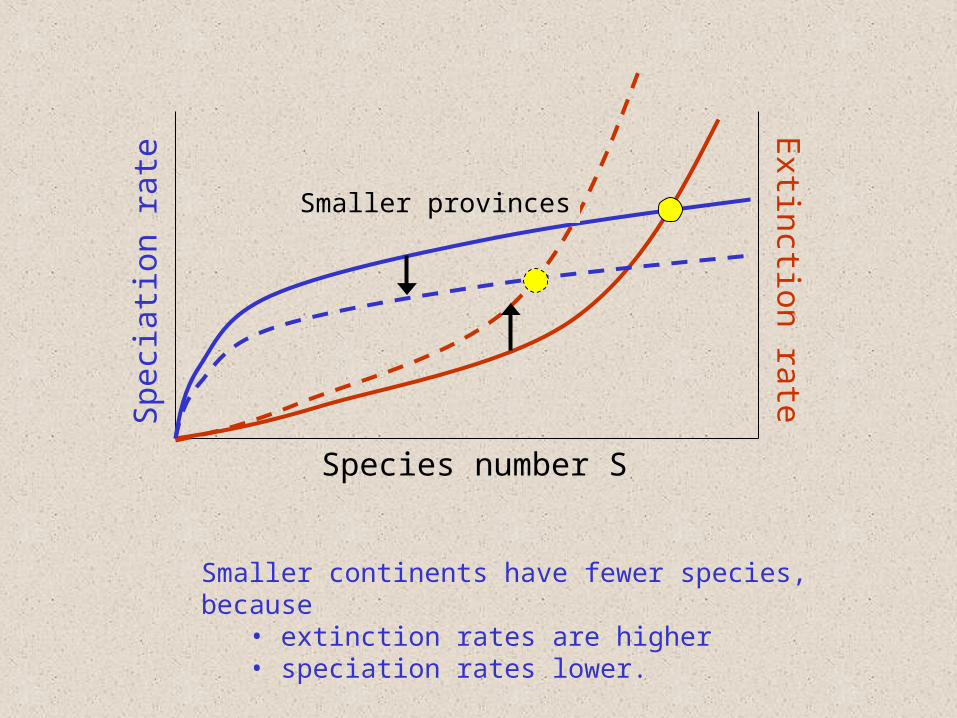
Smaller provinces
Smaller continents have fewer species, because • extinction rates are higher • speciation rates lower.

Larger continents have more species
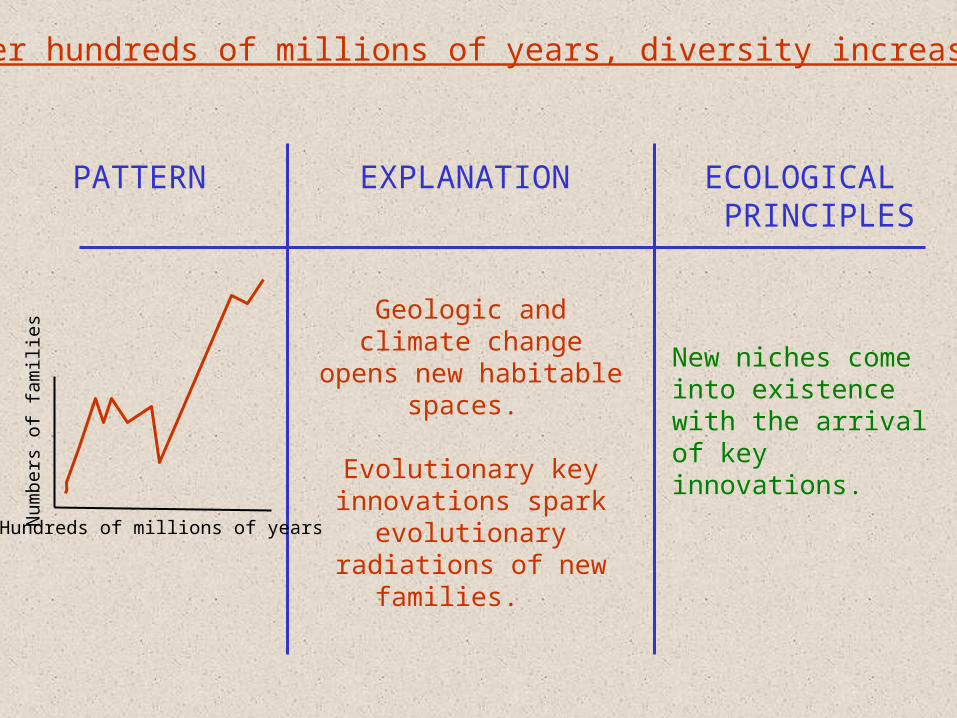
10) Over hundreds of millions of years, diversity increases.
PATTERN EXPLANATION ECOLOGICAL PRINCIPLES
Geologic and climate change opens new habitable spaces.
Evolutionary key innovations spark
evolutionary radiations of new families.
New niches come into existence with the arrival of key innovations.
Hundreds of millions of years
Num
ber
s of
fam
ilies

Adaptive radiation after the rise of key innovation.
Example: the hypocone in mammalian cheek teeth:
Evolved > 20 times independently during the last 65 Mio years.Groups with hypocone greatly diversified, groups without did not.
The hypocone improves the processing of plant materials.
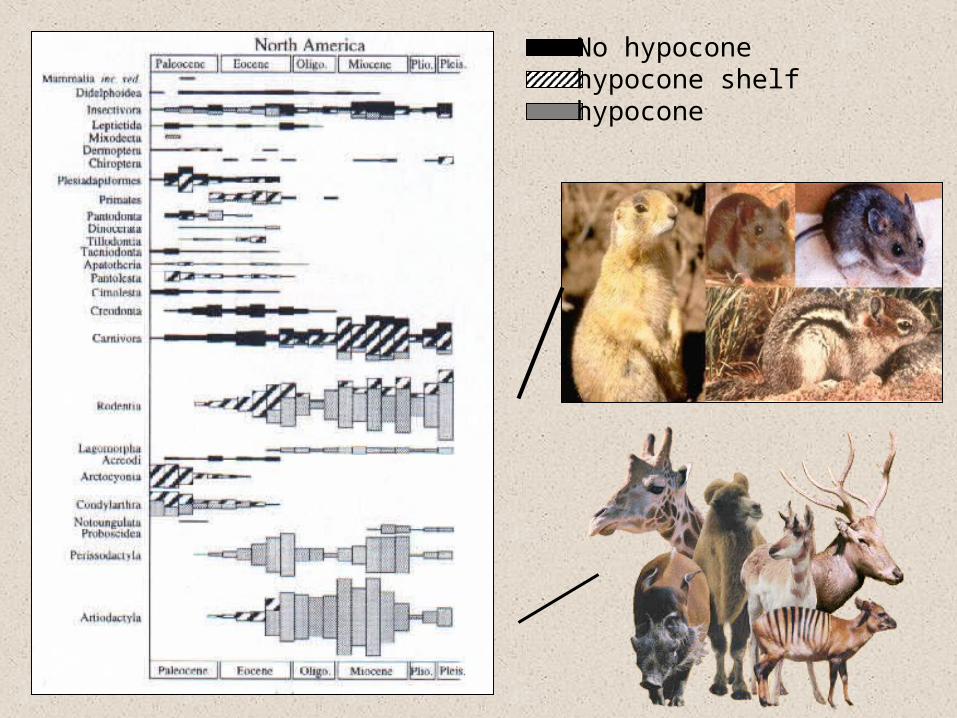
No hypoconehypocone shelfhypocone


![The species-area relationship and evolution90 dance Curves (approximately log-normal [11]). Although species in the Tan-91 gled Nature model are dynamical and emergent, properties](https://img.dokumen.tips/doc/110x75/5f6ade2c5066565a5825bce0/the-species-area-relationship-and-evolution-90-dance-curves-approximately-log-normal.jpg)