Embed Size (px)
Citation preview

Patterns in Activity Models for Process Oriented Guided Inquiry Learning (POGIL)
1
CLIFTON KUSSMAUL, Green Mango Associates, LLC
Process Oriented Guided Inquiry Learning (POGIL) is an evidence based strategy for learning in which teams of students worked on classroom activities that guide them to develop understand and practice skills. A POGIL activity consists of a set of models, each followed by a series of questions to guide student thinking. This paper presents a set of patterns for models that are often used in POGIL activities, in order to help POGIL authors create better activities more efficiently.
Categories and Subject Descriptors: K.3.1 [Computers and Education]: Computer Uses in Education—Collaborative learning;
D.3.3 [Programming Languages]: Language Constructs and Features—Patterns
General Terms: Design, Human Factors
Additional Key Words and Phrases: Active Learning, Patterns, POGIL, Process Oriented Guided Inquiry Learning,
ACM Reference Format:
Kussmaul, C. 2020. Patterns in Activity Models for Process Oriented Guided Inquiry Learning (POGIL). HILLSIDE Proc. of Conf. on Pattern Lang. of Prog. (October 2020), 19 pages.
1. INTRODUCTION
Process Oriented Guided Inquiry Learning (POGIL) is an evidence-based strategy for learning in which teams of students work on classroom activities that guide them to understand concepts and practice skills. Each POGIL activity consists of a set of models, each followed by a series of questions to guide student thinking. This paper presents four patterns for models that are often used in POGIL activities. This should help POGIL authors to create better activities more efficiently, and help teachers to understand how POGIL activities work and how to use POGIL practices to better support student learning.
This paper continues and extends earlier work (Kussmaul, 2016; Kussmaul, 2017) and is organized as follows. The rest of Section 1 briefly describes pedagogical patterns, POGIL, and the potential benefits of patterns in POGIL. Section 2 describes the four patterns for models in POGIL activities. Section 3 describes conclusions and some future directions.
1.1 Patterns for Pedagogy
There are many instructional strategies and materials. Thus, it is useful to describe them and their components with a rich vocabulary that is not tied to one academic discipline. One effective approach is to use patterns, which are detailed descriptions of effective practices. Typically, a pattern includes an evocative name, a problem statement with forces that influence it, the context in which the problem occurs, a solution statement with consequences, discussion, and examples. For example, the pattern LIGHT ON TWO
SIDES OF EVERY ROOM (Alexander, Ishikawa, and Silverstein, 1977) is specific enough to be useful, but can be adapted to many contexts. Patterns were introduced for architecture (ibid.), and have been adapted in other areas, particularly software development (e.g., Fowler, 2002; Gamma, Helm, Johnson, and Vlissides, 1995). Pedagogical patterns have been described and used for over 20 years (e.g., Anthony, 1996; Bergin, 2000); for more details, see prior work (Kussmaul, 2016; Kussmaul, 2017).
1This work is supported by the US National Science Foundation (NSF) Grant #1626765. Author's address: C. Kussmaul, 730 Prospect Ave, Bethlehem, PA 18018 USA; email: [email protected]..
Permission to make digital or hard copies of all or part of this work for personal or classroom use is granted without fee provided that copies are not made or distributed for profit or commercial advantage and that copies bear this notice and the full citation on the first page. To copy otherwise, to republish, to post on servers or to redistribute to lists, requires prior specific permission. A preliminary version of this paper was presented in a writers' workshop at the Conference on Pattern Languages of Programs (PLoP). PLoP'20, OCTOBER. Copyright 2020 is held by the author(s). HILLSIDE XXX-X-XXXXXX-XX-X

For many teachers, when the problem is “Students need to learn X”, the default solutions are “Lecture on X”, “Assign reading on X”, “Assign homework or a project that involves X”, or “Test students on X”. However, these can be anti-patterns, defined as “a common response to a recurring problem that is usually ineffective and risks being highly counterproductive” (Wikipedia). A lecture focuses on teacher actions, not student outcomes, and is rarely effective for the higher levels (e.g., analyze, evaluate, and create) of Bloom’s taxonomy (Bloom, Engelhart, et al, 1956; Anderson & Krathwohl, 2001). Students usually do readings, homework, projects, and tests without direct support from the teacher. Students overestimate their learning from lectures (Carpenter, Wilford, Kornell, and Mullaney, 2013), while student outcomes improve through social constructivism, when they interact to construct their own understanding (Chi and Wylie, 2014).
Thus, when “Students need to learn X”, a better solution is often “Use an evidence-based, social constructivist activity about X” where students construct their own understanding and practice key skills, with a teacher available to guide and support. From a pattern perspective, each evidence-based strategy is a high-level pattern, composed of sub-patterns that might be shared with other strategies. For example, Peer Instruction (Mazur, 1996), Peer Led Team Learning, Problem-Based Learning, and Process Oriented Guided Inquiry Learning (Eberlein, et al, 2008) are evidence-based strategies that use student discussions, for which a variety of patterns have been described (see list in Kussmaul, 2016).
1.2 Process Oriented Guided Inquiry Learning (POGIL)
In Process Oriented Guided Inquiry Learning, teams of three to five students work during class time on specifically designed activities that guide them to discover and understand core concepts. At the same time, teams develop important higher-order skills, such as communication, teamwork, critical thinking, and problem solving (the process oriented). These are sometimes called “professional skills” or “soft skills”; the POGIL community calls them “process skills”, and considers their development to be at least as important as the course content. The teacher’s role shifts from disseminator (“sage on the stage”) to facilitator of learning (“guide on the side”), who continually assesses when and how to guide teams as they work (Moog, Creegan, Hanson, et al, 2006; Moog and Spencer, 2008; Simonson, 2019). Thus, a POGIL activity usually takes more time than a lecture or reading on the same topic, but leads to much deeper understanding and helps students to develop important skills. Prior work (Kussmaul, 2016) provides more details on the history of POGIL, evidence of effectiveness, and describes a POGIL activity.
POGIL activities contain models (e.g., diagrams, graphs, tables, definitions, code excerpts) and a series of critical thinking questions about the models. Each question is categorized as directed (easy to answer based on prior knowledge), convergent (requiring effort and usually leading to one answer), or divergent (open-ended, and thus likely to generate discussion and disagreement). These questions guide students through explore-invent-apply learning cycles (the guided inquiry) to explore the model and notice key features, then invent their own understanding of a key idea, and finally apply that understanding, often in another context. DCV QUESTIONS and EIA LEARNING CYCLES are described elsewhere (Kussmaul, 2016); note that DCV describes a question’s effort and difficulty, while EIA describes its role in a learning cycle.
1.3 Patterns and POGIL
A pattern language for POGIL articulates the tactic knowledge of experienced POGIL practitioners into explicit knowledge which can help others to write activities and facilitate classroom learning. This should help us to better identify and understand the elements and factors in classroom activities, and provide a vocabulary for higher-level discussions among POGIL authors and practitioners. This should also help other educators to understand and adopt practices that are effective, widespread, and well understood in the POGIL community.
For example, writing a POGIL activity is like writing a paper (or a pattern); the author must carefully plan, draft, and revise it to effectively guide student learning. A pattern language can help authors, coaches, and reviewers identify and solve problems, leading to better activities with less effort. Figure 1 illustrates how patterns could be used at multiple levels, using flowcharts as an example. First, choose or define high level objectives for a course, unit, and class session, and then choose or create learning activities to help students reach those objectives. For a POGIL activity, choose the models and EIA LEARNING CYCLE questions to guide student learning. The patterns described in this paper are at the lower level; in a POGIL activity, how do we create models and use them effectively?
Patterns in Activity Models for POGIL: Page - 2

Figure 1: Using patterns at multiple levels to plan learning activities.
Table 1 summarizes previously described patterns for POGIL activities. The first two patterns
(referenced in this paper) describe ways to categorize questions in a POGIL activity. The other three patterns describe POGIL activity models (Kussmaul, 2016). A longer list of previously documented patterns relevant for POGIL is available (Kussmaul, 2017).
Table 1: Previously described patterns for models and related concepts (Kussmaul 2016), in alphabetical order.
Pattern Patlet DCV QUESTIONS (DIRECTED, CONVERGENT, DIVERGENT)
Use a variety of question types, including directed, which are based on prior knowledge or given information; convergent, which require student effort and one (or a few) correct answer; and divergent, which also require effort and may have varied answers.
EIA LEARNING CYCLES
(EXPLORE-INVENT-APPLY) Use learning activities that include EIA LEARNING CYCLES where students answer questions that guide them to explore a model, invent their own understanding of a key concept, and then apply that understanding in another context.
MODEL: CHART OR GRAPH Use EIA LEARNING CYCLES where the model is a chart or graph to help students understand concepts based on data, and to help students develop skills in information processing.
MODEL: GAME OR PUZZLE Use EIA LEARNING CYCLES where the model is a game or puzzle that captures the essence of the problem in a COLORFUL ANALOGY that avoids extraneous details.
MODEL: TERMS & DEFINITIONS Use EIA LEARNING CYCLES where the model is a set of terms and definitions that are not conceptually difficult and that students may need to refer to in the future. (This is not recommended for difficult concepts.)
Patterns in Activity Models for POGIL: Page - 3

2. PATTERNS FOR POGIL MODELS
Models play a central role in an effective POGIL activity, and creating effective, robust models is difficult. When creating models, POGIL activity authors should consider the following questions:
● How relevant is this model to the topic, course, and discipline? Devote more time to more relevant models, since students will likely encounter them again.
● How much experience do students have with models like this? Devote more time (and use more scaffolded questions) on less familiar or more difficult models, or split them into simpler models.
● What other models might be simpler, or better support student learning? The relationships between POGIL models and learning objectives (what students should be able to do)
are not always obvious, as shown in Figure 2. Often, an activity about a topic will use an example of that topic as a POGIL model (top left quadrant); for example, an activity about flowcharts would likely use flowcharts as some of the POGIL models. However, an activity could also use other models (top right quadrant); for example, a flowchart activity might have models that are pseudocode or narrative descriptions of processes, and a flowchart activity might have no flowchart models, if it guided students to create their own flowchart without an example. Similarly, flowchart models could be used in activities on other topics (bottom left); for example, an activity about algorithms. Furthermore, most POGIL activities have multiple learning objectives for content topics and process skills, so an activity might be designed to help students learn about algorithms, flowcharts, and teamwork or time management.
POGIL model: X POGIL model: Z (not X)
Objective: Learn about X
Learn about X using X as model (e.g., learn about flowcharts using flowcharts as models).
Learn about X using Z as model (e.g., learn about flowcharts without using flowcharts as models).
Objective: Learn about Y (not X)
Learn about Y using X as model (e.g., learn about algorithms using flowcharts as models).
Learn about Y using Z as model (e.g., learn about algorithms without using flowcharts as models).
Figure 2: Relationships between learning objectives and POGIL models, shown in a 2x2 matrix.
After picking a particular type of model, an activity author must work out the details of the model and its EIA LEARNING CYCLE questions. The patterns described below are intended to help authors choose models and make appropriate decisions about them.
Table 2 summarizes four patterns for POGIL activity models, which are described in the following subsections. Some of these patterns could be specialized further; for example, a pattern for a specific type of diagram (e.g. flowchart, Venn diagram), or a pattern for a set of examples of a specific type (e.g., pictures, graphs, personas). Each of these model patterns are probably specializations of a higher level POGIL ACTIVITY MODEL (not yet documented). For example, a higher level pattern could note that a model is often more engaging when it seems relevant to students’ lives and interests, although this is not always possible; models that engage some students might be off-putting to others.
Table 2: Model patterns described in this paper, in alphabetical order.
Pattern Sec Patlet MODEL: DIAGRAM 2.1 Use EIA LEARNING CYCLES where the model is a diagram (e.g. a flowchart or UML)
to help students understand abstract concepts and develop skills in information processing. MODEL: SET OF EXAMPLES 2.2 Use EIA LEARNING CYCLES where the model is a set of examples to help students
develop concepts based on examples, and develop skills in critical thinking. MODEL: SOURCE CODE 2.3 Use EIA LEARNING CYCLES where the model is computer source code to help students understand
software concepts and develop skills in information processing. MODEL: TABLE OF DATA 2.4 Use EIA LEARNING CYCLES where the model is a chart or graph to help students
understand concepts based on data, and develop skills in information processing.
Note to reviewers & shepherds: For readability in this draft, each model starts on a new page.
Patterns in Activity Models for POGIL: Page - 4

2.1 Model: Diagram
Context: You teach subjects and concepts in which students need to analyze, interpret, modify, and create abstract information or diagrams, such as circuits, flowcharts, mind maps, or Venn diagrams. Diagrams can efficiently present complex information and relationships, and in forms that students are likely to encounter in labs, assignments, other courses, and their later careers. Most disciplines have frequently used diagrams. For example, chemistry uses chemical structure, Lewis electron dot structures, and structural formulas; computing uses UML diagrams; physics uses free body, Feynman particle interaction, ticker tape, and vector diagrams; and project management uses Gantt and Pert charts and work breakdown structures.
φφφ Problem & Forces: Students must be able to analyze, interpret, modify and create diagrams of a specific
type. However, students often lack the skills, experience, or time, and instead skip, skim, or misuse diagrams. Students who lack facility with a diagram type might avoid it, and then at some point the diagrams become necessary but too complex, presenting a significant barrier to student progress. For example, a simple flowchart might seem obvious and intuitive, but students who don’t understand the details (e.g., the meaning of different symbols, labels, and line styles) might be unable to follow or create a complex flowchart or convert it into source code.
Teachers often assume that students are already familiar with a diagram type, can figure it out on their own, or that a lecture is sufficient. Teachers might feel they can’t spend enough time on a diagram because they need to cover other content. If students lack facility with a diagram, teachers might avoid examples, activities, or assignments where students must work with complex diagrams in non-trivial ways. This can give students even less experience when they need more.
φφφ Solution & Consequences: Therefore, use a diagram as the POGIL model for EIA LEARNING CYCLES.
Questions will guide students to explore the diagram(s) and notice things that a subject matter expert would see, and then to invent their own understanding of the diagram(s) or related concepts, which they then apply. The POGIL activity will likely take more class time than a lecture on the same content, so teachers will need to adjust their plans. The EIA LEARNING CYCLES lead to deeper understanding, which will benefit students when they encounter similar diagrams in the future; this might reduce the need to “review” content. Authentic practice with diagrams will improve skills that will benefit students in the future.
Discussion: Students can learn about a diagram type in various ways, including: read a textbook or webpage; watch a lecture or video; participate in a classroom activity (e.g., POGIL), complete a homework assignment or project. In a learning activity, a diagram could be the focus (e.g., “what is a flowchart?”), central to the focus (e.g., “what is binary search?” with a flowchart of the algorithm), or peripherally related. In a POGIL activity, the model could be a diagram, or the model could be something that leads students to the diagram. For example, the model could be a flowchart, or a block of code used to guide students to understand what flowcharts are and why they can be useful.
In a given discipline or course, a few diagram types will likely be central, giving repeated opportunities for learning with diagrams that get more complex. A teacher might decide to focus attention on the key types, and omit or briefly mention lesser types. There are likely separate patterns associated with many such diagram types, and with using these types as POGIL models.
For example, a course on software design patterns would use UML heavily. Use case diagrams might be clear to students from a brief description or example. However, activity, sequence, and class diagrams are more complex and use symbols and styles that are not obvious, so it might help students to have a POGIL activity where each diagram is the focus.
Patterns in Activity Models for POGIL: Page - 5
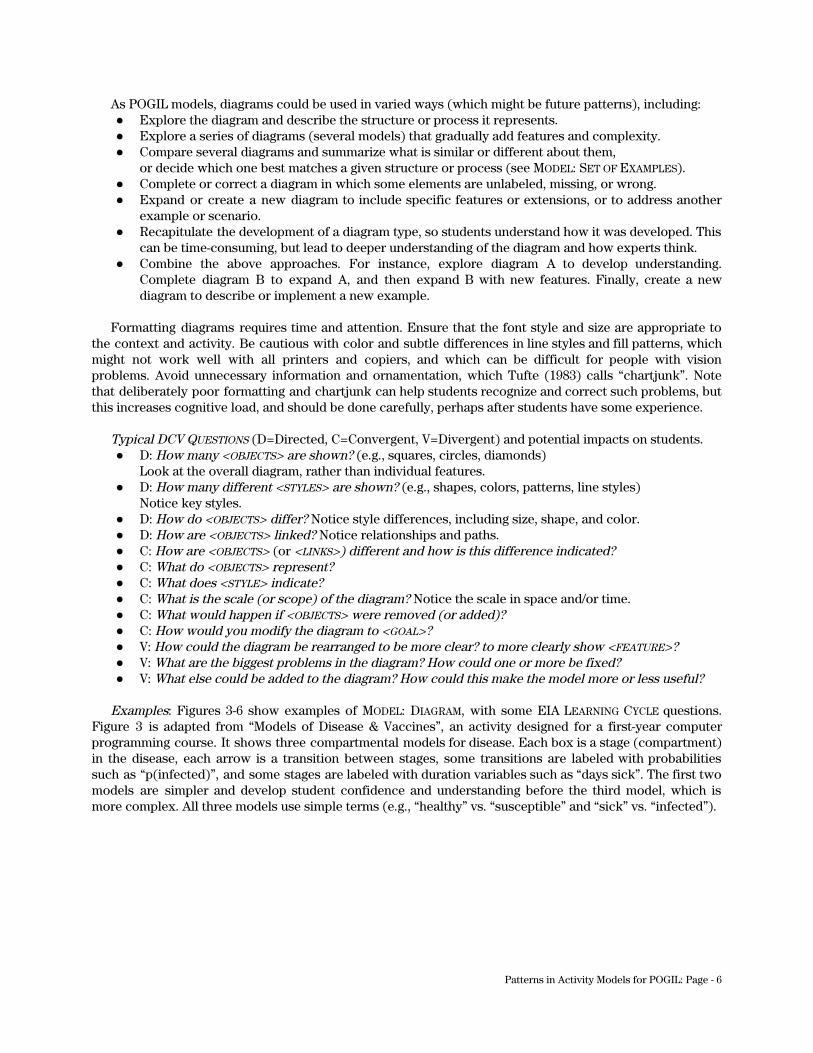
As POGIL models, diagrams could be used in varied ways (which might be future patterns), including: ● Explore the diagram and describe the structure or process it represents. ● Explore a series of diagrams (several models) that gradually add features and complexity. ● Compare several diagrams and summarize what is similar or different about them,
or decide which one best matches a given structure or process (see MODEL: SET OF EXAMPLES). ● Complete or correct a diagram in which some elements are unlabeled, missing, or wrong. ● Expand or create a new diagram to include specific features or extensions, or to address another
example or scenario. ● Recapitulate the development of a diagram type, so students understand how it was developed. This
can be time-consuming, but lead to deeper understanding of the diagram and how experts think. ● Combine the above approaches. For instance, explore diagram A to develop understanding.
Complete diagram B to expand A, and then expand B with new features. Finally, create a new diagram to describe or implement a new example.
Formatting diagrams requires time and attention. Ensure that the font style and size are appropriate to
the context and activity. Be cautious with color and subtle differences in line styles and fill patterns, which might not work well with all printers and copiers, and which can be difficult for people with vision problems. Avoid unnecessary information and ornamentation, which Tufte (1983) calls “chartjunk”. Note that deliberately poor formatting and chartjunk can help students recognize and correct such problems, but this increases cognitive load, and should be done carefully, perhaps after students have some experience.
Typical DCV QUESTIONS (D=Directed, C=Convergent, V=Divergent) and potential impacts on students. ● D: How many <OBJECTS> are shown? (e.g., squares, circles, diamonds)
Look at the overall diagram, rather than individual features. ● D: How many different <STYLES> are shown? (e.g., shapes, colors, patterns, line styles)
Notice key styles. ● D: How do <OBJECTS> differ? Notice style differences, including size, shape, and color. ● D: How are <OBJECTS> linked? Notice relationships and paths. ● C: How are <OBJECTS> (or <LINKS>) different and how is this difference indicated? ● C: What do <OBJECTS> represent? ● C: What does <STYLE> indicate? ● C: What is the scale (or scope) of the diagram? Notice the scale in space and/or time. ● C: What would happen if <OBJECTS> were removed (or added)? ● C: How would you modify the diagram to <GOAL>? ● V: How could the diagram be rearranged to be more clear? to more clearly show <FEATURE>? ● V: What are the biggest problems in the diagram? How could one or more be fixed? ● V: What else could be added to the diagram? How could this make the model more or less useful?
Examples: Figures 3-6 show examples of MODEL: DIAGRAM, with some EIA LEARNING CYCLE questions.
Figure 3 is adapted from “Models of Disease & Vaccines”, an activity designed for a first-year computer programming course. It shows three compartmental models for disease. Each box is a stage (compartment) in the disease, each arrow is a transition between stages, some transitions are labeled with probabilities such as “p(infected)”, and some stages are labeled with duration variables such as “days sick”. The first two models are simpler and develop student confidence and understanding before the third model, which is more complex. All three models use simple terms (e.g., “healthy” vs. “susceptible” and “sick” vs. “infected”).
Patterns in Activity Models for POGIL: Page - 6

Figure 3 also shows two sets of questions. In questions 1 and 2, students explore the compartmental models. Questions 1a, 1b, 2a, and 2b are directed, since students just count objects in the models. Questions 1c, 1d, 1e, 2c, and 2d become convergent, since students need to match labels to new terms (e.g., “infected”, “susceptible”, “recovered”) and interpret the models. In questions 3 and 7, students invent their own definitions for SIS, SIR, SEIS, and SEIR models. In questions 4 and 8, students apply their new understanding by creating a new model, and considering other uses for such models.
The compartmental models in Figure 3 look simple (a few stages, connected by a few arrows), but are quite complex in some ways, since they can be seen as a simple flowchart for an individual, or as a dynamic set of containers for individuals in a population. Depending on the discipline and course, this activity might lead to a study of historical diseases and prevention efforts, mathematical models for the spread of disease, or software design (see Figure 10) and a programming assignment.
d 1. (Explore) Disease models often have a set of stages (also called states or compartments) and
track the number (or fraction) of people in each stage over time. Two models are shown above. Use the compartmental model on the left to answer these questions:
a. How many stages are shown? b. How many transitions (arrows) are shown? c. Which stage has people who are infected? d. Which stage has people who could get infected? (This is called susceptible.) e. Can a person get sick more than once?
2. (Explore) Use the compartmental model on the right to answer these questions: a. How many stages are shown? b. How many transitions (arrows) are shown? c. Which stage has people who got better? (This is called recovered.) d. Can a person get sick more than once?
3. (Invent) Explain why the left and right models are called SIS and SIR models. 4. (Apply) Draw or describe a disease model where everyone who gets sick will die.
5. (Explore) Use the compartmental model above to answer these questions:
a. How many stages are shown? b. How many transitions (arrows) are shown? c. In this model, can a person get sick more than once?
6. (Explore) Which stage(s) are for people who: a. Do not yet show any symptoms, but can infect others? b. Have been exposed but cannot yet infect others? c. Are no longer sick?
7. (Invent) Describe or sketch the SEIS model and SEIR model. 8. (Apply) Describe other (non-disease) situations in which compartmental models could be used.
Figure 3: Sample MODEL: DIAGRAM with EIA LEARNING CYCLE Questions for Compartmental Diagrams
Patterns in Activity Models for POGIL: Page - 7

Figure 4 is adapted from “Code Representations I - Architecture”, an activity designed for a computer organization course. The POGIL model is a diagram that shows the internal hardware architecture of a typical computer. The shaded arrows are buses, the solid boxes are components, and the dashed boxes are subcomponents. In questions 1 to 4, students explore the diagram; these questions are a mix of directed and convergent. In question 5, students invent a basic understanding by completing sentences that describe the architecture. In question 6, students apply this understanding to describe a possible change to the diagram. In contrast to Figure 3, Figure 4 looks more complicated, with more elements and labels, but might be easier for students to understand since it corresponds to the a physical system. However, it also assumes students have some knowledge of computer systems and vocabulary.
1. (Explore) Computers can be very different in their external appearance and organization, but their
internal organization is often quite similar, as shown in the diagram above. Expand each acronym: a. CPU b. ROM c. RAM
2. (Explore) In computer architecture, a bus is a system to transfer data within or between computers. A bus usually transfers one word at a time, so a 32-bit computer will have 32-bit buses, which may be visible as 32 pins on a chip, 32 lines on a circuit board, or 32 wires in a cable.
a. Which bus accesses memory? b. Which bus accesses the disk controller? c. Which bus accesses the network adapter?
3. (Explore) The CPU contains a set of storage locations called the register file. Some common registers are shown in the model above. Which register has:
a. The status of the most recent instruction? b. The current program instruction? c. The address of the current program instruction, which increases one instruction at a time? d. The result of arithmetic or logical instructions?
4. (Explore) The CPU also contains sub-units for specific functions. Which sub-unit: a. Does arithmetic and bitwise logical operations? b. Controls and interprets instructions?
5. (Invent) Fill in the blanks below to describe the basic components of a CPU: a. The CPU has a __?__ to select and interpret instructions, and an __?__ for integer arithmetic.
Some CPUs also have a __?__ for floating point arithmetic. b. The CPU stores local data in __?__ , and uses the __?__ to access data in __?__ and __?__. c. The CPU uses the __?__ to access other devices, including the __?__ for the display,
the __?__ for other computers, and the __?__ for storage devices. 6. (Apply) A Floating Point Unit (FPU) can be outside or inside the CPU. For example, the
original Intel 8086 CPU used the 8087 FPU, but more recent Intel x86 CPUs contained FPUs. Describe or sketch the above diagram with an external FPU.
Figure 4: Sample MODEL: DIAGRAM with EIA LEARNING CYCLE Questions for Computer Architecture Diagram
Patterns in Activity Models for POGIL: Page - 8

Figure 5 is adapted from “Development Workflows”, an activity designed for a second year software development course. The POGIL models are two flowcharts for Test Driven Development (TDD) (Beck, 2002), where each rectangle is a step, each diamond is a decision, and the rounded rectangle is the start step. The first flowchart is a simplified version of the second. Question 1 is directed and guides students to explore the flowchart. Questions 2 and 3 are convergent and help students to invent understanding of unit testing. Questions 5 and 6 continue to invent understanding of refactoring and TDD. Questions 4 and 7 prompt students to identify non-programming contexts where these workflows might be useful, to apply their new understanding.
Teachers might assume that most second-year students are familiar with flowcharts and can interpret them with little effort. The activity might need to be modified for other contexts; thus, for a non-majors course, the activity might start with a simpler flowchart and explain more details, while for a graduate course the activity might skip the first flowchart and focus more on variations and implications.
1. (Explore) To check that a procedure works correctly, developers write test procedures (called unit tests)
that call the first procedure in different ways. The figure above shows a workflow for unit tests. a. How many decisions (diamonds) are shown? b. How many steps are shown? c. Which step comes first in the workflow? d. Which step comes second? e. Should new tests pass or fail when they are first run?
2. (Invent) A unit test is usually short and simple; often, it just passes specific argument values to a procedure, and checks that it returns the correct result.
a. Will unit tests help you know when the procedure works correctly? b. Will unit tests help you think about how the procedure should work? c. If you write more code than needed to pass the tests, will all of the new code be tested?
3. (Invent) Why does this workflow help ensure that code is well tested? 4. (Apply) Describe a non-programming context where a similar workflow could apply.
5. (Invent) Good developers rewrite code to make it easier to understand, reuse, and modify.
This rewriting is called refactoring. and is shown in the expanded workflow above. a. How do unit tests make it easier to refactor? b. Why is it easier to refactor just after you write the code, not weeks or months later?
6. (Invent) This workflow is called Test Driven Development (TDD). Explain this name and why it makes sense. 7. (Apply) Describe a non-programming context where a TDD-like workflow could apply.
Figure 5: Sample MODEL: DIAGRAM with EIA LEARNING CYCLE Questions for Flowcharts
Patterns in Activity Models for POGIL: Page - 9

Figure 6 is adapted from a draft activity on “Chain of Responsibility”, a well-known pattern for object-oriented design (Gamma, Helm, Johnson, and Vlissides, 1995). It shows three Unified Modeling Language (UML) diagrams used as POGIL models: first, a class diagram; second, an object diagram with references between objects; and third, a sequence diagram showing how the same objects call each other. The UML diagrams include formatting and naming conventions to scaffold student learning. For instance, that object and sequence diagrams use the same name and column positions for the sender and three handlers, and that the object names prepend an “a” to the corresponding class name. The figure also shows some exploration questions; in this case, the activity expects students to have prior experience with UML diagrams. Earlier sections of the activity use a scenario (text), a flowchart, and pseudocode to motivate a sample problem and the general solution. Later sections use longer blocks of source code.
Figure 6 is much more complex that the earlier examples. It assumes that students are already familiar with three types of UML diagrams, can correctly interpret the diagrams and their interrelationships, and can consider the implications for system design and development.
1. (Explore) The UML class diagram above shows a general approach. Use it to answer these questions.
a. How many code snippets (dotted boxes) are shown? b. How many classes or interfaces are shown? c. Which classes are subclasses? d. What 2 fields are shown for Sender? e. What 2 functions (methods) are shown for Handler?
2. (Explore) Use the UML object and sequence diagrams above to answers these questions.
a. What object is the request? b. What object references the request? c. What object is last in the chain of handlers? d. What object is first in the chain of handlers? e. What object references the first object in the chain?
Figure 6: Sample MODEL: DIAGRAM with EIA LEARNING CYCLE Questions for UML Diagrams
Patterns in Activity Models for POGIL: Page - 10

2.2 Model: Set of Examples
Context: You teach subjects where students should learn to notice similarities and differences, identify patterns, or apply inductive reasoning. Students will master these skills more quickly through guided practice, and will understand and remember key concepts better if they develop their own understanding.
φφφ Problem & Forces: Students must be able to find patterns and induce ideas, although the nature and
importance of such work varies by discipline and topic. However, in many cases these skills are needed in later courses and professional work. For example, software developers must be able to create code that correctly handles a variety of data values, structures, use cases, or user personas. Students who create their own understanding of a key concept are likely to understand and remember it better, and be more able to extend the concept to other situations, than if they read a summary or try to memorize the concept.
φφφ Solution & Consequences: Therefore, use a set of examples as the POGIL model for EIA LEARNING
CYCLES. Questions will guide students to explore the examples(s) and notice things that a subject matter expert would see, and then to invent their own understanding of the examples and related concepts, which they then apply. The learning cycle leads to deeper understanding, and authentic practice using sets of examples leads to improved skills. This approach can be particularly compelling when the examples and/or process are like those used in the original discovery. However, this recapitulation approach often takes more time than a lecture or other more direct approaches with active learning.
Discussion: As a POGIL model, a set of examples can be used in a variety of ways, including: ● Find similarities and differences within the set. ● Develop a general principle that matches the examples. ● Develop a principle that distinguishes between two sets of examples. ● Validate a principle by testing with examples, and then use the results to refine the principle. ● Combine the above approaches. For instance, use model A with a few examples to develop a basic
principle, model B with more examples to test the principle and identify boundaries, and model C to extend the B.
Choose the examples with great care. With too many, students will need more time to study them, and
might get frustrated. With too few, students might struggle to see what are individual variations and what are general principles. It often helps to include counter-examples and examples with varying degrees of difference. It also helps to consider the narrowest and broadest interpretations that fit the examples; if these are quite different, more or different examples are needed. If the concept requires many examples, it might help use a sequence of simpler models for subconcepts.
Typical DCV QUESTIONS (D=Directed, C=Convergent, V=Divergent) and potential impacts on students. ● D: How many examples are shown? Look briefly at each example. ● D: How many examples have <FEATURE>? Notice differences. ● C: What is similar (or different) about <SUBSET>? Notice similarities and differences. ● C: Which example(s) seem most different from the others, and why? ● V: Sketch or describe different examples that fit the same pattern(s).
Examples: Figures 7 and 8 each show a MODEL: SET OF EXAMPLES with EIA LEARNING CYCLE questions.
Figure 7 is adapted from a draft activity to help future yoga teachers understand the pose Downward-Facing Dog (or just Down Dog). It shows four photos of the pose - two versions with two different people. Question 1 is directed and guides students to explore the examples and note similarities and differences. Question 2 is convergent and highlights aspects of the pose that vary. Question 3 is convergent and prompts students to invent their own definition of the pose. In Question 4, students apply what they have learned. If the model was a single photo, students could not tell what features were required and which were not. Later questions explore differences between the top and bottom version for each person. Later models in the activity use poor versions of the pose (e.g., curved back, bent head, arms too low) to highlight the differences, and to prompt students to consider what advice they might give.
Patterns in Activity Models for POGIL: Page - 11

1. (Explore) The pictures at right show four versions of the pose Downward-Facing Dog, or simply Down Dog (Adho Mukha Svanasana in Sanskrit). Use all four to decide:
a. Which of the following do not touch the ground? toes, head, wrists, palms, fingers
b. Are the hips bent or straight? c. Is the back curved or straight? d. Is the neck bent or straight? e. Are the elbows bent or straight?
2. (Invent) In a good version of Adho Mukha Svanasana: a. The heels can be down or up. Which seems harder? b. The knees can be bent or straight. Which seems harder?
3. (Invent) In complete sentences, describe the key elements of Adho Mukha Svanasana. 4. (Apply) In Adho Mukha Svanasana, decide what will happen when the body position changes.
a. If the feet are closer to the hands, is it easier or harder for the heels to touch the ground? b. If the feet are closer to the hands, is it easier or harder for the knees to be straight? c. If the knees are bent, is it easier or harder to straighten the back? d. If the ears are between the upper arms, is it easier or harder to straighten the back?
Figure 7: Sample MODEL: SET OF EXAMPLES with EIA LEARNING CYCLE Questions for Yoga Poses
Figure 8 is adapted from a workshop designed to help teachers understand how POGIL activities work
and how to write them. It shows a set of four line drawings of faces. In this workshop, participants first complete a “mini-activity” (questions 1-8) and then a “meta-activity” (questions 9-12) about the mini-activity. The mini-activity has four short EIA LEARNING CYCLES. Questions 1, 3, 5, and 7 ask participants to use different subsets of the faces to describe a “good” face, and questions 2, 4, 6, and 8 ask them to apply their description to identify or draw other faces. The meta-activity has one learning cycle, which prompts participants to explore their experience in the mini-activity, invent guidelines for choosing examples, and then apply those guidelines in another situation. In fact, one draft of the workshop used a set of yoga poses, but faces seemed much easier for teachers unfamiliar with yoga.
1. (Exp/Inv) Assume that the top left face is “good”. Describe how to draw a “good” face. 2. (Apply) Based on your description, which other faces are “good”? 3. (Exp/Inv) Assume that all four faces are “good”. Revise your description of a “good” face. 4. (Apply) Draw a face that is “good” and one that is not. 5. (Exp/Inv) Assume that the top left face is “good” and the rest are “bad”.
Revise your description of a “good” face. 6. (Apply) Draw a “good” face and a “bad” face that differ from those above. 7. (Exp/Inv) Assume that the left two faces are “good” and the others are “bad”.
Revise your description of a “good” face. 8. (Apply) Draw a “good” face and a “bad” face that are different from those above. 9. (Exp/Inv) How did having multiple “good” faces help you write a description? 10. (Exp/Inv) How did having mixed “good” and “bad” faces help you write a description? 11. (Invent) List advice to help activity authors choose a set of examples. 12. (Apply) Use your advice to draft a set of examples of scalene, isosceles, and quadrilateral triangles.
Figure 8: Sample MODEL: SET OF EXAMPLES with EIA LEARNING CYCLE Questions for Line Drawings
In some situations, students or teams might create their own examples, and then perhaps pool them with
other teams. Thus, student-generated examples might increase student interest and motivation, but might also be less effective than examples carefully designed by the activity author. In Figure 7, instead of photos, a teacher might have some students hold a pose for other students to study. In Figure 8, questions 4, 6, and 8 prompt students to draw or describe faces, which could then be shared with other students as an expanded set of examples.
Patterns in Activity Models for POGIL: Page - 12

2.3 Model: Source Code
Context: You teach computer science, software engineering, or related subjects in which students need to develop skills in programming and in the analysis and design of algorithms and data structures.
φφφ Problem & Forces: Students must be able to read, review, write, and debug computer source code. These
tasks can take a significant amount of time and effort. Teachers often present students with short code examples (in introductory courses) or focus on concepts (in more advanced students), so students might not be exposed to larger, more complex examples, or learn to read code that others wrote. In later courses, source code can also be a precise and efficient way to describe algorithms and data structures (compared to natural languages). In computing courses, students mostly write short programs, but in the workplace they are more likely to work with large programs involving many other developers. Teachers might find it difficult to create larger examples, and Free & Open Source Software (FOSS) projects can be difficult to navigate.
φφφ Solution & Consequences: Therefore, use source code as the POGIL model for EIA LEARNING CYCLES.
Questions will guide students to explore the code and notice things that a subject matter expert would see, and then to invent their own understanding of the examples and related concepts, which they then apply. The learning cycle leads to deeper understanding, and authentic practice leads to improved skills, which will better prepare students to work with larger, more realistic source code.
Discussion: As a POGIL model, source code can be used in a variety of ways, including: ● Trace the code and determine the output or other result that is produced. ● Find and correct defects in the code, ranging from syntax errors to semantic errors to specialized
test cases that do not pass (e.g., Richards, 2000). ● Develop a unit test suite for the code. ● Develop code that passes a provided unit test suite. ● Study several segments of code (e.g., statements) in a random (incorrect) order, and assemble them
in the correct order. This is a Parsons problem (Parsons and Haden, 2006).
Source code can be custom-written for an activity (e.g., Figures 9 and 10) or adapted from other sources such as textbooks (e.g., Figure 11) or FOSS projects. (The author has written several activities that use code from the Java Development Kit.)
Formatting source code can present challenges, especially for longer examples. Most IDEs can format code, but code intended for classroom use might require additional effort. For instance:
● Edit the code in minor ways to improve readability, such as avoiding awkward page breaks. ● Add (or remove) comments from the code, or rename variables, either to improve readability, or to
illustrate potential problems. ● Provide selected excerpts, or remove segments of code that are not relevant to the activity or that
are likely to confuse students unnecessarily. If students have classroom access to computers and an IDE, it might be easier to provide code digitally.
(Not all students own laptops, and not all computing classrooms have computers.) This can allow students to more quickly search for specific text, access API documentation, and find other uses of specific variables, methods, classes, etc.
Typical DCV QUESTIONS (D=Directed, C=Convergent, V=Divergent) and potential impacts on students. ● D: How many methods/fields/classes are shown? ● D: How many times are <SYNTAX> used? (e.g., conditionals, loops, arrays, exceptions) ● C: Which methods are called by a specific method? See how a method works. ● C: Which methods call a specific method? See how a method is used. ● C: Do names of elements (variables, methods, fields, classes) follow coding conventions? ● C: Do names match how the elements are actually used? ● C: How would you refactor this code to <PERFORM TASK>? (e.g., add or remove parameters,
combine or extract methods, handle specific situations, respond to specific errors) ● V: How could you refactor this code to be easier to read and modify? to reuse?
Patterns in Activity Models for POGIL: Page - 13

● V: How could you extend or expand this code to <PERFORM TASK>? Examples: Figures 9-11 show sample models with source code, from a range of courses. Figure 9 is
adapted from an activity on Python style, designed for a first-term programming course. It has two blocks of code (lines 11-13 and 21-27) that do the same calculations using different variable names and steps. The figure also shows EIA LEARNING CYCLE questions. Question 1 directs students to explore the code blocks. In question 2, students compare specific example to invent their own understanding of principles for naming variables, which they summarize in question 3 and apply in question 4. Later sections of the activity repeat this general sequence to help students develop principles for naming functions and writing comments.
11 12 13
i1 = 10; i2 = 5; c1 = 9.99; c2 = 4.99; d1 = 0.06; d2 = 0.99; s1 = i1*c1+i2*c2; t1 = s1+s1*d1+i1*d2;
21 22 23 24 25 26 27
numCD = 10; numMP3 = 5; costCD = 9.99; costMP3 = 4.99; shipCD = 0.99; rateTax = 0.06; subCost = (numCD * costCD) + (numMP3 * costMP3); subShip = numCD * shipCD; subTax = subCost * rateTax; total = subCost + subTax + subShip;
1. (Explore) Which code block above (11-13 or 21-27):
a. Is shorter and would take less time to type? b. Uses more variables? c. Would be easier to edit or debug?
2. (Invent) For each item below, choose the better option: X, Y, or ? (can’t decide).
Option X Option Y X/Y/?
a. i1 = 3; i2 = 7; numClosed = 3; numOpen = 7;
b. numCat = 2; numDog = 5; numCat = 2; dogNum = 5;
c. numson = 3; isdone = True; numSon = 3; isDone = True;
d. costCoffee = 2; costTea = 1; soldCoffee = 4; soldTea = 6;
costCoffee = 2; costTea = 1; soldTea = 6; soldCoffee = 4;
3. (Invent) Based on your answers above, summarize advice for naming variables. 4. (Apply) Use your advice above to rewrite the code shown below.
# calculate trip cost from 2-way flights, nights in hotels, & meals fc=500; ch=150; mc=30; nn=5 # costs & number nights c = 2*fc+ch*n+n*3*cm
Figure 9: Sample MODEL: SOURCE CODE with EIA LEARNING CYCLE Questions for Python (in an introductory course)
01 02 03 04 05 06 07 08
make population (one individual at a time) make individual run simulation (one day at a time) update population (one individual at a time) update individual check for new infections summarize results (for day) summarize results (for simulation)
1. (Explore/Invent) You will develop Python code to simulate a compartmental model, and then explore
how changes affect the outcomes. Use the pseudocode above to answer these questions: a. There are 3 main phases. Which is first? b. Which phase has the most subphases? c. Which phase(s) loop through time? Which loop through the population?
2. (Invent/Apply) Which phase seems easiest to develop? Which seems most difficult? Justify your answer (or answers, if your team can’t agree).
Patterns in Activity Models for POGIL: Page - 14
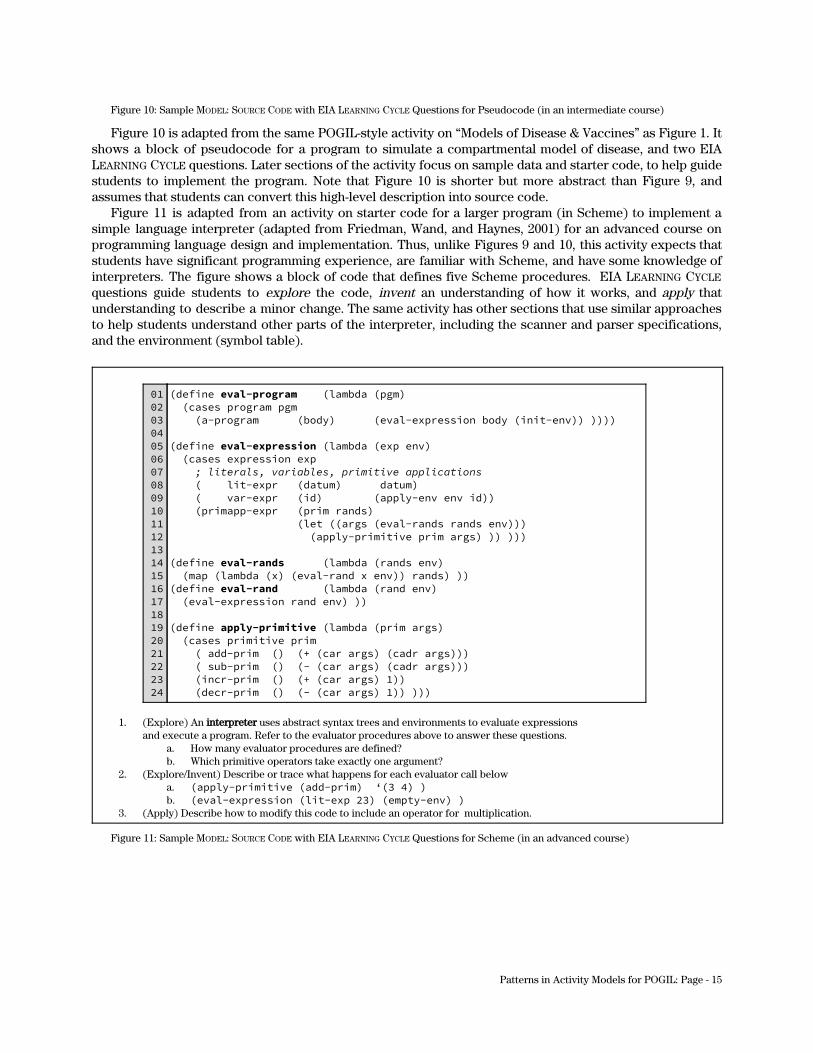
Figure 10: Sample MODEL: SOURCE CODE with EIA LEARNING CYCLE Questions for Pseudocode (in an intermediate course)
Figure 10 is adapted from the same POGIL-style activity on “Models of Disease & Vaccines” as Figure 1. It shows a block of pseudocode for a program to simulate a compartmental model of disease, and two EIA LEARNING CYCLE questions. Later sections of the activity focus on sample data and starter code, to help guide students to implement the program. Note that Figure 10 is shorter but more abstract than Figure 9, and assumes that students can convert this high-level description into source code.
Figure 11 is adapted from an activity on starter code for a larger program (in Scheme) to implement a simple language interpreter (adapted from Friedman, Wand, and Haynes, 2001) for an advanced course on programming language design and implementation. Thus, unlike Figures 9 and 10, this activity expects that students have significant programming experience, are familiar with Scheme, and have some knowledge of interpreters. The figure shows a block of code that defines five Scheme procedures. EIA LEARNING CYCLE questions guide students to explore the code, invent an understanding of how it works, and apply that understanding to describe a minor change. The same activity has other sections that use similar approaches to help students understand other parts of the interpreter, including the scanner and parser specifications, and the environment (symbol table).
01 02 03 04 05 06 07 08 09 10 11 12 13 14 15 16 17 18 19 20 21 22 23 24
(define eval-program (lambda (pgm) (cases program pgm (a-program (body) (eval-expression body (init-env)) )))) (define eval-expression (lambda (exp env) (cases expression exp ; literals, variables, primitive applications ( lit-expr (datum) datum) ( var-expr (id) (apply-env env id)) (primapp-expr (prim rands) (let ((args (eval-rands rands env))) (apply-primitive prim args) )) ))) (define eval-rands (lambda (rands env) (map (lambda (x) (eval-rand x env)) rands) )) (define eval-rand (lambda (rand env) (eval-expression rand env) )) (define apply-primitive (lambda (prim args) (cases primitive prim ( add-prim () (+ (car args) (cadr args))) ( sub-prim () (- (car args) (cadr args))) (incr-prim () (+ (car args) 1)) (decr-prim () (- (car args) 1)) )))
1. (Explore) An interpreter uses abstract syntax trees and environments to evaluate expressions
and execute a program. Refer to the evaluator procedures above to answer these questions. a. How many evaluator procedures are defined? b. Which primitive operators take exactly one argument?
2. (Explore/Invent) Describe or trace what happens for each evaluator call below a. (apply-primitive (add-prim) ‘(3 4) ) b. (eval-expression (lit-exp 23) (empty-env) )
3. (Apply) Describe how to modify this code to include an operator for multiplication.
Figure 11: Sample MODEL: SOURCE CODE with EIA LEARNING CYCLE Questions for Scheme (in an advanced course)
Patterns in Activity Models for POGIL: Page - 15

2.4 Model: Table of Data
Context: You teach subjects and concepts based on the analysis and interpretation of experimental data, or other structured data. Students will understand and remember concepts better if they study data and create their own understanding.
φφφ Problem & Forces: Students must be able to analyze and interpret relationships in data generally, and
specifically in tables. Tables can be harder to interpret than graphs, but can show more complex relationships. However, students often lack the skills, experience, or time to do so. Thus, teachers might be reluctant to use activities or assignments where students must work with tables of data in non-trivial ways. Unfortunately, if teachers avoid using tables, students miss opportunities to develop skills. A table can present data succinctly, and in a form that students are likely to encounter in labs, assignments, other courses, and the workplace.
φφφ Solution & Consequences: Therefore, use a data table as the POGIL model for EIA LEARNING CYCLES.
Questions will guide students to explore the table and notice things that a subject matter expert would see, and then to invent their own understanding of the data and related concepts, which they then apply. The learning cycle leads to deeper understanding, and authentic practice using diagrams leads to improved skills. This experience will also help students develop information processing skills that will help them later.
Discussion: A table model is similar in some ways to MODEL: SET OF EXAMPLES, and might be a sub-pattern, since a set of examples can be less structured than a table. A table model is also similar to to a MODEL: CHART OR GRAPH, although students often find tables harder to interpret than graphs. Like a chart or graph, a table can use real or simulated data. MODELS WITH AUTHENTIC DATA may appeal to students, but may also contain complexities, noise, or outliers that can distract students. MODELS WITH SYNTHETIC DATA give more control to the activity author to adjust variability, construct special cases, and so forth.
As a POGIL model, a table of data can be used in a variety of ways, including: ● A table with data in all cells, for students to analyze. ● A table with partial data for students to complete as they develop ideas or identify patterns. ● A table that contains errors for students to identify and/or correct. ● An empty table for a team to fill in (e.g., with their own experimental data). ● An empty table shared by all teams, where each team provides a subset of the data.
Typical DCV QUESTIONS (D=Directed, C=Convergent, V=Divergent) ● D: What is the heading for column (row) <X>? ● D: What is the largest (smallest) value in the table? In column <X>? ● D: What general trend do you see in column (row) <X>? ● C: What is similar (different) about rows (columns) <X> and <Y>? ● C: Which rows (columns) are most similar (different)? ● C: How would you explain the key similarities (differences) shown in the table? ● V: How might you rearrange or reformat this table to be easier to understand? ● V: Find a similar table in a textbook or on the internet. How does it compare it to this table?
Examples: Figures 12-13 shows two sample models with tables. Figure 12 is adapted from an activity
titled “Data Representations II - Integers” designed for a computer organization course. The figure shows a table of integer data types in the C programming language, where each row shows the name of a type and its minimum and maximum value. EIA LEARNING CYCLE questions guide students to explore values and patterns in the table, invent understanding of the unsigned keyword, and then apply what they have learned. The rows are in order of increasing maximum value, but others orders are possible (e.g., all unsigned before all signed, alphabetical, random) which might affect how students explore and interpret it.
Patterns in Activity Models for POGIL: Page - 16

C data type minimum maximum
char -128 127 27-1
unsigned char 0 255 28-1
short -32,768 32,767 215-1
unsigned short 0 65,535 216-1
int -2.147x10⁹ 2.147x10⁹ 231-1
unsigned 0 4.294x10⁹ 232-1
long -9.223x10¹⁸ 9.223x10¹⁸ 263-1
unsigned long 0 18.446x10¹⁸ 264-1
1. (Explore) C has a set of integer data types, summarized above. Different computers and versions of C use different numbers of bits for each type; the values above are typical for 64 bit systems.
a. What is the maximum value for an unsigned short? a short? b. How many different values are possible for an unsigned short? a short? c. How many bytes are needed for each int? each unsigned int? d. How many bytes are needed for 1,000,000 short values? 1,000,000 long values?
2. (Invent) Explain what the unsigned keyword means, and how it changes the maximum value. 3. (Apply) Explain why it is useful for a programming language to have several integer types.
Figure 12: Sample MODEL: TABLE OF DATA with EIA LEARNING CYCLE Questions for C Data Types.
Figure 13 is adapted from an activity titled “Software Development Activities” designed for a software engineering course. It shows a table of developer productivity where rows show projects of different sizes (measured in function points) and columns show different project classes (adapted from Jones, 2000). EIA LEARNING CYCLE questions guide students to identify differences and patterns in the data, consider relevant factors, and predict values for a project class not shown in the table. Unlike Figure 12, Figure 13 has two independent variables, and thus might be more difficult for students to interpret.
Size (FP)
Productivity (FP/person-month) by project class
end
user
mgmt
info sys
comm-
ercial
system
software military Mean
1 50.0 16.0 10.0 9.5 5.0 22.6
10 40.0 15.0 11.0 9.0 4.5 16.7
100 25.0 11.0 10.0 7.5 4.2 12.5
1,000 --- 6.5 6.0 5.5 3.5 5.7
10,000 --- 3.5 4.0 4.0 2.5 3.7
100,000 --- 2.0 2.5 2.5 1.5 2.3
1. (Explore) The table above shows average productivity (in FP/person-month) by project class and size.
a. Which class has the highest average productivity? the lowest average productivity? b. As product size increases, does productivity increase, decrease, or stay the same?
2. (Invent) What factors might lead to a. the productivity for the highest projects in question 1a? the lowest projects? b. the pattern of productivity in question 1b?
3. (Apply) Based on this data, predict and explain your logic for the missing values in the lower left.
Figure 13: Sample MODEL: TABLE OF DATA with EIA LEARNING CYCLE Questions for Programmer Productivity.
Data tables can also be created by students. For example, in POGIL laboratories (Lambda & Creegan, 2008), all student teams are presented with a problem or question, each team designs and runs its own experiment, and then teams pool their data for analysis.
Patterns in Activity Models for POGIL: Page - 17

3. CONCLUSIONS & FUTURE DIRECTIONS
This paper has described several patterns for POGIL models, which might also be useful in other settings. In the future, we will continue to identify and refine patterns for POGIL activity structure, team organization, and classroom facilitation. Table 3 summarizes possible future patterns for POGIL models and related concepts; other possible future patterns are listed in Kussmaul (2017). Some patterns could be at higher levels (e.g. POGIL ACTIVITY MODEL). Others might interact with various model patterns; for example, patterns that consider the advantages and limitations of models that use authentic vs. synthetic data. There are likely lower-level pattern models, including patterns for specific types of diagrams, including Venn diagrams, chemical structures, force diagrams, logic models, flowcharts, and UML diagrams. For such diagrams, it would be easier to identify the context, problem, forces, solution, and consequences.
We hope to engage with authors and teachers across the POGIL community to assess the effectiveness of patterns in POGIL contexts, and to expand and improve the pattern language for POGIL.
Table 3: Possible future patterns for models and related concepts.
Pattern Patlet MODEL LIKE OBJECTIVE Use POGIL models closely related to the learning objective (use X as a model to learn about X). MODEL UNLIKE OBJECTIVE Use POGIL models quite different from the learning objective (use X as a model to learn about Y). MODEL WITH AUTHENTIC DATA Use POGIL models (e.g. CHART OR GRAPH; TABLE OF DATA) with real experimental data
so that students learn concepts and process skills for critical thinking and problem solving. MODEL WITH SYNTHETIC DATA Use POGIL models (e.g. CHART OR GRAPH; TABLE OF DATA) with artificially generated data
to focus student attention on key concepts and avoid distractions. POGIL ACTIVITY MODEL Use models with characteristics that support EIA LEARNING CYCLE activities.
(Generalizations from specific models described in this and other papers.)
Figure 14 shows some of the relationships between the patterns in Tables 1, 2, and 3. Bold text indicates
patterns in this paper, solid text indicates patterns in prior work, and a dashed border indicates possible future work. POGIL ACTIVITY STRUCTURE (future work) builds on POGIL ACTIVITY MODEL, DCV QUESTIONS, and EIA LEARNING CYCLES. POGIL ACTIVITY MODEL includes a variety of possible models types. Models that involve data can be either MODEL WITH AUTHENTIC DATA or MODEL WITH SYNTHETIC DATA.
Figure 14: Patterns related to models in POGIL activities that appear in prior work (solid), this paper (bold), and future work (dashed).
Patterns in Activity Models for POGIL: Page - 18

4. ACKNOWLEDGEMENTS
This material is based upon work supported by the US National Science Foundation (NSF) under Grants #1044679 (CS-POGIL) and #1626765 (IntroCS POGIL). Any opinions, findings and conclusions or recommendations expressed are those of the author(s) and do not necessarily reflect the views of the NSF. We thank The POGIL Project (http://pogil.org), the PLoP reviewers, and our shepherds, Liat Eyal and David Kane.
REFERENCES
C. Alexander, S. Ishikawa, and M. Silverstein. 1977. A Pattern Language: Towns, Buildings, Construction. Oxford Univ. Press.
L. W. Anderson and D. R. Krathwohl, Eds. 2001. A Taxonomy for Learning, Teaching, and Assessing: A Revision of Bloom's
Taxonomy of Educational Objectives. Longman.
D. L. G. Anthony. 1996. Patterns for classroom education. In J. M. Vlissides, J. O. Coplien, and N. L. Kerth, eds., Pattern
Languages of Program Design 2. Addison-Wesley Longman, pp. 391–406.
K. Beck. 2002. Test-Driven Development: By Example. Addison-Wesley.
J. Bergin. 2000. Fourteen Pedagogical Patterns. In Proceedings of the European Conference on Pattern Languages of Programs
(EuroPLoP).
B. Bloom, M. Engelhart, E. Furst, W. Hill, and D. Krathwohl. 1956. Taxonomy of Educational Objectives: The Classification of
Educational Goals. Handbook I. Longmans.
S. Carpenter, M. Wilford, N. Kornell, and K. Mullaney. 2013. Appearances can be deceiving: Instructor fluency increases
perceptions of learning without increasing actual learning. Psychonomic Bulletin & Review, 20, 6, pp. 1350–1356.
M. T. H. Chi and R. Wylie. 2014. The ICAP framework: Linking cognitive engagement to active learning outcomes. Educational
Psychologist, 49, 4, 219-243.
T. Eberlein J. Kampmeier, V. Minderhout, R. S. Moog, T. Platt, P. Varma-Nelson, and H. B. White. 2008. Pedagogies of
engagement in science. Biochemistry and Molecular Biology Education, 36, 4, 262-273.
M. Fowler. 2002. Patterns of Enterprise Application Architecture. Addison-Wesley.
D. P. Friedman, M. Wand, and C. T. Haynes. 2001. Essentials of Programming Languages. MIT Press.
E. Gamma, R. Helm, R. Johnson, J. Vlissides. 1995. Design Patterns: Elements of Reusable Object-Oriented Software.
Addison-Wesley.
T. C. Jones. 2000. Software Assessments, Benchmarks, and Best Practices. Addison-Wesley.
C. Kussmaul. 2016. Patterns in classroom activities for Process Oriented Guided Inquiry Learning (POGIL). In Proceedings of
the Conference on Patterns Languages of Programs (PLoP).
C. Kussmaul. 2017. Patterns in classroom facilitation for Process Oriented Guided Inquiry Learning (POGIL). In Proceedings of
the Nordic Conference on Patterns Languages of Programs (VikingPLoP).
R. S. Lambda and F. J. Creegan. 2008. The Process Oriented Guided Inquiry (Discovery) Laboratory. In R. S. Moog and J. N.
Spencer, eds. Process-Oriented Guided Inquiry Learning (POGIL). American Chemical Society.
E. Mazur. 1996. Peer Instruction: A User’s Manual. Pearson.
R. S. Moog, F. J. Creegan, D. M. Hanson, J. N. Spencer, and A. R. Straumanis. 2006. Process-oriented guided inquiry learning:
POGIL and the POGIL Project. Metropolitan Universities Journal. 17, 41-51.
R. S. Moog and J. N. Spencer, Eds. 2008. Process-Oriented Guided Inquiry Learning (POGIL). American Chemical Society.
D. Parsons and P. Haden. 2006. Parson's programming puzzles: A fun and effective learning tool for first programming courses.
In Proceedings of the Australasian Conference on Computing Education, 157-163.
B. Richards. 2000. Bugs as features: Teaching network protocols through debugging. In Proceedings of the SIGCSE Technical
Symposium on Computer Science Education. 256-259.
S. R. Simonson, Ed. 2019. POGIL: An Introduction to Process Oriented Guided Inquiry Learning for Those Who Wish to
Empower Learners. Stylus Publishing.
E. Tufte. 1983. The Visual Display of Quantitative Information. Graphics Press.
Received May 2019; revised July 2019; accepted October 2019, withdrawn due to travel conflicts for conference date. Received July
2020, revised August 2020, accepted September 2020.
Patterns in Activity Models for POGIL: Page - 19