Embed Size (px)
Citation preview

Patterns for Managing Internet-Technology Systems
Paul Dyson and Andy Longshaw
Introduction Many Internet-technology systems have similar architectures. Such similarity provides an environment rich for pattern mining. This paper sets out a pattern language that considers the common structures and elements identified in Internet-technology systems we have been involved in building and reviewing.
Internet-technology systems For the purposes of this paper we consider an Internet-technology system to be one that uses Internet channels to deliver content and services to end users and/or other systems. This means that the system has to deal with stateless and ultra-thin client software. Typically (although not exclusively) Internet-technology systems are also characterised by having an unregulated and largely anonymous user base that interacts with the system in a number of different ways and with a number of different goals. Such a characterisation covers a broad range of systems, from a personal web-page through to a multi-national e-commerce site such as Amazon.com (the ubiquitous Internet-technology system example). This paper is firmly targeted towards the Amazon-end of this spectrum; this is where our experience and interest lies and also where architectural patterns are of the most interest. More specifically, these patterns mainly consider systems that are deployed across multiple hardware and software servers1 – the most common approach for enterprise-level Internet-technology systems.
Architectural patterns Architectural patterns consider the structure rather than the function of a system. In particular, we have considered the following non-functional characteristics of systems when evaluating the patterns and their relationships:
• Availability – carries on functioning even in the face of failure
• Performance – end-to-end responsiveness to external (user or other system) requests
• Scalability – ability to provide (or be easily changed to provide) same or similar levels of performance under increased load
• Maintainability – ability to add new or change functionality and services over the lifetime of the system
1 Multi-server architectures for Internet-technology architectures are explored in [PIA].

• Manageability – ability to organise and control the system as well as the ability to obtain information about the non-functional characteristics at runtime
• Security – resilience to intrusion, protecting both architectural elements of the system and the information it holds
• Flexibility – ability to change functionality or services at runtime
• Portability – ability to migrate the system to a new platform These are all technical non-functional characteristics. There is also a non-technical characteristic that has massive impact on the architectural choices we make:
• Cost – the cost to implement and maintain a chosen solution in terms of time and money
Although structuring decisions are made at every level of detail, the ‘architectural patterns’ presented here are focussed on the system level. One of the hardest aspects of the architect’s role (whoever takes that role on, whether or not they have ‘Architect’ in their job title) is moving from very broad abstractions, themes and objectives to the detailed implementation of those high-level concepts. In the patterns we aim to outline the high-level concepts the architect should consider and give pointers to other work that deals with the detailed implementation.
Pattern template The following template is used for the pattern language:
Problem What is the problem we are trying to solve?
Specific context In what environment(s) do we see this problem?
Example An example of the problem.
Forces What makes this problem a problem? What are the benefits and liabilities of the potential solutions?
Solution How we solve the problem.
Solution implementation
Solution example An example of the solution based on the problem example
Resulting Context What is the environment created by application of the solution?
Hardware/Software Does this pattern apply to hardware or software design, or both? We use the term ‘Server’ often in the language to refer to a hardware instance, a software instance or a combination of the two.
Related Patterns Other patterns in the language related to this one.
Referenced patterns Various other patterns and papers are referenced throughout this paper. A list of these references is contained in Appendix A. The typographical convention that identifies such a reference is for it to appear italicised within square brackets, for example [Pattern: Proxy].

Language history The patterns presented here are extracted from a larger pattern language that is currently being worked on. Another set of patterns from that language was presented in ‘Patterns for High-Availability Internet Systems’ presented at EuroPLoP 2002 [PIA]. The experience captured in these patterns has been gained over the implementation and review of a number of internet-based systems over the past four years. The initial draft of patterns presented here was produced by the authors as part of the materials for training course commissioned by Sun Microsystems – elements of the content in this pattern language are reproduced with their permission. As we prepared this paper for the conference we had much useful feedback from our shepherd Klaus Marquardt. His feedback helped to make the contents sharper and more focused, for which we are most grateful.
About the authors Paul Dyson has spent the past 4 years working exclusively on internet-technology projects for clients such as Philips, Interbrew and lastminute.com. In all of these projects he has been given the job of ‘application architect’ – playing a key role in defining both the logical and physical architecture of the system. Paul is the author of a number of pattern languages including ‘Patterns for Abstract Design’ and ‘State Patterns’. Andy Longshaw used to be a Principal Technologist for QA Training but now has to work for a living. For most of the past 7 years, he has been tasked with learning new technologies, understanding their possibilities and limitations, and fitting them into the real world of software development. Andy has worked on Internet architecture-related projects for clients such as Sun, Microsoft, and Tesco.

The Example Much of the work the authors have carried out on internet-based systems is still covered by various non-disclosure agreements. The example used throughout the paper is an anonymized amalgam of a number of those systems. Every pattern presented in this language has been observed in at least three systems the authors have had personal involvement with, often in more than one incarnation. The running example we will use is the fictional GlobeTech site. GlobeTech is a major manufacturer of consumer goods which range from low-value, high-volume goods right through to specialist-market, high-value items. The outlets for these items range from small, independent outlets to multi-national retailers. The main business driver for the website is to improve their service to both their retail partners and their end customers. The funding for the website is contributed jointly by the Marketing and Sales, and Customer Service departments: Marketing and Sales can see a new channel for attracting and retaining customers, and Customer Service believes it can significantly reduce the cost of after-sale care on low value items by making much of it’s content (such as FAQ’s and manuals) available on the web. Marketing and Sales is also keen to start to conduct much of its retail-partner business via the site. They see that this can both improve level of service provided to retail partners and reduce costs. The main areas of site functionality are:
• Product Catalogue – complete catalogue of all products GlobeTech make a sell throughout the world
• Outlet Finder – search engine for GlobeTech outlets by location throughout the world
• Customer Care – searchable online version of all Customer Service content, linked to the product catalogue
• Promotions – various mechanisms for promoting products such as those recently launched or those that might be of interest to particular users
• Customer Database – registration of all users of the site, used to personalise customer care and promotion functionality
• Shopping Basket – limited direct-sell capability for products that are hard to obtain in retail outlets
• Retailer Ordering – bulk ordering facility for retail partners
• Retailer Contacts – retailer-specific searchable contact database to allow retailers to identify GlobeTech personnel they should deal with for specific enquiries and vice-versa
GlobeTech will invest a substantial amount of money in the site and want to make it available globally. That is to say that they will service over 100 countries with the site and present all content and services in over 200

different languages. However, they are not going to spend all the money on an as-yet-unproven concept. The system will initially be launched in 10 countries and 13 languages, then rapidly rolled out to the rest of the world if it proves to be a success. GlobeTech estimate that the final system will need to cope with around 10,000 users simultaneously accessing the consumer-facing side of the site, with around 2,000 users on the retailer-facing side. Average interaction lengths will be 20 minutes for consumers but 4 hours for retailers. Even in the initial incarnation of the system the expectation is for around 2000 consumers and 50 retailers. From the outset the system must be truly 24x7x365 operational – stated minimum availability is 99.9% as the initial 10 countries cover most of the globe and the length of the retailer interactions means that there is no foreseeable ‘dead time’ for the system.
Current architecture The diagram below shows an elided view (some of the switches have been left out) of the system’s architecture once it has been evolved for availability and scalability. The ellipses indicate where patterns have been applied to improve availability and scalability.
System management terminology used in this paper For clarity, the following definitions apply throughout this paper:
• Logging. The recording of system-level information to a given, persistent location. An example is HTTP request information being written to a file by a Web server.
• Logging agent. A software entity that logs information. This may be part of a functional element (such as HTTP logging functionality built

into a Web server, or SNMP reporting functionality embedded in a switch or router), or it may be a separately installed piece of software (for example a daemon or service that takes snapshots of system resource usage and writes them to a database). Typically, each element in the system will house or be co-located with a monitoring agent.
• Monitoring. The act of receiving and interpreting information generated by system elements. An example would be listening for particular SNMP messages sent from a specific subset of the system elements, such as network card failures on the routers.
• Monitoring agent. A software entity that makes it easier to monitor a system. There may be different monitoring agents for different parts of the system or a single, overarching monitoring agent for the whole system. Such software could be written specifically for the project or it could be bought in (e.g. HP OpenView). An example is a management console that receives SNMP alerts and processes them based on a set of rules.
• Alerting. Bringing a problem to the attention of an automated or manual mechanism that can (potentially) resolve the underlying problem. An example is sending a pager message to the duty system administrator. Other channels for alerts include emails and GUI-based indicators (e.g. the image of a router goes red on screen when it fails).
• Alerting agent. A software entity that makes it easier to generate alerts based in specific system events. The alerting agent may be a custom piece of software or it may be bought in. The alerting agent may be built into the same software entity as the monitoring agent, so that different messages can be sent through various alerting channels based on rules configured in the monitoring agent.

The Language Language context Internet-technology systems (particularly public Internet systems) are subject to large and unpredictable changes in demand. These changes can occur very rapidly; perhaps in response to publicity about the site (either planned or unexpected2), some special offer or service, or an event that increases the need for the services offered by the system amongst its user community (e.g. a travel booking system can expect a large increase in traffic if there is an unexpectedly good weather forecast for a bank-holiday weekend). This degree of unpredictability makes the system extremely hard to control. How do you ensure that the system is available if you don’t know how many users are likely to use it? How do you ensure it is secure if you don’t know who those users are and in what ways they are likely to want to access the system? And this degree of difficulty is only enhanced by the complexity of a system deployed across multiple hardware and software servers. The GlobeTech system is as susceptible to this problem of unpredictability as any other Internet-technology system. It supports both business and consumer customers. Such customers work in different cycles – the business customers will order to their own retail cycle. These cycles may coincide (causing a large number of business users to place orders around the same time) or be disjoint. The degree to which they coincide is also unpredictable over time. The consumer use of the site will largely be influenced by marketing campaigns conducted not only by GlobeTech itself (as such its impact is hopefully predictable) and also by GlobeTech’s business customers (unpredictable). If one of the big retailers heavily promotes a GlobeTech product users may well visit the site to find out more about it and to see if there are other retailers stocking the product who might sell it cheaper. Major
2 One of the authors was part of the project to build a new version of the website for a well-known e-commerce dotcom (one that is still around today!). The go-live for the new system was scheduled for late Friday night as the weekend was one of their quietest times. On the Sunday evening the system had been up and running for the whole weekend and was coping well with its load, a mixture of real users and simulated users; the simulation designed to reproduce the conditions of peak load. The system was coping reasonably well as the load climbed to 3500 simultaneous users – pretty much the maximum the system ever had to cope with. The load remained at around 3500 users for around an hour and then suddenly, at about 7.30 pm, the load suddenly started to increase massively – hitting 5000 in a matter of a couple of minutes (when the system really started to struggle). The team rapidly shut down all the simulated users but the load still grew, forcing the team to take the drastic measure of killing off a number of live user sessions and setting a maximum session limit of 4000. Once this limit was in place, the system started to recover. Emergency over, the team noticed that the technical room, which had been full of senior managers and board members watching the go-live, was now almost empty. Looking for someone to explain the situation to, the author wandered into the ‘chill-out room’. There, all the managers and board members, plus a large number of the technical team, were watching a BBC documentary about the dotcom company and its rise to prominence (“look, there you are on the table football”). Unfortunately, no-one had thought that such a high-profile television programme might actually make viewers think to go and visit the site just as we were running our load test.

product launches (with accompanying publicity drive) can also massively affect the load placed on the system.
Language Summary The table below summarises the affect on the technical, non-functional characteristics the introduction of a particular pattern will have:
Pattern
Ava
ilabi
lity
Perf
orm
ance
Scal
abili
ty
Mai
ntai
nabi
lity
Man
agea
bilit
y
Secu
rity
Flex
ibili
ty
Port
abili
ty
Cos
t
Continual Status Reporting
+? - +? + -? -
Operational Monitoring and Alerting
+ - + -
3-Point Logging - + + +
System Overview -? + + + -
Dynamically Adjustable Non-Functional Configuration
- + +?
+ Has a positive effect on the characteristic
- Has a negative effect on the characteristic
-/+ Has both positive and negative effects on different aspects of the characteristic
? Potentially has an effect (positive or negative as indicated) on the characteristic
Core Patterns As part of defining the overall pattern language for Internet technology systems, a handful of ‘core patterns’ have been identified that appear to be fundamental to creation of such a system. These patterns seem to have major impacts on all of the non-functional characteristics that we see as being important to the system such that they do not fit into any of the categories we have defined (system performance, system control, system evolution). The decisions made during the application of these patterns define the ‘shape’ of the system. This then forms the context on which the rest of the patterns build. Thumbnail descriptions for each of the core patterns identified are listed below. Functionally Identical Elements Problem: If any task in the system is performed by a single element, this element can become a bottleneck or a single point of failure.

Solution: Introduce duplicate elements for key tasks in the system (ones where removal of the element would prevent the system from operating or where failure to scale would seriously restrict system performance). Functional Layer Separation Problem: If there is no organizing principle for the system it becomes impossible to guarantee the levels of non-functional characteristics. Solution: Separate tasks into logical groups and use these groupings to organize the elements of the system. Peripheral Specialist Servers Problem: The effectiveness and efficiency of the main system elements is compromised by the need to perform non-core tasks. Solution: Split non-core tasks out from the main body of processing. Dedicate specific, non-core system elements to perform these tasks.
Pattern Relationships
respond to immediate need tochange system performance byaltering runtime configuration
build onbasic information
build onbasic information
use predictive analysis totune system performance byaltering runtime configuration
combine to give pictureof system status andreasons for that status
consolidate into asystem overview
consolidate into asystem overview
Continual StatusReporting
3-Point Logging
System Overview Runtime Configuration
Operational Monitoringand Alerting

Continual Status Reporting Problems A system may crash or deliver poor performance if system elements fail or if the system is placed under unexpected levels of load. Specific context Without an accurate and up-to-the-minute picture of the status and health of the system, you cannot easily diagnose system problems or take measures to avert system failure. Lack of historical status and loading information makes it far more difficult to predict and plan for any change in system capacity. Almost all of the elements in an Internet-technology system can produce information that is useful to the administrators and implementers of the system. The amount of information generated by each element is generally configurable. Part of the system design and implementation must be concerned with the type and amount of information generated, and how this information is stored. The system operations team will need to know of any impact on system performance due to failure or unexpected load. In the longer term, they will need to know what elements of the system are reaching capacity so that they can schedule upgrade or replacement. Example The GlobeTech architecture contains four main types of elements:
• Web servers
• Application servers
• Data access (database) servers
• Support infrastructure (e.g. switches, load balancers, replicators and routers).
All types of element play a vital role in the health of the system and significant failure of any type of element, whether catastrophic or gradual, can have an adverse affect on system behaviour. If the load on the web servers is gradually increasing, eventually they will reach their limit on number of concurrent users. At this point, new users will be rejected. Many of these rejected users will go to competitor sites or simply abandon their efforts to examine or buy product. However, a small number will complain about it to their friends and colleagues. An even smaller number will complain in emails and user forums. By the time such complaints have filtered through to the system operations team, the organization can have gained a pretty bad reputation because of the failure of its system. This scenario is entirely avoidable. Forces We need some way to monitor the health and usage of the individual elements of the system.

• For reasons of cost, performance and manageability, we may want to restrict the number of system elements we monitor. But, in the type of architecture we are evolving, every element has a vital role to play and, consequently, can significantly affect the overall health of the system if it fails or is subject to excessive load.
• For reasons of cost, performance and manageability, we may want to restrict the amount of information generated by each element. But, the amount and type of information required will depend on the purpose for which that information is used. Restricting the information generated may prevent the correct diagnosis of problems.
• For reasons of cost and manageability, we may want to have system elements store status information about themselves and analyse that information off-line or at set intervals. But this does not give us the ability to react immediately to changes in use that might threaten the health of the system.
Solution Define a reporting interface or protocol for every type of system element that can seriously affect the operational health of the overall system (usually all or nearly all of them). Have each individual system element continuously report its status according to its type. Log some or all of the data generated so that it is available for subsequent offline analysis. Solution implementation There are standardised protocols, such as SNMP and CMIP, for continuously requesting and reporting status information. Many types of system element will support one of these ‘out of the box’ and most monitoring agents support at least SNMP. However, because these protocols only define the way status information is reported, there is still implementation work to be done in defining what that information is. The type of information generated will depend on the purpose for which it is required. The system information requirements of Operational Monitoring and Alerting, 3-Point Reporting and System Overview are quite different. The types of information generated by system elements can be broadly classified as follows:
• Status information. Examples: Element is running correctly; network card running at 100Mbps; all disks in RAID array working OK.
• Usage information. Examples: Number of concurrent user requests; level of memory usage; amount of data passed through a network interface.
• Execution information. Examples: User thread has entered a particular method on a software component; HTTP connection made to web server; SSL connection established with content switch.
In each case, a logging agent must be used to generate and propagate the information. The logging agent could form part of the system element on which it is reporting, for example the Web log generation by a Web server or a reporting module embedded in a network switch. In the absence of a built-in logging agent, you can introduce a separate logging agent that is a separate

software entity. This will poll the status or usage of a system element and generate appropriate logging information. The logging agent will usually be responsible for propagating the element information to a monitoring agent. This propagation will usually be across a protocol such as SNMP. The logging agent may push the information to the monitoring agent or the monitoring agent may pull the information from the logging agent. Where the logging agent for a system element doesn’t support a standardised protocol ‘out of the box’, it isn’t necessary to implement it from scratch. Take the example of a Web Server generating HTTP log information into a file. A common technique is to implement an adaptor (often called a ‘log-scraper’) that extracts relevant information from the Web log and creates status information from it. For simplicity, this element also usually acts as a monitoring agent for the values it extracts but it can also pass the values on to a dedicated monitoring agent across a common reporting protocol. Another possibility is to introduce or implement a general logging agent for a system element that reports on the use of the element’s resources such as memory, processor and disk space. Whilst this doesn’t give as sophisticated a picture as having the system element report its own status, it may be sufficient for reporting failures or bottlenecks. One of the major considerations in implementing Continual Status Reporting is in choosing what ‘continuous’ really means. For some elements this is fairly straightforward. If a Web server is logging each user request, then it will log requests as and when they happen. However, if a logging agent is reporting on memory usage, it could report in intervals of 100ms, 1 second, 5 seconds, 30 seconds, and so on. The appropriate frequency in this case will depend on the purpose to which the information is to be put. Solution example In the GlobeTech system we add status reporting capability to the four important types of system element:
• The web servers have the ability to continuously write their status to log files. A simple log-scraping programme is run every 30 seconds to extract the number of user requests served, whether the request was for a dynamic page or a binary asset, and the time to serve each request. The log scraping programme makes this information available across SNMP.
• The application servers have an SNMP interface built in. With a small modification to the application software we can ensure the servers report number of requests for dynamic pages, average time to serve each request, and the number of concurrent user sessions. We also report individual requests that take more that 30 seconds to serve, including detailed information on the request and the related session state information.
• The database server has a proprietary monitoring client used by the database administrator. We write a small proxy that intercepts information coming out of the database and extracts the high-level
information about number of queries run and the average time to return the result set.
• The switches all support SNMP for indicating they are still alive.
• We run TOP on every hardware server to monitor the server process(es), reporting the CPU time and memory used by each process – this covers the load balancers as well as the other types of software server.
Resulting Context • Availability is potentially improved as the generated information can be
used to identify and predict element failure or overload.
• Performance is impacted because of the overhead of the continuous reporting.
• Maintainability is potentially improved because management information can sometimes be useful in diagnosing a fault or problem. For example, requests for dynamic pages failing when the data access servers take more than thirty seconds to pass back the result set may indicate a pre-defined time-out in the database drivers used by the application servers).
• Manageability is improved because up-to-date information about each element’s condition is continuously available.
• Security is potentially reduced as extended system information is available to any intruder who has the capability of monitoring network traffic.
• Cost is increased. The expense of introducing continuous reporting for every type of system element is always going to be significant whether the element supports reporting out of the box or not. This cost is justified because continuous status reporting is at the heart of a controllable system.
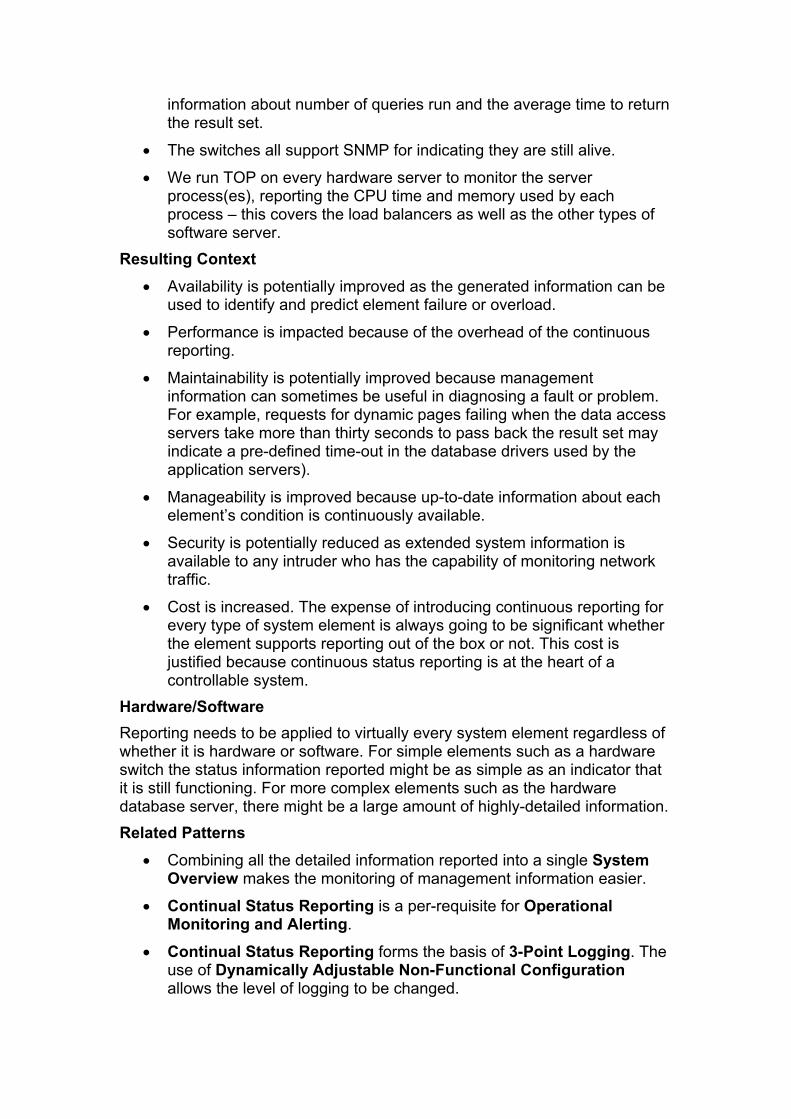
Hardware/Software Reporting needs to be applied to virtually every system element regardless of whether it is hardware or software. For simple elements such as a hardware switch the status information reported might be as simple as an indicator that it is still functioning. For more complex elements such as the hardware database server, there might be a large amount of highly-detailed information. Related Patterns
• Combining all the detailed information reported into a single System Overview makes the monitoring of management information easier.
• Continual Status Reporting is a per-requisite for Operational Monitoring and Alerting.
• Continual Status Reporting forms the basis of 3-Point Logging. The use of Dynamically Adjustable Non-Functional Configuration allows the level of logging to be changed.
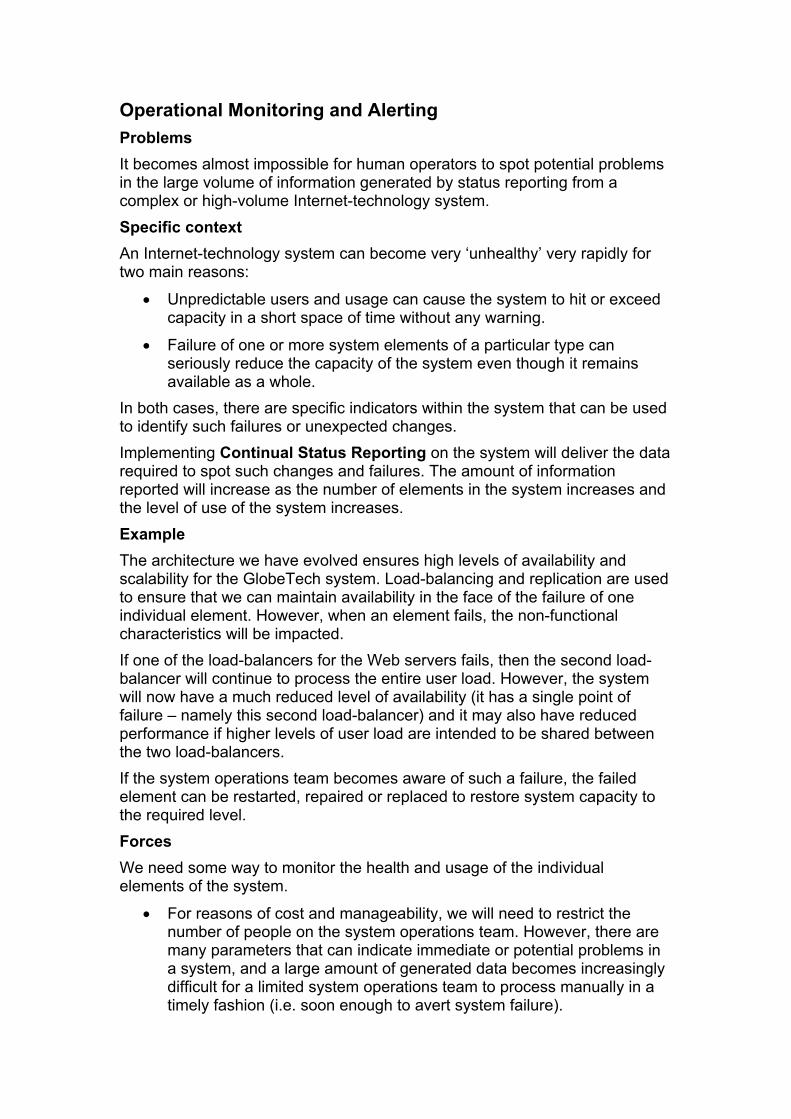
Operational Monitoring and Alerting Problems It becomes almost impossible for human operators to spot potential problems in the large volume of information generated by status reporting from a complex or high-volume Internet-technology system. Specific context An Internet-technology system can become very ‘unhealthy’ very rapidly for two main reasons:
• Unpredictable users and usage can cause the system to hit or exceed capacity in a short space of time without any warning.
• Failure of one or more system elements of a particular type can seriously reduce the capacity of the system even though it remains available as a whole.
In both cases, there are specific indicators within the system that can be used to identify such failures or unexpected changes. Implementing Continual Status Reporting on the system will deliver the data required to spot such changes and failures. The amount of information reported will increase as the number of elements in the system increases and the level of use of the system increases. Example The architecture we have evolved ensures high levels of availability and scalability for the GlobeTech system. Load-balancing and replication are used to ensure that we can maintain availability in the face of the failure of one individual element. However, when an element fails, the non-functional characteristics will be impacted. If one of the load-balancers for the Web servers fails, then the second load-balancer will continue to process the entire user load. However, the system will now have a much reduced level of availability (it has a single point of failure – namely this second load-balancer) and it may also have reduced performance if higher levels of user load are intended to be shared between the two load-balancers. If the system operations team becomes aware of such a failure, the failed element can be restarted, repaired or replaced to restore system capacity to the required level. Forces We need some way to monitor the health and usage of the individual elements of the system.
• For reasons of cost and manageability, we will need to restrict the number of people on the system operations team. However, there are many parameters that can indicate immediate or potential problems in a system, and a large amount of generated data becomes increasingly difficult for a limited system operations team to process manually in a timely fashion (i.e. soon enough to avert system failure).

• For reasons of cost, performance and manageability, we may want to restrict the number of system elements we monitor. But, in the type of architecture we are evolving, every element has a vital role to play and, consequently, can significantly affect the overall health of the system if it fails or is subject to excessive load.
• For reasons of cost and manageability, we may want to have system elements store status information about themselves and analyse that information off-line or at set intervals. But this does not give us the ability to react immediately to changes in use that might threaten the health of the system.
Solution Have all system elements employ Continual Status Reporting to report their status at an appropriate frequency. Implement an automated, Operational Monitoring and Alerting process that watches for indicators of a failing system and warns the system operations team – allowing them to take preventative action if possible. Solution implementation Each system element should report health and usage information using an appropriate logging agent. Typically, the sort of information that should be reported is whether the element is alive or dead, the use of limited resources if it is alive (memory, processor, disk space, connections, etc.), and the number of ‘requests’ handled in each reporting interval. What constitutes a ‘request’ varies between system element types – for a switch it is an HTTP request that needs routing, for a Web server it is a request for a dynamic page to be assembled. The logging agent must make the information available to an appropriate monitoring agent. This is commonly done over a standard protocol such as SNMP. Where a type of system element doesn’t support a standardised protocol ‘out of the box’, it isn’t necessary to implement it from scratch. A common technique for monitoring an element that supports simple, file-based logging is to implement a ‘log-scraper’ that extracts relevant information from a log and interprets it into status information. For simplicity, this element also usually monitors the values it extracts but it can also pass the values on to a dedicated monitoring agent. One of the major considerations in implementing Operational Monitoring and Alerting is to ensure that the implementation of Continual Status Reporting for each system element produces information in the timeframe required for the monitoring and alerting to be effective. There are three considerations here:
• Rate of system state change. There is no point in reporting information more frequently than the state of a particular system element changes or is likely to change.
• Resolution mechanism. Given that the point of this pattern is to notify operations staff in time for them to apply remedial action, the rate of status reporting is related to the amount of time it takes to implement the remedial action. For example, if the remedial action involves

sourcing and configuring a new server (which would take days) then there is no point in reporting the triggering status every 15 seconds.
• Impact on performance. Report information too frequently and performance will be affected by the amount of time spent monitoring and processing the information and the volume of information present in the network.
• Failure window. Report information too infrequently and serious problems could arise between reporting intervals.
What constitutes the right frequency really depends on the individual system. Solution example In the GlobeTech system we implement a monitoring and alerting system based on a system management application. Aspects of this include:
• The logging agents on each of the web servers will report user load and the time to serve each request. These are delivered to the management application which will generate an alert should user load or response time exceed pre-defined thresholds for a sustained period. These alerts will take the form of an email sent to the operations team and notification of a possible error on any running instance of the graphical management console.
• SNMP messages from the application servers are sent to the management application. These messages are monitored for unexpected increases in the level of load, the amount of time to process a request and the number of concurrent users. Sustained increases of this type will cause an email alert to be sent to the operations team and notification to be made on the monitoring console.
• Database information about number of queries run and the average time to return the result set is sent to the management application. The management application which will generate an alert should these values exceed pre-defined thresholds for a sustained period. These alerts will take the form of an email sent to the operations team and notification of a possible error on any running instance of the graphical management console.
• SNMP messages indicating normal operation are generated by all switches, routers, network cards, operating systems, application servers, and Web servers in the system and delivered to the management application. If such messages cease for a particular element, a critical alert is generated in the form of pager messages to the system operator team currently on duty (or on call). Any running instance of the graphical management console will display a dialog box requesting immediate action.
Resulting Context • Availability is improved – the use of alerts can help the operations team
prevent the system from becoming partially or wholly unavailable.
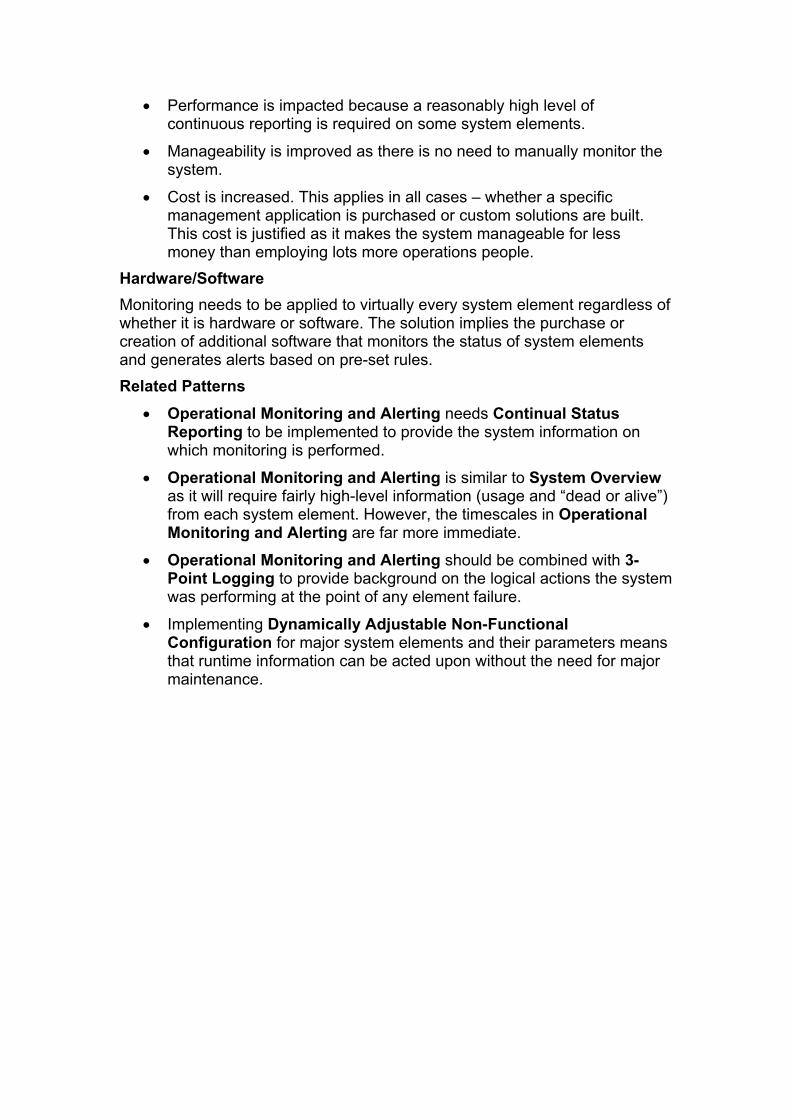
• Performance is impacted because a reasonably high level of continuous reporting is required on some system elements.
• Manageability is improved as there is no need to manually monitor the system.
• Cost is increased. This applies in all cases – whether a specific management application is purchased or custom solutions are built. This cost is justified as it makes the system manageable for less money than employing lots more operations people.
Hardware/Software Monitoring needs to be applied to virtually every system element regardless of whether it is hardware or software. The solution implies the purchase or creation of additional software that monitors the status of system elements and generates alerts based on pre-set rules. Related Patterns
• Operational Monitoring and Alerting needs Continual Status Reporting to be implemented to provide the system information on which monitoring is performed.
• Operational Monitoring and Alerting is similar to System Overview as it will require fairly high-level information (usage and “dead or alive”) from each system element. However, the timescales in Operational Monitoring and Alerting are far more immediate.
• Operational Monitoring and Alerting should be combined with 3-Point Logging to provide background on the logical actions the system was performing at the point of any element failure.
• Implementing Dynamically Adjustable Non-Functional Configuration for major system elements and their parameters means that runtime information can be acted upon without the need for major maintenance.

3-Point Logging Problem If the system fails, or performance degrades, how do we know what different elements in the system were actually doing at the time? Specific Context Any Internet-technology system will be subject to full or partial failure at some point in its lifetime. During development, individual software components will be subjected to unit tests and the system as a whole will be subjected to integration testing. However, no amount of testing can ever guarantee that nothing will go wrong in production. We will need to determine the cause of failure so we can take actions to prevent it. To diagnose any failure, information is needed about what the different system elements were doing at the time. In a multi-tiered, Web-based environment, it is particularly tricky to trace a single path of execution through the system from the initial HTTP request through to the back-end database access. There are many hardware and software components involved in satisfying such a request, any of which could be the source of the problem. Example The GlobeTech system uses Continual Status Reporting to give an up-to-date picture of its health. Operational Monitoring and Alerting will highlight the failure of system elements and any excessive load. However, if an application server goes down when it isn’t under excessive load or resource-constrained we will have no idea what else might have caused the failure. Forces
• The system element information generated for Operational Monitoring and Alerting provides us with a picture of the system's health during normal execution, but we also need to see what the system was doing to re-trace the sequence of events or activities that may have contributed to a system failure.
• To successfully debug a hardware or software element you need a lot of diagnostic information, but the generation of diagnostic information decreases the performance of the system element and you do not know beforehand precisely what information may be needed.
• You cannot know beforehand which elements of the system will fail, but recording diagnostic information for all elements in the system will take up a prohibitively large amount of storage space.
Solution Implement a mechanism to log system events and system execution information. This mechanism should be able to log three different types of data:
• debug – usually execution-trace information such as which methods have been called on a software component and with what parameters

• information – simple warnings about the system condition such as timeouts, missing data or uncommon code flows
• error – things that go very wrong such as failure to connect to a database or loss of connection between web server and load-balancer
Solution implementation The important things about implementing 3-Point Logging are the ability to select specific categories of information to be logged and the ability to selectively enable it for individual system elements. Much of the time most system elements should just record errors – probably to the syslog on Unix or the System Event Log on Microsoft Windows. Both of these locations can be tied into Operational Monitoring and Alerting. However, if there is a known problem, certain elements in the production system will be instructed to report information or even debug levels of data for a period of time while the problem is replicated. So, two key requirements are:
• Each system element should have its own configuration setting that allows the level of 3-Point Logging information I generates to vary separately from other system elements.
• The logging mechanism should implement Dynamically Adjustable Non-Functional Configuration so that the logging level can be altered without interrupting the system. This is particularly important as the amount of logging data produced for the debug level may seriously hamper performance and quickly fill up storage, so you want it on for a short a time as possible. To partially address this, you may have finer granularity of control over the production of debugging messages so that you can control the amount of debug information produced (e.g. “basic flow”, “parameters and return values”, “full”).
The approach to 3-Point Logging will depend on the particular system element:
• For a custom element (usually a software component) an explicit 3-Point Logging mechanism can be introduced as part of the specification. Development blueprints, frameworks or best practices should require component developers to adhere to a set of rules for how to log and what to log. The logging mechanism chosen should be configurable so that it conforms to Dynamically Adjustable Non-Functional Configuration. This could involve it reading from a configuration file or system registry. The principle for the component developer is that their code should always log events and leave the logging mechanism to decide whether or not these events should be propagated based on the currently configured levels of logging.
• Some bought-in elements, particularly complex software elements such as application servers, may already provide 3-Point Logging (or N-Point logging) so it is just a matter of setting the required configuration.
• Other bought-in elements may not provide distinct levels of logging. For example, the Web server software may allow you to log lots of

different information about HTTP requests and responses but each one may need to be turned on or off individually. In this case, you may wish to define which combinations of information match to your definitions of error, information and debug and then use batch scripts to change the settings in one go.
One thing that is almost guaranteed is that the locations to which various elements log their information will be different. You may see this as a benefit – error messages go to one place and debug messages go to another – but it can also be a problem to stitch together multiple sources of information to create a coherent picture of what the system was doing when a failure occurred and what sequence of cross-element events occurred in the run up to the failure. Solution example The primary implementation of 3-Point Logging in the GlobeTech system is in the development of the software components. As part of the software development process we introduce a convention for logging in all software components, whether running in an application server or a web server. Every exception unexpectedly caught is logged as an error, unmet pre-conditions and post-conditions are logged as information, and every method has a debug logging statement at the beginning that indicates the method called and the parameter values it was called with. The logging mechanism used reads the level of logging required from the application configuration information and only logs messages of the levels specified. To support the logging in the software components, the web server logging functionality is turned on. This gives a list of http requests received and responses passed back that can be interwoven with the software component logs to try to determine which client call generated the error. We also want database access logging as part of the overall solution, so we treat the database like a black box (the internal workings of the database are not our concern) and simply turn on its default error logging. Resulting Context
• Performance is impacted because the logging mechanism introduces processing overhead.
• Maintainability is improved as the logging gives support and development engineers the information they need to track errors in the system or trace its execution.
• Manageability is improved because the logged information can also be used by system managers to monitor system execution.
• Cost is decreased when measured in terms of the overall lifecycle of the application as, although more development effort is required to implement the logging, less time is spent on troubleshooting during the time the system is in production.

Hardware/Software Usually it is the software components that log information, debug and errors. However, some hardware devices will come with in-built logging capabilities. Related Patterns
• 3-Point Logging is a form of Continual Status Reporting that is specific to software components, where the status of a component consists of the current point in its lifecycle.
• 3-Point Logging provides a way of discovering what the system is doing and Operational Monitoring and Alerting provides a way of seeing how well it is doing it.
• Consider using Dynamically Adjustable Non-Functional Configuration to allow the level of 3-Point Logging to be altered while the system is running

System Overview Problems The use of many system elements makes it difficult to get a simple picture of the state of the overall system. It is difficult to pick out long-term trends in the large amount of data generated by Continual Status Reporting. Specific Context An Internet-technology system is rarely used exactly as predicted at its inception. The number of customers may be higher or lower than predicted and the profile of use may differ. As the load increases, either at peak times or as a steadily rising average level over a period of months, some system elements may approach their capacity. Even though the system has implemented Operational Monitoring and Alerting on top of Continual Status Reporting, this level of load may not necessarily be sufficient to trigger an alert. By the time it does trigger an alert, the level of load may be critical. The picture is complicated as the system functionality is distributed across many system elements. Each of these elements will be reporting its status individually. However, there is a need to understand the overall picture. The information delivered to you may tell you that Web server A is running at 80% capacity, from which you might assume that it needs an upgrade or that an additional Web server host must be added. However, if Web servers B and C are lightly loaded (which could be the case depending on the algorithm used by the load balancer) then the overall loading may still be well within limits. The picture is further complicated since there is usually a need to reduce capacity (or decrease a particular non-functional quality such as availability) in order to upgrade a part of the system (e.g. take a context switch out of service to add another blade to it, which leaves a single switch to take all of the load). Whether it is for upgrade or for routine maintenance, suitable times must be identified when such outages will cause least impact. Finally, there is a huge amount of data generated by any non-trivial system. This must be turned into something understandable by the human operations team. In order to determine if more capacity is needed, you require, in part, historical usage data from which to extrapolate increasing (or decreasing) load. There is a similar requirement when planning maintenance as daily or weekly “quiet times” for the system must be identified into which any outage or capacity reduction can be slotted. Example The GlobeTech system has implemented Continual Status Reporting and Operational Monitoring and Alerting for its web servers, application servers, data access servers, load balancers, network switches and routers. With all system elements in operation we have thirty-two streams of status data:
• three web servers, both software and hardware (6 elements in total)
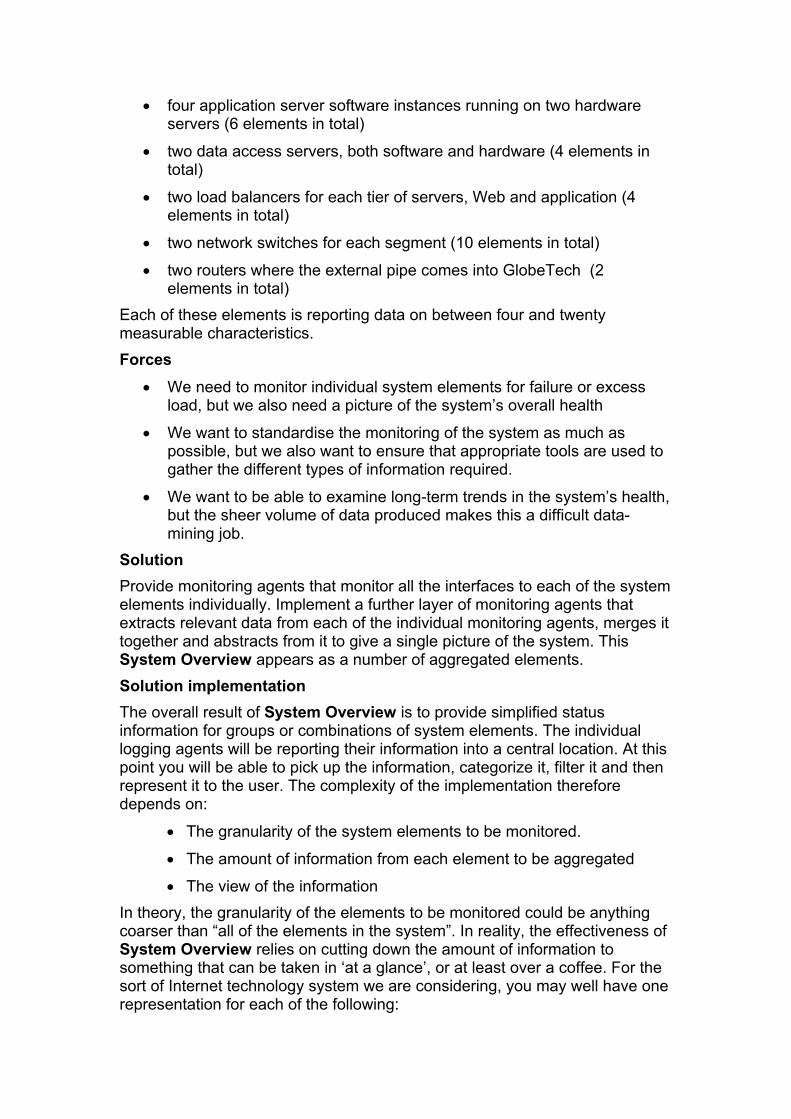
• four application server software instances running on two hardware servers (6 elements in total)
• two data access servers, both software and hardware (4 elements in total)
• two load balancers for each tier of servers, Web and application (4 elements in total)
• two network switches for each segment (10 elements in total)
• two routers where the external pipe comes into GlobeTech (2 elements in total)
Each of these elements is reporting data on between four and twenty measurable characteristics. Forces
• We need to monitor individual system elements for failure or excess load, but we also need a picture of the system’s overall health
• We want to standardise the monitoring of the system as much as possible, but we also want to ensure that appropriate tools are used to gather the different types of information required.
• We want to be able to examine long-term trends in the system’s health, but the sheer volume of data produced makes this a difficult data-mining job.
Solution Provide monitoring agents that monitor all the interfaces to each of the system elements individually. Implement a further layer of monitoring agents that extracts relevant data from each of the individual monitoring agents, merges it together and abstracts from it to give a single picture of the system. This System Overview appears as a number of aggregated elements. Solution implementation The overall result of System Overview is to provide simplified status information for groups or combinations of system elements. The individual logging agents will be reporting their information into a central location. At this point you will be able to pick up the information, categorize it, filter it and then represent it to the user. The complexity of the implementation therefore depends on:
• The granularity of the system elements to be monitored.
• The amount of information from each element to be aggregated
• The view of the information In theory, the granularity of the elements to be monitored could be anything coarser than “all of the elements in the system”. In reality, the effectiveness of System Overview relies on cutting down the amount of information to something that can be taken in ‘at a glance’, or at least over a coffee. For the sort of Internet technology system we are considering, you may well have one representation for each of the following:

• All the web servers
• All the application servers
• The servers in the database cluster
• The support infrastructure (routers, switches, etc.)
• Important external gateways The level of information about each of these groups of system elements is the next thing to decide on. It could be as simple as a single flag indicating current status. The status could be okay (no monitoring limits have been exceeded); risk (one or more monitoring limits are close to being exceeded); and broken (one or more monitoring limits have been exceeded). The value of this flag is based on the current information from each of these groups of elements. This means that for each element being considered (and each of its sub-elements) you will have to determine what status values correspond to the different levels. You can then set these as trigger levels so that exceeding the threshold will cause the overall status to change. In addition to the overall status, certain key indicators could be extracted and used as part of the System Overview. This could be loading factors on the application servers, number of customer sessions, or whatever seems to make sense to the operations team. The final part is to present the information to the operations team. This could be as simple as an email issued on a regular basis (once a day, at the start of a shift, hourly). Alternatively, if you have a management console such as HP OpenView, you could use its event correlation services to merge the data arriving and then its glanceplus service to map this into a user interface showing the system elements and their current status. Solution example Each of the elements in the GlobeTech system reports its status using a technique suitable to that element as described in Continual Status Reporting and the critical information is monitored as described in Operational Monitoring and Alerting. For each type of coarse-grained system element (web server, application server, database server, support infrastructure) we abstract all the information into a single status flag: okay, risk, and broken. In addition we aggregate the number of simultaneous sessions across all the application servers and the request response times for dynamic pages (not for binary assets) across all web servers and application servers. Resulting Context
• Performance (of management function) is impacted because of the introduction of an extra layer of communication.
• Scalability is improved indirectly as the need for extra capacity will be determined in good time and additional capacity can be added (finances permitting).
• Manageability is improved because all system elements are considered as a single entity for monitoring.

• Flexibility is improved as a new logging agent or monitoring agent can be implemented under the abstracting layer without impacting existing agents.
• Cost is increased as the creation (or purchase) of an additional layer is required.
Hardware/Software We need to aggregate our picture of the health of both the software and hardware system elements in order to gain our system overview. Related Patterns
• System Overview complements Functional Layer Separation to provide a system that is well-distributed but still easy to monitor.
• Continual Status Reporting provides the management information on which the overview is based.
• Implementing System Overview is easier when we have implemented [Pattern: Functionally Identical Servers].

Dynamically Adjustable Non-Functional Configuration Problem If the limit of a non-functional characteristic is being reached system, you need to react to this change in usage without interrupting system operation. Specific Context Monitoring the health of the system allows us to monitor (and possibly predict) how the system is currently coping with such unpredictable demand. However, knowing that the system is likely to crash in the next fifteen minutes is not very useful unless you can do something about it. If the non-functional characteristics of a system are based wholly or in part on a set of built-in limits or settings then it cannot respond to unexpected changes in usage without being redeployed. The consequences can include system failure, poor performance and unscheduled downtime. Example We have applied Continuous Status Reporting in combination with Operational Monitoring and Alerting and System Overview to give both immediate detailed information and longer-term summary information about the health of our system. This alone does not give us the ability to cope with the potential fluctuations in demand outlined above. Forces
• Ideally our system would be self-repairing: if there is a large increase in user demand it should somehow re-configure itself to easily cope with that demand. But such self-repairing systems are extremely difficult to build and require the builder to predict most of the situations that are likely occur and to implement suitable remedies for all of those situations.
• We can deduce a lot from the raw data produced by Continuous Status Reporting and can identify potential remedies from these diagnoses. For example, a slow database caused by too many queries being run simultaneously can be cured either by limiting access to system functionality that causes queries to be run, limiting the number of simultaneous queries allowed on the database, or beefing up the data access server hardware. But we need to be able to implement those remedies in a timely manner such that they can prevent problems occurring (or mitigate the after-effects of a problem that has occurred).
• We could implement remedies fairly quickly by taking parts of the system out of service, introducing the remedy to that part, followed by bringing the part of the system back into service (this works well with a system that is architected for high availability). But such an approach often exacerbates the problem it is trying to resolve. For example, if the system needs to be configured to cope with a higher number of users browsing around the system, taking one of the application servers out of service to set it up for more browsing (and, by implication, less

transactional) users simply places additional load on the remaining servers – possibly leading to catastrophic failure.
Solution Identify key parameters that fundamentally affect the non-functional characteristics of the system. These typically include:
• Number of simultaneous requests that can be made to a web server
• Number of simultaneous sessions that can be maintained by an application server
• Load balancing algorithm used
• Number of simultaneous connections to a data access server
• Size of data caches
• Security keys For each of these parameters, introduce a mechanism for adjusting these values while the system continues to run. The principle of adjusting system configuration at runtime is not unique to non-functional parameters. It is quite possible to use the same mechanisms to adjust the amount of functionality available or the look and feel of an application while it is running. However, not only is our focus on non-functional requirements, but applying this to non-functional requirements is probably its most useful application. The system will not fall over if a user cannot select a green background rather than a blue one, but it may do if the system runs out of cache space. Solution implementation There are many variations on how application reconfiguration can be implemented. The two basic principles are push (element is notified of the change asynchronously) and pull (element reads settings at an appropriate point). The settings could be stored in a variety of places (configuration file, database, system registry, distributed registry/repository, etc.). The precise location does not change the principle of the implementation. The simplest implementation is probably just-in-time or on-demand pull, where the element reads the setting from a configuration location when it needs it. The setting is not cached for future use and any subsequent need for the value causes it to be re-read. This is a form of smart reference as described in [Pattern: Proxy]. Obviously, this is quite inefficient for values that are needed frequently. Alternatively, the application may poll values on a regular basis and cache them between times. This is more efficient in terms of access to the storage location but it does reduce the responsiveness to changes (depending on the polling interval). An example of this would be ASP.NET which checks to see if the timestamp on the web.config file for a Web component has changed. If the file has changed, the ASP.NET runtime will re-read the values from the file (such as the appRequestQueueLimit that defines the number of pending requests) the next time a request is made for any dynamic Web page in that component.

In some cases, some form of manual notification may be required for the element to re-read its configuration. This latter scenario could take the form of an administrator selecting “save” on a menu on a content switch (load balancer) when they have changed the list of available servers. In the case of asynchronous notification of change, the element must cache the value internally (it may initially explicitly read this value from the configuration source). For a notification to be asynchronously triggered, a element must provide some form of entry point to which notifications can be delivered as defined in [Pattern: Observer] and [Pattern: Publisher-Subscriber]. For a software component, this could be a remote procedure call interface or a message queue. In hardware terms the change could be an SNMP broadcast that is picked up and implemented by the relevant monitoring agent. Solution example The GlobeTech system’s Achilles heel is its highly volatile user base. The single system to service both business and consumer customers saves significant development and system management costs but makes the problems of high availability and good performance particularly difficult to solve. Focussing on this problem, the GlobeTech team introduce two points of to throttle the number of requests [Pattern: Connection Limitation] – at the web servers and at the application servers (limiting the number of HTTP requests and simultaneous sessions respectively). These limitations are split between business and consumer users – there is a limit for both these different types of users that can be altered independently. These limits for requests and sessions are made configurable at runtime so that they can be altered on the fly. With these four Dynamically Adjustable Non-Functional Configuration limits, the GlobeTech system management team have a large degree of flexibility in dealing with expected and unexpected surges in user load. If there is an unexpected surge in dealer demand (perhaps due to unforeseen competition in the market) the limits for business users can be increased at the expense of consumer users. If there is a planned product launch, the dealers can be notified in advance that preference will be given to consumers for the period of the launch. Should response to the launch be unexpectedly high, further restrictions can be placed on dealers; should demand be low, restrictions can be lifted. Resulting Context
• Performance is impacted because the constant reading of configuration information introduces processing overhead.
• Manageability is improved by the introduction of Dynamically Adjustable Non-Functional Configuration as the system’s characteristics can be more easily altered to cope with unexpected conditions.

• Cost may be reduced as there is less need to purchase redundant capacity that may only be required when taking elements offline for reconfiguration.
Hardware/Software Runtime Configuration is typically applied to software elements, however certain types of hardware (e.g. hardware switches) usually have a set of configurable parameters that can be altered at runtime. Related Patterns
• Continuous Status Reporting provides the information about the system’s health that is required to inform the values set for configurable parameters.
• Dynamically Adjustable Non-Functional Configuration is usually split into different types of configuration according to Functional Layer Separation.
• Many other patterns can be implemented with configurable parameters. For example, 3-Point Logging can have its performance improved by making the logging points configurable. Leaving error logging on permanently is standard practice but turning off information and debug logging until they are required can significantly reduce logging overhead for the majority of the time.

Appendix A – Referenced Patterns The body of this paper references patterns that are defined externally. This appendix acts as a reference for those patterns and their sources. Pattern Sources GOF Design Patterns (Gang of Four Book); Gamma, Helm, Johnson,
Vlissides; Addison-Wesley, 1995
PHA Patterns for High-availability Internet Systems; Dyson, Longshaw; EuroPlop 2002
PIA Patterns for Internet Architectures; Dyson, Longshaw; Original EuroPlop 2002 submission
POSA Pattern-Oriented Software Architecture; Buschmann, Meunier, Rohnert, Sommerlad, Stal; Wiley, 1996
Referenced Patterns
Connection Limitation Ensure a minimum level of service by restricting the number of concurrent users of a constrained resource. An example would be to restrict the number of concurrent database users so that each can obtain the data they need in a reasonable timeframe. (PIA – Connection Limitation)
Load-Balanced Servers Deploy servers according to Functionally Identical Elements but introduce a mechanism to balance user load across them continuously rather than simply switching in a redundant server when the active server fails. Ensure that the non-functional characteristics of these Load Balanced Servers are broadly similar (they do not have to be identical if the load-balancing algorithm takes account of the differences) so that performance is reasonably consistent in the event that a server goes down. Consider replacing one high-powered active server and one low-powered redundant server with a number of medium-powered servers to achieve better levels of performance at a roughly similar cost. (PHA – Functionally Identical Servers: Load-Balanced Servers)
Isolation Layer Provide a level of insulation between different parts of the system to improve flexibility and maintainability. An example would be the addition of a persistence layer that would decouple the application and the database used. (PIA – Isolation Layer)
Layers The Layers architectural pattern helps to structure applications that can be decomposed into groups of subtasks in which each group of subtasks is at a particular level of abstraction. (POSA – Layers)

Observer Define a one-to-many dependency between objects so that when one object changes state, all of its dependents are notified and updated automatically. (GOF – Observer) [The following pattern also describes the same concept: POSA – Publisher Subscriber]
One Way Dependencies Make dependencies between system elements one-way to increase flexibility and maintainability of the system. For example, the Web servers will make calls on the application servers, but the application servers are unaware of the nature of their clients (they could be browser clients, SOAP clients, or mobile clients). (PIA – One Way Dependencies)
Proxy The Proxy design pattern makes the clients of a component communicate with a representative rather than the component itself. Introducing such a placeholder can yield enhanced efficiency, easier access, and protection from unauthorized access. (POSA – Proxy) [The following pattern also describes the same concept: GOF – Proxy]
Publisher Subscriber See Observer.
Secure Channels Secure sensitive data in transit by using encryption and authentication. An example would be the use of HTTPS when passing credit card information between a browser client and a Web server. (PIA – Secure Channels)

Appendix B – Glossary ASP.NET ASP.NET is part of Microsoft’s .NET Framework. ASP.NET allows developers to easily write dynamic Web content that is run on the server-side and generates HTML to be sent to a browser. CMIP Common Management Information Protocol (CMIP) is a text-based status reporting protocol that provides for system elements to send information about their status to a monitoring tool. CMIP is intended to address problems with SNMP and eventually to supersede it. CMIP runs over TCP/IP. FTP File Transfer Protocol (FTP) is a text-based way of requesting and retrieving the contents of files on remote systems. FTP runs over TCP/IP. HTML HyperText Markup Language (HTML) is a way of marking up text with tags to indicate how that text should be displayed in a Web browser. You can also create forms from a selection of simple GUI elements. HTTP HyperText Transfer Protocol (HTTP) is a text-based way of requesting and retrieving web pages from web servers. HTTP runs over TCP/IP. POP Post Office Protocol (POP) is a text-based protocol for retrieving email messages from an email server. The main variant of POP is POP3 which runs over TCP/IP. RAID Redundant Array of Inexpensive Disks (RAID) is a term that covers a set of variations for configuring an array of disks so that one disk can fail without losing data or disk access capability. SMTP Simple Mail Transfer Protocol (SMTP) is a text-based way of sending email messages from email client to email servers and from one email server to another. SMTP runs over TCP/IP. SNMP Simple Network Management Protocol (SNMP) is a text-based status reporting protocol that provides for system elements to send information about their status to a monitoring tool. SNMP runs over TCP/IP. SOAP Simple Object Access Protocol (SOAP) is a way of encoding messages in XML to make them interoperable between systems. Most SOAP traffic is passed over HTTP.

SSL The Secure Sockets Layer (SSL) uses encryption mechanisms on top of standard TCP/IP sockets technology to provide privacy and authentication services for Internet technology systems. TCP/IP The Internet Protocol (IP) provides the basic addressing and packet exchange protocol used on the Internet. Transmission Control Protocol (TCP) creates end-to-end connections on top of IP. TOP (or top) A Unix command that monitors system load, CPU usage. Memory usage etc. XML eXtensible Markup Language (XML) is a way of marking up text with tags to define the structure of that text data. There are a whole family of standards around XML that define data typing, data conversion and data searching.