Embed Size (px)
Citation preview

School of Engineering and Design
Brunel University
Pattern Recognition Systems Design on Parallel GPU
Architectures for Breast Lesions Characterisation
Employing Multimodality Images
A thesis submitted for the degree of Doctor of Philosophy
By
Konstantinos Pavlos Sidiropoulos
2014
LONDON, UK

ii
[This page was intentionally left blank]

iii
To my brother
and sisters

iv
Table of Contents
Table of Contents .................................................................................................... iv
List of Figures ........................................................................................................ viii
List of Tables .......................................................................................................... xii
Abbreviations ....................................................................................................... xiv
Acknowledgements .............................................................................................. xvii
Publications ........................................................................................................ xviii
Abstract ................................................................................................................. xx
Chapter 1. Introduction and motivation ............................................................. 1
1.1 Overview ............................................................................................................ 1
1.2 Aims and Rationale ............................................................................................ 2
1.3 Contribution ....................................................................................................... 6
1.4 Thesis Outline .................................................................................................... 7
1.5 Research Funding ............................................................................................... 8
Chapter 2. Breast Cancer .................................................................................... 9
2.1 Overview ............................................................................................................ 9
2.2 Breast Anatomy and Physiology ....................................................................... 10
2.3 Breast Cancer Epidemiology ............................................................................. 11
2.4 Imaging Modalities for detection of Breast Cancer ........................................... 12
2.4.1 Digital Mammography ........................................................................................ 12
2.4.2 Ultrasound .......................................................................................................... 13
2.5 Digital Mammography characterisation of breast masses ................................. 15
2.6 Ultrasound characterisation of breast masses .................................................. 15

v
2.7 Summary .......................................................................................................... 18
Chapter 3. Introduction to Statistical Pattern Recognition ................................ 19
3.1 Overview .......................................................................................................... 19
3.2 Basic principles of pattern recognition ............................................................. 20
3.3 Segmentation ................................................................................................... 22
3.4 Feature extraction ............................................................................................ 22
3.4.1 Histogram features ............................................................................................. 23
3.4.2 Features calculated from the Co-occurrence Matrix ......................................... 25
3.4.3 Features Extracted from the Run-Length Matrix ............................................... 29
3.5 Data Normalisation .......................................................................................... 31
3.6 Feature reduction – selection ........................................................................... 31
3.6.1 Scalar Feature Selection ..................................................................................... 32
3.6.2 Feature Vector Selection .................................................................................... 33
3.6.2.1 Optimal Feature Searching ........................................................................ 35
3.6.2.2 Suboptimal Feature Searching ................................................................... 36
3.7 Classification .................................................................................................... 38
3.7.1 Bayesian ............................................................................................................. 39
3.7.2 Linear Discriminant Analysis ............................................................................... 39
3.7.3 k-Nearest Neighbours ........................................................................................ 40
3.7.4 Probabilistic Neural Network ............................................................................. 40
3.7.5 Support Vector Machines ................................................................................... 41
3.8 Evaluation strategies ........................................................................................ 41
3.9 Summary .......................................................................................................... 46
Chapter 4. GPUs as Parallel Processing Accelerators ........................................ 47

vi
4.1 Overview .......................................................................................................... 47
4.2 The dawn of the Multi-Core Era ........................................................................ 48
4.3 Parallel Programming ....................................................................................... 49
4.4 The evolution of GPU as programmable parallel processor ............................... 52
4.5 GPU Architecture Overview .............................................................................. 55
4.6 The CUDA Execution Model .............................................................................. 59
4.7 Limitations of GPUs -Considerations ................................................................. 61
4.8 Summary .......................................................................................................... 63
Chapter 5. System Design and Implementation ................................................ 64
5.1 Overview .......................................................................................................... 64
5.2 Data Collection and Clinical Material ................................................................ 65
5.3 Ethical Issues .................................................................................................... 66
5.4 Breast Lesions’ Delineation .............................................................................. 67
5.5 Feature Extraction ............................................................................................ 69
5.6 Classifier Selection ........................................................................................... 72
5.7 PR System Design ............................................................................................. 73
5.8 Feature Selection Methods ............................................................................... 73
5.9 PR-System Performance Evaluation .................................................................. 75
5.10 Parallel Processing GPU Platform ..................................................................... 76
5.11 Summary .......................................................................................................... 84
Chapter 6. System Evaluation ........................................................................... 85
6.1 Overview .......................................................................................................... 85
6.2 Evaluation of System Accuracy ......................................................................... 86
6.3 Evaluation of GPU acceleration on System Design ............................................ 95

vii
6.4 Discussion on the Results ................................................................................. 98
6.5 System Limitations ......................................................................................... 103
6.6 Summary ........................................................................................................ 104
Chapter 7. System adaptation to other Medical Imaging applications ........... 105
7.1 Overview ........................................................................................................ 105
7.2 Real time Decision Support System for diagnosis of rare cancers .................... 106
7.3 Discriminating between patients with micro-ischaemic and multiple sclerosis
lesions, using MRI images ........................................................................................... 107
7.4 Discriminating between injured normal and pathological knee cartilage ........ 109
7.5 Differentiating between low and high grade laryngeal cancer cases ............... 111
7.6 Summary ........................................................................................................ 113
Chapter 8. Conclusions – Future Work ............................................................ 114
8.1 Overview ........................................................................................................ 114
8.2 Conclusions .................................................................................................... 115
8.3 Future Work ................................................................................................... 117
References ........................................................................................................... 118
Appendix A .......................................................................................................... 127
Appendix B ........................................................................................................... 129

viii
List of Figures
Figure 2.1: A graphical illustration of the female breast anatomy. Reproduced from
Marieb and Hoehn (2013) ............................................................................................ 11
Figure 2.2: A typical DM image .................................................................................... 13
Figure 2.3: A typical US image ..................................................................................... 14
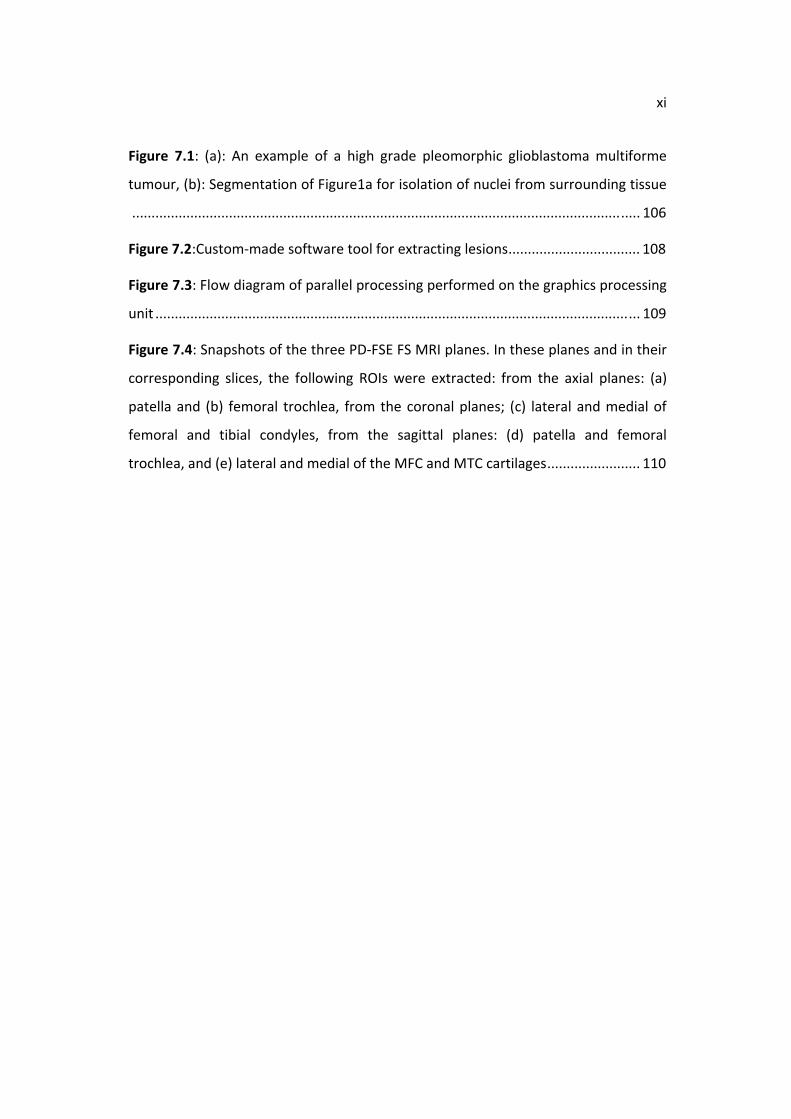
Figure 3.1: The basic stages involved in the design of a classification system. Adapted
from Theodoridis and Koutroumbas (2003) ................................................................ 21
Figure 3.2: Examples illustrating how Skewness and Kurtosis are indicative of the
histogram’s shape ........................................................................................................ 24
Figure 3.3: Calculation of GLCM at angle 0° ................................................................ 25
Figure 3.4: Filter and Wrapper feature selection approaches .................................... 34
Figure 3.5: Pseudocode for SFS algorithm ................................................................... 36
Figure 3.6: Pseudocode for SBS algorithm .................................................................. 37
Figure 3.7: Pseudocode for SFFS algorithm ................................................................. 38
Figure 3.8: Pseudocode for SBFS algorithm ................................................................ 38
Figure 3.9: Different evaluation techniques ................................................................ 44
Figure 4.1: The two main memory models used in parallel programming. ................ 51
Figure 4.2: Comparison of Floating-Point Operations per Second (FLOPS) and
memory bandwidth for the CPU and GPU (Nvidia, 2014) ........................................... 53
Figure 4.3: Typical CPU and GPU architectures ........................................................... 53
Figure 4.4: Hardware structure of a workstation featuring a GPU ............................. 56
Figure 4.5: Block diagram of Tesla-class GPUs (Wolfe, 2010) ..................................... 57
Figure 4.6: Block diagram of Fermi-class GPUs (Wolfe, 2010) .................................... 57

ix
Figure 4.7: Streaming Multiprocessor of Tesla (left) and Fermi-class (right) GPUs
(Wilt, 2013) .................................................................................................................. 58
Figure 4.8: Example of a GPU-based program that multiplies a set of data by the
number 2 ...................................................................................................................... 59
Figure 4.9: Thread hierarchy in the CUDA programming model (Nvidia, 2014) ......... 60
Figure 5.1: Percentages of benign and malignant breast cancer cases in the collected
dataset. ........................................................................................................................ 66
Figure 5.2: From each case Digital Mammography and Ultrasound ROIs were
delineated. First row presents the ROIs from a benign case while the second row
presents a malignant case ........................................................................................... 68
Figure 5.3: Screenshot of the custom made software developed for the purposes of
this research. The software enabled the physician to browse for a case and delineate
the region of interest ................................................................................................... 69
Figure 5.4: The flow diagram of the procedure followed for creating the three
datasets ........................................................................................................................ 71
Figure 5.5: Block diagram describing the training of the proposed PR system, steps 1,
2, 4, 8 and 9 are sequentially executed on the CPU; steps 3, 5 and 7 refer to memory
transactions between CPU and GPU; and step 6 is executed in parallel on the GPU,
employing numerous threads. ..................................................................................... 76
Figure 5.6: The flow diagram of the PR-system design task. Left part illustrates the
sequentially executed task on CPU. Right part illustrates the same task as it has been
modified to run in parallel on GPU .............................................................................. 77
Figure 5.7: The task of each thread, running concurrently, was to train the PNN
classifier with a unique feature combination and evaluate its classification accuracy
by means of the leave-one-pattern-out technique. In every case the output of each
thread was the overall accuracy achieved for the specific feature combination. ...... 78

x
Figure 5.8: Pseudocode illustrating the PNN training in each CUDA thread t for a
single feature combination. ......................................................................................... 78
Figure 5.9: Pseudocode illustrating Host implementation not including the ECV
method ......................................................................................................................... 80
Figure 5.10: The kernel used to design the proposed GPU-based PR system ............ 83
Figure 6.1: Overall accuracies achieved by the two sub-optimal and one optimal
features-selection methods, and the LOO evaluation method using the three
datasets (US, DM and US & DM combined) ................................................................ 89
Figure 6.2: Partial and overall accuracies achieved via the optimal feature selection
method and LOO, applied on GPU, using features from US images, features from DM
images, and combined features from US and DM images .......................................... 90
Figure 6.3: Quadratic LS-mappings of benign and malignant data, employed in the
optimal PNN design using (a) US, (b) DM, and (c) combined US and DM features .... 91
Figure 6.4: Box-plots of the six textural features that formed the best feature
combination in the optimal PNN design. The features’ values are not normalised.
(STD: Standard Deviation, SOQ: Sum of Squares, SAV: Sum Average, SRE: Short Run
Emphasis, DENTR: Difference Entropy, where a: average, r: range, _DM: features
from DM images and _US: feature from US images. ................................................... 92
Figure 6.5: Comparative evaluation of processing times for 2 different NVidia GPU
cards (GeForce 8800GT and 580GTX) and standard CPU system (Intel Core 2 Quad).
Times refer to the processors (GPUs or CPU) executing the same task, by forming all
possible combinations of 6 features within a pool of 20, 30,..,or 80 features ........... 96
Figure 6.6: Comparative assessment of CPU (single and multi-core) and GPUs
(8800GT and 580GTX) against the number of patterns in the dataset, for the task of
classifier training with up to 20 feature combinations from a pool of 20 features .... 97
xi
Figure 7.1: (a): An example of a high grade pleomorphic glioblastoma multiforme
tumour, (b): Segmentation of Figure1a for isolation of nuclei from surrounding tissue
................................................................................................................................... 106
Figure 7.2:Custom-made software tool for extracting lesions .................................. 108
Figure 7.3: Flow diagram of parallel processing performed on the graphics processing
unit ............................................................................................................................. 109
Figure 7.4: Snapshots of the three PD-FSE FS MRI planes. In these planes and in their
corresponding slices, the following ROIs were extracted: from the axial planes: (a)
patella and (b) femoral trochlea, from the coronal planes; (c) lateral and medial of
femoral and tibial condyles, from the sagittal planes: (d) patella and femoral
trochlea, and (e) lateral and medial of the MFC and MTC cartilages ........................ 110

xii
List of Tables
Table 2.1: Representative lesions of benign cases employing DM and US ................. 16
Table 2.2: Representative lesions of malignant cases employing DM and US............ 17
Table 5.1: A summary of the verified breast cancer cases comprising the collected
dataset. ........................................................................................................................ 66
Table 5.2: List of textural features employed in the current study along with their
abbreviations for DM and US ...................................................................................... 70
Table 5.3: The list of candidate classifiers with their respective accuracy ................. 73
Table 5.4: Specifications of the GPUs employed in this research ............................... 81
Table 6.1: Classification accuracy results for discriminating between benign and
malignant lesions from ultrasound images, using the PNN classifier, two sub-optimal
and one optimal features-selection methods, and the LOO evaluation method ....... 86
Table 6.2: Classification accuracy results for discriminating between benign and
malignant lesions from DM images, using the PNN classifier, two sub-optimal and
one optimal features-selection methods, and the LOO evaluation method .............. 87
Table 6.3: Classification accuracy results for discriminating between benign and
malignant lesions using combined features from ultrasound (US) and digital
mammography (DM) images, and employing the PNN classifier, two sub-optimal and
one optimal features-selection methods, and the LOO evaluation method .............. 88
Table 6.4: Truth table of GPU results using PNN, exhaustive search, and LOO for
features from US images, features from DM images, and combined features from US
and DM images ............................................................................................................ 89
Table 6.5: Classification accuracies in discriminating benign from malignant lesions,
achieved by employing the ECV method on GPU, and by designing the PNN classifier
by combined features from ultrasound and digital mammography features............. 93

xiii
Table 6.6: ECV Wilcoxon-rank-features Classification accuracies in discriminating
benign from malignant lesions, achieved by employing the ECV method on GPU, and
by designing the PNN classifier by combined features from US and DM features ..... 94
Table 6.7: ECV SBS Classification accuracies in discriminating benign from malignant
lesions, achieved by employing the ECV method on GPU, and by designing the PNN
classifier by combined features from US and mammography features ...................... 94
Table 6.8: Comparative performance assessment varying the total number of
features in the dataset (all time measurements have been averaged over 10 runs) . 95

xiv
Abbreviations
Abbreviation Description
API Application Programming Interface
BC Breast Cancer
BI-RADS Breast Imaging Reporting and Data System
CAD Computer-Aided Diagnosis
CPU Central Processing Unit
CUDA Compute Unified Device Architecture
CV Cross validation
DCIS Ductal Carcinoma In Situ
DICOM Digital Imaging and Communications in Medicine
DM Digital Mammography
DMA Direct Memory Access
DSS Decision Support System
ECV External Cross Validation
FLOPS FLoating-point Operations Per Second
GLCM Grey Level Co-occurrence Matrix
GPGPU General Purpose Computation on Graphics Processing Units
GPU Graphics Processing Unit
IDC Invasive (or infiltrating) Ductal Carcinoma
IDE Integrated Development Environment
JAI Java Advanced Imaging
k-NN k-Nearest Neighbour

xv
LCIS Lobular Carcinoma In Situ
LDA Linear Discriminant Analysis
LOO Leave One Out
LSO Leave Some Out
MFC Medial Femoral Condyles
mIS micro-ischemic
MPI Message Passing Interface
MRI Magnetic Resonance Imaging
MS Multiple Sclerosis
MTC Medial Tibial Condyles
OOP Object Oriented Programming
PNN Probabilistic Neural Network
PR Pattern Recognition
QLS Quadratic Least Squares
RBF Radial Basis Function
ROC Receiver Operating Characteristic
ROI Region Of Interest
SBFS Sequential Backward Floating Selection
SBS Sequential Backward Selection
SFFS Sequential Forward Floating Selection
SFS Sequential Forward Selection
SFU Special Function Unit
SIMT Single Instruction, Multiple Thread
SM Streaming Multiprocessor

xvi
SP Stream Processor
SVM Support Vector Machines
TIFF Tagged Image File Format
US Ultrasound
WHO World Health Organisation

xvii
Acknowledgements
I would like to thank my professors and colleagues and to express my deep gratitude.
First, I would like to express my deepest appreciation to my supervisor, Professor
John Stonham, for his encouragement and advice he has provided throughout my
time as his student. I would also like to express my gratitude to Professor Dionisis
Cavouras for his support and guidance during the course of my studies.
I would also like to thank Dr. Dimitris Glotsos, Dr. Spyros. Kostopoulos, and Dr.
Ioannis Kalatzis, for the scientific support they provided by reviewing journal and
conference papers, that came as offspring of this study, and by influencing my
thinking in approaching scientific writing.
Special acknowledgement must be reserved for Radiologist M.D. Nikos
Dimitropoulos, for his collaboration in collecting medical data and for helping me
understand the clinical problem at hand.
Finally, I would like to thank my parents and close friends for their support
throughout this endeavour.

xviii
Publications
This is the complete list of conference and journal publications derived from the
work performed for the purposes of this thesis.
• Sidiropoulos, K., Glotsos, D., Kostopoulos, S., Ravazoula, P., Kalatzis, I.,
Cavouras, D., Stonham, J. “Real time decision support system for diagnosis of
rare cancers, trained in parallel, on a graphics processing unit”, (2012),
Computers in Biology and Medicine, 42 (4), pp. 376-386, ISSN: 00104825.
• Sidiropoulos, K.P., Kostopoulos, S.A., Glotsos, D.T., Athanasiadis, E.I.,
Dimitropoulos, N.D., Stonham, J.T., Cavouras, D.A. “Multimodality GPU-based
computer-assisted diagnosis of breast cancer using ultrasound and digital
mammography images”, (2013), International Journal of Computer Assisted
Radiology and Surgery, 8 (4), pp. 547-560, ISSN: 18616410.
• Solomou, E., Kostopoulos, S., Sidiropoulos, K., Athanasiadis, E., Lavdas, E.,
Glotsos, D., Sakellaropoulos, G., Zampakis, P., Stonham, J., Cavouras, D.
“Designing a pattern recognition system on GPU for discriminating between
patients with micro-ischaemic and multiple sclerosis lesions, using MRI
images”, (2013), International Journal of High Performance Computing
Applications, 27 (3), pp. 348-359, ISSN: 10943420.
• Kostopoulos, S., Sidiropoulos, K., Glotsos, D., Athanasiadis, E., Boutsikou, K.,
Lavdas, E., Oikonomou, G., Fezoulidis, I.V., Vlychou, M., Hantes, M., Cavouras,
D. “Pattern-recognition system, designed on GPU, for discriminating between
injured normal and pathological knee cartilage”, (2013), Magnetic Resonance
Imaging, 31 (5), pp. 761-770, ISSN: 0730725X.

xix
• Ninos, K., Kostopoulos, S., Sidiropoulos, K., Kalatzis, I., Glotsos, D.,
Athanasiadis, E., Ravazoula, P., Panayiotakis, G., Economou, G., Cavouras, D.
“Computer-based image analysis system designed to differentiate between
low-grade and high-grade laryngeal cancer cases”, (2013), Analytical and
Quantitative Cytology and Histology, 35 (5), pp. 261-272, ISSN: 08846812.
Proceedings in international conferences:
• Sidiropoulos K., Cavouras D., Pagonis N., Dimitropoulos N., Stonham J.,
“Accelerating the Design of Probabilistic Neural Networks for Computer Aided
Diagnosis on Mammography, Employing Graphics Processing Units”, 3rd
International Conference on Experiments/Process/System
Modelling/Simulation/Optimisation (EpsMsO), Athens, Greece, July 2009.
• Pagonis N., Cavouras D., Sidiropoulos K., Sakelaropoulos G., Nikiforidis G.,
“Improving The Classification Accuracy of Computer Aided Diagnosis through
Multimodality Breast Imaging”, 3rd International Conference on
Experiments/Process/System Modelling/Simulation/Optimisation (EpsMsO),
Athens, Greece, July 2009.

xx
Abstract
The aim of this research was to address the computational complexity in designing
multimodality Computer-Aided Diagnosis (CAD) systems for characterising breast
lesions, by harnessing the general purpose computational potential of consumer-
level Graphics Processing Units (GPUs) through parallel programming methods. The
complexity in designing such systems lies on the increased dimensionality of the
problem, due to the multiple imaging modalities involved, on the inherent
complexity of optimal design methods for securing high precision, and on assessing
the performance of the design prior to deployment in a clinical environment,
employing unbiased system evaluation methods.
For the purposes of this research, a Pattern Recognition (PR)-system was designed to
provide highest possible precision by programming in parallel the multiprocessors of
the NVIDIA’s GPU-cards, GeForce 8800GT or 580GTX, and using the CUDA
programming framework and C++. The PR-system was built around the Probabilistic
Neural Network classifier and its performance was evaluated by a re-substitution
method, for estimating the system’s highest accuracy, and by the external cross
validation method, for assessing the PR-system’s unbiased accuracy to new,
“unseen” by the system, data. Data comprised images of patients with histologically
verified (benign or malignant) breast lesions, who underwent both ultrasound (US)
and digital mammography (DM). Lesions were outlined on the images by an
experienced radiologist, and textural features were calculated.
Regarding breast lesion classification, the accuracies for discriminating malignant
from benign lesions were, 85.5% using US-features alone, 82.3% employing DM-
features alone, and 93.5% combining US and DM features. Mean accuracy to new
“unseen” data for the combined US and DM features was 81%. Those classification
accuracies were about 10% higher than accuracies achieved on a single CPU, using
sequential programming methods, and 150-fold faster. In addition, benign lesions
were found smoother, more homogeneous, and containing larger structures.

xxi
Additionally, the PR-system design was adapted for tackling other medical problems,
as a proof of its generalisation. These included classification of rare brain tumours,
(achieving 78.6% for overall accuracy (OA) and 73.8% for estimated generalisation
accuracy (GA), and accelerating system design 267 times), discrimination of patients
with micro-ischemic and multiple sclerosis lesions (90.2% OA and 80% GA with 32-
fold design acceleration), classification of normal and pathological knee cartilages
(93.2% OA and 89% GA with 257-fold design acceleration), and separation of low
from high grade laryngeal cancer cases (93.2% OA and 89% GA, with 130-fold design
acceleration).
The proposed PR-system improves breast-lesion discrimination accuracy, it may be
redesigned on site when new verified data are incorporated in its depository, and it
may serve as a second opinion tool in a clinical environment.

Parallel GPU Architectures for Multimodality Breast Lesions Characterisation K. Sidiropoulos
Chapter 1
Chapter 1. Introduction and motivation
1.1 Overview
This research harnesses the general purpose computational potential of
consumer-level Graphics Processing Units (GPUs) aiming to address the
computational complexity in designing multimodality Computer-Aided
Diagnosis (CAD) systems, for breast lesions characterisation, by employing
optimal classifier training and unbiased system evaluation methods. The
following chapter provides an introduction to the research performed, by first
defining the problem it addresses and by describing its motivation and
rationale. Additionally, the research aims and contribution are clearly
identified, while, at the end of the chapter, the structure and organisation of
this thesis are outlined.

Chapter 1: Introduction & motivation 2
Parallel GPU Architectures for Multimodality Breast Lesions Characterisation K. Sidiropoulos
1.2 Aims and Rationale
Breast cancer is the most common malignancy among women, both in the developed
and developing countries (Laine et al., 1996; WHO, 2013). Although death rates have
been decreasing because of early detection, the global death burden of breast
cancer is estimated to 508,000 women in 2011 alone (WHO, 2013). Early detection of
breast cancer is considered of paramount importance as it significantly increases the
chances for successful treatment. This is mainly due to the fact that breast
malignancies, detected during their early stages, are more likely to be smaller in size
and still confined to the breast, while malignancies detected at more advanced
stages, because they are causing symptoms, tend to be larger and are more likely to
have metastasized, rendering treatment less likely to succeed (Hayes, 2007; Tabar
and Dean, 2008).
In addition to self-examination, medical imaging constitutes an important asset
assisting in the early diagnosis of breast cancer. A number of imaging modalities,
including Digital Mammography (DM), Ultrasound breast examination (US), and
Magnetic Resonance Imaging (MRI), has been employed in breast cancer detection
(Tang et al., 2009). Although DM plays a crucial role in early breast cancer detection,
it has been claimed that over 20% of breast lesions are missed (Humphrey et al.,
2002; Majid et al., 2003) while an accountable number of biopsies is still performed
on benign lesions (Bird et al., 1992; Beam et al., 1996; Harms, 1999; Evers, 2001).
DM’s fundamental limitation is that non-calcified breast cancers are often obscured
by surrounding and overlying dense parenchyma (Berg et al., 2008).
Consequently, alternative medical imaging modalities such as US and MRI are
employed in a complementary manner, especially since they involve non-ionizing
radiation and they do not burden the patient with radiation dose. Moreover,
according to (Sardanelli et al., 2007; Lee et al., 2009; Grunberg and Domingo, 2011;
Houssami and Ciatto, 2011) the combination of information from different imaging
modalities may increase the radiologists’ diagnostic accuracy in breast cancer.
Special interest, as complementary to DM, has been placed on US breast

Chapter 1: Introduction & motivation 3
Parallel GPU Architectures for Multimodality Breast Lesions Characterisation K. Sidiropoulos
examination, since it is of low cost and it has been additionally shown to be of value
as an adjunct method to DM examination due to the fact that it has the potential to
depict early, node-negative breast cancers, not seen on DM, and its performance is
improving in dense parenchyma (Laine et al., 1996; Berg et al., 2008).
Recently, computer-aided diagnosis (CAD) has been embedded in the daily clinical
routine as several studies (Freer and Ulissey, 2001; Gur et al., 2004; Birdwell et al.,
2005; Cupples et al., 2005; Dean and Ilvento, 2006; Morton et al., 2006) suggest that
utilisation of CAD systems seems to increase the detection rates of breast cancer
(Doi, 2007). In addition, a few studies have employed computer aided analysis for
combining information from different imaging modalities as an aid to the
discrimination between malignant and benign breast lesions. It has been shown that
the diagnostic precision of CAD systems has increased by combining image
information from different breast imaging modalities, as compared to using
information from individual modalities. Yuan Y et al (Yuan et al., 2010) have shown
the value of multimodality computer aided cancer diagnosis by combining lesion
features from full field digital mammography and contrast enhanced MRI to
discriminate between benign and malignant breast lesions; classification accuracy
increased when features from both modalities were combined as compared to
single-modality accuracies. Karen Drukker et al (Drukker et al., 2005) have developed
a computer-based system by combining features from mammography and
ultrasound to improve system classification precision in discriminating between
benign and malignant lesions. In another study by Berkman Sahiner et al (Sahiner et
al., 2009), a system was designed that combined data acquired from 3D US and X-ray
mammography as an aid to the radiologists’ performance in discriminating malignant
from benign masses. Horsch K et al (Horsch et al., 2006) proved the value of
multimodality computer aided diagnosis systems in improving the radiologist’s
diagnostic accuracy in the task of differentiating between malignant and benign
breast lesions using mammography and sonography.

Chapter 1: Introduction & motivation 4
Parallel GPU Architectures for Multimodality Breast Lesions Characterisation K. Sidiropoulos
Nevertheless, in those studies, the design of CAD systems was based solely on the
processing power of CPUs. It must be noted that one of the challenges encountered
during the design of a CAD system is the time required to optimally train the pattern
recognition system which typically lies in its core. Hence, designing of a classification
scheme on a normal computer may take hours, or even days, while, once designed,
the characterisation of a case takes infinitesimal time. Accordingly, in all the
aforementioned studies, the design of multimodality CAD systems was far more
challenging. The main problem was that they had to deal with increased image
information, since more than one modality was involved. As a result, some had to
employ sub-optimal system design methods for achieving manageable processing
times for CAD design, thus resorting to feature reduction methods prior to training
the classifiers by evaluation biased methods, such as the leave-one-out method
(LOO) (Theodoridis and Koutroumbas, 2003). Consequently, these compromises in
the CAD systems’ design may have provided biased estimates of the classifier’s
performance. Accordingly, one of the solutions that have been proposed in tackling
the CPU’s processing power limitations is by employing parallel processing methods,
typically involving powerful supercomputers or computer clusters. Unfortunately,
this kind of hardware is prohibitively expensive and therefore accessible only to few
people. However, a new promising development in this regard is the emergence of
consumer-level Graphics Processing Units (GPUs) as a mainstream computing
platform (Xu and Mueller, 2007).
Over the past few years, GPUs have evolved from the traditional fixed-function 3D
graphics pipelines used as image-synthesis devices, into powerful, programmable,
highly parallel computing devices, becoming an increasingly popular tool in many
research fields including image analysis. This dramatic shift was the inevitable
consequence of consumer demand for videogames, advances in manufacturing
technology, and the exploitation of the inherent parallelism in the graphics pipeline
(Luebke and Humphreys, 2007).

Chapter 1: Introduction & motivation 5
Parallel GPU Architectures for Multimodality Breast Lesions Characterisation K. Sidiropoulos
Today, graphics processing units constitute a low-cost, low-power (watts per flop)
very high performance alternative to conventional microprocessors. For example,
back in 2006, a GeForce 8800 GTX with a theoretical peak 520 GFLOPs (1 GFLOP
equals 1 billion floating point operations per second), and dissipating 150 watts, cost
about $500. This was an order of magnitude faster than ordinary CPUs. In a more up-
to-date comparison, a GeForce 580 GTX with the same release price had a
theoretical peak performance of 1,581 GFLOPS. This cannot compare to the 96
GFLOPS of Intel’s Xeon Westmere X5670 CPU that cost about $800.
Nevertheless, the use of GPUs for general purpose computations in various scientific
fields did not begin to gain momentum until the introduction of specialised
programming frameworks, such as Stanford University’s BrookGPU language (Buck et
al., 2003), ΝVidia’s Compute Unified Device Architecture (CUDA) (Nvidia, 2014),
Microsoft’s AP (Microsoft, 2006), and University of Waterloo’s Sh Embedded
Metaprogramming language (McCool et al., 2002), which provided an easy way to
harvest the GPU’s tremendous parallel computation potential.
Previous studies have employed similar measures to tackle processing time
demanding image processing procedures, such as implementations of neural
networks (Oh and Jung, 2004), Support Vector Machines (Ohmer et al., 2005), K-
Nearest Neighbour (Beliakov and Li, 2012), tomographic reconstruction algorithms
(Xu and Mueller, 2007; Pang et al., 2011), image registration methods (Lapeer et al.,
2010; Shams et al., 2010), and dose simulation (Santhanam et al., 2012)
The aim of this research is to harness the general purpose computational potential of
consumer level GPUs, in order to address the challenging problem of designing
multimodality CAD systems for breast lesions characterisation by optimal classifier
training and unbiased system evaluation methods.
Thus, the objectives of this thesis are:
i) to utilise parallel processing software methods and multicore GPU
architectures with purpose to accelerate the training of CAD systems,

Chapter 1: Introduction & motivation 6
Parallel GPU Architectures for Multimodality Breast Lesions Characterisation K. Sidiropoulos
ii) to combine multimodality imaging information in CAD systems, and
iii) to implement and evaluate a low cost and optimum design GPU-based
CAD system that will increase the precision of characterising breast
lesions employing ultrasound and digital mammography images.
1.3 Contribution
The contribution of this thesis is in the design of high precision CAD systems. In
particular, by transferring computer processing on the powerful processors of the
GPU and by employing parallel processing programming techniques it has been made
possible:
i. to employ optimal classifier design methods, by searching exhaustively for
best feature combinations in a large feature space, augmented by the
contribution of two imaging modalities (Sidiropoulos et al., 2012; Sidiropoulos
et al., 2013).
ii. to optimise the classifier parameters for best performance, since retraining of
the classifier was possible due to significant reductions in processing times
(Solomou et al., 2012).
iii. to estimate the true error rate of the system to unknown data, by means of
the 10-fold external cross validation (ECV) method, which is computationally
demanding, since it requires the retraining of the system a multiple of times.
This provides a reliable assessment as to how such systems, once designed,
would perform in a clinical environment when presented with new “unseen”
by the system data (Kostopoulos et al., 2013; Ninos et al., 2013; Sidiropoulos
et al., 2013).
iv. to propose a CAD system that can be adapted on site, when additional
imaging data are made available, which is also a computationally challenging
procedure (Sidiropoulos et al., 2012).

Chapter 1: Introduction & motivation 7
Parallel GPU Architectures for Multimodality Breast Lesions Characterisation K. Sidiropoulos
Although, GPU technology has been previously employed in studies on image
processing and analysis (Xu and Mueller, 2007; Ruiz et al., 2009; Dai et al., 2010;
Lapeer et al., 2010; Shams et al., 2010), however, there appears to be no previous
studies that employ GPU technology to deal with the problem of optimally designing
stand-alone evolving CAD systems. Such use of technology may offer engineers the
platform for building systems with the ability to incorporate new verified data to
their depository and remodel themselves on location.
1.4 Thesis Outline
This manuscript is organised into eight chapters. Chapter 2 focuses on the clinical
problem of breast cancer. In particular, this chapter presents the fundamentals of
breast anatomy and physiology and provides information regarding the epidemiology
and the taxonomy of breast cancer. In addition, chapter 2 describes the main
imaging modalities employed for the diagnosis of the disease.
Chapter 3 provides an introduction into the basic concepts and methods of statistical
pattern recognition. Key ideas and the basic algorithms of all stages of pattern
recognition, including feature extraction and reduction techniques, methods for
classification and feature selection, along with evaluation approaches, are discussed.
The use of GPUs as parallel processing hardware accelerators is the topic of chapter
4. Hence, this chapter begins with the history and evolution of GPUs over the last 2
decades. Architectural differences between CPUs and GPUs are identified and the
main reasons behind the ever growing popularity of GPU-accelerated computing and
its limitations are analysed. This chapter also includes a description of the CUDA
programming model, thus providing a theoretical foundation for the subsequent
chapter.
Chapter 5 describes in detail and in a systematic way the steps followed throughout
the whole CAD design procedure such as protocols followed and software designed

Chapter 1: Introduction & motivation 8
Parallel GPU Architectures for Multimodality Breast Lesions Characterisation K. Sidiropoulos
for multimodality data collection, methods of feature generation and reduction,
classifiers designed and tested for execution on GPU and in parallel using the CUDA
framework, and evaluation methods employed for assessing system precision and
acceleration of system design.
In chapter 6 results are presented regarding the achieved precision and design
acceleration introduced by the employment of GPUs. Furthermore, the textural
features involved in the selected feature combination are analysed as to the
information they convey and their significance in medical diagnosis of breast cancer.
Chapter 7 presents the employment of the designed GPU-based CAD system to
tackle other medical problems. These included classification of rare brain tumours,
discrimination of patients with micro-ischemic and multiple sclerosis lesions,
classification of normal and pathological knee cartilages, and separation of low from
high grade laryngeal cancer cases.
Finally, chapter 8 summarises the findings of the present thesis, draws conclusions
and indicates directions for future research.
1.5 Research Funding
The current thesis was funded by the Greek State Scholarship Foundation (I.K.Y.). The
support of NVIDIA Corporation with the donation of GPU hardware, used for the
purposes of this research, is also gratefully acknowledged.

Parallel GPU Architectures for Multimodality Breast Lesions Characterisation K. Sidiropoulos
Chapter 2
Chapter 2. Breast Cancer
2.1 Overview
This chapter focuses on the clinical problem of breast cancer. In particular,
the fundamentals of breast anatomy and physiology are presented and
information regarding the epidemiology and the taxonomy of breast cancer
is provided. In addition, the main imaging modalities employed for the
diagnosis of the disease are described, along with their advantages and
limitations.

Chapter 2: Breast Cancer 10
Parallel GPU Architectures for Multimodality Breast Lesions Characterisation K. Sidiropoulos
2.2 Breast Anatomy and Physiology
The breast constitutes one of the distinctive features of all mammals, and its
biological role is the production and delivery of milk to nourish a newborn. In
humans, the breast is a mound of tissue overlying the pectoralis major and is
common in both sexes. Although both males and females develop breasts from the
same embryological tissues, women's breasts become far more prominent than
those of men, mainly due to female sex hormones that promote breast development
(e.g. estrogen). This disparity in size is one of the key differentiation points between
male and female anatomy.
The female breast consists of fibro-glandular and fatty tissue, in ratios that vary
depending on the age and the genetic characteristics of the individual. In younger
age, the female breast consists predominantly of fibro-glandular tissue, as fatty
tissue is limited. In middle aged women, fibro-glandular and fatty tissues within the
breast typically reach an equilibrium resulting in a 1:1 ratio, while in older ages and
after menopause fibro-glandular tissue is gradually replaced by fatty tissue.
Each breast contains one mammary gland, which develops during pregnancy,
remains active during lactation, and atrophies when a woman ceases to nurse. From
a developmental perspective, mammary glands are modified sweat glands. The
areola is the ring of pigmented skin located slightly below the centre of each breast,
and surrounds a central protruding nipple. The latter can become erect when
stimulated by tactile or sexual stimuli, or cold temperatures thanks to smooth muscle
fibres controlled by the autonomic nervous system.
Inside the breast, each mammary gland comprises 15 to 25 lobes arranged radially
around the nipple. Fibrous connective tissue and fat lie between the lobes, while
suspensory ligaments, formed by this inter-lobar connective tissue, provide natural
support for the breasts.

Ch
Pa
Fig(20
As
Th
M
Ev
sin
wo
sy
de
2.
Br
an
Inc
dia
co
hapter 2: Breas
rallel GPU Arc
gure 2.1: A gra013)
s illustrated
hese lobules
ilk passes t
very lactifer
nus, which
omen, the
stem is rud
eposits (Mar
3 Breast
reast cancer
nd occurs w
cidence rat
agnosed wi
onstant red
st Cancer
chitectures for
aphical illustra
in Figure 2
s contain gla
through the
rous duct ha
is used to a
glandular s
imentary. F
rtini et al., 2
Cancer Ep
r (BC) const
when cells in
tes, vary gre
th BC durin
duced tend
r Multimodalit
ation of the fe
2.1, inside e
andular alve
e lactiferous
as a dilated
accumulate
structure of
For this reas
2011; Marie
idemiology
titutes the
n the breas
eatly world
ng their lifet
dency, BC
ty Breast Lesio
emale breast a
each lobe, t
eoli, which i
s ducts, whi
d region righ
the milk. It
f the breast
son, breast s
eb and Hoeh
y
most frequ
st divide an
dwide, but s
time (SEER,
constitutes
ons Character
anatomy. Repr
there are s
in turn, pro
ich open to
ht under th
t must be n
t is largely
size is large
hn, 2013).
ent maligna
nd grow wit
suggest tha
2011). Alth
s the seco
isation
roduced from
maller units
duce milk, d
o the outsid
he areola, c
noted that i
undevelope
ly due to th
ant tumour
thout their
at 12.3% of
hough mort
nd cause
K. Sidirop
Marieb and H
s called lob
during lacta
de at the ni
alled lactife
in non-preg
ed and the
he amount o
r among wo
normal con
women w
tality, prese
of death
11
poulos
Hoehn
bules.
ation.
pple.
erous
gnant
duct
of fat
omen
ntrol.
ill be
nts a
from

Chapter 2: Breast Cancer 12
Parallel GPU Architectures for Multimodality Breast Lesions Characterisation K. Sidiropoulos
malignancies after pulmonary cancer in the USA and is still the first cause of death
from malignancies among females between 20 and 59 years old. In UK alone, 49,936
women were diagnosed with invasive BC in 2011 (Clamp et al., 2003; GLOBOCAN,
2008; Jemal et al., 2008)
There are several types of BC. Ductal Carcinoma In Situ (DCIS) is considered non-
invasive BC. In cases of DCIS the cells have not spread through the walls of the ducts
into the surrounding breast tissue. However some DCIS cases can become invasive
cancers. Lobular Carcinoma In Situ (LCIS) is not considered a true BC, despite its
misleading name. LCIS indicate areas of abnormal cell growth within the breast
tissue. This is an indication of high risk for developing BC in the future.
Invasive (or infiltrating) ductal carcinoma (IDC) is the most common type of BC,
accounting for 75-80% of BC cases. IDC originally forms in milk ducts and infiltrates
the fatty tissue of the breast through the duct walls. Then, using the lymphatic
system and bloodstream IDC is able to metastasize to other parts of the body.
Another invasive type of BC is the Invasive Lobular Carcinoma (ILC). Similar to IDC, ILC
can metastasize to other parts of the body, but originally develops in the lobules of
the breast.
2.4 Imaging Modalities for detection of Breast Cancer
As mentioned in the previous chapter, in addition to self-examination, medical
imaging modalities such as Digital Mammography (DM), Ultrasound breast
examination (US), and Magnetic Resonance Imaging (MRI), have been employed in
the early diagnosis of BC (Tang et al., 2009).
2.4.1 Digital Mammography
DM (see Figure 2.2) is one of the most recent advances in x-ray mammography.
Although it uses doses of ionizing radiation to create images, exactly like standard

Ch
Pa
m
th
ch
les
su
un
ca
pa
m
BC
2.4
In
se
tra
hapter 2: Breas
rallel GPU Arc
ammograph
e traditiona
hoice for th
sions are m
urrounding
nder the ag
ncers, ofte
articularly in
any cases,
Cs that may
4.2 Ultras
breast US
ent via a sm
avel throug
st Cancer
chitectures for
hy, DM util
al x-ray film
he early dia
issed, as DM
and overly
ge of 50 (H
en manifest
n cases of d
US and MR
not be visib
sound
examinatio
mall handhe
h the breas
r Multimodalit
lises specia
m to form b
agnosis of b
M fails to de
ying dense
Humphrey e
ted as non
dense surro
RI can be em
ble with DM
Figure
ons, ultraso
eld probe to
st, they bou
ty Breast Lesio
lised digita
breast imag
breast carci
etect non-ca
parenchym
et al., 2002;
n-calcified m
ounding tiss
mployed in
M.
2.2: A typical
nic sound w
o move thr
unce off the
ons Character
l detectors
ges. DM is
inomas. Eve
alcified BCs
ma, commo
; Majid et
masses, can
sue (Berg e
a complem
DM image
waves at a
ough the s
e tissues an
isation
and compu
considered
en so, over
that are oft
only found
al., 2003).
nnot be de
et al., 2008)
mentary man
frequency
kin. As thes
nd return to
K. Sidirop
uters instea
the metho
r 20% of b
ten obscure
among wo
Hence, inv
etected by
). As a resu
nner and de
of 8-16MHz
se sound w
o the probe
13
poulos
ad of
od of
reast
ed by
omen
asive
DM,
ult, in
etect
z are
waves
e just

Ch
Pa
lik
a
ha
US
th
th
co
inv
20
no
Ho
br
th
th
ide
un
re
hapter 2: Breas
rallel GPU Arc
ke an echo. T
detailed im
as been plac
S breast exa
an other im
us, it does
ontrast to D
vasive met
000). Theref
ot seen on m
owever, ma
reast cancer
eir early sta
at the use
entifying a
nnecessary
place DM (B
st Cancer
chitectures for
The timing
age of the
ced on US b
amination is
maging meth
not pose a
DM, US prov
hod to det
fore, US has
mammograp
ny cancers
rs that pres
ages, as the
e of US can
potential ar
and painful
Berg et al., 2
r Multimodalit
and intensit
breasts (se
reast exami
s painless fo
hods. In add
any health
vides a clea
termine wh
s the poten
phy, and its
Figure
cannot be d
ent calcifica
ey are not v
n increase
rea of conce
procedure
2008).
ty Breast Lesio
ty of these
e Figure 2.3
ination.
or the patien
dition, US do
danger, all
ar picture of
hether a br
tial to depi
performan
2.3: A typical
detected via
ations, i.e. s
visible to US
the numbe
ern as malig
s, such as b
ons Character
reflected w
3). Due to it
nt, widely av
oes not use
lowing preg
f dense tiss
reast mass
ct early, no
ce is improv
US image
a US exami
small areas
S. Furtherm
er of false-
gnant, and
biopsies. Fo
isation
waves are th
ts benefits,
vailable, an
e any ionizin
gnant wom
sues and it
is cystic or
ode-negative
ving in dens
nation. The
of calcium
ore, studies
-positives,
consequent
r these rea
K. Sidirop
en used to
special inte
d less expen
ng radiation
en to use
is the only
r solid (Kos
e breast can
se breasts.
se cases inc
in the breas
s have indic
i.e. erroneo
tly lead to m
sons, US ca
14
poulos
form
erest
nsive
and,
it. In
non-
ssoff,
ncers
clude
st, at
cated
ously
more
annot

Chapter 2: Breast Cancer 15
Parallel GPU Architectures for Multimodality Breast Lesions Characterisation K. Sidiropoulos
2.5 Digital Mammography characterisation of breast masses
DM findings that are commonly associated with benign cases include smooth walled
masses within the breast tissue, that feature a lucent center and the presence of
scattered (not clustered) microcalcifications. In contrast, finding suggesting
malignancy include masses with irregular borders and spiculated density.
Additionally, the presence of clustered microcalcifications, typically 5 or more
calcifications in 1 cm area, is also suggestive of malignancy and requires further
evaluation.
2.6 Ultrasound characterisation of breast masses
Sonographic characteristics commonly found in benign breast lesions have been
defined by several previous studies (Stavros et al., 1995; Stavros et al., 2004;
Mainiero et al., 2005; Gokhale, 2009)
In summary, benign breast lesions appear with hyperechoic or isoechoic texture,
smooth, well circumscribed, and gently lobulated shape with three or fewer
lobulations. In addition, benign breast lesions present an elliptical shape, appearing
wider that tall and feature a thin echogenic capsule.
On the other hand, hypoechoic breast lesions with ill-defined borders are
characteristics (indications) of malignancy. In particular, malignant breast lesions
commonly feature hypoechoic texture, spiculated margins with thick echogenic
shape, and taller than wide shape. Microlobulations and calcifications are also
indications of malignancy.
In Tables 2.1 and 2.2, representative lesions of benign and malignant cases used in
the present study, employing US and DM of the same patient, are presented.

Ch
Pa
hapter 2: Breas
rallel GPU Arc
T
Benign B
Aden
Fibro
Lipid
Li
Pa
st Cancer
chitectures for
Table 2.1: Rep
Breast Lesion
nolipoma
Cyst
oadenoma
d Oil Cyst
ipoma
pilloma
r Multimodalit
presentative le
ns Digita
ty Breast Lesio
esions of benig
al Mammog
ons Character
gn cases empl
graphy
isation
loying DM and
Ultraso
K. Sidirop
d US
ound
16
poulos

Ch
Pa
In
US
m
hapter 2: Breas
rallel GPU Arc
Ta
MalignLe
Ductal Ca
Infiltrated
InfiltraCar
InfiltraCar
Mucoid
the current
S images. T
odalities to
st Cancer
chitectures for
able 2.2: Repre
nant Breastesions
rcinoma In S
d Lymph Nod
ating Ductal rcinoma
ting Lobularrcinoma
d Carcinoma
t study, the
The propos
achieve hig
r Multimodalit
esentative les
t Digita
Situ
de
r
a
e focus was
sed CAD sy
gher precisio
ty Breast Lesio
ions of malign
al Mammog
on the text
ystem comb
on.
ons Character
nant cases em
graphy
ture of brea
bines textu
isation
ploying DM an
Ultras
ast lesions o
ral informa
K. Sidirop
nd US
ound
on both DM
ation from
17
poulos
M and
both

Chapter 2: Breast Cancer 18
Parallel GPU Architectures for Multimodality Breast Lesions Characterisation K. Sidiropoulos
2.7 Summary
Breast cancer constitutes the most frequent malignant tumour among women. There
are several types of BC. Digital Mammography (DM), and Ultrasound breast
examination (US), have been employed in the early diagnosis of BC. DM’s
fundamental limitation is that non-calcified breast cancers are often obscured in
dense breast tissues. Thus, special interest has been placed on US, since it is of low
cost and it has been shown to be of value as an adjunct method to DM examination
due to the fact that it has the potential to depict early, node-negative breast cancers,
not seen on DM, and its performance is improving in dense parenchyma.

Parallel GPU Architectures for Multimodality Breast Lesions Characterisation K. Sidiropoulos
Chapter 3
Chapter 3. Introduction to Statistical
Pattern Recognition
3.1 Overview
Recently, CAD has been embedded in the daily clinical routine as several
studies suggest that utilisation of such systems seems to increase the detection
rates of breast cancer. Typically, CAD systems are based on Pattern
Recognition (PR) methods and employ a classifier to characterise breast
lesions. This chapter provides an introduction into the basic concepts and
methods of statistical pattern recognition. Key ideas and the basic algorithms
of all stages of PR, including feature extraction and reduction techniques,
methods for classification and feature selection, along with evaluation
approaches, are discussed.

Chapter 3: Introduction to Statistical Pattern Recognition 20
Parallel GPU Architectures for Multimodality Breast Lesions Characterisation K. Sidiropoulos
3.2 Basic principles of pattern recognition
As stated in the previous chapter, although, screening mammographic examination is
currently the most effective tool for early detection of BC, the potential of diagnostic
errors still remains substantially high in routine conditions. Failure to predict
tumour’s behaviour due to misdiagnosis, might lead to inadequate therapy affecting
patient survival and to increased management costs. More specifically, in false-
positive cases, noncancerous lesions can be misinterpreted as a cancer, and patients
are needlessly subjected to biopsy, while in false-negative cases, cancers are missed
leading to delays in administering medical care, with adverse effects to patient
survival.
In order to enhance sensitivity of mammography, complimentary modalities such as
US and MRI are often recommended to achieve additional information. Recently,
CAD systems have been developed to assist radiologists in interpreting medical
images and in differentiating between benign and malignant tissues.
Decision support systems, relying on statistical pattern recognition, have been shown
as a promising solution in reducing diagnostic errors and in improving diagnostic
concordances in breast lesions’ characterisation. Thus they are of particular interest
in this thesis.
Pattern Recognition (PR) refers to the scientific discipline which aims to assign
objects to different categories, or classes (Theodoridis and Koutroumbas, 2003;
Kuncheva, 2004). Objects are often referenced by the term patterns and, depending
on the application, they can be images or signals or any type of measurements that
need to be classified. Patterns are described by characteristics called features. In
particular, a set of features is used to form a feature vector. Every single pattern can
be uniquely identified by its feature vector. The task of a classifier is to draw a
decision line and partition the feature space into regions that belong to each
category, or class. In order to perform this division, the classifier is based on a
criterion, known as the prediction rule, and to a set of patterns (training patterns)
Ch
Pa
wh
cla
it
co
Th
As
sta
FigTh
Pr
im
ex
ric
re
Fe
qu
pa
Fe
co
co
th
apter 3: Intro
rallel GPU Arc
hose true c
assifier train
under one o
orrect. Ther
hus, there a
s illustrated
ages:
gure 3.1: Theeodoridis and
re-processin
mage condi
xtracting a r
ch suspiciou
gions.
eature extr
uantitative n
atterns and
eature red
omputationa
onsidered m
e PR system
duction to Sta
chitectures for
class is kno
ning, enable
of the availa
e are cases
re methods
in Figure 3
e basic staged Koutroumba
ng-Segment
itioning (e.
region of int
us area (les
raction: Th
numerical v
describe ob
uction-sele
al complexit
most informa
m.
atistical Patter
r Multimodalit
own. Once
es the classi
able classes
s where pat
s for assessin
3.1, the bac
es involved is (2003)
tation: This
.g. image
terest (ROI)
sion) from t
he extracte
values, the s
bject attribu
ection: Fea
ty. Features
ative and ar
rn Recognition
ty Breast Lesio
completed
fier to take
s. However,
tterns are e
ng the perfo
ckbone of s
n the design
s stage conc
enhancem
). ROIs are f
the informa
ed ROIs ar
so called ‘fe
utes.
atures dim
s that provid
re, therefor
n
ons Character
d, this proc
as input a n
the classifie
erroneously
ormance of
uch a syste
n of a classif
cerns the a
ent) and
formed by s
ation-poor
re then d
eatures’, wh
ensionality
de highest d
re, selected
isation
ess, denote
new pattern
er’s ruling is
classified,
a designed
em comprise
fication syste
application
image seg
separating t
(surroundin
escribed in
hich charac
is reduce
discriminati
to be used
K. Sidirop
ed by the
n and categ
s not necess
or misclass
classifier.
es the follo
em. Adapted
of method
gmentation,
the informa
ng tissue) im
n the form
terise indiv
ed to bal
ion accuracy
in the desig
21
poulos
term
orise
sarily
ified.
owing
from
s for
, for
ation-
mage
m of
vidual
lance
y are
gn of

Chapter 3: Introduction to Statistical Pattern Recognition 22
Parallel GPU Architectures for Multimodality Breast Lesions Characterisation K. Sidiropoulos
Classification: This stage concerns the construction of a prediction rule, able to
optimally classify data into specific classes, based on most informative features
selected in the previous stage.
System Evaluation: Once the prediction rule is constructed, its
accuracy/performance is assessed in order to get an estimate of the probability of
correct classifications in both known and, most importantly, unknown objects. Each
of the aforementioned stages is illustrated in detail in the following paragraphs.
3.3 Segmentation
Generally referred to as the image partitioning into non-overlapping regions
segmentation is an unavoidable step for every medical image analysis problem. It is
considered a non-trivial problem and it is a subject of on-going research activity,
especially in medical imaging applications such as magnetic resonance imaging,
ultrasound, X-ray computed tomography, nuclear medicine, and microscopy imaging.
Many segmentation methods are readily available, especially in research software
tools such as Matlab, however, in our case segmentation was performed manually,
by the physician, using a software tool that was specially built for the purposes of
this research. The software tool is described in chapter 5. It provided us with a
secure level of confidence that lesion outlines would be delineated with accuracy by
the expert.
3.4 Feature extraction
In this stage the goal is to generate features, which quantify image properties from
delineated image ROIs. It has been long shown that texture of medical images can be
used to encode useful diagnostic information, suitable for distinguishing tissues into
clinical meaningful classes (e.g. benign from malignant).

Chapter 3: Introduction to Statistical Pattern Recognition 23
Parallel GPU Architectures for Multimodality Breast Lesions Characterisation K. Sidiropoulos
Image texture may be described as the spatial arrangement of pixels, which gives an
image a distinct pattern, such as coarse, smooth, granular. Similar descriptions are
also used by radiologists for diagnosis. A number of features have been proposed in
previous studies (Haralick et al., 1973; Galloway, 1975; Gose et al., 1996; Gonzalez
and Woods, 2002; Theodoridis and Koutroumbas, 2003) that quantify the image
texture of segmented ROIs. Other features have also been proposed in literature,
such as those regarding the morphology or shape of the lesions (Mavroforakis et al.,
2005).
The basic theory of textural measures, employed for the purposes of the present
thesis, is given below.
3.4.1 Histogram features
The histogram of an image shows the distribution of all image pixels according to
their intensity value. Its shape provides information about the pixel content of the
image. Based on first order statistics, that do not consider neighbour pixel
relationships, informative features extracted from image histogram are (Theodoridis
and Koutroumbas, 2003):
Mean value (MV) ( , )
i jI i j
MVN
=
(3.1)
where ( , ) is the pixel intensity in position ( , )and the total number of pixels. It
gives the average intensity of the ROI.
Standard deviation (SD) [ ]2( , )i j
I i j MVSD
N
-=
å å (3.2)

Ch
Pa
Th
m
Fig
Sk
As
th
int
apter 3: Intro
rallel GPU Arc
he standard
ean value. I
gure 3.2: Exam
kewness (SK
s illustrated
e mean va
tensity) pixe
duction to Sta
chitectures for
d deviation
t is a measu
mples illustrati
KEW)
in Figure 3
lue. Positiv
el values.
atistical Patter
r Multimodalit
describes t
ure of variat
ng how Skew
S
3.2, skewne
ve skewness
rn Recognition
ty Breast Lesio
the variatio
tion in pixel
ness and Kurt
1SKEW
N=
ess describe
s indicates
n
ons Character
on of the im
intensity.
osis are indica
[i j
I
N S
å å
es the distr
predomina
isation
mage grey
ative of the his
3
( , )I i j MV
SD
-
ribution asy
ance of dar
K. Sidirop
levels from
stogram’s sha
]3V (
ymmetry aro
ker (than m
24
poulos
m the
ape
3.3)
ound
mean

Ch
Pa
Ku
Ku
co
pix
3.4
Th
et(gr
Th
re
Fig
Af
ev
by
al.
apter 3: Intro
rallel GPU Arc
urtosis (KUR
urtosis is ind
ompared to
xel intensity
4.2 Featu
he grey leve
al., 1973) ( , ) that p
ey levels ∈ 0°, 45°, 9his is illustr
search, the
gure 3.3: Calcu
fter their ca
very ( , ) ele
y the total n
., 1973). Thi
duction to Sta
chitectures for
RT)
dicative of t
the norma
y distributio
res calculat
el co-occurre
for textura
resents the, resp90°, 135° . T
rated in Fig
interpixel d
ulation of GLC
lculation, th
ement, the
number of n
is is describ
atistical Patter
r Multimodalit
K
he histogra
l distributio
ons.
ted from the
ence matrix
l feature ex
e frequency
ectively a
Thus a tota
gure 3.3. It
distance w
CM at angle 0°
he frequenc
normalised
neighbourin
ed in Equat
rn Recognition
ty Breast Lesio
1KURT
N=
m shape an
on (see Figu
e Co-occurr
x (GLCM), ha
xtraction. Th
y of appear
and interp
al of 4 GLCM
t must be
was set to 1
cy values of
d frequency
ng cell pairs
ion 3.5.
n
ons Character
[ (i j
I
N SD
å å
nd describes
ure 3.2). Wi
rence Matri
as been pro
he GLCM is
ance of tw
pixel dista
Ms, one for
noted that,
pixel.
f every GLCM
y ( , ) is ca
s in the re
isation
]4
4
( , )i j MV
SD
-
s the distrib
ider shapes
ix
oposed by H
s a two dim
wo neighbou
ance d
r every angl
, for the p
M are norm
alculated by
espective an
K. Sidirop
4
(
bution sharp
s signify bro
Haralick (Har
mensional m
ur pixels, ha
at an a
le, is calcula
purposes of
malised. Thus
y dividing
ngle (Harali
25
poulos
3.4)
pness
oader
ralick
matrix
aving
angle
ated.
f this
s, for ( , ) ck et

Chapter 3: Introduction to Statistical Pattern Recognition 26
Parallel GPU Architectures for Multimodality Breast Lesions Characterisation K. Sidiropoulos
R
jiPjip
),(),( = (3.5)
For example, considering the GLCM of the horizontal direction ( = 0°) there are 2( − 1) neighboring cell pairs for each row of the matrix, providing a total
of ° = 2 ( − 1) horizontal neighbouring pairs.
Angular Second Moment (ASM) −
=
−
=
=1
0
1
0
2),(g gN
i
N
j
jipASM (3.6)
where is the number of grey levels in the image, and ( , ) is the ( , )th element
of the normalised spatial dependence matrix. ASM measures the homogeneity of the
original image.
Contrast (CONTR) ( ) njijipnCONTRg g gN
n
N
i
N
j
=−
= −
=
−
=
−
=
||,),(1
0
1
0
1
0
2 (3.7)
which measures the amount of local intensity variations in the image
Inverse Difference Moment (IDM) −
=
−
= −+=
1
0
1
02)(1
),(g gN
i
N
j ji
jipIDM (3.8)
which is a measure of image homogeneity; larger values for smaller grey-tone
differences.
Entropy (ENTR) ( )−
=
−
=
−=1
0
1
0
),(log),(g gN
i
N
j
jipjipENTR (3.9)

Chapter 3: Introduction to Statistical Pattern Recognition 27
Parallel GPU Architectures for Multimodality Breast Lesions Characterisation K. Sidiropoulos
Entropy measures the levels of disorder and randomness in the original image. Its
value is maximised for a flat GLCM (Bocchi et al., 1997).
Correlation (COR)
yx
N
i
N
jyx
g g
mmjipij
CORσσ
−
=
−
=
−=
1
0
1
0
),()(
(3.10)
where mx, my, σx and σy the respective mean values and standard deviations of px
and py, which are described as follows:
1
( ) ( , )rowsN
xj
p j p i j=
= (3.11)
1
( ) ( , )colummsN
yj
p j p i j=
= (3.12)
Correlation quantifies the level of linear dependencies among the grey tones of the
image.
Autocorrelation (ACOR) −
=
−
=
=1
0
1
0
),(g gN
i
N
j
jiijpACOR (3.13)
ACOR measures the energy spread around the diagonal of the co-occurrence matrix,
which in effect gives an assessment of the correlation amongst intensities of pixel
pairs. It attains high values when intensities in pixel pairs are very close (Pratt, 2007).
Sum of Squares (SOQ) −
=
−
=
−=1
0
1
0
2 ),()(g gN
i
N
j
jipMViSOQ (3.14)
SOQ is a measure of variance of grey levels and, thus, quantifies textural dissimilarity.

Chapter 3: Introduction to Statistical Pattern Recognition 28
Parallel GPU Architectures for Multimodality Breast Lesions Characterisation K. Sidiropoulos
Variance (VAR) −
=
−
=
−=1
0
1
0
2 ),()(g gN
i
N
j
jipmiVAR (3.15)
where is the mean value of the GLCM.
Sum Average (SAV) =
+=gN
iyx iipSAV
2
2
)( (3.16)
SAV assesses grey-level inhomogeneity. It attains higher values when there are many
differences at high grey levels, suggesting the existence of structures at higher grey
tones.
with = =
+ ==+=g gN
i
N
jgyx Nkkjijipkp
1 1
2,...,3,2,),,()(
Sum Entropy (SENTR) ( )=
++−=gN
iyxyx ipipSENTR
2
2
)(log)( (3.17)
SENTR is a measure of randomness or lack of order in the distribution of structures
throughout the grey-tone values. High values signify equally distributed structures
within the grey-tone values of the image.
Sum Variance (SVAR) =
+−=gN
iyx ipSENTRiSVAR
2
2
2 )()( (3.18)
SVAR expresses the variance in the distribution of structures throughout the grey-
tone values.
Difference Variance
(DVAR) = (3.19)
where = =
− −==−=g gN
i
N
jgyx Nkkjijipkp
1 1
1,...,2,1,0,||),,()(
DVAR is a measure of variation in image contrast. It attains low values for equally
distributed contrast transitions or image grey-tone differences.

Chapter 3: Introduction to Statistical Pattern Recognition 29
Parallel GPU Architectures for Multimodality Breast Lesions Characterisation K. Sidiropoulos
Difference Entropy (DENTR) ( ))(log)(1
0
ipipDENTR yx
N
iyx
g
−
−
=−−= (3.20)
DENTR is a measure of randomness or lack of structure in the image contrast. Attains
high values for equally distributed image grey-tone differences or for images with
low variation in image contrast.
3.4.3 Features Extracted from the Run-Length Matrix
A set of consecutive, collinear picture points having the same grey level value is a
grey level run. The number of picture points in the run is defined as its length. For a
given picture, we can compute a grey level run length matrix for runs having any
given direction.
Let ( , ) denote the ( , )-element of the run-length matrix (Galloway, 1975),
where is the grey-level and is the maximum number of consecutive pixels with
grey-level equal to at an angle . In the present work, the run-length matrices for
angles ∈ 0°, 45°, 90°, 135° were calculated. From the run-length matrix the
following features are defined:
Short-Run Emphasis (SRE)
( )
( )
2
,
,
g r
g r
N NRL
i jN N
RLi j
Q i j
jSRE
Q i j
=
(3.21)
where the number of grey levels in the image, the number of different run
lengths that occur. Short-Run Emphasis measures the distribution of short runs of
pixels with the same grey level, hence, fine textures result to higher SRE values, while
coarse textures present lower SRE values (Galloway, 1975).

Chapter 3: Introduction to Statistical Pattern Recognition 30
Parallel GPU Architectures for Multimodality Breast Lesions Characterisation K. Sidiropoulos
Long-Run Emphasis (LRE) ( )
( )
2,
,
g r
g r
N N
RLi j
N N
RLi j
Q i j j
LRE
Q i j
⋅
=
(3.22)
In contrast to SRE, Long-Run Emphasis quantifies the presence of long runs and
larger structures in the image. Therefore fine textures result to lower LRE values,
while coarse textures present higher LRE values (Galloway, 1975).
Grey-Level Non-Uniformity
(GLNU)
( )
( )
2
,
,
g r
g r
N N
RLi j
N N
RLi j
Q i j
GLNU
Q i j
=
(3.23)
GLNU measures the similarity of grey level values. Lower values suggest an even
distribution of run lengths throughout the grey levels (Galloway, 1975).
Run-Length Non-Uniformity
(RLNU)
( )
( )
2
,
,
gr
g r
NN
RLj i
N N
RLi j
Q i j
RLNU
Q i j
=
(3.24)
Accordingly, RLNU measures the similarity of length of runs, and thus lower values
suggest an even distribution of runs throughout the run-length groups (Galloway,
1975).
Run-Percentage (RP) ( ),g r
N N
RLi j
RP Q i j P= (3.25)
where the maximum number of run-lengths in the image. In particular, provided
that all runs had a length of one pixel, matches the total number of pixels in the
Chapter 3: Introduction to Statistical Pattern Recognition 31
Parallel GPU Architectures for Multimodality Breast Lesions Characterisation K. Sidiropoulos
image. Run Percentage quantifies the distribution of runs, as higher RP values
indicate the prevalence of short runs in the texture of the original image.
Consequently, RP attains its lowest value for pictures with linear structure (Galloway,
1975).
3.5 Data Normalisation
Following the feature extraction, generated feature values usually vary in different
dynamic ranges. Hence, features with higher values have a stronger impact on the
design of the classifier than features with lower values. In order to counteract this,
the intermediate step of data normalisation is often adopted prior to the classifier
design. The main function of data normalisation is to adjust all features values so
that they fall within a predefined range (Theodoridis et al., 2010).
A quite common linear technique dictates that all features in each dataset are
normalised to zero mean and unit standard deviation, according to Equation 3.26.
σ
μ−=′ )()( ixix (3.26)
where x’(i) is the normalised version of feature x(i), μ and σ are the mean and
standard deviation of feature vector x, both calculated over all patterns of all classes.
Data normalisation introduces an additional computational burden that will be
discussed and addressed during the design of the GPU-based system.
3.6 Feature reduction – selection
As stated afore, the main purpose of this stage is to search through a large pool of
available features and select a subset of features that exhibits high discriminatory
potential. The importance of this stage in the design of the classification system
cannot be overstressed, as a poor selection of features has a negative impact on the

Chapter 3: Introduction to Statistical Pattern Recognition 32
Parallel GPU Architectures for Multimodality Breast Lesions Characterisation K. Sidiropoulos
performance of the classifier. Besides minimising the computational complexity
involved, reducing the number of features by selecting a smaller, yet more
informative subset, contributes to avoiding overfitting to the specific training dataset
and, thus, results in improved generalisation performance, i.e. the classifier’s ability
to perform well on unseen data. There are two main approaches to feature selection.
3.6.1 Scalar Feature Selection
The first step examines every available feature individually and determines whether
it is an informative one. This is typically performed by employing statistical tests,
such as the t-test, the Wilcoxon rank sum test (Hollander and Wolfe, 1999), or the
Fisher ratio, to examine whether there is a statistically significant difference in the
feature’s value among the classes. Features can be ranked according to their
statistical difference, while in case there is no statistically significant difference the
feature under examination may be discarded. Other class separability criteria include
the Receiver Operating Characteristic (ROC) curve, Bhattacharyya distance, and
measures based on Scatter matrices (Theodoridis and Koutroumbas, 2003).
Although computationally simple, the main drawback of these methods is that they
do not take into consideration possible correlations among the features. According
to (Theodoridis and Koutroumbas, 2003), a better approach to scalar feature
selection is to incorporate the cross-correlations between the features. First, by
employing one of the aforementioned criteria, features are ranked in descending
order. Let denote the index of the top ranked feature. Next, to select the index
of the second most important feature, Equation 3.27 is used.
{ }12 1 2 , 1max ,j f jj
f w C w j fρ= − ≠ (3.27)
where is the value of the criterion for the th feature, and , the cross
correlations between and any other feature ≠ , and and two user

Chapter 3: Introduction to Statistical Pattern Recognition 33
Parallel GPU Architectures for Multimodality Breast Lesions Characterisation K. Sidiropoulos
defined weights. The cross-correlation coefficient between any two features is given
by Equation 3.28
1
2 2
1 1
N
ni njn
ij N N
ni njn n
x x
x x
ρ =
= =
=
(3.28)
where is the number of patterns, the th feature of the th pattern and
the th feature of the th pattern
Similarly, the rest of the features are selected by considering the average correlation
with all the previously selected features, according to Equation 3.29
1
21 ,
1
max , , 1,2,... 11 r
k
k j f j rj
r
wf w C j f r k
kρ
−
=
= − ≠ = − − (3.29)
for = 3, 4, 5… (the number of features)
The main advantage of scalar feature selection, i.e. evaluating the discriminatory
potential of each individual feature, is that it is computationally non-demanding.
Nevertheless, this comes at a cost, as scalar feature selection methods may not be
suitable for more complex classification problems where features with high mutual
correlation may be used (Theodoridis and Koutroumbas, 2003).
3.6.2 Feature Vector Selection
Feature vector selection methods search through candidate feature combinations,
evaluating their classification capability and aiming to identify the “best” feature
combinations, based either on an optimality rule (Filter methods) or on the
performance of a classifier (Wrapper methods).
Filter selection methods evaluate each feature combination by its information
content, typically employing one of the separability criteria mentioned afore, such as
interclass distance, correlation measures, etc. These methods are fast in execution

Ch
Pa
an
(T
On
bo
wr
fe
se
W
th
th
inc
sin
su
Bo
se
apter 3: Intro
rallel GPU Arc
nd produce
heodoridis
n the other
ound togeth
rapper met
ature comb
elect the co
Wrapper feat
an filter me
e classifier
clude highe
nce the wra
ubset, depen
oth of the a
earching tec
duction to Sta
chitectures for
results tha
and Koutro
r hand, in w
her with the
hods embe
bination by
mbination t
ture selectio
ethods, sinc
r and the d
er risk of ov
apper must
nding on the
Figure 3
aforementio
hniques.
atistical Patter
r Multimodalit
at exhibit m
umbas, 200
wrapper sele
e construct
ed a pattern
its predict
that results
on techniqu
ce they are
dataset. Ho
verfitting tha
train the c
e evaluation
3.4: Filter and W
oned appro
rn Recognition
ty Breast Lesio
more gener
03).
ection meth
tion of the
n classificat
ive accurac
s in the min
es generally
e fine-tuned
owever, co
an filter tec
classifier on
n method ad
Wrapper featu
oaches can
n
ons Character
rality to a
hods the fe
prediction
ion scheme
cy (recognit
nimum clas
y achieve be
d to the spe
mmon draw
chniques, an
nce or multi
dopted (Sae
ure selection a
be used wi
isation
larger fam
eature selec
rule (the cl
e in order to
ion rate on
sification e
etter classif
ecific intera
wbacks of
nd high com
iple times f
eys et al., 20
approaches
th optimal
K. Sidirop
ily of class
ction criteri
assifier). He
o evaluate
n test data)
rror probab
fication accu
actions betw
these met
mputational
for each fea
007).
and subopt
34
poulos
ifiers
on is
ence,
each
) and
bility.
uracy
ween
thods
cost
ature
timal
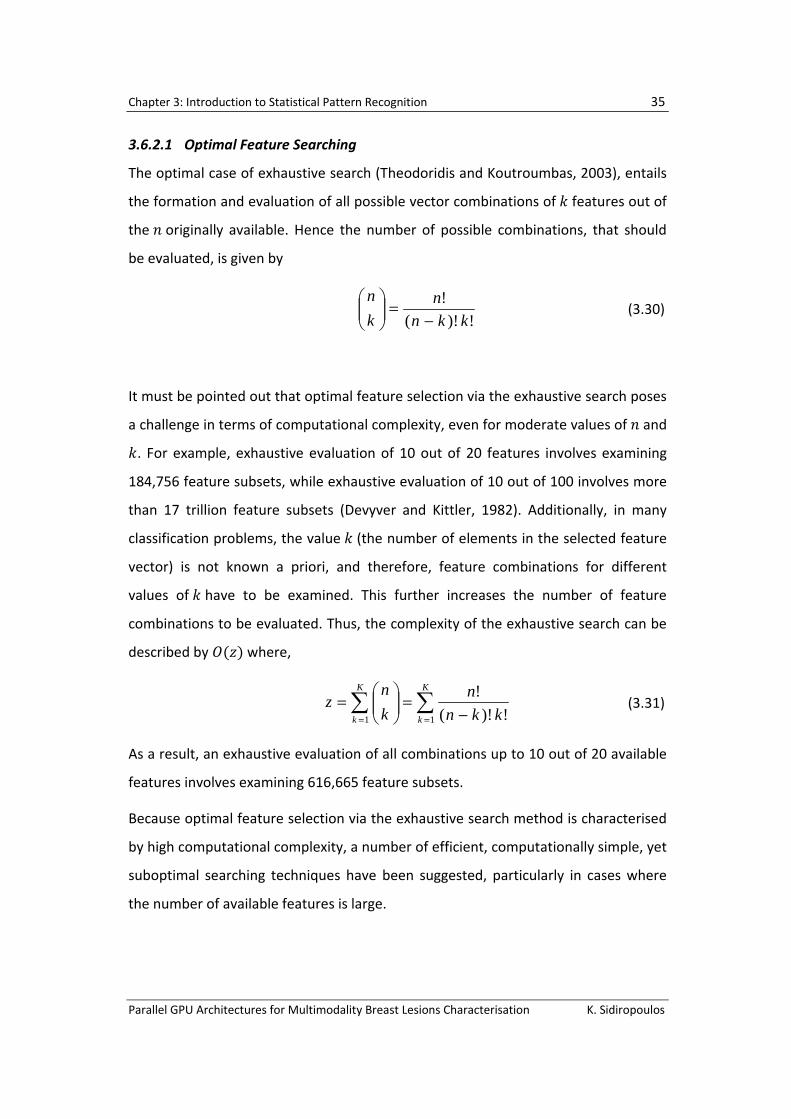
Chapter 3: Introduction to Statistical Pattern Recognition 35
Parallel GPU Architectures for Multimodality Breast Lesions Characterisation K. Sidiropoulos
3.6.2.1 Optimal Feature Searching
The optimal case of exhaustive search (Theodoridis and Koutroumbas, 2003), entails
the formation and evaluation of all possible vector combinations of features out of
the originally available. Hence the number of possible combinations, that should
be evaluated, is given by
!)!(
!kkn
n
k
n
−=
(3.30)
It must be pointed out that optimal feature selection via the exhaustive search poses
a challenge in terms of computational complexity, even for moderate values of and
. For example, exhaustive evaluation of 10 out of 20 features involves examining
184,756 feature subsets, while exhaustive evaluation of 10 out of 100 involves more
than 17 trillion feature subsets (Devyver and Kittler, 1982). Additionally, in many
classification problems, the value (the number of elements in the selected feature
vector) is not known a priori, and therefore, feature combinations for different
values of have to be examined. This further increases the number of feature
combinations to be evaluated. Thus, the complexity of the exhaustive search can be
described by ( ) where,
== −
=
=K
k
K
k kkn
n
k
nz
11 !)!(!
(3.31)
As a result, an exhaustive evaluation of all combinations up to 10 out of 20 available
features involves examining 616,665 feature subsets.
Because optimal feature selection via the exhaustive search method is characterised
by high computational complexity, a number of efficient, computationally simple, yet
suboptimal searching techniques have been suggested, particularly in cases where
the number of available features is large.

Chapter 3: Introduction to Statistical Pattern Recognition 36
Parallel GPU Architectures for Multimodality Breast Lesions Characterisation K. Sidiropoulos
3.6.2.2 Suboptimal Feature Searching
These techniques include, among others, the sequential forward and backward
selection (SFS and SBS respectively), and the sequential forward and backward
floating selection methods (SFFS and SBFS respectively) (Theodoridis et al., 2010).
Sequential Forward Selection (SFS) is the simplest greedy search algorithm. Starting
from an empty set, the SFS algorithm determines an “optimal” set of features
through a number of steps. Sequentially, in each step, SFS adds the feature f+ that,
when combined with the features Ys, selected in previous steps, results in the highest
value of the chosen separability criterion C(Ys+f+). It must be noted that the latter can
be any of the criteria mentioned afore or the predictive accuracy of a pattern
classifier, depending on whether the filter or the wrapper approach is adopted. SFS
performs best when the optimal subset has a small number of features.
Similarly to SFS, Sequential Backward Selection (SBS) determines an “optimal” set of
features through a number of steps, but works in the opposite direction. The
particular search begins with the full set of available features, and in every step it
removes a single feature which when discarded leads to an improvement in the
chosen criterion. SBS works best when the optimal feature subset has a large
number of features (Theodoridis and Koutroumbas, 2003). Pseudocode for SFS and
SBS is shown in Figure 3.5 and Figure 3.6 respectively.
1. Start with the empty feature set = ∅ = 0 2. Select the next best feature = argmax ∉ ( + ) 3. Update the set = + = + 1 4. Goto 2
Figure 3.5: Pseudocode for SFS algorithm

Chapter 3: Introduction to Statistical Pattern Recognition 37
Parallel GPU Architectures for Multimodality Breast Lesions Characterisation K. Sidiropoulos
1. Start with the full feature set = = 0 2. Select the worst feature = argmax ∈ ( − ) 3. Update the set = − = + 1 4. Goto 2
Figure 3.6: Pseudocode for SBS algorithm
The main disadvantage of the aforementioned sequential approaches is that they
suffer from the so-called nesting effect. Thus, as a trade-off for their reduced
computational complexity, SFS and SBS often tend to become trapped in local
minima, while evaluating the separability criterion for given feature combinations.
This emanates from their inability to re-evaluate features that were previously added
(SFS) or discarded (SBS).
In an attempt to counteract the nesting effect (Pudil et al., 1994) has suggested the
floating search method. The name results from the fact that dimensionality of the
feature subset, during the search, can be thought to be “floating” up and down.
Again, there are two schemes that implement this technique. Sequential Forward
Floating Selection (SFFS) scheme starts with an empty set of features. After each
forward step in which a feature has been added in the subset, SFFS performs
backward steps, removing features provided that the criterion increases. In contrast,
Sequential Backward Floating Selection (SBFS) begins with the full set of available
features, and following each backward step, SFBS performs forward steps as long as
the criterion increases. Pseudocode for SFBS and SBFS is shown in Figure 3.7 and
Figure 3.8 respectively.
Although still suboptimal techniques, both floating search methods incorporate
backtracking capabilities and, therefore, provide improved results compared to SBS
and SFS, at the cost of higher computational complexity (Theodoridis and
Koutroumbas, 2003).

Chapter 3: Introduction to Statistical Pattern Recognition 38
Parallel GPU Architectures for Multimodality Breast Lesions Characterisation K. Sidiropoulos
1. Start with the empty feature set Y = ∅ s = 0 2. Select the next best feature and update the set f = argmax ∉ C(Y + f) Y = Y + f s = s + 1 3. Select the worst feature f = argmax ∈ C(Y − f) 4. If C(Y − f ) > C(Y ) then Y = Y − f s = s + 1
Goto 3 Else
Goto 2
Figure 3.7: Pseudocode for SFFS algorithm
1. Start with the full feature set Y = X s = 0 2. Select the worst feature and update the set = argmax ∈ ( − ) Y = Y − f s = s + 1 3. Select the best feature f = argmax ∉ C(Y + f) 4. If C(Y + f ) > C(Y ) then Y = Y + f s = s + 1
Goto 3 Else
Goto 2
Figure 3.8: Pseudocode for SBFS algorithm
3.7 Classification
As mentioned in section 3.2, the ultimate goal of classification is to assign unknown
patterns (objects described by features) to a class (category or group), based on a
criterion, referenced by the term “prediction rule”. Thus, a classifier is the
mathematical representation of a prediction rule. A classifier takes as input a
pattern, described by the most informative features, extracted in previous stages,
and outputs a label or value indicating which class the pattern belongs to (Duda et

Chapter 3: Introduction to Statistical Pattern Recognition 39
Parallel GPU Architectures for Multimodality Breast Lesions Characterisation K. Sidiropoulos
al., 2012). The basic theory of benchmark classifiers, used for the purposes of this
thesis, is given below.
3.7.1 Bayesian
The Bayesian classifier (Theodoridis and Koutroumbas, 2003), considered as the basic
approach to statistical pattern recognition, is designed in order to minimise the total
classification error, assuming normal probability distribution of the class-samples.
The discriminant function i.e. mathematical representation of the prediction rule of
the Quadratic Bayesian classifier for class is given by :
11 1( ) log log ( ) ( )2 2
TC C C C C CD x P S x S xm m-é ù= - - - -ê úë û (3.32)
where is the unknown pattern vector, is the prior probability of class C, μC is
mean value of class C and SC is the covariance matrix of class C defined as :
( )( )TC C CS x xm m= - - (3.33)
The unknown pattern x is classified to the class C with the larger discriminant
function value because it expresses the probability of pattern x to belong to class C.
3.7.2 Linear Discriminant Analysis
Linear Discriminant Analysis (LDA) classifier finds a linear transformation that, when
applied on the features of the patterns, it yields a new set of transformed values that
provide a more accurate discrimination. Assuming that each class has multivariate
normal distribution and all classes have the same covariance matrix, the discriminant
function of the LDA classifier for class C is:

Chapter 3: Introduction to Statistical Pattern Recognition 40
Parallel GPU Architectures for Multimodality Breast Lesions Characterisation K. Sidiropoulos
1 11( ) log2
T TC C C w C w CD x P S x Sm m m- -= + - (3.34)
where the within-class covariance matrix Sw is the weighted average of the
separately estimated class-conditional covariance matrices,
K
w C CC
S P S=å (3.35)
and
CC
all
NP
N= (3.36)
where PC is the prior probability of class C, K is the number of classes, NC the patterns
of class C, Nall the total number of patterns, μC is mean value of class C, SC is the
covariance matrix of class C, and x is the unknown pattern vector, which is classified
to the class with the highest discriminant function value (Kuncheva, 2004; Duda et
al., 2012).
3.7.3 k-Nearest Neighbours
The Nearest Neighbour classifier is a non-parametric classifier, where the unknown
pattern is classified to the class that contains its closest neighbour. Similarly, the k-
Nearest Neighbour (k-NN) classifier classifies the unknown pattern to class j if the
majority of its k neighbours belong to class j (Kuncheva, 2004).
3.7.4 Probabilistic Neural Network
The implemented Probabilistic Neural Network (PNN) (Specht, 1990) algorithm, is a
four-layer (input, pattern, summation and output layers), feed-forward and one-pass
structure and encapsulates the Bayes’ decision rule together with the use of Parzen
estimators of data’s probability distribution function. The discriminant function of
the PNN classifier for class C is:

Chapter 3: Introduction to Statistical Pattern Recognition 41
Parallel GPU Architectures for Multimodality Breast Lesions Characterisation K. Sidiropoulos
/2 21
1 1 ( ) ( )( )(2 ) 2
CN Tci ci
C d diC
x x x xD x
Np s s=
æ ö- - ÷ç ÷= -ç ÷ç ÷çè øå (3.37)
where σ is the spread of the Gaussian activation function, NC is the number of
feature vectors of class C, d is the dimensionality of pattern vectors, xci is the i-th
feature vector of class C, and x is the unknown feature vector. The latter is classified
to the class with the highest discriminant function value.
3.7.5 Support Vector Machines
By mapping input vectors into a higher dimension feature space and defining the
hyperplane that has the maximum distance from the closest training data, the SVM
(Burges, 1998) can be utilised for binary classification problems with discriminant as
follows:
1
( ) ( , )cN
C i C ii
D x sign a L K x x b=
æ ö÷ç ÷= +ç ÷ç ÷çè øå (3.38)
where xi is the i-th feature vector belonging to class C, NC is the number of feature
vectors of class C, LC is the label of class C, αi, b are weight coefficients and K the
transformation or kernel function (Burges, 1998). Kernel functions utilised were the
radial basis function (RBF) kernel with value of γ = 1/(2σ2) and polynomial kernels
with degree 1-3.
2
22( , ) exp x xi
RBF iK x xσ
− −
=
( , ) (( ) 1)T rPOLYNOMIAL i iK x x x x= +
(3.39)
3.8 Evaluation strategies
The last stage of the design process of a pattern recognition system involves
evaluating its performance. Selection of the adopted evaluation strategy is

Chapter 3: Introduction to Statistical Pattern Recognition 42
Parallel GPU Architectures for Multimodality Breast Lesions Characterisation K. Sidiropoulos
considered of paramount importance in pattern recognition, as the former provides
an estimation of the classification error probability, using the available, hence finite
set of data. Also, it should be underlined that the evaluation strategy is incorporated
in the design of the pattern recognition system and, hence, it is not cut off from the
previous stages of the design procedure (Theodoridis and Koutroumbas, 2003). Thus,
besides allowing the extraction of conclusions regarding the generalisation of the
designed classification system, evaluation methods can also enable selection of the
“optimal” parameter(s) for a given classification problem. For instance, these
parameters could typically include the number of neighbours in a kNN classifier, or
the value of the smoothing parameter in the PNN classifier. In addition, as
mentioned afore, in the feature selection stage, wrapper methods utilise the
misclassification probability to measure the performance of the classifier and
accordingly choose the best features.
Accurate evaluation of a classification scheme would be a rather straightforward task
provided that access to an unlimited number of samples was feasible. However, in
the majority of real applications, this is not the case, as the number of available
training and testing samples is finite.
Aiming to maximise the number of data used to build the classifier (training set) and
simultaneously maximise the number of data used to assess its performance (testing
set), one rather naïve approach is the re-substitution method (Kuncheva, 2004),
according to which, the entire dataset is used for both training and testing. The re-
substitution approach suffers from two main inefficiencies. Firstly, due to the fact
that the same data are used for both training and testing, the re-substitution method
provides optimistically biased estimates of the classifier performance (Foley, 1972).
In fact, it is very common to achieve 100% correct classification on the training
dataset. Secondly, because the classifier might overtrain to the available dataset i.e.
the classifier perfectly learns and adapts on the available data, it fails to generalise in
new, unseen data.
Chapter 3: Introduction to Statistical Pattern Recognition 43
Parallel GPU Architectures for Multimodality Breast Lesions Characterisation K. Sidiropoulos
Another method for estimating a classifier’s performance is the holdout method. In
this approach the available dataset is split into two distinct datasets, as illustrated in
Figure 3.9. Accordingly, the training dataset is utilised for training, while the test
dataset is used to estimate the performance of the trained classifier. The main
shortcoming of the holdout method is that it shrinks the size of both datasets, and
consequently cannot be easily adopted in case the available data is limited
(Kuncheva, 2004).
Cross-validation methods attempt to overcome the aforementioned limitations of re-
substitution and holdout techniques at the cost of increased computational
complexity. Hence, in the K-Fold Cross-Validation approach (see Figure 3.9), the
complete dataset of size is randomly partitioned into subsets, each having a size / . Next, one subset is excluded and used to test the classifier. Training of the
latter is accomplished utilising the union of the remaining − 1 subsets. This is
repeated times, each time selecting a different subset for testing, and using the
remaining − 1 for training. The error probability is then averaged over the steps.
In the extreme case that = , i.e. the testing set comprises one sample, the Leave-
One-Out (LOO) method is formed as presented in Figure 3.9 (Kuncheva, 2004).
The advantage of Cross-Validation method is that the complete dataset is eventually
used for both training and testing, while ensuring independence of the training and
testing subsets (Theodoridis and Koutroumbas, 2003). Nevertheless, its major
drawback is that it involves high computational complexity due to the fact that
classifier training has to be repeated K times. This continues to pose a challenge even
with modern computing technology (Kuncheva, 2004).
In case the classifier design (feature selection, fine tuning of classifier parameters)
and generalised performance estimates to new and unseen by the system data are to
be computed simultaneously, it is not an uncommon practice to divide the available
data into three disjoint datasets, one used for training, one for validation and finally
one for testing. In addition, as it has previously (Ambroise and McLachlan, 2002)
demonstrated cross-validation testing samples should be kept external to the design

Ch
Pa
pr
tu
un
pe
aft
sh
ov
apter 3: Intro
rallel GPU Arc
rocess. Acco
ning of the
nseen durin
erformance
ter assessin
hould not pr
vertraining o
duction to Sta
chitectures for
ordingly, th
classifier pa
ng the trai
of a fully-tr
ng the perfo
roceed to an
of the classi
atistical Patter
r Multimodalit
e validation
arameters,
ning proce
rained class
ormance of
ny further t
fier.
Figure 3.9: Di
rn Recognition
ty Breast Lesio
n dataset is
while the cr
ss and is
ifier (Kunch
the classifi
uning of the
ifferent evalua
n
ons Character
s used for f
ross-validat
used only
heva, 2004).
cation sche
e classifier,
ation techniqu
isation
feature sele
ion testing
to assess
. It must be
eme on the
otherwise,
ues
K. Sidirop
ection, and
dataset rem
the genera
underlined
testing set,
this may lea
44
poulos
d fine
mains
alised
d that
, one
ad to

Chapter 3: Introduction to Statistical Pattern Recognition 45
Parallel GPU Architectures for Multimodality Breast Lesions Characterisation K. Sidiropoulos
However, when three way splitting results in insufficiently small data-partitions,
then, as it has been shown (Laine et al., 1996) the external k-fold cross-validation
provides one of the most unbiased estimations (Ambroise and McLachlan, 2002).
Hence, available data are randomly divided into two disjoint subsets: a training
subset comprising 2/3 of available samples, and a test subset consisting of the
remaining 1/3 of available samples. Training data are further split into training and
validation datasets. Employing these two datasets, both feature selection and
training of the classifier are performed. In particular, feature selection can be
accomplished by adopting a wrapper method that evaluates the classifier’s
predictive accuracy on the validation dataset. Following optimal classifier design, its
performance is evaluated on the remaining testing data. This process is repeated 10
times for 10 different random splits of all available data. The average accuracies and
ranges are finally computed. In this way the external cross-validation estimate of the
classifiers’ performance is determined, which is considered as indicative of the
classifiers’ performance into new, unseen, data.
Nevertheless, as it can be easily inferred, selecting an external k-fold cross-validation
evaluation technique for a PR system, imposes a significant computational burden.
Moreover, the involved computational complexity is rendered prohibitive even for
modern CPUs, in case the aforementioned technique is combined with an optimal
feature selection method that employs exhaustive search in a large feature space
(e.g. the use of multiple imaging modalities, as in our case) and the predictive
accuracy of a classifier following a wrapper approach. A practical way out of this
“computational maze” may be the adoption of parallel processing methods and the
employment of powerful, programmable GPUs, originally developed to cover the
growing need for more realistic and entertaining videogames.

Chapter 3: Introduction to Statistical Pattern Recognition 46
Parallel GPU Architectures for Multimodality Breast Lesions Characterisation K. Sidiropoulos
3.9 Summary
In this chapter, the basic concepts and methods of statistical pattern recognition
were introduced. Key ideas and the stages involved in the design of a classification
system were presented. In particular, algorithms and methods discussed in this
chapter include a) calculation of textural features from the image histogram, the co-
occurrence and run-length matrices, b) feature reduction and both optimal and
suboptimal feature selection, c) basic classifiers, and d) approaches for pattern
recognition system performance evaluation. In addition, all the aforementioned
methods were assessed in terms of their computational complexity. As a conclusion,
optimal training of a classification scheme presents a computational challenge even
for modern CPUs, giving rise for the adoption of efficient, yet suboptimal
methodologies that fail to identify the full discriminatory potential of the available
dataset. The necessity of applying optimal design methods for increasing the
precision of pattern recognition systems, thus, becomes apparent. To deal with the
computational challenge imposed, one may have to resort to parallel processing
through the use of GPUs. This is necessary especially in the present study, due to the
requirement of increased feature space dimensionality, introduced by the
multimodality nature of the problem at hand.

Parallel GPU Architectures for Multimodality Breast Lesions Characterisation K. Sidiropoulos
Chapter 4
Chapter 4. GPUs as Parallel Processing Accelerators
4.1 Overview
In this chapter the use of GPUs as parallel processing hardware accelerators is
introduced. It begins with the history and evolution of multi-core
microprocessors and GPUs over the last 2 decades. An account of the main
architectural differences between CPUs and GPUs is given, along with the
main reasons behind the ever growing popularity of GPU-accelerated
computing and its limitations. This chapter also includes a brief description of
the Compute Unified Device Architecture (CUDA) programming model, thus,
providing a theoretical foundation for the subsequent chapter.

Chapter 4: GPUs as Parallel Processing Accelerators 48
Parallel GPU Architectures for Multimodality Breast Lesions Characterisation K. Sidiropoulos
4.2 The dawn of the Multi-Core Era
Since their introduction in early 1980s, and for more than two decades, personal
computers have been continuously improving in their performance, powered by
microprocessors that featured a single CPU. Until the first years of the new
millennium, major microprocessor vendors, such as Intel and AMD, managed to
relentlessly deliver CPUs able to perform more and more arithmetic operations per
second.
Predicted by Moore’s law (Moore, 2006), this continuous increase in performance
was the product of technical innovations that enabled the semiconductor industry to
pack more transistors in an affordable CPU, operating at an ever-increasing clock
speed. This was particularly convenient for both users and the software industry, due
to the fact that their algorithms and applications were guaranteed to run faster, as
every new generation of CPUs was introduced.
However, in 2003, this “roller coaster” ride was slowed down, as the semiconductor
industry hit, what is known as, the “power wall”, a term used to summarise the
inherent technical limitations, related to energy consumption and heat emission
levels of a CPU. In particular, in their effort to reduce the size and increase the speed
of transistors i.e. their clock frequency, microprocessor designers realised that
reduction in the operating voltage could not be sustained at the same pace as in the
past. Consequently, the transistors produced prohibitively high amounts of waste
heat per square millimetre of silicon. Unable to resolve this heat dissipation issue in a
cost effective way, chip manufacturers were forced to re-evaluate their approach
and accept the fact that although they could still produce smaller transistors and
pack more of them in a single chip, any increase in their operating clock speed, was
not an option. Hence, chipmakers came up with the only viable solution at the time.
They reduced the clock frequency of the transistors and added multiple
microprocessor cores in a single CPU. Even though each processor core would have
lower computational abilities, their aggregate computational capacity would be
higher, leading to increased overall performance. Therefore, designers expected that
Chapter 4: GPUs as Parallel Processing Accelerators 49
Parallel GPU Architectures for Multimodality Breast Lesions Characterisation K. Sidiropoulos
the gain, resulting from the extra parallelism, would compensate for, or even
overbalance, the loss from the lower clock frequency, while at the same time, the
CPU would consume less power and, thus, generate less waste heat per square
millimetre of silicon (Moore, 2010). The first dual-core CPUs designed for desktop
PCs were made available in 2005, as the Athlon 64 X2 (AMD, 2005), and the Pentium
D (Intel, 2005) were released by AMD and Intel respectively. To distinguish these
novel CPUs from traditional single-core architectures, the term multicore
microprocessors is used (Moore, 2010; Patterson, 2010).
Since the advent of the first generation of multicore CPUs, “the core has become the
new transistor” (Patterson, 2010) as all microprocessor vendors focused on
incorporating more processor cores in each CPU chip, aiming to achieve higher
performance through parallelism. Today, multicore CPUs can be found in wide range
of everyday devices, from desktop PCs and notebooks, to smartphones and tablets.
This advancement had a significant impact on the software industry mainly because
most software applications at the time were following the conventional sequential
programming model, whereas instructions are executed in a sequential order (one
after the other) by a single processor thread (Sutter and Larus, 2005). Because the
traditional sequential model could not take advantage of the increasing number of
processor cores found on these new CPUs, the software industry had to find ways for
developers to introduce concurrency in their applications, without lowering the
quality of the produced software, or stretching the development time (Patterson,
2010). This increasing need for concurrency gave rise to parallel programming.
4.3 Parallel Programming
Although parallel programming was not, by any means, new, it had been historically
confined to the high-performance computing community for decades, and only
recently it has evolved into a mainstream paradigm in everyday information
processing, mainly due to the proliferation of multicore CPUs. Parallel programming

Chapter 4: GPUs as Parallel Processing Accelerators 50
Parallel GPU Architectures for Multimodality Breast Lesions Characterisation K. Sidiropoulos
employs concurrency to build programs that execute faster and, thus, achieve high-
performance computing. In other words, parallel programming enables many
instructions of the same program to be executed in parallel. The idea is to
decompose, or split, a specific problem, solved sequentially, into smaller,
independent parts that can be solved in parallel, exploiting the ubiquity of multi-core
processors. The term computational grain refers to these pieces of sequential
algorithms that can be executed in parallel (Sen, 2012).
Defined as the ratio of execution time required by a sequential program, to the time
required by its parallel version, speed-up is a common measure of the achieved
performance gain. It could be easily inferred that speed-up increases with the
number of available processor cores. However this is not entirely accurate. According
to Amdahl’s law (Kumar et al., 1994), the theoretical maximum speed-up of a
program executed by multiple processors is limited by its parallel fraction, i.e. the
part of the program than can be executed in parallel (Park et al., 2011). In particular,
this law states that if P is the fraction of a program that can be made parallel and 1-P
is the fraction that cannot be parallelised, i.e., that must remain sequential, then the
maximum theoretical speed-up that can be achieved using n processors is expressed
by Equation 4.1:
n
PP
Speedup+−
=)1(
1 (4.1)
One obvious repercussion is that just by adding more processors does not always
result in a significant speed-up as, in practice, performance falls rapidly once there is
even a small component of (1-P). Hence, effort must be put to increase the parallel
fraction and shrink the sequential. This was one of the primary concerns while
designing the proposed GPU-based PR system.

Ch
Pa
Inc
Ta
ex
op
dis
GP
De
Pr
Op
wi
Op
on
m
of
re
co
fle
th
co
co
Fig
apter 4: GPUs
rallel GPU Arc
creasing the
ask and Dat
xecuted in p
perating on
scussed in
PU executio
espite the
rogramming
penMP and
idely used (
penMP (Ope
n the share
odel all pro
f communic
quired to
onversion of
exible enoug
at, due to
oherence, it
ores (Chapm
gure 4.1: The t
s as Parallel Pr
chitectures for
e aforemen
ta parallelis
parallel, wh
different d
a subseque
on model.
fact that q
g Interfaces
d the Messa
Mattson et
enMP, 2005
ed memory
ocessor core
cation amon
port a seq
f its blocks
gh to suppo
o hardware
t fails to eff
man et al., 20
two main mem
rocessing Acce
r Multimodalit
ntioned para
sm. Task p
hile data pa
data (Sen, 2
ent paragra
quite a few
s (APIs) and
age Passing
al., 2004).
5) is an exte
model. As
es share a si
ng the proc
quential pr
of code so
ort a wide ra
e limitation
ficiently sup
008; Kirk an
mory models u
elerators
ty Breast Lesio
allel fractio
parallelism r
arallelism is
012). These
ph, as not
w parallel
d models h
g Interface
ension of C+
presented
ingle global
cessor core
rogram to
o that they
ange of app
ns related
pport more
nd Wen-mei
used in paralle
ons Character
n can be ac
refers to in
s achieved b
e two categ
both of the
programmi
have been
(MPI) man
++ programm
in Figure 4
memory. T
es and signi
OpenMP, a
can be exe
plications, O
to thread
e than a co
i, 2012).
el programmin
isation
ccomplished
ndependent
by a task o
gories of pa
em are com
ing languag
proposed i
aged to sta
ming langua
4.1, in the
The latter pr
ificantly red
as it enab
cuted in pa
OpenMP’s m
managem
uple of hun
ng.
K. Sidirop
d by introdu
t tasks that
or a set of t
rallelism w
mpatible fo
ges, Applica
n the past,
and out an
age and is b
shared mem
rovides a m
duces the e
les increme
arallel. Alth
main drawba
ent and c
ndred proce
51
poulos
ucing
t are
tasks
ill be
r the
ation
, the
d be
based
mory
means
effort
ental
ough
ack is
cache
essor

Chapter 4: GPUs as Parallel Processing Accelerators 52
Parallel GPU Architectures for Multimodality Breast Lesions Characterisation K. Sidiropoulos
On the other hand, MPI (MPI, 2009) is based on the distributed memory model,
according to which every computing node has its own memory and communication
among all nodes is performed via message passing through an interconnection
network, e.g. Ethernet (see Figure 4.1). MPI has been particularly popular in the high-
performance scientific community, as it mainly targets expensive high-end computer
clusters, and its scalability has reached cluster systems with thousands of computing
nodes. However, the lack of shared memory increases the effort required to
efficiently port sequential applications to MPI (Kirk and Wen-mei, 2012).
4.4 The evolution of GPU as programmable parallel processor
Today, a modern GPU constitutes a typical example of massively parallel computing
platform. Although, they were originally designed as dedicated processors, optimised
to handle solely computer graphics computations, over the last 30 years, GPUs have
been transformed into widely deployed commodity desktop parallel computers, as
described in (Crow, 2004; Luebke and Humphreys, 2007).
Driven by the growing market demand for high quality, real time graphics in
computer games and applications, GPUs have evolved from devices that simply
implemented the traditional fixed-function 3D graphics pipeline towards flexible,
programmable, general-purpose computational engines. GPUs present a significantly
higher theoretical performance and memory bandwidth than CPU, as depicted in
Figure 4.2.

Ch
Pa
Figthe
A
ar
fe
en
GP
fo
op
GP
apter 4: GPUs
rallel GPU Arc
gure 4.2: Come CPU and GP
quick com
chitectural
atures only
nd GPU com
PUs devote
r data cach
ptimised for
PU features
s as Parallel Pr
chitectures for
parison of FloU (Nvidia, 201
mparison be
differences
a few proc
mprises thou
more trans
ing and flow
r low laten
a dedicated
F
rocessing Acce
r Multimodalit
oating-Point O14)
etween a C
s. As illustr
essor cores
usands of m
sistors to da
w control to
cy, GPUs a
d, high-spee
igure 4.3: Typ
elerators
ty Breast Lesio
perations per
CPU and a
rated in Fig
, e.g. 4 in ca
massively pa
ata process
o achieve lo
re optimise
ed memory
pical CPU and G
ons Character
Second (FLOP
GPU can
gure 4.3, un
ase of Intel’
rallel proce
ing, while C
ow latency.
ed for high
.
GPU architect
isation
PS) and memo
reveal the
nlike a typ
’s Core i7 se
ssing units.
CPUs count
As a result,
throughput
tures
K. Sidirop
ory bandwidth
eir fundame
ical CPU, w
eries, even a
In other w
on mechan
, while CPU
t. In additio
53
poulos
h for
ental
which
a low
ords,
nisms
s are
on, a

Chapter 4: GPUs as Parallel Processing Accelerators 54
Parallel GPU Architectures for Multimodality Breast Lesions Characterisation K. Sidiropoulos
This radical difference in the GPU’s architectures was shaped by the fact that real-
time computer graphics demand a highly parallel workload. Thus, GPUs combine
extremely high arithmetic throughput with high memory bandwidth as they were
designed exclusively to carry out numerous floating point calculations that determine
which screen pixels are to be lighted and how, 24 or even 60 times within a single
second. Over the last decades, this demand for more realistic graphics forged GPUs
to inherently support high data parallelism (Luebke and Humphreys, 2007).
Early on, as GPUs were getting more powerful and more programmable, researchers
began to seek ways to exploit this raw computational power for applications other
than graphics. Although certain algorithms and applications cannot benefit by the
GPU’s architecture, mainly because they are inherently sequential, many compute-
intensive science and engineering problems can leverage the GPU’s computational
“horsepower” and achieve tremendous speed-ups. Consequently, in 2002 the term
“General Purpose Computation on Graphics Processing Units” (GPGPU) was
introduced (Di Blas and Kaldewey, 2009).
Nevertheless, in those early years GPGPU was not an easy task as it required
researchers to map scientific problems onto native graphics operations that could be
represented by triangles and polygons, using graphics programming languages such
as OpenGL, Direct3D or Cg. In this rather obscure way, researchers “tricked” the GPU
to perform general purpose computations.
It wasn’t until the introduction of specialised GPU programming frameworks that the
use of GPUs for general problems began to gain momentum. In 2003, Stanford
University’s BrookGPU (Buck et al., 2003) and University of Waterloo’s Sh (McCool et
al., 2002) were the first programming models to expose the GPU as a general-
purpose processor in a high-level language.
In 2006, Nvidia introduced the Compute Unified Device Architecture (CUDA), the first
complete solution for GPGPU. CUDA included both hardware specifications, which
were implemented across all Nvidia’s GPU models, and software programming tools,

Chapter 4: GPUs as Parallel Processing Accelerators 55
Parallel GPU Architectures for Multimodality Breast Lesions Characterisation K. Sidiropoulos
that made the development of GPGPU applications an easier task (Nvidia, 2014).
Soon after its debut, CUDA technology was widely adopted by researchers who
employed this new GPU architecture to accelerate challenging, scientific,
traditionally CPU domain problems in various fields such as physics, mathematics,
chemistry, and biology (Che et al., 2008; Schenk et al., 2008).
In 2009, GPGPU had received so much attention that a group of major vendors,
including Nvidia, AMD Graphics, Intel, IBM and Apple, put their forces together and
created OpenCL, a new, cross-platform, parallel programming language (Khronos,
2008).
In the present work, the CUDA framework was selected over other GPU
programming platforms for the implementation of the proposed PR system, mainly
because, compared to OpenCL, CUDA was more mature and constituted a more
complete solution. Additionally, it has been argued that due to its portability,
OpenCL achieves lower performance compared to CUDA (Fang et al., 2011; Weber et
al., 2011; Kakimoto et al., 2012; Pallipuram et al., 2012).
4.5 GPU Architecture Overview
Since its introduction, Nvidia has released three distinct CUDA-capable GPU
architectures: i) Tesla-class GPUs, debuted in 2006, in the GeForce 8800 GTX (G80),
ii) Fermi-class GPUs were introduced in 2010, in the GeForce GTX 480 (GF100), and
iii) Kepler-class GPUs, debuted in 2012, in the GeForce GTX 680 (GK104). Although,
every new hardware class introduced new features, they all share common
architectural characteristics. The following paragraphs contain a brief description of
the key architectural concepts considered essential in understanding GPU
programming.
Typically, a GPU comes in the form of an individual card that can be plugged onto
one of the high speed IO bus slots of a computer workstation’s motherboard, such as

Ch
Pa
th
de
th
As
va
fo
tra
(D
ca
via
m
Un
GP
pa
do
fe
apter 4: GPUs
rallel GPU Arc
e PCI-expre
efined by th
e “host” ref
s presented
aries in size
und in cur
ansfers betw
DMA). As exp
ches. Instea
a a high ban
ultiple mem
nder the ho
PUs inheren
arallel with t
ozens. For
atured a tot
s as Parallel Pr
chitectures for
ess port. De
he chipset u
fers to the r
Figure 4.4
in Figure 4
among diff
rrent confi
ween the de
plained afo
ad, the dev
ndwidth ch
mory accesse
ood, the wo
nt parallelis
the others.
instance, t
tal of 16 SM
rocessing Acce
r Multimodalit
etails of the
used. The te
rest of the w
: Hardware st
4.4, the GPU
ferent GPU
gurations.
evice and th
re, GPU’s ar
vice connect
annel that
es in one clo
orkhorse of
sm stems fr
The numbe
he very fir
Ms while the
elerators
ty Breast Lesio
e connectio
erm “device
workstation
ructure of a w
U arrives w
models bu
CUDA ena
he host me
rchitecture
ts its dedica
reaches 512
ock cycle.
f the GPU i
rom the fac
er of SMs in
rst CUDA-ca
e GeForce G
ons Character
on between
e” is used t
, including t
workstation fea
ith its own
t up to 4 g
ables progr
mories thro
does not de
ated memo
2 bits in cer
s the Strea
ct that each
a CUDA GP
apable GPU
TX 280, fea
isation
the CPU a
to describe
the system’
aturing a GPU
device mem
gigabytes ca
ammers to
ough Direct
epend on co
ory with its
rtain GPU m
ming Multi
h of these S
PU may vary
U, the GeFo
tured a tota
K. Sidirop
nd the GPU
the GPU, w
s CPU.
U
mory. The l
an be comm
o perform
Memory Ac
omplex mem
processor c
models, ena
processor (
SMs execut
y from 2 to a
orce 8800
al of 30 SMs
56
poulos
U are
while
atter
monly
data
ccess
mory
cores
bling
(SM).
es in
a few
GTX,
s.

Ch
Pa
In
(S
wh
Te
m
28
an
apter 4: GPUs
rallel GPU Arc
the heart o
Ps), or CUD
hile every F
esla and Fer
entioned th
880 SPs in a
nd Fermi GP
s as Parallel Pr
chitectures for
of every SM
DA cores. O
Fermi-class
rmi GPUs h
hat, current
single GPU
PUs respecti
Figure 4
Figure 4
rocessing Acce
r Multimodalit
M, lies a num
On Tesla-cla
SM featur
ad a total o
tly, high end
chip. Figure
vely.
4.5: Block diag
4.6: Block diag
elerators
ty Breast Lesio
mber of pro
ss GPUs, ea
ed 2 group
of 240 SPs a
d Kepler-cla
es 4.5 and 4
gram of Tesla-c
ram of Fermi-
ons Character
cessing unit
ach SM fea
ps of 16 SP
and 512 SP
ass GPUs, su
4.6 present
class GPUs (W
-class GPUs (W
isation
ts called Str
atured one
Ps. Consequ
s respective
uch as the G
the block d
Wolfe, 2010)
Wolfe, 2010)
K. Sidirop
ream Proce
group of 8
uently, high
ely. It shoul
GK110b, fea
iagrams of T
57
poulos
ssors
SPs,
end
ld be
ature
Tesla

Ch
Pa
Fig
Ev
sh
(ex
op
bo
pr
Ev
co
tim
lea
ins
flo
of
GP
pe
fo
de
apter 4: GPUs
rallel GPU Arc
gure 4.7: Strea
very SP has
hared Specia
xponential,
perations. E
oth groups
resents the S
very single S
ode. Howeve
me. This wa
ads to high
struction ex
ow stateme
f every bran
PUs are suit
erformance
llowing diff
ecrease in p
s as Parallel Pr
chitectures for
aming Multipr
a single-pr
al Function
logarithm
specially fo
of SPs to
SM for both
SP has the
er, all SPs o
ay of execut
h performan
xecuted by e
nts. In case
nch path. It
table for da
through ta
ferent instr
erformance
rocessing Acce
r Multimodalit
rocessor of Te
recision floa
Units (SFU
mic, and t
r handling d
look like a
h architectu
capacity to
of the same
tion is calle
nce provide
each SP, du
threads wit
t should be
ta parallelis
ask parallel
ruction pat
e.
elerators
ty Breast Lesio
sla (left) and F
ating point
s) in each
trigonometr
double-prec
group of
res.
execute a
group exec
ed Single In
ed that the
e to a cond
thin a warp
e noted that
sm. In contr
ism on GPU
ths through
ons Character
Fermi-class (ri
and an inte
multiproces
ric function
cision instru
16 double-
thread, wh
cute the sa
struction, M
re is no sig
itional bran
p diverge, th
t this mode
rast, it is qu
Us, because
hout the a
isation
ght) GPUs (W
eger functio
ssor handle
ns) and d
uctions, Ferm
-precision u
ich is a piec
me instruct
Multiple Thr
gnificant div
nch (if-else)
he warp seri
el explains
uite difficult
e the existe
lgorithm re
K. Sidirop
ilt, 2013)
onal units, w
e transcende
double-prec
mi SM comb
units. Figure
ce of seque
tion at the s
read (SIMT)
vergence in
or other co
ialises execu
the reason
t to achieve
ence of thr
esults in se
58
poulos
while
ental
cision
bines
e 4.7
ential
same
) and
n the
ontrol
ution
why
high
reads
evere

Ch
Pa
An
th
SM
in
pr
W
Fo
fet
ex
pr
us
wa
ex
W
4.
A
de
ke
pr
apter 4: GPUs
rallel GPU Arc
nother CUD
at are exec
M to execut
four clock
recision inst
Warps are ve
or instance,
tch data fr
xecution to
rovided tha
sing a high d
arps while e
xtremely hig
Wilt, 2013).
6 The CU
kernel is a s
evice. On Te
ernel begins
rogram that
Figure 4.8
s as Parallel Pr
chitectures for
DA key-conc
uted in SIM
te one single
cycles. Acco
ruction for
ery importan
when the
rom memo
those threa
t there is e
degree of m
each Fermi-
gh number
UDA Execut
special func
esla-class h
s. Figure 4.8
multiplies a
8: Example of a
rocessing Acce
r Multimodalit
ept is the w
MT fashion. I
e-precision
ordingly, a
each of two
nt as they a
threads of
ory, the res
ads. In this
enough par
multithreadi
-class SM s
of active t
tion Mode
ction execut
ardware, e
8 provides a
a set of data
a GPU-based p
elerators
ty Breast Lesio
warp. A war
In particular
instruction
Fermi GPU
o warps in tw
are used by
one warp i
sponsible S
way, the S
rallelism, th
ng. Every T
upports up
threads (Fa
l
ted in a num
ach kernel
a small exam
a by the num
program that
ons Character
rp is a grou
r, a Tesla G
of every th
uses its 16
wo clock cy
y GPUs to hi
issue a time
M finds an
SPs are kep
he GPU tole
esla-class S
to 48 activ
rber, 2011;
mber of cop
completes
mple of how
mber 2, in p
multiplies a se
isation
up of thread
PU employs
hread across
SPs to exe
cles.
ide memory
e consumin
nother war
pt constantly
erates mem
M supports
ve warps. T
; Kirk and W
pies, or thre
execution
w the GPU e
parallel.
et of data by t
K. Sidirop
ds (currently
s the 8 SPs o
s an entire w
cute one si
y latency iss
ng instructio
p and swit
y occupied,
mory latenc
s up to 32 a
his results i
Wen-mei, 2
ads, by the
before the
executes a s
the number 2
59
poulos
y 32)
of an
warp
ngle-
sues.
on to
tches
, and
cy by
active
in an
2012;
GPU
next
small

Ch
Pa
Co
GP
lau
hie
Be
nu
ide
un
of
Th
re
en
sh
Fe
apter 4: GPUs
rallel GPU Arc
oncurrent e
PUs. Accord
unch a seq
erarchy of t
Fig
efore distrib
umber of bl
entified by
nique block
f threads pe
hreads with
gisters. Syn
nabled via a
hared memo
ermi respect
s as Parallel Pr
chitectures for
execution o
ding to the
quence of k
threads.
ure 4.9: Threa
buted to SM
ocks, and b
the combi
index withi
r block to 5
in a single
nchronisatio
a small sof
ory. The size
tively.
rocessing Acce
r Multimodalit
f different
execution
kernels on
ad hierarchy in
Ms for exec
blocks are, i
nation of i
n the grid (s
12 while Fe
block are a
on and data
ftware-man
e of this low
elerators
ty Breast Lesio
kernels is
model defi
the device
n the CUDA pr
cution, thes
in turn, gro
ts unique l
see Figure 4
ermi puts th
assigned on
sharing am
aged data
w-latency m
ons Character
supported
ined by CU
e. CUDA or
rogramming m
se kernel th
ouped into a
local index
4.9). Tesla li
e limit to 10
the same S
mong the th
cache shar
memory is 16
isation
by both Fe
DA, the ho
rganises eve
model (Nvidia,
hreads are
a grid. Ever
within the
mits the ma
024 threads
SM and uti
hreads of th
red among
6KB and 64
K. Sidirop
ermi and Ke
ost program
ery kernel
2014)
grouped in
y thread ca
block, and
aximum num
s.
lise its avai
he same blo
the SPs, c
KB on Tesla
60
poulos
epler
m can
as a
nto a
an be
d the
mber
lable
ock is
called
a and

Chapter 4: GPUs as Parallel Processing Accelerators 61
Parallel GPU Architectures for Multimodality Breast Lesions Characterisation K. Sidiropoulos
Additionally, blocks are not handled in an orderly fashion as their execution is
scheduled dynamically. As every SM executes warps of threads in parallel and
asynchronously, threads belonging to different blocks can exchange data only
through the device’s global memory. It must be noted that, although this is the only
device memory accessible from the host, its bandwidth is relatively low compared to
other types of memories.
Another characteristic of the CUDA execution model is that, until the advent of
Kepler-class hardware, dynamic parallelism was not supported. As a result, a thread
cannot launch a kernel and spawn more threads on Tesla and Fermi architectures.
4.7 Limitations of GPUs -Considerations
Modern GPUs are used as massively parallel processors to solve challenging scientific
problems. However, in order to fully exploit their tremendous computational power,
GPUs have to be appropriately utilised. Hence, understanding the GPU’s
programming model and its inherent limitations is considered vital while parallelising
algorithms and applications in order to achieve high performance.
Similarly to any parallel programming problem, the first step involves the
identification of specific parts of the code responsible for prolonging the execution
time. Keeping in mind Amdahl’s law, the aim is to increase the parallel part of the
algorithm, while decomposing the problem in a way that exposes enough parallelism
not only to populate all the SMs of the GPU but also to enable them to keep their SPs
busy and maximise throughput by multiple active threads. Furthermore, because
dynamic parallelism was not supported until the advent of Kepler-class GPUs, the
computational grain has to be identified and implemented in kernel functions.
The SIMT execution model of a GPU is suitable for data parallelism, as any thread
divergence, within the same warp, limits the overall efficiency. Therefore, GPU
kernels should be carefully designed in such a way that thread divergence is

Chapter 4: GPUs as Parallel Processing Accelerators 62
Parallel GPU Architectures for Multimodality Breast Lesions Characterisation K. Sidiropoulos
eliminated. To the programmer, this entails that use of conditional and flow control
statements should be avoided where possible; something that is hardly met in real
problems. Furthermore, the block size, i.e. the number of threads inside each block,
should be chosen as a multiple of the warp size, to maximise efficiency.
Another issue that could affect performance is the use of global device memory. Due
to the fact that data must be copied from the host to the device memory before
processing and results must be retrieved from the device memory afterwards, overall
speed-up is limited by the amount of data transfers, as they involve high latency.
Thus, one approach is to copy most, or if possible all, data to GPU and keep them
there. Additionally, kernels should be designed in a way that visits to global device
memory are minimised. If this cannot be applied, device memory accesses should be
optimised for contiguous data while enough threads need be introduced in order to
hide latency.
Other issues that should be considered include, among others, the use of single
instead of double precision operations in favour of performance, the size of kernels
that affects register usage, and the use of intrinsic functions instead of regular
functions whenever accuracy is not an issue (Farber, 2011; Kirk and Wen-mei, 2012;
Wilt, 2013).
In short, optimising GPU code, in order to maximise its performance, poses a
significant challenge when developing GPU-based applications, as it requires
tremendous efforts and it is usually problem-specific.

Chapter 4: GPUs as Parallel Processing Accelerators 63
Parallel GPU Architectures for Multimodality Breast Lesions Characterisation K. Sidiropoulos
4.8 Summary
In the present chapter the fundamentals of GPU’s architecture were presented. In
particular, GPU comprises thousands of massively parallel processing units. While
CPUs are optimised for low latency, GPUs are optimised for high computational
throughput. The introduction of specialised GPU programming frameworks rendered
the use of GPUs for general problems accessible to researchers. CUDA, includes both
hardware specifications, which were implemented across all Nvidia’s GPU models,
and software programming tools, that made the development of GPGPU applications
an easier task. Under the hood, the workhorse of the GPU is the Streaming
Multiprocessor (SM) while in the heart of every SM, lies a number of processing units
called Stream Processors (SP), or CUDA cores. Every single SP has the capacity to
execute a thread, i.e. a piece of sequential code, in a Single Instruction, Multiple
Thread (SIMT) fashion, which leads to high performance provided that there is no
significant divergence in the instruction executed among the SPs of the same SM.

Parallel GPU Architectures for Multimodality Breast Lesions Characterisation K. Sidiropoulos
Chapter 5
Chapter 5. System Design and Implementation
5.1 Overview
This chapter describes in detail and in a systematic way the steps followed
throughout the whole CAD (PR- system) design procedure such as protocols
followed and software designed for multimodality data collection, methods
of feature generation and reduction, classifiers designed and tested for
execution on GPU and in parallel using the CUDA framework, and evaluation
methods employed for assessing system precision and acceleration of system
design.

Chapter 5: System Design and Implementation 65
Parallel GPU Architectures for Multimodality Breast Lesions Characterisation K. Sidiropoulos
5.2 Data Collection and Clinical Material
Women scheduled for yearly screening breast examination or with clinical symptoms
of breast pathology were subjected to digital mammography (DM). Those having
further findings were also submitted to ultrasound (US) examination. Both DM and
US examinations were conducted by the same experienced radiologist at the
Department of Radiology of the Delta Digital diagnostic centre, Athens, Greece.
Subjects assessed lower than III in the BI-RADS (Breast Imaging Reporting and Data
System, according to American College of Radiology) categorisation were excluded
from the study. Those having BI-RADS score of III or higher were submitted to
surgical biopsy for histological verification. Hence, tumour specimens, excised from
each patient by a physician, were histologically verified.
Finally, the selected dataset comprised both DM and US images from 62 female
patients; thirty two (32) were diagnosed as malignant (Ductal Carcinomas In Situ,
Ductal Infiltrating Carcinomas, Infiltrated Lymph Nodes, Mucoid Carcinomas) and
thirty (30) as benign tumours (Adenolipomas, Cysts, Fibroadenomas, Lipomas,
Papillomas). The mean age of the patients with malignant lesions was 50.6 years old
(standard deviation: 8.4; range: 34-73 years) and of the patients with benign lesions
was 47.3 years old (standard deviation: 9.6; range: 35-72 years). Table 5.1 and Figure
5.1 provide a summary of the dataset used for the purposes of this research.
All US examinations were performed on a General Electric Logiq 9 US system
featuring a linear, 3D/4D-capable probe operating at 8-16 MHz, while the DM system
utilised for this study was a General Electric Senographe Essential. Both diagnostic
imaging devices were regularly checked by a professional medical physicist in order
to safeguard them against degradation of their image quality. Thus, the contrast
resolution, the spatial resolution, the contrast-to-noise ratio and other image quality
measures were assessed on a regular basis and the devices were calibrated
accordingly.

Ch
Pa
Fig
5.
At
pa
gu
hapter 5: Syste
rallel GPU Arc
Table datase
Be
Mali
gure 5.1: Perce
3 Ethical
t this point,
atients’ sen
uidelines an
em Design and
chitectures for
5.1: A summaet.
nign Cases
ignant Cases
entages of be
Issues
it should be
sitive data
d regulation
d Implementat
r Multimodalit
ary of the veri
Brea
A
F
s Ducta
Infiltr
Infiltrati
Infiltratin
Mu
nign and malig
e underline
was perfor
ns.
tion
ty Breast Lesio
ified breast ca
ast Lesions D
Adenolipoma
Cyst
Fibroadenom
Lipid Oil Cyst
Lipoma
Papilloma
l Carcinoma
rated Lymph
ng Ductal Ca
ng Lobular Ca
ucoid Carcino
gnant breast c
ed that colle
rmed in acc
ons Character
ancer cases co
Dataset
a
ma
t
In Situ
Node
arcinoma
arcinoma
oma
cancer cases i
ection and p
cordance w
isation
omprising the
2
6
16
2
3
1
2
1
27
1
1
n the collecte
processing o
ith well-est
K. Sidirop
collected
Total
30
Total
32
d dataset.
of every pie
tablished et
66
poulos
ce of
thical
Chapter 5: System Design and Implementation 67
Parallel GPU Architectures for Multimodality Breast Lesions Characterisation K. Sidiropoulos
In particular, all data collected for the purposes of this research was handled in
compliance with the EU Data Protection Directive, or also known as Directive
95/46/EC (Directive, 1995). Adopted by all EU countries, EU Data Protection Directive
aims to protect the privacy of all personal data collected for, or about citizens,
especially as it relates to processing, using, or exchanging such data.
Thus, multimodality breast images and accompanying demographic, clinical and
histological data were collected following a written permission from the individual,
obtained by the physician in charge of the patient. For this purpose the subject was
provided with an informative document, an appropriate form (see Appendix B) to
give her consent and with sufficient time to reach a decision.
Regardless of the patient’s decision, whether to participate in the study or not, she
got the best available treatment and care, as under no circumstances did the data
collection process represent a risk for the patient or did it interfere with the standard
treatment and diagnostic work-up.
All personal data were handled anonymously and the identity of the subjects
involved remained known only to the physician responsible in the diagnostic centre.
Therefore, data pertaining to patients were anonymised and a running number was
issued for each person. Finally, any and all anonymised patient information was kept
in a secure database which was accessible only to the authorised researchers
involved.
5.4 Breast Lesions’ Delineation
The next step involved the delineation and extraction of Regions of Interest (ROIs).
Hence, from both the US (512x384) and DM (2394x3062) images, lesions were
outlined by the radiologist, who delineated the boundaries of each tumour
employing a specially designed software. ROIs, thus, outlined by the physician (see
Figure 5.2), were stored and were subsequently used in the design of the PR-system.

Ch
Pa
Figpre
Im
lan
to
co
de
pla
an
De
To
Or
we
hapter 5: Syste
rallel GPU Arc
gure 5.2: Fromesents the RO
mageNotes w
nguage vers
view and
ombines th
evelopment
atform-inde
nother. Sof
evelopment
oolkit was
racle’s Java
ere employ
em Design and
chitectures for
m each case OIs from a beni
was a custo
sion 1.5, sol
d manipulat
e principle
t of modula
ependent, i.
ftware dev
t Environm
utilised for
Advanced
ed for deco
d Implementat
r Multimodalit
Digital Mammign case while
m made de
lely for the
te DICOM
es of Objec
r programs
.e. to be ab
velopment
ent – IDE.
reading, v
Imaging (JA
oding JPEG
tion
ty Breast Lesio
mography ande the second ro
sktop applic
purposes of
images. JA
ct Oriented
and reusab
le to move
was assi
Additional
validating a
AI) and the
images, ma
ons Character
d Ultrasound ow presents a
cation deve
f this resear
AVA was c
d Programm
ble code, w
easily from
sted by t
ly, PixelMe
and viewing
e associated
ainly due to
isation
ROIs were dea malignant ca
eloped in Jav
rch, which e
chosen ma
ming (OOP
with the adv
m one compu
the Netbe
ed’s, open
g of DICOM
d Image I/O
the fact th
K. Sidirop
elineated. Firsase
va program
enabled the
inly becaus
), enabling
vantage of b
uter platfor
eans Integr
source, DI
M images, w
O Tools libr
hat the Java
68
poulos
st row
ming
user
se it
g the
being
rm to
rated
COM
while
raries
a SDK

Ch
Pa
ca
wi
th
Figsof
5.
Fr
fe
an
fro
fro
wa
hapter 5: Syste
rallel GPU Arc
nnot alway
ith delineat
e aforemen
gure 5.3: Screeftware enable
5 Feature
om each im
atures quan
nd comprise
om the ROI
om the ROI
as represen
em Design and
chitectures for
ys handle co
ted ROIs we
ntioned app
enshot of the ed the physicia
e Extractio
mage-ROI, a
ntified text
ed: four (4)
’s co-occur
I’s run-leng
nted by an
d Implementat
r Multimodalit
orrectly JPEG
ere stored i
lication is p
custom madean to browse f
on
a large num
ural proper
features fr
rence matr
th matrices
eighty (80)
tion
ty Breast Lesio
G Lossless co
in an XML f
presented in
e software devfor a case and
mber of tex
rties of eac
om the RO
ices (averag
s (average a
features v
ons Character
ompression
file (see Ap
n Figure 5.3.
veloped for th delineate the
xtural featu
ch tumour,
I’s histogram
ge and rang
and range v
vector, whic
isation
n. Patient in
ppendix A).
he purposes oe region of int
ures was ca
as describe
m, twenty s
ge values),
values). Thu
ch consisted
K. Sidirop
formation a
A screensh
of this researcherest
alculated. T
ed in chapt
six (26) feat
and 10 feat
us, each pa
d of 40-feat
69
poulos
along
ot of
h. The
These
er 3,
tures
tures
atient
tures

Chapter 5: System Design and Implementation 70
Parallel GPU Architectures for Multimodality Breast Lesions Characterisation K. Sidiropoulos
extracted from the DM image and 40-features computed from the US image. For
further analysis, data were split into three different configurations: (i) the US
dataset, containing one class with 32 malignant patterns and one class with 30
benign patterns, each pattern containing 40 features, (ii) the DM dataset, containing
one class with 32 malignant patterns and one class with 30 benign patterns, each
pattern containing 40 features, and (iii) the US-DM dataset, containing one class with
32 malignant patterns and one class with 30 benign patterns, each pattern
containing 80 features. A full list of textural features employed is presented in Table
5.2.
Table 5.2: List of textural features employed in the current study along with their abbreviations for DM and US
Histogram Grey Level Co-occurrence Matrices* Grey Level Run Length Matrices*
Mean Value (MV) Angular Second Moment (ASM) Grey Level Non Uniformity (GLNU) Standard Deviation (SD) Contrast (CONTR) Run Length Non Uniformity (RLNU)Skewness (SKEW) Correlation (COR) Long Run Emphasis (LRE) Kurtosis (KURT) Autocorrelation (ACOR) Short Run Emphasis (SRE) Sum of Squares (SOQ) Run Percentage (RP) Inverse Difference Moment (IDM) Entropy (ENTR) Sum of Entropy (SENTR) Sum Average (SAV) Sum of Variance (SVAR) Difference Variance (DVAR) Difference Entropy (DENTR) Variance (VAR) *For these features both the average and the range values over four directions (0°, 45°, 90°, 135°) wereincluded
Figure 5.4 illustrates the flow diagram of the procedure followed for creating the
three datasets. Each dataset was used separately in the design of the PR-system so
as to investigate the benefit of employing multimodality imaging data.

Ch
Pa
hapter 5: Syste
rallel GPU Arc
Figure 5
em Design and
chitectures for
5.4: The flow d
d Implementat
r Multimodalit
diagram of the
tion
ty Breast Lesio
e procedure fo
ons Character
ollowed for cre
isation
eating the thr
K. Sidirop
ee datasets
71
poulos

Chapter 5: System Design and Implementation 72
Parallel GPU Architectures for Multimodality Breast Lesions Characterisation K. Sidiropoulos
All features in each dataset were normalised to zero mean and unit standard
deviation, according to Equation 3.26. As stated in chapter 3, feature normalisation
was mandatory in order to avoid bias, since features with higher values have a
stronger impact on the design of the classifier (Theodoridis and Koutroumbas, 2003).
Implementation of all textural features was performed in accordance with the
explicit equations described in chapter 3.
Features were also tested for their discriminatory capacity between the two classes,
by employing the non-parametric Wilcoxon statistical test (Hollander and Wolfe,
1999). Features that were found to sustain statistically significant differences
between the two classes at the 0.005 statistical level (p<0.005) were used to draw
conclusions (see chapter 6) as to existing differences in texture between the two
types of lesions (i.e. benign-malignant).
5.6 Classifier Selection
The choice of the classifier, which was employed in the proposed PR-system, was
influenced by the complexity of the design process. The design process involved the
determination of a feature-combination with highest classification accuracy. To
optimally determine this feature combination, an exhaustive search among all
possible features is required. However, searching amongst all features (e.g. 80
features for the combined US-DM multimodal dataset) to find the best features-
combination is, in terms of processing time, a highly demanding task. The classifier
would, thus, have to be fast in execution and of high discriminatory ability. A number
of candidate classifiers were considered, such as the k-NN, the Bayesian, the PNN,
the LDA and the SVM. The discriminatory power of the different classifiers was
tested employing the following suboptimal procedure: Features were first ranked
according to the composite test given in Equation 3.29, where the Wilcoxon non-
parametric test is combined with the correlation coefficient, so that highest ranked
features would be of high discriminatory value and be least correlated with the rest

Chapter 5: System Design and Implementation 73
Parallel GPU Architectures for Multimodality Breast Lesions Characterisation K. Sidiropoulos
of the features, which is a pre-requisite in the design of PR-systems (Theodoridis and
Koutroumbas, 2003). Features were thus ranked in descending order and the first 10
features were tested exhaustively in the design of the classifiers. This design could be
easily materialised in an ordinary desktop pc. As illustrated in Table 5.3, the
Probabilistic Neural Network (PNN) proved more efficient in terms of accuracy,
complexity, and processing time, for the dataset (US and DM combined) of the
present study. Thus, the PNN was employed in the GPU implementation of the PR-
system.
Table 5.3: The list of candidate classifiers with their respective accuracy Classifier Overall Accuracy LOO(%) Number of features employed
k-NN 79 5 PNN 82 5 LDA 75 4 Bayesian 76 3 SVM (RBF) 78 4
5.7 PR System Design
PR-system design consisted of a) forming the classifier by means of Equation 3.37
employing various combinations of textural features and b) evaluating the
performance of the classifier, in discriminating between benign and malignant
lesions, using the available datasets and evaluation methods described in chapter 3.
The aim was to determine the optimum PR-system design, i.e. obtain highest
classification accuracy with the least number of textural features. Three feature
selection methods were used, two sub-optimal and one optimal (Theodoridis and
Koutroumbas, 2003; Gunal et al., 2009). Moreover, two evaluation methods were
considered, the LOO (Theodoridis and Koutroumbas, 2003; Gunal et al., 2009) and
the ECV (Ambroise and McLachlan, 2002).
5.8 Feature Selection Methods
In the first suboptimal feature selection method, as was previously mentioned, a
criterion was formed for each feature, by combining the Wilcoxon statistical test (i.e.

Chapter 5: System Design and Implementation 74
Parallel GPU Architectures for Multimodality Breast Lesions Characterisation K. Sidiropoulos
the feature’s between-classes separability criterion) and the feature’s correlation
with rest of the features (Theodoridis and Koutroumbas, 2003), since the least
correlated features are expected to form combinations of high discriminatory power.
That criterion ranked features in descending order and the first ten highly ranked
features were retained for further processing. Next, the exhaustive search was
employed to form all possible feature-combinations amongst the selected 10 top-
ranked features. Each combination was employed to design the PNN and the
classification accuracy of the design was evaluated by means of the leave-one-out
method. Finally, the whole cycle of “exhaustively forming feature combinations -
designing the PNN - evaluating the performance by the LOO method” eventually
revealed the particular best design.
The second suboptimal features selection method utilised the sequential backward
selection (SBS) technique (see chapter 3), using as class separability criterion the
performance of the PNN classifier itself. The accuracy of the PNN design was tested
at each feature combination formed by the SBS by means of the LOO evaluation
method. Briefly, the SBS starts by selecting all n features and testing the classification
accuracy by the LOO method. Then it forms all possible feature combinations of n-1
features retaining that combination with the best classification accuracy. The
procedure is repeated using the latter best combination of n-1 features down to one
feature. Then the combination that has provided the highest classification accuracy
with the least number of features is chosen as the best design.
The optimal feature selection method consisted of forming all possible feature
combinations of up to k features out of the n originally available features (see
chapter 3). The number of possible combinations is enormous (see Equation 3.31),
considering the number of 80 features involved in the design. To illustrate the
complexity of the problem, if all possible, up to six (6) features, combinations were to
be formed out of, say, forty (40) originally existing features in the US dataset alone,
about 4.5 million combinations would have resulted. For each feature combination, if
we were to test the accuracy of the PNN classification by the LOO method, the PNN

Chapter 5: System Design and Implementation 75
Parallel GPU Architectures for Multimodality Breast Lesions Characterisation K. Sidiropoulos
would have to be re-designed as many times as the number of available patterns in
both classes, i.e. 62 designs, to get the performance of the PNN design for each
feature-combination, resulting in more than 280 million re-designs. This could only
be accomplished by exploiting the parallelism of the GPU card.
5.9 PR-System Performance Evaluation
As explained in detail in chapter 3, the leave-one-out evaluation method operates by
leaving one pattern out, training the classifier with the rest of the patterns, and
classifying the left-out pattern. This cycle is repeated for all patterns. The class, to
which the left-out pattern is assigned by the classifier, is then compared with its true
class. The results of correctly and/or wrongly classified left-out patterns are
presented in the form of a truth-table (Theodoridis and Koutroumbas, 2003). The
latter indicates the number of correctly/incorrectly classified left-out patterns in
both classes and, hence, the sensitivity (prediction rates for malignant lesions) and
specificity (prediction rates for benign lesions) of the classification of the PR-system.
As it has been shown in a previous study (Ambroise and McLachlan, 2002), the LOO
method introduces a bias in the calculation of the PR-system’s performance, since
the same dataset is used to design and evaluate the PR-system. The external-cross-
validation method (ECV) may be adopted instead, in order to get a realistic
assessment of the PR-system’s performance to “unseen” data. Accordingly, the
dataset is randomly split into two non-overlapping subsets: the training subset
(70%), which is used to design the classifier by means of the exhaustive features
search and LOO methods, and the test subset (30%), which comprises the input to
the system to be classified. This process was repeated ten (10) times and the average
ECV accuracy is calculated, as an assessment of the PR-system’s classification
accuracy to new, “unseen” by the system, data.

Ch
Pa
5.
To
em
tra
ha
th
Su
cla
so
Th
ex
In
va
an
FigseqGP
hapter 5: Syste
rallel GPU Arc
10 Paralle
o deal with
mploying th
ansferred o
ad to be spl
at run conc
uch single t
assifier by o
o-designed c
he overall d
xecuted by a
detail, the
ariable initia
nd vice versa
gure 5.5: Blockquentially exe
PU; and step 6
em Design and
chitectures for
el Processin
the enormo
he exhaust
n to the mu
it into smal
currently on
ask, runnin
one combin
classifier by
design proc
a single CPU
e tasks resp
alisation, an
a, are all exe
k diagram desecuted on the6 is executed in
d Implementat
r Multimodalit
ng GPU Pla
ous comput
ive search
ulti-process
l tasks whic
the differe
ng on a sep
ation of fea
the LOO ev
cess (see F
U thread, an
ponsible for
nd memory
ecuted in se
scribing the tre CPU; steps 3n parallel on t
tion
ty Breast Lesio
atform
tational dem
and the E
ors of the G
ch were loa
nt cores of
parate GPU
atures and t
valuation me
Figure 5.5)
nd a parallel
r loading o
y copies/tra
equence by
aining of the 3, 5 and 7 refehe GPU, empl
ons Character
mands of th
ECV metho
GPU card. T
ded on sing
the GPU-m
thread in p
then to asse
ethod.
included a
l part execu
f the traini
nsfers from
the CPU (se
proposed PR ser to memoryloying numero
isation
he PR-syste
ds, process
The classifie
gle GPU-thre
ultiprocesso
parallel, wa
ess the perf
sequentia
ted exclusiv
ing subset,
m host PC t
ee Figure 5.
system, steps y transactionsous threads.
K. Sidirop
m design, w
sing had to
r design pro
eads separa
ors.
as to design
formance o
l part, whi
vely by the
the arrays
to GPU mem
6)
1, 2, 4, 8 ands between CPU
76
poulos
when
o be
ocess
ately,
n the
of the
ch is
GPU.
s and
mory
d 9 are U and

Ch
Pa
FigexeGP
hapter 5: Syste
rallel GPU Arc
gure 5.6: Theecuted task o
PU
em Design and
chitectures for
e flow diagramn CPU. Right p
d Implementat
r Multimodalit
m of the PR-part illustrates
tion
ty Breast Lesio
-system desigs the same tas
ons Character
gn task. Left sk as it has be
isation
part illustrateeen modified t
K. Sidirop
es the sequeto run in para
77
poulos
ntially llel on

Ch
Pa
Re
wi
PN
ac
ve
Figfeatecfea
Re
FO
EN
Ca
Sto
Figco
hapter 5: Syste
rallel GPU Arc
egarding the
ith a single
NN classifie
ccuracy by m
ersion of the
gure 5.7: The tature combinachnique. In evature combina
ad feature co
OR each patter
SET Pj,i as
Leave Pj,i
Train PNN
Classify te
NDFOR
lculate overal
ore At in Devic
gure 5.8: Psembination.
em Design and
chitectures for
e kernel cod
feature com
r with this
means of t
e proposed
task of each thation and evavery case the ation.
mbination Ct [
rn Pj,i in the tra
s the test patte
out of the tra
N with the rem
est pattern X
l accuracy At f
ce global mem
udocode illus
d Implementat
r Multimodalit
de running
mbination a
unique fea
he LOO me
implementa
hread, runningaluate its clasoutput of eac
[F1, F2, F3…Fn]
aining dataset
ern X
aining dataset
maining datase
and UPDATE t
for feature co
mory strating the P
tion
ty Breast Lesio
in all GPU S
as input and
ature comb
ethod as pr
ation is give
g concurrentlysification accu
ch thread was
from Device g
t
et and using f
truth table in l
mbination Ct
PNN training
ons Character
SPs in paral
d is assigned
bination and
resented in
en in Figure
y, was to trainuracy by meathe overall a
global memory
eature combin
local memory
in each CUD
isation
llel, each GP
d with the t
d evaluate
Figure 5.7
5.8.
n the PNN clasans of the leaccuracy achie
y
nation Ct
A thread t fo
K. Sidirop
PU thread i
task to train
its classifica
. A pseudo
ssifier with a uve-one-patterved for the sp
or a single fe
78
poulos
s fed
n the
ation
ocode
unique rn-out pecific
eature

Chapter 5: System Design and Implementation 79
Parallel GPU Architectures for Multimodality Breast Lesions Characterisation K. Sidiropoulos
Figure 5.5 shows a schematic diagram of the parallel computation of the tasks,
involving the GPU. For the parallel processing set-up to function on the GPU
processors, a large bunch of feature combinations were first organised in a batch and
were transferred from the host CPU to the global memory of the GPU. There, the
feature combinations were loaded onto an equal number of GPU-threads, where the
task of designing the classifier and evaluating its precision by the LOO method was
executed concurrently.
All possible feature combinations up to length k were generated employing an
algorithm inspired by Donald Knuth (Koepf, 2009). Decomposing the task of PR
design in this way, led to maximising the portion of the problem that could be
processed in parallel; that parallel portion constituted 99.99% of the program and
thus rendered plausible the achievement of high acceleration in performance.
Features’ normalisation in each concurrently running thread had been a priori
calculated on the CPU to avoid excess global memory access.
As illustrated in Figure 5.6, feature combinations were transferred from the host PC
memory onto the GPU’s global memory in batches of 80,000 feature-combinations,
right before each GPU kernel launch. For example, the first batch transfer contained
combinations of one, two, three, etc. features until the batch-size of 80,000
combinations was filled. Regarding thread configuration, Block and Grid sizes were
experimentally set to [128 x 1] and [625 x 1], respectively, while the batch size was
selected so as to be a multiple of the block size (128 threads). The selected block size
allowed 4 warps per SM. Upon completion of all threads in the launch, results were
transferred back to the host PC memory and the kernel was launched for the next
batch of 80,000 feature combinations. The cycle of batch transfer of feature
combinations and parallel processing was repeated until all tasks of the cycle were
completed (see Figure 5.9). Especially for the Fermi-class GPU, the number of
feature-combinations in each batch was set to 160,000, which are organised in 1250
blocks of 128 threads each.

Chapter 5: System Design and Implementation 80
Parallel GPU Architectures for Multimodality Breast Lesions Characterisation K. Sidiropoulos
Read training dataset
Copy training dataset to Device Memory
Set S the maximum size of batch
REPEAT
WHILE there is another features combination = TRUE AND batch size <S
Generate next feature combination
Add combination to batch
Increment batch size
ENDWHILE
Copy batch to Device Memory
Launch PNN Kernel on Device using S threads*
Wait until all threads in batch have finished
Copy results to Host Memory
Empty batch
UNTIL there is another features combination = FALSE
Identify the feature combination that achieved the highest classification accuracy during training
Figure 5.9: Pseudocode illustrating Host implementation not including the ECV method
For the ECV evaluation method, a number of similar training tasks was executed,
where the whole ECV-cycle of classifier training-classification had to be repeated ten
times, with guidance from the host-PC’s CPU. Specifically for the ECV, the tasks
responsible for loading of the complete dataset, division of dataset in training and
test subsets, and memory copies/transfers from host PC to GPU memory and vice
versa, were executed in sequence by the CPU.

Chapter 5: System Design and Implementation 81
Parallel GPU Architectures for Multimodality Breast Lesions Characterisation K. Sidiropoulos
GPU cards used were NVIDIA’s GeForce 8800GT featuring 112 CUDA cores and
GeForce 580GTX featuring 512 CUDA cores. Their specifications are presented in
detail in the Table 5.4. Figure 5.10 displays the kernel used to design the proposed
GPU-based PR system
Table 5.4: Specifications of the GPUs employed in this research
Model GeForce 8800 GT GeForce GTX 580 Number of multiprocessors 14 16 Cores per multiprocessor 8 32 Number of CUDA cores 112 512
Total global memory 512 MB GDDR3 1536 MB GDDR5 Shared memory per block 16 KB 48 KB Memory interface width 256 bits 384 bits Memory clock/Data Rate 920 MHz/1840 MHz 2100 MHz/4200 MHz
Warp size 32 32 Core clock/Shader clock 700 MHz/1715 MHz 832 MHz/1664 MHz
CUDA compute capability 1.1 2.0
__global__ void GPUSingleCombination_LOO_PNN( // Pointer to the dataset stored in global memory float* features, // Pointer to the mean values lookup table stored in global memory float* meanFeatures, // Pointer to the standard deviations lookup table stored in global memory float* stdvFeatures, // Size of dataset – Number of patterns int D_SIZE, // Defines the point in dataset where class 2 begins int CDIVIDER, // Max number of features int P_SIZE , // Pointer to all possible feature combinations stored in global memory int* combination , // Pointer to the size of each feature combination int* combinationSize, // Pointer to an array used to store the overall accuracy // for each possible feature combination float* overallAccuracy ) { //Unique thread identifier int index = (blockIdx.x * blockDim.x) + threadIdx.x; //Various variables int i, k, c1; unsigned int combK; float unknownP[20]; int class1Count, class2Count;

Chapter 5: System Design and Implementation 82
Parallel GPU Architectures for Multimodality Breast Lesions Characterisation K. Sidiropoulos
float p = 2.0f; float sigma = 0.24f; float pi = 3.14159f; float distance, distanceInP; float denominator = 2.0f * powf(sigma,2); float denominatorP = 0.0f; float tempSum, tempExpSum, expvar; int classSelected=0; float g1 = 0.0; float g2 = 0.0; int truthTable[2][2]; truthTable[0][0] =0; truthTable[0][1] =0; truthTable[1][0] =0; truthTable[1][1] =0; //Get the size of the specific combination unsigned int COMBINATION_SIZE = combinationSize[index]; // For all patterns // Apply Leave one out method for(i=0; i<D_SIZE; i++){ classSelected=1; if(i<CDIVIDER) classSelected=0; //If 0 then patterns belongs to Class 1 else it belongs to Class 2 // Copy unknown pattern from global memory and normalise it for(k=0; k<P_SIZE; k++){ unknownP[k] = ( features[(i * P_SIZE) + k] - meanFeatures[(i * P_SIZE) + k] ) / (float) stdvFeatures[(i * P_SIZE) + k]; } // Calculate discriminant PNN function for Class 1 class1Count = 0; tempExpSum = 0.0; for(c1=0; c1<CDIVIDER; c1++) { if(c1!=i){ // NOT the left-out pattern class1Count++; // Calculate square distance tempSum = 0.0; for(k=0; k<COMBINATION_SIZE; k++){ combK = combination[ (index * P_SIZE) + k ]; distance = unknownP[ combK ] - ( ( features[ (c1 * P_SIZE) + combK ] – meanFeatures[ (i * P_SIZE) + combK ] ) / (float) stdvFeatures[ (i * P_SIZE) + combK ] ); distanceInP = powf( distance , 2); tempSum = tempSum + distanceInP; } expvar = expf( - tempSum/denominator); tempExpSum = tempExpSum + expvar; }//if(c1!=i) } denominatorP = powf( 2.0f * pi , (COMBINATION_SIZE/2) ) * powf( sigma , COMBINATION_SIZE); g1 = tempExpSum / ( denominatorP * class1Count); // Calculate discriminant PNN function for Class 2 class2Count = 0; tempExpSum = 0.0; for(c1=CDIVIDER; c1<D_SIZE; c1++) { if(c1!=i){ // NOT the left-out pattern class2Count++; // Calculate square distance tempSum = 0.0; for(k=0; k<COMBINATION_SIZE; k++){

Chapter 5: System Design and Implementation 83
Parallel GPU Architectures for Multimodality Breast Lesions Characterisation K. Sidiropoulos
combK = combination[ (index * P_SIZE) + k ]; distance = unknownP[ combK ] - ( ( features[ (c1 * P_SIZE) + combK ] – meanFeatures[ (i * P_SIZE) + combK ] ) / (float) stdvFeatures[ (i * P_SIZE) + combK ] ); distanceInP = powf( distance , 2); tempSum = tempSum + distanceInP; } expvar = expf( - tempSum/denominator); tempExpSum = tempExpSum + expvar; }//if(c1!=i) } denominatorP = powf( 2.0f * pi , (COMBINATION_SIZE/2) ) * powf( sigma , COMBINATION_SIZE); g2 = tempExpSum / ( denominatorP * class2Count); //Fill up the truth table if(g1>=g2){ truthTable[classSelected][0]++; } else{ truthTable[classSelected][1]++; } } //Calculate OverallAccuracy for this feature combination float OverallAccuracy = 0.0f; OverallAccuracy = (truthTable[0][0] + truthTable[1][1]) * 100 / (truthTable[0][0] + truthTable[0][1] + truthTable[1][0] + truthTable[1][1] ); //Update the value in global memory overallAccuracy[index] = OverallAccuracy; //Wait for all threads to reach this point __syncthreads(); }
Figure 5.10: The kernel used to design the proposed GPU-based PR system

Chapter 5: System Design and Implementation 84
Parallel GPU Architectures for Multimodality Breast Lesions Characterisation K. Sidiropoulos
5.11 Summary
This chapter described in detail and in a systematic way the steps followed
throughout the whole PR-system design. Data collected included images of 62
patients with histologically verified (benign or malignant) breast lesions, who
underwent both ultrasound (US) and digital mammography (DM) examinations.
Lesions were outlined on the images by an experienced radiologist employing a
custom-made software tool, and 40 features were calculated from the texture of the
outlined lesions, for each one of the two modalities used. Thus each patient was
represented by an 80 features vector. A PR-system was designed to provide highest
possible precision by programming in parallel the multiprocessors of the NVIDIA’s
GPU-cards, GeForce 8800GT or 580GTX, and using the CUDA programming
framework and C++. The PR-system was built around the Probabilistic Neural
Network classifier and its performance was evaluated by the LOO method, for
estimating the system’s highest accuracy, and by the ECV method, for assessing the
PR-system’s unbiased accuracy to new, “unseen” by the system, data.

Parallel GPU Architectures for Multimodality Breast Lesions Characterisation K. Sidiropoulos
Chapter 6
Chapter 6. System Evaluation
6.1 Overview
In this chapter, results are presented regarding the achieved classification
accuracy and GPU acceleration on system design. Additionally, textural
features involved in the best design feature combination are analysed as to
the information they convey and their significance in medical diagnosis of
breast cancer.
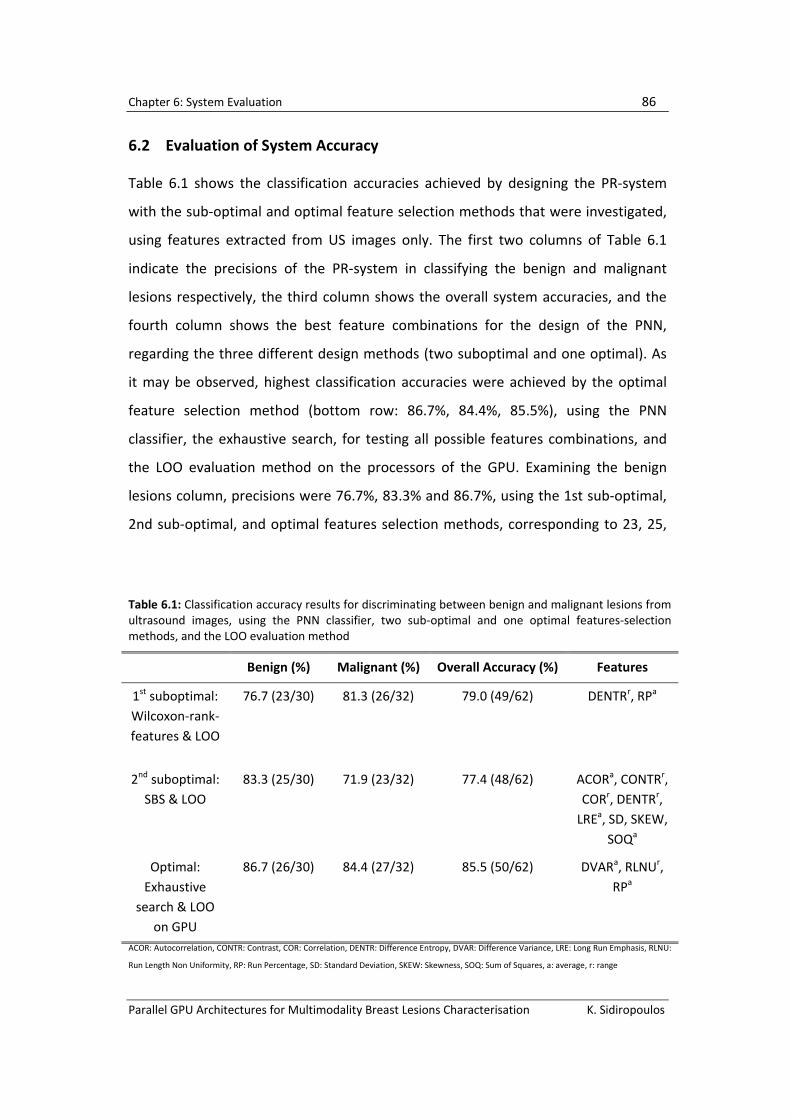
Chapter 6: System Evaluation 86
Parallel GPU Architectures for Multimodality Breast Lesions Characterisation K. Sidiropoulos
6.2 Evaluation of System Accuracy
Table 6.1 shows the classification accuracies achieved by designing the PR-system
with the sub-optimal and optimal feature selection methods that were investigated,
using features extracted from US images only. The first two columns of Table 6.1
indicate the precisions of the PR-system in classifying the benign and malignant
lesions respectively, the third column shows the overall system accuracies, and the
fourth column shows the best feature combinations for the design of the PNN,
regarding the three different design methods (two suboptimal and one optimal). As
it may be observed, highest classification accuracies were achieved by the optimal
feature selection method (bottom row: 86.7%, 84.4%, 85.5%), using the PNN
classifier, the exhaustive search, for testing all possible features combinations, and
the LOO evaluation method on the processors of the GPU. Examining the benign
lesions column, precisions were 76.7%, 83.3% and 86.7%, using the 1st sub-optimal,
2nd sub-optimal, and optimal features selection methods, corresponding to 23, 25,
Table 6.1: Classification accuracy results for discriminating between benign and malignant lesions from ultrasound images, using the PNN classifier, two sub-optimal and one optimal features-selection methods, and the LOO evaluation method
Benign (%) Malignant (%) Overall Accuracy (%) Features
1st suboptimal: Wilcoxon-rank-features & LOO
76.7 (23/30) 81.3 (26/32) 79.0 (49/62) DENTRr, RPa
2nd suboptimal: SBS & LOO
83.3 (25/30) 71.9 (23/32) 77.4 (48/62) ACORa, CONTRr, CORr, DENTRr,
LREa, SD, SKEW, SOQa
Optimal: Exhaustive
search & LOO on GPU
86.7 (26/30) 84.4 (27/32) 85.5 (50/62) DVARa, RLNUr, RPa
ACOR: Autocorrelation, CONTR: Contrast, COR: Correlation, DENTR: Difference Entropy, DVAR: Difference Variance, LRE: Long Run Emphasis, RLNU:
Run Length Non Uniformity, RP: Run Percentage, SD: Standard Deviation, SKEW: Skewness, SOQ: Sum of Squares, a: average, r: range
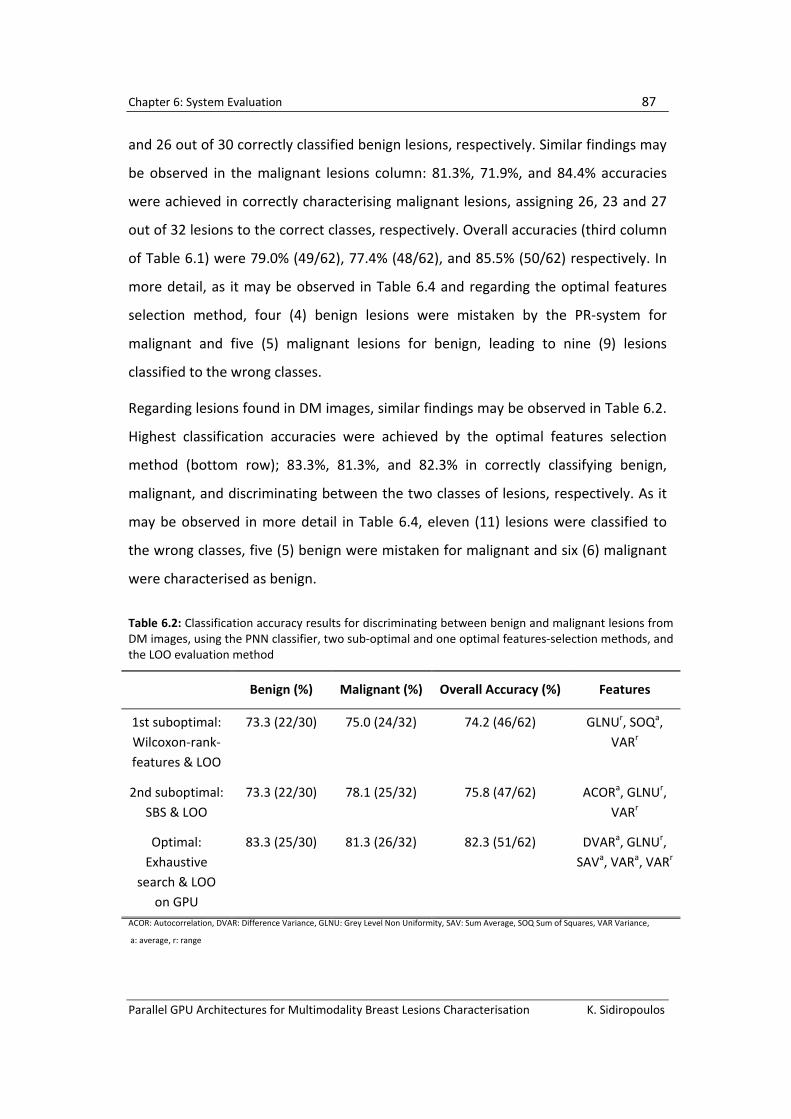
Chapter 6: System Evaluation 87
Parallel GPU Architectures for Multimodality Breast Lesions Characterisation K. Sidiropoulos
and 26 out of 30 correctly classified benign lesions, respectively. Similar findings may
be observed in the malignant lesions column: 81.3%, 71.9%, and 84.4% accuracies
were achieved in correctly characterising malignant lesions, assigning 26, 23 and 27
out of 32 lesions to the correct classes, respectively. Overall accuracies (third column
of Table 6.1) were 79.0% (49/62), 77.4% (48/62), and 85.5% (50/62) respectively. In
more detail, as it may be observed in Table 6.4 and regarding the optimal features
selection method, four (4) benign lesions were mistaken by the PR-system for
malignant and five (5) malignant lesions for benign, leading to nine (9) lesions
classified to the wrong classes.
Regarding lesions found in DM images, similar findings may be observed in Table 6.2.
Highest classification accuracies were achieved by the optimal features selection
method (bottom row); 83.3%, 81.3%, and 82.3% in correctly classifying benign,
malignant, and discriminating between the two classes of lesions, respectively. As it
may be observed in more detail in Table 6.4, eleven (11) lesions were classified to
the wrong classes, five (5) benign were mistaken for malignant and six (6) malignant
were characterised as benign.
Table 6.2: Classification accuracy results for discriminating between benign and malignant lesions from DM images, using the PNN classifier, two sub-optimal and one optimal features-selection methods, and the LOO evaluation method
Benign (%) Malignant (%) Overall Accuracy (%) Features
1st suboptimal: Wilcoxon-rank-features & LOO
73.3 (22/30) 75.0 (24/32) 74.2 (46/62) GLNUr, SOQa, VARr
2nd suboptimal: SBS & LOO
73.3 (22/30) 78.1 (25/32) 75.8 (47/62) ACORa, GLNUr, VARr
Optimal: Exhaustive
search & LOO on GPU
83.3 (25/30) 81.3 (26/32) 82.3 (51/62) DVARa, GLNUr, SAVa, VARa, VARr
ACOR: Autocorrelation, DVAR: Difference Variance, GLNU: Grey Level Non Uniformity, SAV: Sum Average, SOQ Sum of Squares, VAR Variance,
a: average, r: range

Chapter 6: System Evaluation 88
Parallel GPU Architectures for Multimodality Breast Lesions Characterisation K. Sidiropoulos
Combining features from the two modalities, US and DM, classifications improved,
with the optimal features selection method achieving highest accuracies, 90%,
96.9%, and 93.5% (bottom row in Table 6.3) in correctly classifying benign,
malignant, and discriminating between the two classes of lesions, respectively. As it
may be observed in more detail in Table 6.4, four (4) lesions were misclassified, three
(3) benign were classified as malignant and one (1) malignant was characterised as
benign. In particular, those misclassified cases comprised three (3) Fibroadenomas
and one (1) Infiltrating Ductal Carcinoma. These high accuracy results were achieved
using four (4) features from DM (standard deviation, sum of squares, sum average,
short run emphasis) and two (2) features from US (difference entropy and short run
emphasis). Figure 6.1 combines data from Tables 6.1, 6.2 and 6.3 and presents the
overall accuracies achieved by the two sub-optimal and one optimal features-
selection methods, and the LOO evaluation method using the three datasets.
Table 6.3: Classification accuracy results for discriminating between benign and malignant lesions using combined features from ultrasound (US) and digital mammography (DM) images, and employing the PNN classifier, two sub-optimal and one optimal features-selection methods, and the LOO evaluation method
Benign (%) Malignant (%) Overall
Accuracy (%) Features
1st suboptimal: Wilcoxon-rank-features & LOO
80.0 (24/30) 87.5 (28/32) 83.9 (52/62) SENTRr_DM, KURT_US, DENTRr_US, RPa_US
2nd suboptimal: SBS & LOO
73.3 (22/30) 90.6 (29/32) 82.3 (51/62) MV_DM, SKEW_DM, ASMr_DM, SVARa_DM, SKEW_US, DENTRr_US,
RPa_US
Optimal: Exhaustive
search & LOO on GPU
90.0 (27/30) 96.9 (31/32) 93.5 (58/62) SD_DM, SOQr_DM, SAVa_DM, SREa_DM, DENTRr_US, SREa_US
ASM: Angular Second Moment, DENTR: Difference Entropy, KURT: Kurtosis, MV: Mean Value, RP: Run Percentage, SAV: Sum Average, SD: Standard
Deviation, SENTR: Sum of Entropy, SKEW: Skewness, SOQ: Sum of Squares, SRE: Short Run Emphasis, SVAR: Sum of Variance, a: average, r: range,
_DM: features from DM images and _US: feature from US images
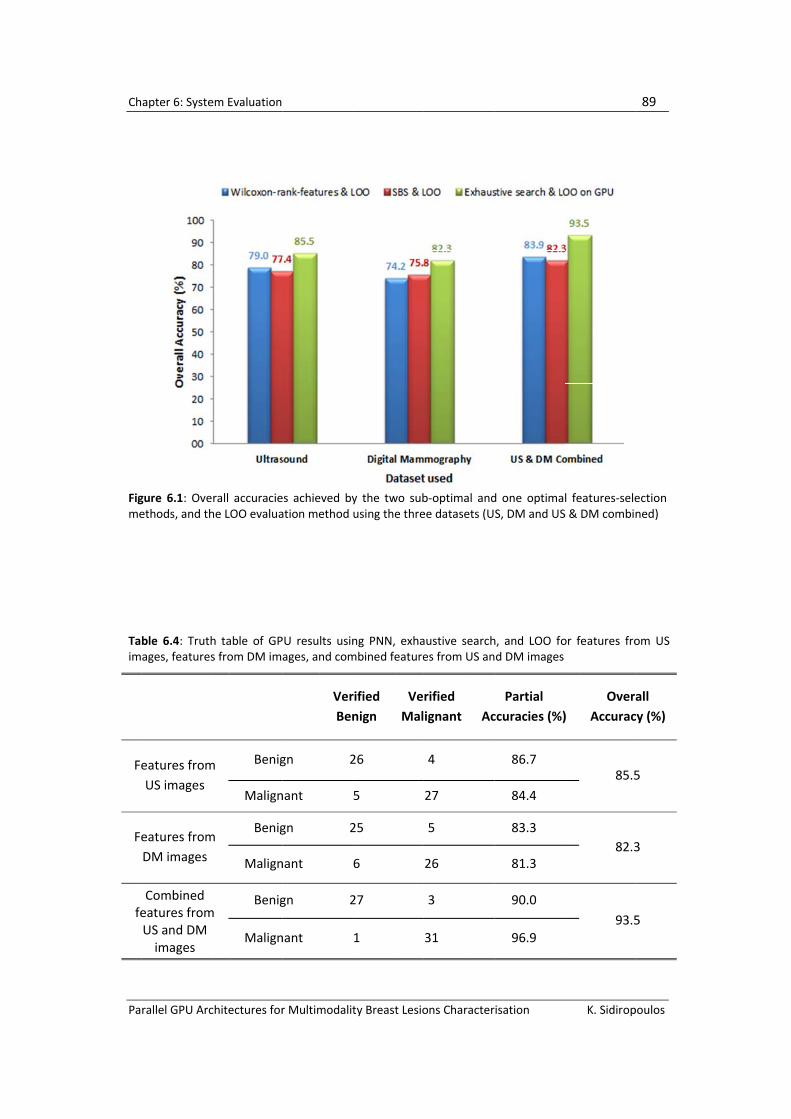
Ch
Pa
Figme
Taim
Fe
Fe
fe
apter 6: Syste
rallel GPU Arc
gure 6.1: Oveethods, and th
ble 6.4: Truthages, features
eatures fromUS images
eatures fromDM images
Combined eatures fromUS and DM
images
em Evaluation
chitectures for
rall accuraciehe LOO evalua
h table of GPs from DM im
m Benig
Malign
m Benig
Malign
m Benig
Malign
r Multimodalit
es achieved byation method
PU results usinages, and com
VerBen
gn 2
nant
gn 2
nant
gn 2
nant
ty Breast Lesio
y the two subusing the thre
ng PNN, exhambined feature
rified nign
VeMal
26
5
25
6
27
1
ons Character
b-optimal andee datasets (U
austive searches from US an
rified ignant Ac
4
27
5
26
3
31
isation
d one optimaS, DM and US
h, and LOO fod DM images
Partial ccuracies (%)
86.7
84.4
83.3
81.3
90.0
96.9
K. Sidirop
l features-sele
S & DM combin
or features fro
) Overa
Accurac
85.5
82.3
93.5
89
poulos
ection ned)
om US
all cy (%)
5
3
5

Ch
Pa
Pa
ap
Figapfro
Fig
lea
US
ha
(d
(Q
be
apter 6: Syste
rallel GPU Arc
artial and o
pplied on GP
gure 6.2: Partiplied on GPU,
om US and DM
gure 6.3 (a)
ast-squares
S, DM, and
ave transfor
imensionali
QLS) mappin
enign and m
em Evaluation
chitectures for
overall accu
PU, for all th
al and overall, using feature
M images
), (b), and (
rule), of th
both US an
rmed the be
ity is equal
ng process
malignant les
r Multimodalit
uracies achi
hree datase
accuracies aces from US im
c) demonst
he best feat
d DM textu
est feature c
to the nu
(Ahmed an
sions, respe
ty Breast Lesio
eved via th
ts are graph
chieved via themages, feature
trate transf
ture vectors
ural features
combination
mber of cla
nd Rao, 197
ectively.
ons Character
he optimal
hically illust
e optimal feats from DM im
ormed scat
s in the opt
s, respective
ns spaces in
asses) by th
75). Triangle
isation
feature sel
rated in Fig
ture selection mages, and com
tter diagram
timal design
ely. Those s
nto two-dim
he quadrat
es and stars
K. Sidirop
lection met
ure 6.2.
method and Lmbined featur
ms (by quad
n method, u
scatter diag
mensional sp
ic least squ
s correspon
90
poulos
thod,
LOO, es
dratic
using
rams
paces
uares
nd to
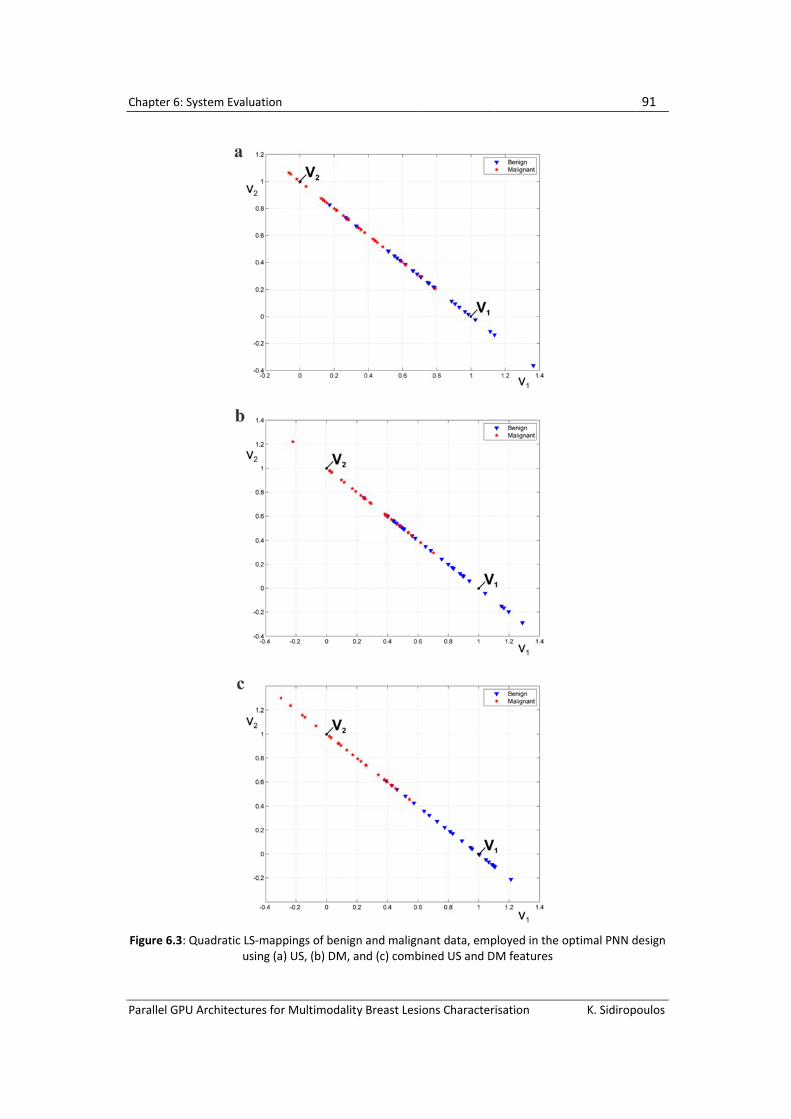
Ch
Pa
Fig
apter 6: Syste
rallel GPU Arc
gure 6.3: Quad
em Evaluation
chitectures for
dratic LS-mapusing (a
r Multimodalit
pings of benig) US, (b) DM,
ty Breast Lesio
gn and malignand (c) combi
ons Character
ant data, empned US and D
isation
ployed in the oDM features
K. Sidirop
optimal PNN d
91
poulos
design

Ch
Pa
Fig
de
wi
sq
ult
th
be
FigopSqr: r
Ta
th
apter 6: Syste
rallel GPU Arc
gure 6.4 sh
esign. The m
ithin the bo
quares (ran
trasound: d
e difference
etween the
gure 6.4: Box-ptimal PNN de
uares, SAV: Surange, _DM: fe
able 6.5 sho
e 10-fold e
em Evaluation
chitectures for
hows boxpl
median of t
oxes. Of the
ge), sum
difference e
e entropy (
two classes
-plots of the esign. The featum Average, Seatures from
ws the class
external cro
r Multimodalit
ot diagram
the feature
e six featur
average (m
entropy (ran
range) sust
s of lesions.
six textural ftures’ values aSRE: Short RuDM images an
sification re
oss-validatio
ty Breast Lesio
s of the fe
e values are
es from DM
mean), sho
nge) and sh
ained statis
features that are not norma
un Emphasis, Dnd _US: featur
esults obtain
on method,
ons Character
eatures use
e represent
M dataset (s
rt run em
hort run em
stically signi
formed the balised. (STD: SDENTR: Differre from US im
ned when th
using com
isation
ed in the o
ted by the
standard de
phasis (me
mphasis (me
ificant diffe
best feature cStandard Devience Entropy,ages.
he PR-syste
bined US a
K. Sidirop
ptimal clas
horizontal
eviation, su
ean), and
ean)), only
erence (p<0
combination iation, SOQ: S, where a: ave
m was teste
and DM tex
92
poulos
sifier
lines
m of
from
one,
.005)
in the um of erage,
ed by
xtural
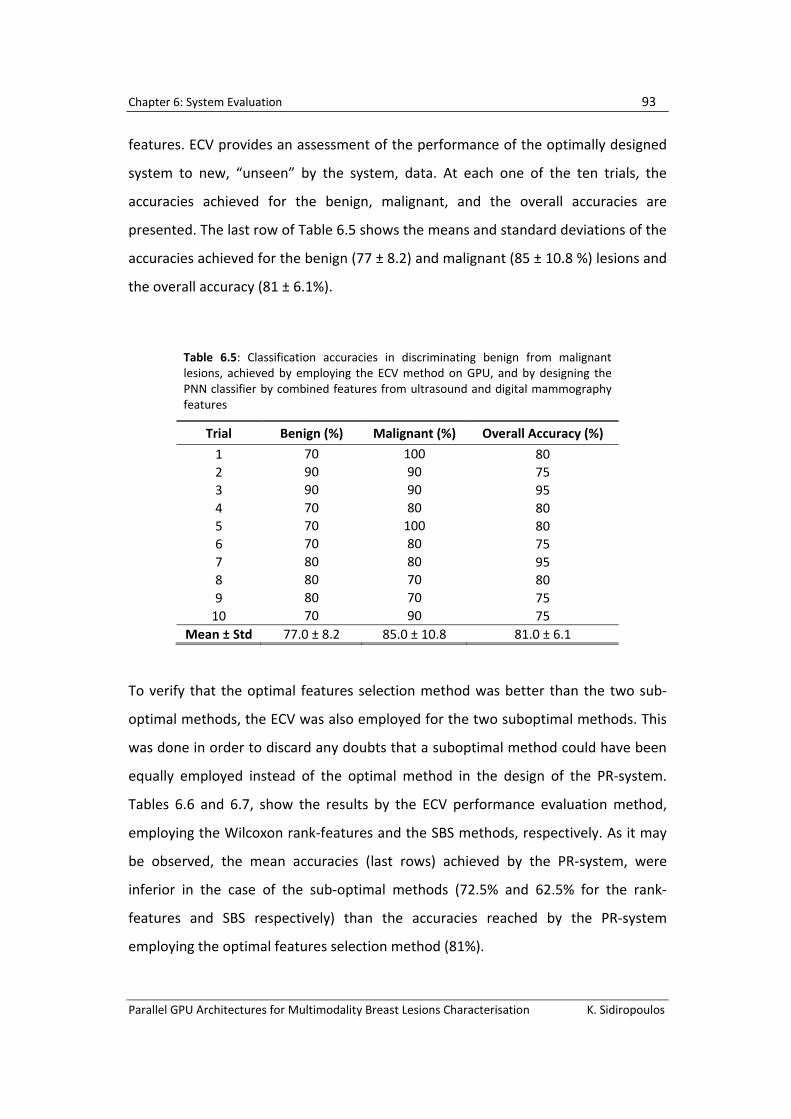
Chapter 6: System Evaluation 93
Parallel GPU Architectures for Multimodality Breast Lesions Characterisation K. Sidiropoulos
features. ECV provides an assessment of the performance of the optimally designed
system to new, “unseen” by the system, data. At each one of the ten trials, the
accuracies achieved for the benign, malignant, and the overall accuracies are
presented. The last row of Table 6.5 shows the means and standard deviations of the
accuracies achieved for the benign (77 ± 8.2) and malignant (85 ± 10.8 %) lesions and
the overall accuracy (81 ± 6.1%).
Table 6.5: Classification accuracies in discriminating benign from malignant lesions, achieved by employing the ECV method on GPU, and by designing the PNN classifier by combined features from ultrasound and digital mammography features
Trial Benign (%) Malignant (%) Overall Accuracy (%) 1 70 100 80 2 90 90 75 3 90 90 95 4 70 80 80 5 70 100 80 6 70 80 75 7 80 80 95 8 80 70 80 9 80 70 75
10 70 90 75 Mean ± Std 77.0 ± 8.2 85.0 ± 10.8 81.0 ± 6.1
To verify that the optimal features selection method was better than the two sub-
optimal methods, the ECV was also employed for the two suboptimal methods. This
was done in order to discard any doubts that a suboptimal method could have been
equally employed instead of the optimal method in the design of the PR-system.
Tables 6.6 and 6.7, show the results by the ECV performance evaluation method,
employing the Wilcoxon rank-features and the SBS methods, respectively. As it may
be observed, the mean accuracies (last rows) achieved by the PR-system, were
inferior in the case of the sub-optimal methods (72.5% and 62.5% for the rank-
features and SBS respectively) than the accuracies reached by the PR-system
employing the optimal features selection method (81%).

Chapter 6: System Evaluation 94
Parallel GPU Architectures for Multimodality Breast Lesions Characterisation K. Sidiropoulos
Table 6.6: ECV Wilcoxon-rank-features Classification accuracies in discriminating benign from malignant lesions, achieved by employing the ECV method on GPU, and by designing the PNN classifier by combined features from US and DM features
Trial Benign (%) Malignant (%) Overall Accuracy (%) (Number of Features)
1 33.3 100.0 66.7 (3) 2 33.3 83.3 58.3 (4) 3 66.7 83.3 75.0 (4) 4 66.7 100.0 83.3 (4) 5 66.7 66.7 66.7 (5) 6 66.7 83.3 75.0 (5) 7 83.3 83.3 83.3 (3) 8 66.7 83.3 75.0 (4) 9 66.7 83.3 75.0 (3)
10 33.3 100.0 66.7 (4) Mean ± Std 58.3 ± 18.0 86.7 ± 10.5 72.5 ± 7.9
Table 6.7: ECV SBS Classification accuracies in discriminating benign from malignant lesions, achieved by employing the ECV method on GPU, and by designing the PNN classifier by combined features from US and mammography features
Trials Benign (%) Malignant (%) Overall Accuracy (%) (Number of Features)
1 100.0 83.3 91.7 (7) 2 50.0 83.3 66.7 (8) 3 66.7 50.0 58.3 (8) 4 33.3 66.7 50.0 (8) 5 66.7 50.0 58.3 (3) 6 50.0 100.0 75.0 (9) 7 66.7 66.7 66.7 (9) 8 66.7 50.0 58.3 (6) 9 33.3 66.7 50.0 (7)
10 50.0 50.0 50.0 (10) Mean ± Std 58.3 ± 19.6 66.7 ± 17.6 62.5 ± 13.2

Chapter 6: System Evaluation 95
Parallel GPU Architectures for Multimodality Breast Lesions Characterisation K. Sidiropoulos
6.3 Evaluation of GPU acceleration on System Design
In order to evaluate the performance of the developed GPU-based PR-system, a
series of experiments on two different NVidia GPU cards (GeForce 8800GT and
580GTX) was performed and the required training time was measured. The latter
was then compared with the respective training time of the same classifier running
on a typical CPU (Intel Core 2 Quad) and programmed in C programming language.
Hence, both systems were trained with a dataset, consisting of 62 patterns that
progressively increased their feature dimensions, beginning with 20 features and
reaching 80 by a step of 10. In every case, all feature combinations up to size of 6
were exhaustively examined. Table 6.8 presents this comparative performance
assessment illustrating in detail the design time required by both the GPU and CPU-
based PR-system varying the number of features exhaustively examined. The GPU-
based PR-system achieved about 25 times faster design, on the 8800GT and about
150 times faster on the 580GTX. Considering the problem at hand, for eighty features
Table 6.8: Comparative performance assessment varying the total number of features in the dataset (all time measurements have been averaged over 10 runs)
Total Number of Features [Number of
features exhaustively combined]
Number of unique feature
combinations
PNN Training Time for 62 patterns (s)
CPU
GPU #1: GeForce 8800GT CPU/GPU#1 Training
Time
GPU #2: GeForce 580GTX CPU/GPU#2 Training
Time Processing Transfer Total Processing Transfer Total
20[6] 60459 150.80 5.98 0.02 6.01 25.11 0.98 0.01 0.99 151.62
30[6] 768211 1978.94 78.22 0.20 78.42 25.24 11.91 0.13 12.04 164.30
40[6] 4598478 11990.42 473.68 1.39 475.07 25.24 80.14 0.60 80.73 148.52
50[6] 18260635 48129.67 1973.77 6.64 1980.41 24.30 325.05 2.48 327.53 146.95
60[6] 56049057 >>24h 6438.80 27.61 6466.41 N/A 1007.56 8.54 1016.10 N/A
70[6] 144193119 >>24h 16806.96 79.43 16886.39 N/A 2656.10 25.16 2681.26 N/A
80[6] 326207196 >>24h 38907.82 199.58 39107.40 N/A 6210.93 65.81 6276.74 N/A

Ch
Pa
av
10
ag
pr
ta
Fig88(Gpo
Ad
Op
em
fo
in
th
a
sy
co
apter 6: Syste
rallel GPU Arc
vailable and
0 hours) on
gainst much
rocessing tim
sks.
gure 6.5: Com00GT and 580PUs or CPU) e
ool of 20, 30,..,
dditionally,
penMP fram
mploying all
r all the afo
training tim
e task of ex
pool of 60
stem design
ore against 3
em Evaluation
chitectures for
sixty two l
the GeForc
h more tha
me requirem
mparative eva0GTX) and staexecuting the,or 80 feature
in order to
mework was
four CPU c
orementione
me over the
xhaustively
features (re
n required
39,080 secs
r Multimodalit
esions (ben
ce 8800GT,
an 24 hou
ments for th
luation of proandard CPU s same task, bs
o exploit th
s utilised an
cores was ev
ed training
e original co
searching a
esulting in o
152,415 sec
s (or about 1
ty Breast Lesio
nign and ma
6276 secs
rs on the
he two GPU
ocessing timesystem (Intel by forming all
he full proc
nd the time
valuated. Th
tasks, was b
ode running
ll possible f
over 56 mil
cs (or abou
10.9 hours)
ons Character
alignant), it
(or less tha
CPU. Figur
s and the C
es for 2 differCore 2 Quadpossible com
cessing pote
required fo
he CPU’s mu
boosted res
g on a single
feature com
lion unique
t 42.3 hour
employing
isation
took 39,107
an 2 hours)
re 6.5 show
CPU for acco
rent NVidia G). Times refer
mbinations of
ential of th
or the same
ulti-core tim
sulting in a 4
e CPU core
mbinations o
e feature co
rs) running
all 4 CPU c
K. Sidirop
7 secs (or a
on the 580
ws compar
omplishing s
GPU cards (Ger to the proce6 features wi
he CPU too
e processing
me performa
4-fold redu
. According
of up to 6 w
ombinations
on a single
cores. This is
96
poulos
about
0GTX,
rative
same
eForce essors thin a
, the
g task
ance,
ction
ly, in
within
s), PR
CPU
s still

Ch
Pa
sig
GP
se
ev
wi
ac
(1
20
iss
a l
et
Figagaco
apter 6: Syste
rallel GPU Arc
gnificantly lo
PU impleme
earching all
ven the 4 C
ithin 24 ho
chieved in a
53 cases) a
0 feature co
sues. For th
larger numb
al., 2012).
gure 6.6: Comainst the nummbinations fro
em Evaluation
chitectures for
ower comp
entation. In
possible fea
CPU cores, r
urs. Figure
similarly de
nd the train
ombinations
is particula
ber of patte
mparative assember of patter
om a pool of 2
r Multimodalit
ared to the
n the more
ature comb
running in
6.6 presen
emanding sc
ning task of
s from a po
r experimen
erns, was em
essment of CPrns in the data20 features
ty Breast Lesio
1,016 secs
computati
binations wi
parallel, did
ts a compa
cenario, wh
searching e
ool of 20 fea
nt, a datase
mployed for
PU (single andaset, for the t
ons Character
(or about 1
onally inten
thin a pool
d not mana
arative eval
here the num
exhaustively
atures is pla
et used in a
r benchmark
d multi-core) aask of classifie
isation
17 minutes)
nsive tasks
of 70 or ev
age to com
uation of th
mber of pat
y for combi
ausible, wit
previous st
king purpos
and GPUs (88er training wit
K. Sidirop
achieved by
of exhaust
ven 80 feat
plete PR de
he perform
tients has gr
nations of u
thout overfi
tudy, conta
ses (Sidiropo
800GT and 580th up to 20 fe
97
poulos
y the
tively
ures,
esign
mance
rown
up to
itting
ining
oulos
0GTX) eature

Chapter 6: System Evaluation 98
Parallel GPU Architectures for Multimodality Breast Lesions Characterisation K. Sidiropoulos
Figure 6.6 presents training times achieved by the host CPU (single and multi-core)
and the GPUs (8800GT and 580GTX) against the number of patterns included in the
dataset. As it is illustrated, the aforementioned task requires 26,280 secs (or about
7.3 hours) running on a single core of the CPU and 6,850 secs (or about 1.9 hours)
utilising all 4 cores of the CPU. However, the same task takes 998 secs (or about 17
minutes) on the GeForce 8800GT, and 99 secs on the 580GTX.
In addition, the GPU-based PR-system was also tested on more advanced and
powerful GPU models featuring NVidia’s newest Kepler architecture. In particular,
the same computationally demanding task required 59 secs running on the Tesla
K20c and only 35 secs running on the GeForce GTX 780 Titan.
6.4 Discussion on the Results
The designer of a PR-system is often faced with a high dimensionality problem, as
was the case of the present study, and the designer may either resort to feature
reduction methods, such as the rank-features, that would probably compromise the
PR-system’s precision, or make use of powerful computation hardware, such as
supercomputers or server clusters. Those, however, are expensive solutions and
beyond the reach of most designers. The other alternative is the powerful processors
of the graphics cards, commonly used in desktop computers but specially designed to
deal with demanding 3-D graphics required in the games industry, which, in
conjunction with parallel programming methods, can provide significant savings in
processing times. Previous studies have employed similar measures to tackle
processing time demanding image processing procedures, such as implementations
of neural networks (Oh and Jung, 2004), Support Vector Machines (Kecman, 2001),
K-Nearest Neighbour (Beliakov and Li, 2012), tomographic reconstruction algorithms
(Xu and Mueller, 2007), image registration methods (Lapeer et al., 2010; Shams et
al., 2010), and dose simulation (Berg et al., 2008).

Chapter 6: System Evaluation 99
Parallel GPU Architectures for Multimodality Breast Lesions Characterisation K. Sidiropoulos
Regarding the workload requirements of the present study, those were set by (a) the
eighty textural features, forty from each modality in the combined US-DM dataset,
(b) the number of lesions contained in both classes, (c) the features reduction-
selection method, (d) the type of classifier, and (e) the evaluation method to test the
accuracy of the design and the system’s precision to new, “unseen” by the PR-
system, data. It is easy to assess the workload required to design the PR-system
employing an optimal features selection method, such as the exhaustive search
method. First, a rule of thumb, as to the maximum numbers of features that may be
combined in the design of the classifier and at the same time safeguard against over-
fitting, is to allow for combinations to be formed of up to one third of the size of the
smallest class (30 patterns in the benign class), which in our case was 10 features-
combinations (Foley, 1972). Thus, searching within 80 features to form all possible
feature-combinations of up to ten features would require an enormous effort. To
quantify the immensity of the problem, Figure 6.5 illustrates a comparative
evaluation of the required processing times for various datasets. As it may be
observed, it required more than 24 hours for the CPU to sequentially process up to 6
features combinations; in fact, processing had to be interrupted as it would have
taken approximately 261 hours, or more than 10 days to be completed. The number
of combinations required was 326,207,196, which may be estimated by Equation
3.31, where n is the number of features (n=80) and k is the size of feature
combinations (k=1, 2,…, 6). It has to be stressed that for each features-combination,
the performance of the system had to be evaluated by the leave-one-out method,
which dictated that the classifier had to be redesigned as many times as was the
number of data in both classes. Such processing time requirements, however,
rendered the system design on a single CPU unrealisable (Karahaliou et al., 2008).
Additionally, employing a parallel PR design strategy on the CPU, by utilising all the
available cores, could provide a boost in performance, which in the current case is
proportional to the number of cores engaged (4-fold increase in speed). However,
Chapter 6: System Evaluation 100
Parallel GPU Architectures for Multimodality Breast Lesions Characterisation K. Sidiropoulos
the handful of cores inside a typical CPU falls short against the massive parallelism
provided by the hundreds of CUDA cores residing in the GPU (512 cores in 580GTX).
Therefore, employing parallel processing programming techniques on the powerful
processors of the GPUs at hand, allowed for optimal system design techniques to be
employed (i.e. exhaustive search and LOO) and, thus, to obtain system designs with
improved classification accuracy. Explicitly, various classifiers were tested on the
available data such as the Probabilistic Neural Network (PNN), the k-nearest
neighbour (k-NN), the linear discriminant analysis (LDA), the non-linear Bayesian, and
the more sophisticated support vector machines (SVM) with Gaussian kernel. The
PNN displayed best behaviour, in terms of ease of training, classification
performance and precision and it was, thus, adopted in the final design of the
system.
The GPU technology adopted made also possible the fine tuning of the PNN’s
parameters, such as the smoothing parameter in the discriminant function gj of the
PNN, given by Equation 3.37, which was varied between 0.10 and 0.90, each time
checking the achieved overall system accuracy, and finally fixing its value to 0.24, as
it provided the highest overall system accuracy.
Another finding, which is evident from Tables 6.1-6.3 and Tables 6.5-6.7, was that
classification accuracies, achieved by the optimal system design methods on the
GPUs, outperformed the suboptimal design methods and that when textural features
from both modalities were combined, system precision improved significantly.
Tables 6.3 and 6.4 show the highest classification accuracies achieved (93.5%) when
features from both digital mammography and ultrasound were combined in the
design of the classifier. Also illustrated in the box-plots of Figure 6.4, those textural
features were the standard deviation, sum of squares, sum average, short run
emphasis, and difference entropy that quantify specific image textural properties.
The standard deviation (STD) is a measure of pixel intensity variation, signifying that
on digital mammography, benign lesions were found of smoother texture than

Chapter 6: System Evaluation 101
Parallel GPU Architectures for Multimodality Breast Lesions Characterisation K. Sidiropoulos
malignant ones. The range of sum of squares (SOQr) is a measure of anisotropy in
grey-levels variance; the SOQr was higher in the benign lesions, implying that SOQ
varied more among benign lesions. The mean of sum average (SAVa) is an indirect
measure of inhomogeneity, in terms of the existence of structures with variation in
grey-levels; it attains higher values in coarser textures, thus on digital mammography
malignant lesions displayed coarser texture than benign lesions. The short run
emphasis (SREa) indicates the existence of small structures within the lesion. SRE was
found lower in the malignant than in the benign lesions. The range of difference
entropy (DENTRr) is a measure of anisotropy in grey-levels randomness; the DENTRr
was found higher in the normal lesions, indicating that DENTR differed more within
benign lesions on ultrasound. Since the DENTRr was the only textural feature that
displayed significant statistical differences (p<0.005) between the two classes
(benign-malignant lesions), that feature can only be considered as sound evidence of
the differences in texture between the two classes of lesions. Another important
finding is that high precision pattern recognition systems may be designed by
combining textural features that do not necessarily sustain statistical significant
differences among the classes. This may become evident by inspection of Figure 6.3,
which is a display of the QLS-mapping diagram of the members of the two classes,
formed by employing the particular six-features combination in the combined DM-US
dataset. As it can be observed, there is good class separation with insignificant class-
overlap. These results were only plausible by the employment of the parallel
processing capabilities of the GPU processors, since more textural features could be
searched by examining, in realistic processing times, all possible (up to six) features
combinations exhaustively. Additionally, due to speed of execution, classifier design
parameters could be easily modified and tested on our data, thus assisting in the
optimal system design. Our findings are comparable to those of previous studies,
however tested on different databases. The highest accuracy in discriminating
between benign and malignant breast lesions achieved by our PR-system was 93.5%,
using the LOO evaluation method and employing both US and DM images. This

Chapter 6: System Evaluation 102
Parallel GPU Architectures for Multimodality Breast Lesions Characterisation K. Sidiropoulos
accuracy corresponds to 0.92 area under the ROC curve (AUC). It should be
mentioned that AUC is equal to the probability that the designed classifier ranks a
randomly chosen malignant pattern higher than a randomly chosen benign pattern.
Therefore, it measures the classifier's skill in ranking a set of patterns according to
the degree to which they belong to the malignant or benign class (Theodoridis and
Koutroumbas, 2003). Previous studies using also LOO have found: Yuan et al (Yuan et
al., 2010) AUC=0.87, using digital mammography and magnetic resonance imaging,
Drukker et al (Drukker et al., 2005) AUC=0.92, using mammography and sonography
images, Horsch et al (Horsch et al., 2006) AUC=0.92, using mammography and
sonography. In all those studies it has been shown that the employment of
multimodality imaging data improves the precision of the CAD systems.
The computational requirements were enlarged by the need to assess the proposed
system’s discriminatory potential to new, “unseen” by the system, breast lesions.
This is actually the question often posed by the physicians when presented with a
decision tool. Taking under consideration that the set of available verified data was
fixed and that we would have to wait for a long period of time to attain new verified
data, we employed the 10-fold external cross validation method; the available data
was randomly split into two parts, 70% of the data was used to design the system
and 30% to test the system’s accuracy. This procedure was repeated ten times and
the mean accuracy achieved provided an assessment as the system’s precision when
presented with new data in a clinical environment. Considering the dimensionality of
our problem, such a procedure could only have been realised on the processors of
the GPU, employing parallel processing programming techniques. One finding
regarding the mean results obtained by the ECV is that the system’s overall accuracy
dropped to 81% (see Table 6.5) as compared to 93.5% using the LOO evaluation
method (see Table 6.4). This, however, was expected, since the optimal design
method (using LOO) is an “optimistically” biased estimate (Ambroise and McLachlan,
2002), while the ECV gives a generalisation of the system’s performance.
Nevertheless, the performance of the proposed system, having an estimated

Chapter 6: System Evaluation 103
Parallel GPU Architectures for Multimodality Breast Lesions Characterisation K. Sidiropoulos
accuracy of 81% to new data, is reasonable enough to be considered as a second
opinion diagnostic tool in a clinical environment.
6.5 System Limitations
Regarding its limitations, the proposed GPU-based PR-system has only been trained
for binary classification problems, whereas an unknown pattern is assigned to one of
two available classes. Specifically, the system can characterise a breast lesion either
as benign or malignant, but it cannot provide any further information as to the exact
type of the lesion, for example whether it is a case of Infiltrating Ductal Carcinoma or
Infiltrating Lobular Carcinoma. Another limitation of the proposed system is the fact
that it does not provide automatic segmentation of the breast lesions. In particular,
for the purposes of this research, segmentation was performed manually by an
experienced physician. Accordingly, the system requires segmented breast images
with delineated ROIs as input.
Furthermore, an additional limitation is closely related to the specific type and model
of the diagnostic imaging devices employed, as well as to the challenge of adapting
the proposed CAD system to different models that feature diverse specifications and
calibration that ultimately affect the quality of the produced images. Simply put,
there is absolutely no guarantee that the proposed CAD system will continue to
operate at the same level of accuracy, in case images from a different model of
digital mammography device are used as input. The same applies in case images
came from a differently calibrated device.
To address this challenge, a two-step approach could be adopted. Firstly, an initial
assessment of the produced image quality in terms of contrast resolution, spatial
resolution, contrast-to-noise ratio, etc. could be performed, employing specialised
phantoms, before incorporating any new diagnostic imaging device. Thus, devices

Chapter 6: System Evaluation 104
Parallel GPU Architectures for Multimodality Breast Lesions Characterisation K. Sidiropoulos
falling below a certain threshold should be excluded, as they fail to produce the
minimum image quality required.
Secondly, a complete dataset of images, particular to each diagnostic imaging device,
could be created, so that the proposed CAD system can be trained and adapted to
the device’s specific characteristics. This computationally demanding process could
be easily achieved employing the proposed GPU-based CAD system.
6.6 Summary
In this chapter, results were presented showing classification accuracies for
discriminating malignant from benign lesions to be 85.5% using US-features alone,
82.3% employing DM-features alone, and 93.5% combining US and DM features.
Mean accuracy to new “unseen” data for the combined US and DM features was
81%. Those classification accuracies were about 10% higher than accuracies achieved
on a single CPU, using sequential programming methods, and 150-fold faster.
Findings regarding textural content that discriminates benign from malignant lesions
indicate that benign lesions were smoother, more homogeneous, containing larger
structures.
Parallel GPU Architectures for Multimodality Breast Lesions Characterisation K. Sidiropoulos
Chapter 7
Chapter 7. System adaptation to other
Medical Imaging applications
7.1 Overview
The proposed GPU-based CAD system was employed to tackle other Medical
Imaging PR problems. This chapter provides a brief discussion of these
applications that included classification of rare brain tumours, discrimination
of patients with micro-ischemic and multiple sclerosis lesions, classification of
normal and pathological knee cartilages, and discrimination between low
and high grade laryngeal cancer cases.

Ch
Pa
7.
Ev
m
ra
inc
va
bio
tu
is
wh
de
fro
Cli
(va
oli
sta
em
gr
apter 7: Syste
rallel GPU Arc
2 Real tim
ven though
anagement
nging from
clude expe
ariability an
ological com
mours’ beh
built on a G
henever a n
esign based
om on a list
Figure 7.1: (S
inical mater
ariants: gem
igodendrog
ained sectio
mbedded tis
ade II (agg
em adaptation
chitectures for
me Decisio
h histologi
, the pote
25% to 40%
erts’ subjec
nd poor tu
mplexity hin
haviour, and
GPU framew
new verified
on the exa
of potentia
(a): An exampSegmentation
rial compris
mistocytic, f
lioma and
ons were g
ssue for eac
ressive), 35
n to other Med
r Multimodalit
on Support
ical diagno
ntial of dia
%, in routine
ctivity and
umour sam
nder the es
d, thus, to ad
work and it
d case is up
act clinical
al outcomes
ple of a high grof Figure1a fo
sed 140 cas
fibrillary and
mixed glio
generated f
ch case (pat
5 as grade
dical Imaging a
ty Breast Lesio
t System fo
osis is fun
agnostic er
e conditions
lack of e
mpling; rare
stablishmen
dministrate
t is capable
ploaded on
question to
s according t
rade pleomorpor isolation of
ses of rare b
d mixed), an
omas. At l
from the sa
tient). Of th
III (more a
applications
ons Character
or diagnosi
ndamentally
rrors still r
s. Factors af
xperience,
e cancers l
nt of concre
proper trea
e of updatin
its reposito
o be answe
to existing c
phic glioblastonuclei from s
brain tumou
naplastic as
east three
ame block
he 140 cases
aggressive)
isation
s of rare ca
y importan
emains sub
ffecting diag
intra and
low prevale
ete criteria
atments. Th
ng its struct
ory. The sy
ered, which
clinical class
oma multiformurrounding tis
urs, includin
strocytomas
Hematoxy
of formalin
s, 61 were c
and 44 as
K. Sidirop
ancers
nt for pa
bstantially
gnostic accu
inter obse
ence and
able to pr
he proposed
ture in real
ystem adjus
is user-def
sifications.
me tumour, (bssue
ng astrocyto
s, glioblasto
ylin-Eosin (
n-fixed para
characterise
grade IV (
106
poulos
atient
high,
uracy
erver
their
edict
d DSS
time
ts its
fined
b):
omas
omas,
H&E)
affin-
ed as
most

Chapter 7: System adaptation to other Medical Imaging applications 107
Parallel GPU Architectures for Multimodality Breast Lesions Characterisation K. Sidiropoulos
aggressive). The proposed DSS was designed employing the PNN classifier, the
exhaustive search and the leave-one-out methods, Nvidia GeForce GTX580 and the
CUDA parallel programming platform. Five microscopy images from each patient
were digitised, using a light microscopy imaging system consisted of a Zeiss Axiostar-
Plus microscope (ZEISS; Germany) connected to a Leica DC 300 F colour video camera
(LEICA; Germany). A segmentation algorithm was developed to isolate nuclei from
surrounding tissue (see Figure 1a and 1b). Segmented nuclei were quantified by
means of 20 textural and morphological features describing the size, shape and grain
texture of nuclei.
System design was optimised using a combination of four (4) textural and
morphological features with 78.6% overall accuracy, whereas system generalisation
to new unseen by the system data was 73.8% ± 3.2%. The proposed GPU-based DSS
achieved significantly higher training speed, outperforming the CPU-based system
(Intel Core 2 Quad CPU at 2.83GHz) by a factor that ranged from 267 to 288 times.
Thus, by exploiting the inherently parallel architecture of a consumer level GPU, the
proposed approach enabled real time, optimal design of a DSS for any user-defined
clinical question for improving diagnostic assessments, prognostic relevance and
concordance rates for rare cancers in clinical practice. A detailed account can be
found at (Sidiropoulos et al., 2012).
7.3 Discriminating between patients with micro-ischaemic and multiple
sclerosis lesions, using MRI images
The aim was to employ state-of-art GPU technology and CUDA parallel programming
to design and implement a stand-alone pattern recognition system (PR-system) to
discriminate between patients with micro-ischemic (mIS) and multiple sclerosis (MS)
lesions.
The dataset comprised MRI image series of 32 patients with mIS and 19 with MS
lesions. The outline of each MS and mIS lesion on the MRI images was drawn by

Ch
Pa
m
les
PR
th
pr
7.3
ne
to
re
Hi
ab
2
th
ap
co
th
apter 7: Syste
rallel GPU Arc
eans of a c
sion-images
R-system. Th
e MRI ima
rocessing pr
3). The inv
ecessary in
obtain an
designed on
ghest class
bout 135 mi
Quad Q955
e textural f
ppeared sm
omposition f
e degree of
em adaptation
chitectures for
custom mad
s were used
he PNN clas
ges, were
rogramming
volvement
order to de
optimal d
n site when
Figure 7
ification ac
nutes to de
50, against 2
features us
oother tha
from lesion
f demyelina
n to other Med
r Multimodalit
de tool dev
d to extract
ssifier and f
used to de
g on the pro
of GPU tec
eal with the
esign of th
additional
.2:Custom-ma
ccuracy was
esign the PR
250 second
sed to desig
n the mIS l
-to-lesion. T
tion and inf
dical Imaging a
ty Breast Lesio
veloped in
textural fe
forty textur
esign the PR
ocessors of
chnology a
e high dimen
he propose
verified dat
ade software t
s 90.2%, em
R-System on
ds on the Nv
gn the PR-s
lesions but
The latter, m
flammation
applications
ons Character
Matlab (see
atures to b
ral features,
R-system. T
an Nvidia G
nd parallel
nsionality o
d system,
ta are added
tool for extrac
mploying six
n a desktop
vidia 8800G
system, it w
with greate
may be attri
in MS that
isation
e Figure 7.2
e used in th
, calculated
The design
GeForce 880
l processing
of the probl
which is ca
d to its depo
cting lesions
x textural f
CPU featuri
GT GPU car
was found
er variation
ibuted to pr
affects the
K. Sidirop
2). The out
he design o
d from lesio
applied pa
00GT (see F
g methods
em at hand
apable of b
ository.
features. It
ing an Intel
d. By exam
that MS-les
n in the tex
rocesses suc
MR signal.
108
poulos
lined
of the
ns in
rallel
igure
was
d and
being
took
Core
ining
sions
xtural
ch as

Ch
Pa
In
re
fe
te
be
ca
en
pe
ad
7.
Th
ca
kn
ar
ch
apter 7: Syste
rallel GPU Arc
Figure 7.3
conclusion
asonable ac
atures from
xtural struc
e achieved
pabilities of
nvironment,
erformance
dditional ver
4 Discrim
he aim was
rtilage of t
nee injuries
ticular cart
hanges, whi
em adaptation
chitectures for
3: Flow diagra
, a pattern
ccuracy MS
m ROIs of br
ctures betwe
by exploi
f a commer
, as a seco
may be
rified data.
minating be
s the discri
he medial f
in young a
ilage in you
ich may be
n to other Med
r Multimodalit
m of parallel p
recognition
from mIS c
rain MRI ima
een MS and
ting the h
rcial GPU. T
nd opinion
continuous
A detailed a
etween inj
mination b
femoral (M
adults parti
ung active a
undetecte
dical Imaging a
ty Breast Lesio
processing pe
n system ha
cases based
ages. Our fi
d mIS lesion
high proces
he propose
tool with 8
ly improve
account can
ured norm
between no
FC) and tib
cipating in
adults have
ed, yet, the
applications
ons Character
rformed on th
as been des
d on the PN
indings reve
ns. Successfu
ssing speed
d system ca
80% confid
ed by rede
n be found a
mal and pat
ormal and p
bial condyle
sports acti
e been asso
y eventuall
isation
he graphics pro
signed to d
N classifier
ealed differe
ul system d
d and para
an be emplo
ence to ne
esigning it,
at (Solomou
thological k
pathologica
s (MTC), of
vities. Knee
ociated with
ly may lead
K. Sidirop
ocessing unit
iscriminate
and on tex
ences in im
esign could
allel proce
oyed in a cli
ew data, an
on site,
u et al., 2012
knee cartil
l knee arti
ften affecte
e injuries of
h early cart
d to irrever
109
poulos
with
xtural
aged
only
ssing
inical
nd its
with
2).
age
cular
ed by
f the
tilage
rsible

Ch
Pa
ca
lim
de
im
Th
th
fre
th
RO
sy
sy
Figslicfro(d)
apter 7: Syste
rallel GPU Arc
rtilage lesio
mited capac
egeneration
mportant in
he dataset c
e MFC and
ee knee and
e PNN clas
OIs, the ex
stem’s prec
stem design
gure 7.4: Snapces, the followom the corona) patella and f
em adaptation
chitectures for
ons and os
city to rep
n. Because c
patient man
comprised s
MTC cartila
d 16 with pa
ssifier, forty
xhaustive s
cision to new
n was accom
pshots of the wing ROIs weral planes; (c) laemoral trochl
n to other Med
r Multimodalit
steoarthritis
pair and, th
chondral inj
nagement.
segmented
ages (see Fig
athological
y (40) textu
search and
w data was
mplished on
three PD-FSE re extracted: ateral and meea, and (e) lat
dical Imaging a
ty Breast Lesio
s. This is b
hus, articula
uries may b
ROIs from
gure 7.4), o
findings. Th
ral features
leave-one
assessed b
n an Nvidia G
FS MRI planefrom the axia
edial of femorateral and med
applications
ons Character
because arti
ar injuries
be asymptom
coronal and
f young pat
he PR-syste
s from the
e-out evalu
y employing
GeForce GT
es. In these plal planes: (a) pal and tibial coial of the MFC
isation
icular cartil
result in p
matic, accu
d sagittal 3T
tients, 28 w
m was desi
segmented
uation meth
g the ECV m
TX 580 using
lanes and in tpatella and (bondyles, from C and MTC car
K. Sidirop
lage has a
premature
rate diagno
T MRI imag
ith abnorm
gned emplo
d MFC and
hod, while
method. Opt
g CUDA.
their correspob) femoral tro
the sagittal prtilages
110
poulos
very
joint
osis is
es of
ality-
oying
MTC
the
timal
onding chlea, lanes:

Chapter 7: System adaptation to other Medical Imaging applications 111
Parallel GPU Architectures for Multimodality Breast Lesions Characterisation K. Sidiropoulos
PR-system design on the GPU required about 3.5 minutes against 15 hours on CPU-
based system (Intel Core 2 Quad Q9550). Highest classification accuracies in
discriminating between normal and pathological knee articular cartilage for the MFC
and MTC were 93.2% and 95.5% and accuracies to “unseen” data were 89% and 86%
respectively. Regarding findings from textural features used in the optimal design of
the PR-system, the cartilage texture of the pathological knee appeared more
homogeneous and comprising larger structures. A detailed account can be found at
(Kostopoulos et al., 2013).
7.5 Differentiating between low and high grade laryngeal cancer cases
The aim was discrimination between low and high grade laryngeal cancer cases,
employing immunohistochemically stained, for p63 expression, histopathology
images. Laryngeal cancer has bad prognosis and diagnosis is an important step
towards following the right treatment for best prognosis, the aim being to improve
patient survival. However, assessing the severity of laryngeal lesions is subject to the
pathologist’s experience and it has low intra- and inter-observer reproducibility
rates. To assist in the assessment of the severity of laryngeal cancer, a PR system was
developed to automatically characterise microscopy images of laryngeal cancer
lesions as of low grade (high differentiation) or high grade (moderate and low
differentiation), based on textural, morphological, and topological nuclei features.
The material comprised fifty-five verified cases of laryngeal cancer, 21 of low grade
and 34 of high grade malignancy. Histopathology images were first processed for
automatically segmenting p63 expressed nuclei. 52 features were next extracted
from the segmented nuclei within image ROIs designated by the expert physician and
concerning nuclei texture, shape, and physical topology in the image. Those features,
the PNN classifier, the exhaustive search and LOO methods, and the ECV method, for
assessing the PR-system’s precision to “unseen” data, were employed to design the
Chapter 7: System adaptation to other Medical Imaging applications 112
Parallel GPU Architectures for Multimodality Breast Lesions Characterisation K. Sidiropoulos
PR-system on the multiprocessors of the Nvidia 580GTX GPU card, using the CUDA
parallel programming model and C++ programming language.
PR-system performance in classifying laryngeal cancer cases as low grade and high
grade was 85.7% and 94.1% respectively. The system’s overall accuracy was 90.9%,
using seven features, and its estimated accuracy to “unseen” by the system cases
was 80%. It required over 24 hours to reach the best design, using the four cores of
the Intel Core 2 Quad Q9550 and parallel programming under the OpenMP platform,
and forty-four (44) minutes, using the GPU and the CUDA programming model.
Nuclei features used in the optimal PR-system design were related to texture
homogeneity, contrast, contents and the dispersion of nuclei in the selected by the
physician ROIs. High grade nuclei texture was found inhomogeneous, of higher local
contrast, containing smaller structures, and the nuclei topology of higher in-between
distance.
Optimum system design was only feasible after employing parallel processing
techniques and GPU technology. The proposed system was structured so as to
function in a clinical environment, as a research tool, and with the capability of being
redesigned on site when new verified cases are added to its repository. A detailed
account can be found at (Ninos et al., 2013).

Chapter 7: System adaptation to other Medical Imaging applications 113
Parallel GPU Architectures for Multimodality Breast Lesions Characterisation K. Sidiropoulos
7.6 Summary
The PR-system design was adapted for tackling other Medical Imaging problems, as a
proof of its generalisation. These included classification of rare brain tumours,
discrimination of patients with micro-ischemic and multiple sclerosis lesions,
classification of normal and pathological knee cartilages, and separation of low from
high grade laryngeal cancer cases.
Regarding PR-designs for other applications, classification results achieved for rare
brain tumours were 78.6% for overall accuracy and 73.8% for estimated
generalisation accuracy, accelerating system design 267 times. Similarly, in
discriminating between micro-ischaemic and multiple sclerosis lesions on MRI,
accuracies achieved were 90.2% and 80% with 32-fold design acceleration, in
characterising injured normal and pathological knee cartilages on MRI maximum
accuracies achieved were 93.2% and 89% with 257-fold design acceleration, and in
separating low from high grade laryngeal cancer lesions on microscopy imaging,
maximum accuracies achieved were 93.2% and 89%, with 130-fold design
acceleration.

Parallel GPU Architectures for Multimodality Breast Lesions Characterisation K. Sidiropoulos
Chapter 8
Chapter 8. Conclusions – Future Work
8.1 Overview
This chapter summarises the findings of the present thesis, draws conclusions
and indicates directions for future research.
Chapter 8: Conclusions - Future Work 115
Parallel GPU Architectures for Multimodality Breast Lesions Characterisation K. Sidiropoulos
8.2 Conclusions
The application of GPU technology and parallel processing programming techniques
in the design of CAD systems, presented in this thesis, has made possible to apply
optimum, but considerably laborious feature selection techniques, to design high
precision classification systems that, otherwise, would be impossible to implement.
In particular, the employment of GPU technology not only rendered realisable the
design of CAD systems based on imaging data from different modalities, whereas,
the dimensionality of the problem increases due to the number of modalities
involved, but also considerably accelerated the design of such CAD systems.
Additionally, since retraining of the classifier was achieved due to significant
reductions in processing times, it was rendered possible to estimate the actual
precision of such designed CAD system to new, “unseen” by the system data,
employing time consuming external cross validation evaluation methods. Thus,
trustworthy, high precision, CAD systems can be designed by limited amount of data.
These CAD systems also feature the ability to be redesigned on site, once more
verified data become available.
Furthermore, it has been made possible to prove that such laborious problems can
be tackled by relatively low-cost GPUs, which are readily available to consumers, in
contrast to previously proposed alternatives such as server clusters or
supercomputers, accessible only to few.
In conclusion, by applying the methods developed in the present thesis to other
medical applications, it was made possible to increase the accuracy of the respective
CAD systems, while new clinical knowledge was contributed as to imaging properties
of the human tissue under examination. In particular:
In brain lesions, employing MR-imaging, MS lesions were found smoother
in texture but with greater variation in textural composition, which is due

Chapter 8: Conclusions - Future Work 116
Parallel GPU Architectures for Multimodality Breast Lesions Characterisation K. Sidiropoulos
to different degrees of demyelination and inflammation in MS that affects
the MR signal.
In breast lesions, benign lesions were found smoother, more
homogeneous, and containing larger structures.
In knee cartilage texture analysis on MRI imaging, pathological ROIs
appeared more homogeneous, of larger structures aligned along preferred
directions, and of lower textural anisotropy.
In laryngeal cancer histopathology images it was found that grade I nucleus
texture was more homogeneous, better stained, of structured nature, and
of ordinary shape when compared to high grade nuclei.

Chapter 8: Conclusions - Future Work 117
Parallel GPU Architectures for Multimodality Breast Lesions Characterisation K. Sidiropoulos
8.3 Future Work
Regarding future work, incorporation of state-of-art GPU-programming capabilities,
such as dynamic parallelisation offered by Kepler and Maxwell class GPUs, could be
employed for further optimising design flexibility, reducing design time, and
increasing precision.
In addition, expanding CAD system design to incorporate information from more
imaging modalities, such as MRI, could be further investigated, while the proposed
GPU-based PR system could be tested against emerging classification methods, using
benchmark datasets available on the web, in order to gain further insight of its
advantages and limitations.
Furthermore, research on incorporating multi-classifier ensemble schemes could be
considered, especially since the increased computational power of modern GPUs
allows for it. Additionally, implementation of PR systems on heterogeneous
platforms exploiting multicore CPUs along with GPUs could be examined by
employing the OpenCL language, instead of CUDA. Accordingly, the system’s
scalability on GPU clusters could be investigated.
Finally, following the Software as a Service (SaaS) paradigm, web services technology
could be employed to provide other researchers a web-based facility for designing
CAD systems for various applications.
References 118
Parallel GPU Architectures for Multimodality Breast Lesions Characterisation K. Sidiropoulos
References
Ahmed, N. and K. R. Rao (1975). Orthogonal Transforms for Digital Signal Processing. Berlin - Heidelberg - New York, Springer-Verlag.
Ambroise, C. and G. J. McLachlan (2002). "Selection bias in gene extraction on the basis of microarray gene-expression data." Proc Natl Acad Sci U S A 99(10): 6562-6566.
AMD. (2005). "AMD Athlon™ 64 X2 Dual Core Product Data Sheet". Available at: http://support.amd.com/TechDocs/33425.pdf#search=Athlon%2064%20X2, Last accessed: 25/04/2014.
Beam, C. A., P. M. Layde, et al. (1996). "Variability in the interpretation of screening mammograms by US radiologists. Findings from a national sample." Arch Intern Med 156(2): 209-213.
Beliakov, G. and G. Li (2012). "Improving the speed and stability of the k-nearest neighbors method." Pattern Recognition Letters 33(10): 1296-1301.
Berg, W. A., J. D. Blume, et al. (2008). "Combined screening with ultrasound and mammography vs mammography alone in women at elevated risk of breast cancer." JAMA 299(18): 2151-2163.
Bird, R. E., T. W. Wallace, et al. (1992). "Analysis of cancers missed at screening mammography." Radiology 184(3): 613-617.
Birdwell, R. L., P. Bandodkar, et al. (2005). "Computer-aided detection with screening mammography in a university hospital setting." Radiology 236(2): 451-457.
Bocchi, L., G. Coppini, et al. (1997). "Tissue characterization from X-ray images." Medical Engineering & Physics 19(4): 336-342.
Buck, I., T. Foley, et al. (2003). BrookGPU Project, Stanford University Graphics Lab, http://graphics. stanford. edu/projects/brookgpu/7. Microsoft. The Viewing Frustum. DirectX Documents for C++, DirectX SDK.
Burges, C. J. C. (1998). "A tutorial on Support Vector Machines for pattern recognition." Data Mining and Knowledge Discovery 2(2): 121-167.
Burges, C. J. C. (1998). "A Tutorial on Support Vector Machines for Pattern Recognition." Data Min. Knowl. Discov. 2(2): 121-167.
Chapman, B., G. Jost, et al. (2008). Using OpenMP: portable shared memory parallel programming, MIT press.

References 119
Parallel GPU Architectures for Multimodality Breast Lesions Characterisation K. Sidiropoulos
Che, S., M. Boyer, et al. (2008). "A performance study of general-purpose applications on graphics processors using CUDA." Journal of parallel and distributed computing 68(10): 1370-1380.
Clamp, A., S. Danson, et al. (2003). "Hormonal and genetic risk factors for breast cancer." The Surgeon 1(1): 23-31.
Crow, T. S. (2004). Evolution of the graphical processing unit, Citeseer.
Cupples, T. E., J. E. Cunningham, et al. (2005). "Impact of computer-aided detection in a regional screening mammography program." AJR Am J Roentgenol 185(4): 944-950.
Dai, Y., J. Tian, et al. (2010). "Real-time visualized freehand 3D ultrasound reconstruction based on GPU." IEEE Trans Inf Technol Biomed 14(6): 1338-1345.
Dean, J. C. and C. C. Ilvento (2006). "Improved cancer detection using computer-aided detection with diagnostic and screening mammography: prospective study of 104 cancers." AJR Am J Roentgenol 187(1): 20-28.
Devyver, P. A. and J. Kittler (1982). Pattern Recognition: A Statistical Approach, Prentice-Hall.
Di Blas, A. and T. Kaldewey (2009). "Data monster." Spectrum, IEEE 46(9): 46-51.
Directive, E. (1995). "95/46/EC of the European Parliament and of the Council of 24 October 1995 on the protection of individuals with regard to the processing of personal data and on the free movement of such data." Official Journal of the EC 23: 6.
Doi, K. (2007). "Computer-aided diagnosis in medical imaging: historical review, current status and future potential." Comput Med Imaging Graph 31(4-5): 198-211.
Drukker, K., K. Horsch, et al. (2005). "Multimodality computerized diagnosis of breast lesions using mammography and sonography." Acad Radiol 12(8): 970-979.
Duda, R. O., P. E. Hart, et al. (2012). Pattern Classification, Wiley.
Evers, K. (2001). "Diagnostic Breast Imaging." American Journal of Roentgenology 177(5): 1094.
Fang, J., A. L. Varbanescu, et al. (2011). A comprehensive performance comparison of CUDA and OpenCL. Parallel Processing (ICPP), 2011 International Conference on, IEEE.
Farber, R. (2011). CUDA Application Design and Development, Morgan Kaufmann.

References 120
Parallel GPU Architectures for Multimodality Breast Lesions Characterisation K. Sidiropoulos
Foley, D. (1972). "Considerations of sample and feature size." Information Theory, IEEE Transactions on 18(5): 618-626.
Foley, D. H. (1972). "Considerations of sample and feature size." Information Theory, IEEE Transactions on 18(5): 618-626.
Freer, T. W. and M. J. Ulissey (2001). "Screening mammography with computer-aided detection: prospective study of 12,860 patients in a community breast center." Radiology 220(3): 781-786.
Galloway, M. M. (1975). "Texture analysis using gray-level run lengths." Computer Graphics and Image Processing 4: 172-179.
GLOBOCAN. (2008). "Cancer Incidence and Mortality Worldwide". Available at: http://www.iarc.fr/en/media-centre/iarcnews/2010/globocan2008.php, Last accessed: 27/0/2014.
Gokhale, S. (2009). Ultrasound characterization of breast masses.
Gonzalez, R. and R. Woods (2002). Digital image processing. NY, Addison-Wesley Pub
Gose, E., R. Johnsonbaugh, et al. (1996). Pattern Recognition and Image Analysis. New Jersey, Prentice Hall PTR.
Grunberg, W. I. and O. H. Domingo (2011). "Parathyroid cyst." Am Surg 77(11): E256-257.
Gunal, S., O. N. Gerek, et al. (2009). "The search for optimal feature set in power quality event classification." Expert Systems with Applications 36(7): 10266-10273.
Gur, D., J. H. Sumkin, et al. (2004). "Changes in breast cancer detection and mammography recall rates after the introduction of a computer-aided detection system." J Natl Cancer Inst 96(3): 185-190.
Haralick, R. M., K. Shanmugam, et al. (1973). "Textural Features for Image Classification." IEEE Trans Sys Man Cyb 3: 610-621.
Haralick, R. M., K. Shanmugam, et al. (1973). "Textural Features for Image Classification." IEEE Transactions on Systems Man and Cybernetics 3(6): 610-621.
Harms, S. E. (1999). "Technical report of the international working group on breast MRI." J Magn Reson Imaging 10(6): 979.
Hayes, D. F. (2007). "Clinical practice. Follow-up of patients with early breast cancer." N Engl J Med 356(24): 2505-2513.

References 121
Parallel GPU Architectures for Multimodality Breast Lesions Characterisation K. Sidiropoulos
Hollander, M. and D. Wolfe (1999). Nonparametric Statistical Methods, 2nd Edition, Wiley-Interscience.
Horsch, K., M. L. Giger, et al. (2006). "Classification of breast lesions with multimodality computer-aided diagnosis: observer study results on an independent clinical data set." Radiology 240(2): 357-368.
Houssami, N. and S. Ciatto (2011). "The evolving role of new imaging methods in breast screening." Prev Med 53(3): 123-126.
Humphrey, L. L., M. Helfand, et al. (2002). "Breast cancer screening: a summary of the evidence for the U.S. Preventive Services Task Force." Ann Intern Med 137(5 Part 1): 347-360.
Intel. (2005). "Intel Pentium D Processor ". Available at: http://www.intel.com/content/dam/www/public/us/en/documents/product-briefs/pentium-d-processor-brief.pdf, Last accessed: 25/04/2014.
Jemal, A., R. Siegel, et al. (2008). "Cancer statistics, 2008." CA Cancer J Clin 58(2): 71-96.
Kakimoto, T., K. Dohi, et al. (2012). "Performance comparison of GPU programming frameworks with the striped Smith-Waterman algorithm." ACM SIGARCH Computer Architecture News 40(5): 70-75.
Karahaliou, A. N., I. S. Boniatis, et al. (2008). "Breast cancer diagnosis: analyzing texture of tissue surrounding microcalcifications." IEEE Trans Inf Technol Biomed 12(6): 731-738.
Kecman, V. (2001). Learning and Soft Computing: Support Vector Machines, Neural Networks, and Fuzzy Logic Models, Mit Press.
Khronos (2008). "The opencl specification." A. Munshi, Ed.
Kirk, D. B. and W. H. Wen-mei (2012). Programming massively parallel processors: a hands-on approach, Newnes.
Koepf, S. (2009). "k-combinations without repetition in lexicographic order". Available at: http://www.aconnect.de/friends/editions/computer/combinatoricode_e.html, Last accessed: 25/04/2014.
Kossoff, M. B. (2000). "Ultrasound of the breast." World J Surg 24(2): 143-157.

References 122
Parallel GPU Architectures for Multimodality Breast Lesions Characterisation K. Sidiropoulos
Kostopoulos, S., K. Sidiropoulos, et al. (2013). "Pattern-recognition system, designed on GPU, for discriminating between injured normal and pathological knee cartilage." Magnetic resonance imaging 31(5): 761-770.
Kumar, V., A. Grama, et al. (1994). Introduction to parallel computing, Benjamin/Cummings Redwood City.
Kuncheva, L. I. (2004). Combining Pattern Classifiers: Methods and Algorithms. Hoboken, New Jersey, John Wiley & Sons, Inc.
Laine, H. R., T. Tukeva, et al. (1996). "Assessment of mammography and ultrasound examination in the diagnosis of breast cancer." European Journal of Ultrasound 3(1): 9-14.
Lapeer, R. J., S. K. Shah, et al. (2010). "An optimised radial basis function algorithm for fast non-rigid registration of medical images." Comput Biol Med 40(1): 1-7.
Lee, J. M., E. F. Halpern, et al. (2009). "Evaluating the correlation between film mammography and MRI for screening women with increased breast cancer risk." Acad Radiol 16(11): 1323-1328.
Luebke, D. and G. Humphreys (2007). How GPUs Work. Computer. 40: 96-100.
Mainiero, M. B., A. Goldkamp, et al. (2005). "Characterization of Breast Masses With Sonography: Can Biopsy of Some Solid Masses Be Deferred?" Journal of Ultrasound in Medicine 24(2): 161-167.
Majid, A. S., E. S. de Paredes, et al. (2003). "Missed breast carcinoma: pitfalls and pearls." Radiographics 23(4): 881-895.
Marieb, E. N. and K. Hoehn (2013). Human Anatomy & Physiology, Benjamin Cummings ; Pearson.
Martini, F. H., J. L. Nath, et al. (2011). Fundamentals of Anatomy & Physiology with Masteringa&p, and Laboratory Investigations in Anatomy & Physiology, Main Version, A&p Applications Manual (Valuepack Version), Practice Anatomy Lab 3.0 (for Packages with Masteringa&p Access Code) Package, Benjamin-Cummings Publishing Company.
Mattson, T. G., B. A. Sanders, et al. (2004). Patterns for parallel programming, Pearson Education.
Mavroforakis, M., H. Georgiou, et al. (2005). "Significance analysis of qualitative mammographic features, using linear classifiers, neural networks and support vector machines." European Journal of Radiology 54(1): 80-89.
References 123
Parallel GPU Architectures for Multimodality Breast Lesions Characterisation K. Sidiropoulos
McCool, M. D., Z. Qin, et al. (2002). Shader metaprogramming. Proceedings of the ACM SIGGRAPH/EUROGRAPHICS conference on Graphics hardware, Eurographics Association.
Microsoft. (2006). "Microsoft Research Accelerator Project: http://research.microsoft.com/en-us/downloads/648909e1-cb85-46c4-9a94-3cca55971b1d/". Available at: Last accessed.
Moore, G. E. (2006). "Cramming more components onto integrated circuits, Reprinted from Electronics, volume 38, number 8, April 19, 1965, pp.114 ff." Solid-State Circuits Society Newsletter, IEEE 11(5): 33-35.
Moore, S. K. (2010). "Multicore CPUs: Processor Proliferation". Available at: http://spectrum.ieee.org/semiconductors/processors/multicore-cpus-processor-proliferation, Last accessed: 25/04/2014.
Morton, M. J., D. H. Whaley, et al. (2006). "Screening mammograms: interpretation with computer-aided detection--prospective evaluation." Radiology 239(2): 375-383.
MPI. (2009). "MPI: A Message-Passing Interface Standard, Version 2.2". Available at: http://www.mpiforum.org/docs/mpi-2.2/mpi22-report.pdf, Last accessed: 25/04/2014.
Ninos, K., S. Kostopoulos, et al. (2013). "Computer-based image analysis system designed to differentiate between low-grade and high-grade laryngeal cancer cases." Analytical and quantitative cytology and histology/the International Academy of Cytology [and] American Society of Cytology 35(5): 261-272.
Nvidia. (2014). "CUDA C Programming Guide". Available at: http://docs.nvidia.com/cuda/cuda-c-programming-guide/index.html, Last accessed: 24/04/2014.
Oh, K.-S. and K. Jung (2004). "GPU implementation of neural networks." Pattern Recognition 37(6): 1311-1314.
Ohmer, J., F. Maire, et al. (2005). Implementation of Kernel Methods on the GPU. Digital Image Computing: Techniques and Applications, 2005. DICTA '05. Proceedings 2005.
OpenMP. (2005). "OpenMP Application Program Interface". Available at: http://www.openmp.org/mp-documents/spec25.pdf, Last accessed: 25/04/2014.
Pallipuram, V. K., M. Bhuiyan, et al. (2012). "A comparative study of GPU programming models and architectures using neural networks." The Journal of Supercomputing 61(3): 673-718.

References 124
Parallel GPU Architectures for Multimodality Breast Lesions Characterisation K. Sidiropoulos
Pang, W. M., J. Qin, et al. (2011). "Accelerating simultaneous algebraic reconstruction technique with motion compensation using CUDA-enabled GPU." Int J Comput Assist Radiol Surg 6(2): 187-199.
Park, I. K., N. Singhal, et al. (2011). "Design and performance evaluation of image processing algorithms on GPUs." Parallel and Distributed Systems, IEEE Transactions on 22(1): 91-104.
Patterson, D. (2010). "The trouble with multi-core." Spectrum, IEEE 47(7): 28-32, 53.
Patterson, D. (2010). "The Trouble With Multicore". Available at: http://spectrum.ieee.org/computing/software/the-trouble-with-multicore, Last accessed: 25/04/2014.
Pratt, W. K. (2007). Digital Image Processing: PIKS Scientific Inside, Wiley.
Pudil, P., J. Novovičová, et al. (1994). "Floating search methods in feature selection." Pattern Recognition Letters 15(11): 1119-1125.
Ruiz, A., O. Sertel, et al. (2009). "Stroma classification for neuroblastoma on graphics processors." Int J Data Min Bioinform 3(3): 280-298.
Saeys, Y., I. Inza, et al. (2007). "A review of feature selection techniques in bioinformatics." Bioinformatics 23(19): 2507-2517.
Sahiner, B., H. P. Chan, et al. (2009). "Multi-modality CADx: ROC study of the effect on radiologists' accuracy in characterizing breast masses on mammograms and 3D ultrasound images." Acad Radiol 16(7): 810-818.
Santhanam, A. P., Y. Min, et al. (2012). "A multi-GPU real-time dose simulation software framework for lung radiotherapy." Int J Comput Assist Radiol Surg 7(5): 705-719.
Sardanelli, F., F. Podo, et al. (2007). "Multicenter comparative multimodality surveillance of women at genetic-familial high risk for breast cancer (HIBCRIT study): interim results." Radiology 242(3): 698-715.
Schenk, O., M. Christen, et al. (2008). "Algorithmic performance studies on graphics processing units." Journal of parallel and distributed computing 68(10): 1360-1369.
SEER. (2011). "SEER Stat Fact Sheets: Breast Cancer". Available at: http://seer.cancer.gov/statfacts/html/breast.html, Last accessed: 26/04/2014.
Sen, R. (2012). "Developing parallel programs." Advances in Computer Science: an International Journal 1(1): 18-27.

References 125
Parallel GPU Architectures for Multimodality Breast Lesions Characterisation K. Sidiropoulos
Shams, R., P. Sadeghi, et al. (2010). "Parallel computation of mutual information on the GPU with application to real-time registration of 3D medical images." Comput Methods Programs Biomed 99(2): 133-146.
Sidiropoulos, K., D. Glotsos, et al. (2012). "Real time decision support system for diagnosis of rare cancers, trained in parallel, on a graphics processing unit." Computers in biology and medicine 42(4): 376-386.
Sidiropoulos, K. P., S. A. Kostopoulos, et al. (2013). "Multimodality GPU-based computer-assisted diagnosis of breast cancer using ultrasound and digital mammography images." International journal of computer assisted radiology and surgery 8(4): 547-560.
Solomou, E., S. Kostopoulos, et al. (2012). "Designing a pattern recognition system on GPU for discriminating between patients with micro-ischaemic and multiple sclerosis lesions, using MRI images." International Journal of High Performance Computing Applications: 1094342012464253.
Specht, D. F. (1990). "Probabilistic Neural Networks." Neural Networks 3: 109-118.
Stavros, A. T., C. L. Rapp, et al. (2004). Breast Ultrasound, Lippincott Williams & Wilkins.
Stavros, A. T., D. Thickman, et al. (1995). "Solid breast nodules: use of sonography to distinguish between benign and malignant lesions." Radiology 196(1): 123-134.
Sutter, H. and J. Larus (2005). "Software and the Concurrency Revolution." Queue 3(7): 54-62.
Tabar, L. and P. B. Dean (2008). "Thirty years of experience with mammography screening: A new approach to the diagnosis and treatment of breast cancer." Breast Cancer Research 10(SUPPL. 4).
Tang, J., R. M. Rangayyan, et al. (2009). "Computer-aided detection and diagnosis of breast cancer with mammography: recent advances." IEEE Trans Inf Technol Biomed 13(2): 236-251.
Theodoridis, S. and K. Koutroumbas (2003). Pattern Recognition. San Diego, Elsevier.
Theodoridis, S., A. Pikrakis, et al. (2010). Introduction to Pattern Recognition: A Matlab Approach: A Matlab Approach, Elsevier Science.
Weber, R., A. Gothandaraman, et al. (2011). "Comparing hardware accelerators in scientific applications: A case study." Parallel and Distributed Systems, IEEE Transactions on 22(1): 58-68.

References 126
Parallel GPU Architectures for Multimodality Breast Lesions Characterisation K. Sidiropoulos
WHO (2013). Global Health Estimates.
Wilt, N. (2013). The cuda handbook: A comprehensive guide to gpu programming, Pearson Education.
Wolfe, M. (2010). "Understanding the CUDA Data Parallel Threading Model, A Primer ". Available at: https://www.pgroup.com/lit/articles/insider/v2n1a5.htm, Last accessed: 25/04/2014.
Xu, F. and K. Mueller (2007). "Real-time 3D computed tomographic reconstruction using commodity graphics hardware." Phys Med Biol 52(12): 3405-3419.
Yuan, Y., M. L. Giger, et al. (2010). "Multimodality computer-aided breast cancer diagnosis with FFDM and DCE-MRI." Acad Radiol 17(9): 1158-1167.

Appendix A 127
Parallel GPU Architectures for Multimodality Breast Lesions Characterisation K. Sidiropoulos
Appendix A
XML structure used to store patient data and delineated ROIs
<?xml version="1.0" encoding="utf-8"?> <DicomDir> <Patients> <Patient> <PatientName>Jane Smith</PatientName> <PatientID>10.04.2007</PatientID> <PatientBirthDate>Not Available</PatientBirthDate> <PatientSex>F</PatientSex> <Studies> <Study> <StudyInstanceUID>1.2.840.113619.2.66.2218493336.4356070410091952.20000</StudyInstanceUID> <StudyDate>10.04.2007</StudyDate> <StudyTime>09:19:52</StudyTime> <StudyDescription>Not Available</StudyDescription> <StudyID>354</StudyID> <Serieses> <Series> <SeriesInstanceUID>1.2.840.113619.2.66.2218493336.4356070410092200.10003</SeriesInstanceUID> <SeriesNumber>1037</SeriesNumber> <SeriesModality>MG</SeriesModality> <SeriesDescription>Not Available</SeriesDescription> <SeriesDate>10.04.2007</SeriesDate> <SeriesTime>09:22:06</SeriesTime> <SeriesStationName>aws1</SeriesStationName> <Instances> <Instance /> <fromImage>C:\Dimitropoulos DICOMs\00006285.dcm</fromImage> <comments>Lmin=456 Rmax=1424</comments> <date>04/01/08 03:43:18</date> <drawings> <drawing id="1" type="line"> <point> <x>299</x> <y>49</y> </point> <point> <x>295</x> <y>51</y> </point> <point> <x>294</x> <y>51</y> </point> <point> <x>0</x> <y>0</y> </point> </drawing> <drawing id="2" type="rect"> <x>947</x> <y>947</y> <width>540</width> <height>487</height> </drawing> </drawing> </drawings> </Instances> </Series> </Serieses> </Study> </Studies> </Patient> <Patient> <PatientName>John Doe</PatientName> <PatientID>12.03.1954</PatientID> <PatientBirthDate>Not Available</PatientBirthDate> <PatientSex>F</PatientSex> <Studies> <Study> <StudyInstanceUID>1.2.840.113619.2.66.2218496716.15919070102162245.20000</StudyInstanceUID> <StudyDate>02.01.2007</StudyDate>

Appendix A 128
PR Design on GPU for Multimodality Breast Lesions Characterisation K. Sidiropoulos
<StudyTime>16:22:45</StudyTime> <StudyDescription>Not Available</StudyDescription> <StudyID>36</StudyID> <Serieses> <Series> <SeriesInstanceUID>1.2.840.113619.2.66.2218496716.15919070102162245.10001</SeriesInstanceUID> <SeriesNumber>67</SeriesNumber> <SeriesModality>MG</SeriesModality> <SeriesDescription>Not Available</SeriesDescription> <SeriesDate>02.01.2007</SeriesDate> <SeriesTime>16:22:45</SeriesTime> <SeriesStationName>aws1</SeriesStationName> <Instances> <Instance /> <fromImage>C:\euromedicaimages\cache2\00000ce7.dcm</fromImage> <comments /> <date>06/13/08 01:24:43</date> <drawings> <drawing id="1" type="rect"> <x>447</x> <y>661</y> <width>540</width> <height>487</height> </drawing> </drawings> </Instances> </Series> </Serieses> </Study> </Studies> </Patient> </Patients> </DicomDir>

Ap
Pa
A
Thth
ppendix B
rallel GPU Arc
Appendix
he patient cat this is a t
chitectures for
x B
consent formtranslated v
r Multimodalit
m used for version of th
ty Breast Lesio
the purposehe original fo
ons Character
es of this reorm, which
isation
esearch. It swas in Gree
K. Sidirop
should be nek.
129
poulos
noted