Embed Size (px)
Citation preview
Patrilineal Perspective on the Austronesian Diffusion inMainland Southeast AsiaJun-Dong He1,2,3., Min-Sheng Peng1,3,8., Huy Ho Quang5, Khoa Pham Dang5, An Vu Trieu5, Shi-
Fang Wu1, Jie-Qiong Jin1, Robert W. Murphy1,7, Yong-Gang Yao6, Ya-Ping Zhang1,3,4*
1 State Key Laboratory of Genetic Resources and Evolution, Kunming Institute of Zoology, Chinese Academy of Sciences, Kunming, China, 2 School of Life Sciences,
University of Science and Technology of China, Hefei, China, 3 KIZ/CUHK Joint Laboratory of Bioresources and Molecular Research in Common Diseases, Kunming, China,
4 Laboratory for Conservation and Utilization of Bio-resource, Yunnan University, Kunming, China, 5 Department of Immunology, Hanoi Medical University, Hanoi,
Vietnam, 6 Key Laboratory of Animal Models and Human Disease Mechanisms, Kunming Institute of Zoology, Chinese Academy of Sciences, Kunming, China, 7 Centre for
Biodiversity and Conservation Biology, Royal Ontario Museum, Toronto, Canada, 8 Graduate University of the Chinese Academy of Sciences, Beijing, China
Abstract
The Cham people are the major Austronesian speakers of Mainland Southeast Asia (MSEA) and the reconstruction of theCham population history can provide insights into their diffusion. In this study, we analyzed non-recombining region of theY chromosome markers of 177 unrelated males from four populations in MSEA, including 59 Cham, 76 Kinh, 25 Lao, and 17Thai individuals. Incorporating published data from mitochondrial DNA (mtDNA), our results indicated that, in general, theChams are an indigenous Southeast Asian population. The origin of the Cham people involves the genetic admixture of theAustronesian immigrants from Island Southeast Asia (ISEA) with the local populations in MSEA. Discordance between theoverall patterns of Y chromosome and mtDNA in the Chams is evidenced by the presence of some Y chromosome lineagesthat prevail in South Asians. Our results suggest that male-mediated dispersals via the spread of religions and business trademight play an important role in shaping the patrilineal gene pool of the Cham people.
Citation: He J-D, Peng M-S, Quang HH, Dang KP, Trieu AV, et al. (2012) Patrilineal Perspective on the Austronesian Diffusion in Mainland Southeast Asia. PLoSONE 7(5): e36437. doi:10.1371/journal.pone.0036437
Editor: Manfred Kayser, Erasmus University Medical Center, The Netherlands
Received September 16, 2011; Accepted April 2, 2012; Published May 7, 2012
Copyright: � 2012 He et al. This is an open-access article distributed under the terms of the Creative Commons Attribution License, which permits unrestricteduse, distribution, and reproduction in any medium, provided the original author and source are credited.
Funding: This research was supported by grants from National Natural Science Foundation of China, and Bureau of Science and Technology of Yunnan Province.The funders had no role in study design, data collection and analysis, decision to publish, or preparation of the manuscript.
Competing Interests: The authors have declared that no competing interests exist.
* E-mail: [email protected]
. These authors contributed equally to this work.
Introduction
The Austronesian language family is one of the largest and most
widespread language families. It is spoken by more than
350 million people on islands from Madagascar to Easter Island
[1,2]. Nevertheless, the languages in this family have a rather
limited distribution on the mainland. Chamic, the representative
language of the family, is spoken by the Cham people. In
Mainland Southeast Asia (MSEA), Chamic exists as a ‘‘linguistic
enclave’’, because it is surrounded by non-Austronesian-speaking
groups (e.g. Mon-Khmers) [3,4,5]. Many studies investigate the
diffusion of Austronesian in MSEA by tracing the origin of the
Cham people. The ‘‘Out-of-Taiwan’’ hypothesis regards the
Cham ancestors as the Austronesian immigrants from Island
Southeast Asia (ISEA) and immigration is dated to around 500 BC
[4,6,7]. Before the arrival of the Austronesian immigrants,
southern Vietnam appears to have been occupied by the local
Austro-Asiatic speakers, especially Mon-Khmers [8]. There is a
high chance of admixture between the Chams and Mon-Khmer
groups. Previously linguistic analyses of the Chamic report that
some loan-words from Mon-Khmer languages form indigenous
cultural contributions [4,6]. The ‘‘Nusantao Maritime Trading
and Communication Networks’’ hypothesis states that cultural
diffusion through trading and communication networks played an
important or even dominant role in the ethnogenesis of the Cham
[9]. Because the origin of the Cham people is open to debate, the
demographic history of the Austronesians in Southeast Asia
requires further investigation.
Analyses of mitochondrial DNA (mtDNA) variation of the
Cham population resolve a closer relationship with populations in
MSEA rather than with those from ISEA, and this occurs despite
that recent gene flow from ISEA [10]. This result suggests that the
origin of the Cham people likely involves the massive assimilation
of local Mon-Khmer populations, and this is accompanied with
language shift. Thus, the Austronesian diffusion in MSEA appears
to mediated mainly by cultural diffusion [10]. Because mtDNA
data only offer a maternal perspective, only half of the story is
known. Does patrilineal history reveal the same story? We address
this question by evaluating non-recombining region of the Y
chromosome (NRY) markers, including 26 single-nucleotide
polymorphisms (Y-SNPs) and eight short tandem repeats (Y-
STRs), in 59 male Cham individuals whose matrilineal histories
are known [10]. For comparison, the NRY markers of 76 Kinh, 25
Lao, and 17 Thai males were also surveyed (Figure 1; Table 1).
Results
Phylogeny of Y chromosomesBased on 26 Y-SNPs, all 177 newly genotyped males from the
four populations were assigned to specific (sub-)haplogroups
PLoS ONE | www.plosone.org 1 May 2012 | Volume 7 | Issue 5 | e36437
(paragroups) defined in the phylogeny (Figure 2; Table S1). Nearly
60% of the Chams’ Y chromosomes belonged to P191-derived
haplogroups. Within this group, O-M95* predominated and
accounted for around 30% of all samples. Haplogroup C-M216,
consisting of C-M217 and C-M216*, comprised 10.2% of the
patrilineal lineages. One Cham individual (,1.7%) rooted near the
base of the tree as haplogroup F-M213* and six individuals
(,10.2%) rooted at the base of the tree as haplogroup K-P131*.
Notably, South Asian-prevailing haplogroups R-M17 (,13.6%), R-
M124 (,3.4%), and H-M69 (,1.7%) are identified with the Chams.
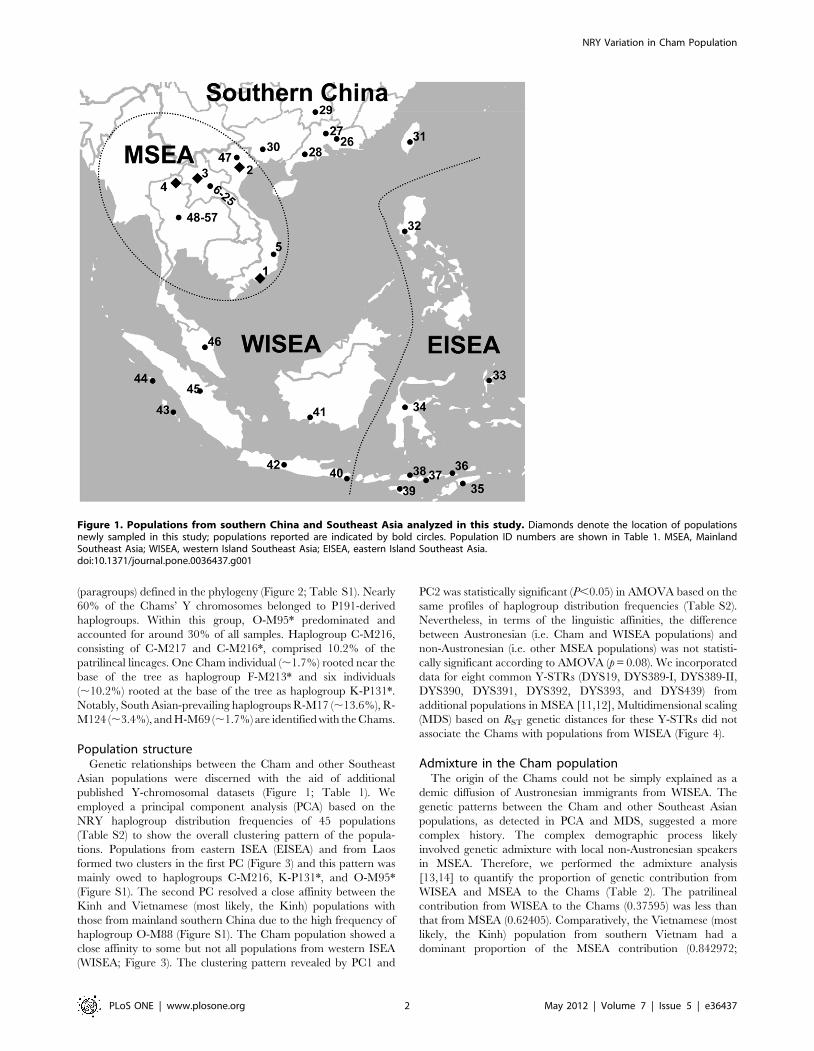
Population structureGenetic relationships between the Cham and other Southeast
Asian populations were discerned with the aid of additional
published Y-chromosomal datasets (Figure 1; Table 1). We
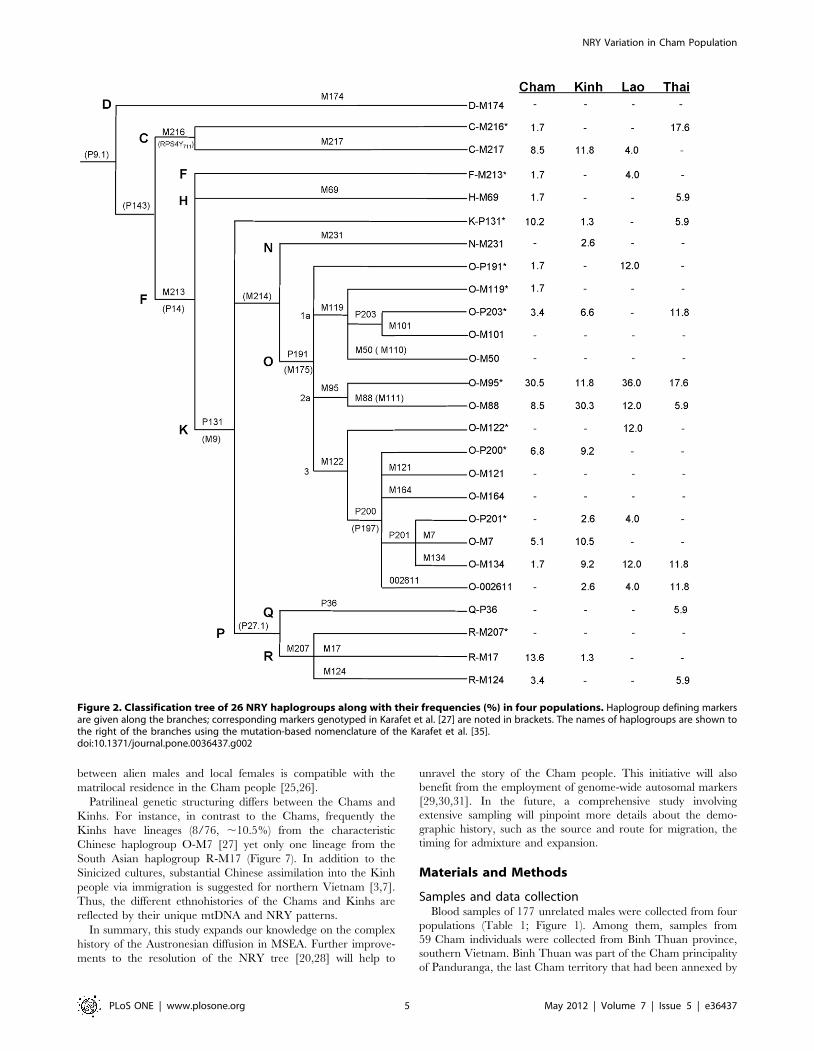
employed a principal component analysis (PCA) based on the
NRY haplogroup distribution frequencies of 45 populations
(Table S2) to show the overall clustering pattern of the popula-
tions. Populations from eastern ISEA (EISEA) and from Laos
formed two clusters in the first PC (Figure 3) and this pattern was
mainly owed to haplogroups C-M216, K-P131*, and O-M95*
(Figure S1). The second PC resolved a close affinity between the
Kinh and Vietnamese (most likely, the Kinh) populations with
those from mainland southern China due to the high frequency of
haplogroup O-M88 (Figure S1). The Cham population showed a
close affinity to some but not all populations from western ISEA
(WISEA; Figure 3). The clustering pattern revealed by PC1 and
PC2 was statistically significant (P,0.05) in AMOVA based on the
same profiles of haplogroup distribution frequencies (Table S2).
Nevertheless, in terms of the linguistic affinities, the difference
between Austronesian (i.e. Cham and WISEA populations) and
non-Austronesian (i.e. other MSEA populations) was not statisti-
cally significant according to AMOVA (p = 0.08). We incorporated
data for eight common Y-STRs (DYS19, DYS389-I, DYS389-II,
DYS390, DYS391, DYS392, DYS393, and DYS439) from
additional populations in MSEA [11,12], Multidimensional scaling
(MDS) based on RST genetic distances for these Y-STRs did not
associate the Chams with populations from WISEA (Figure 4).
Admixture in the Cham populationThe origin of the Chams could not be simply explained as a
demic diffusion of Austronesian immigrants from WISEA. The
genetic patterns between the Cham and other Southeast Asian
populations, as detected in PCA and MDS, suggested a more
complex history. The complex demographic process likely
involved genetic admixture with local non-Austronesian speakers
in MSEA. Therefore, we performed the admixture analysis
[13,14] to quantify the proportion of genetic contribution from
WISEA and MSEA to the Chams (Table 2). The patrilineal
contribution from WISEA to the Chams (0.37595) was less than
that from MSEA (0.62405). Comparatively, the Vietnamese (most
likely, the Kinh) population from southern Vietnam had a
dominant proportion of the MSEA contribution (0.842972;
Figure 1. Populations from southern China and Southeast Asia analyzed in this study. Diamonds denote the location of populationsnewly sampled in this study; populations reported are indicated by bold circles. Population ID numbers are shown in Table 1. MSEA, MainlandSoutheast Asia; WISEA, western Island Southeast Asia; EISEA, eastern Island Southeast Asia.doi:10.1371/journal.pone.0036437.g001
NRY Variation in Cham Population
PLoS ONE | www.plosone.org 2 May 2012 | Volume 7 | Issue 5 | e36437
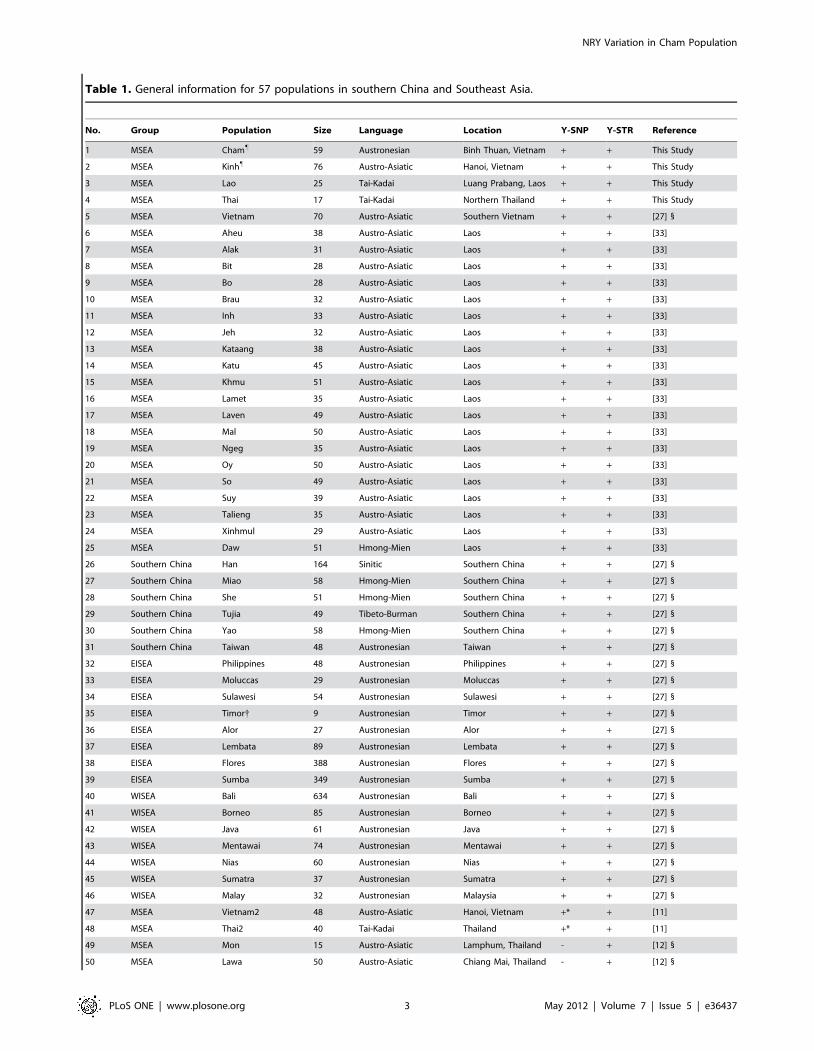
Table 1. General information for 57 populations in southern China and Southeast Asia.
No. Group Population Size Language Location Y-SNP Y-STR Reference
1 MSEA Cham" 59 Austronesian Binh Thuan, Vietnam + + This Study
2 MSEA Kinh" 76 Austro-Asiatic Hanoi, Vietnam + + This Study
3 MSEA Lao 25 Tai-Kadai Luang Prabang, Laos + + This Study
4 MSEA Thai 17 Tai-Kadai Northern Thailand + + This Study
5 MSEA Vietnam 70 Austro-Asiatic Southern Vietnam + + [27] 1
6 MSEA Aheu 38 Austro-Asiatic Laos + + [33]
7 MSEA Alak 31 Austro-Asiatic Laos + + [33]
8 MSEA Bit 28 Austro-Asiatic Laos + + [33]
9 MSEA Bo 28 Austro-Asiatic Laos + + [33]
10 MSEA Brau 32 Austro-Asiatic Laos + + [33]
11 MSEA Inh 33 Austro-Asiatic Laos + + [33]
12 MSEA Jeh 32 Austro-Asiatic Laos + + [33]
13 MSEA Kataang 38 Austro-Asiatic Laos + + [33]
14 MSEA Katu 45 Austro-Asiatic Laos + + [33]
15 MSEA Khmu 51 Austro-Asiatic Laos + + [33]
16 MSEA Lamet 35 Austro-Asiatic Laos + + [33]
17 MSEA Laven 49 Austro-Asiatic Laos + + [33]
18 MSEA Mal 50 Austro-Asiatic Laos + + [33]
19 MSEA Ngeg 35 Austro-Asiatic Laos + + [33]
20 MSEA Oy 50 Austro-Asiatic Laos + + [33]
21 MSEA So 49 Austro-Asiatic Laos + + [33]
22 MSEA Suy 39 Austro-Asiatic Laos + + [33]
23 MSEA Talieng 35 Austro-Asiatic Laos + + [33]
24 MSEA Xinhmul 29 Austro-Asiatic Laos + + [33]
25 MSEA Daw 51 Hmong-Mien Laos + + [33]
26 Southern China Han 164 Sinitic Southern China + + [27] 1
27 Southern China Miao 58 Hmong-Mien Southern China + + [27] 1
28 Southern China She 51 Hmong-Mien Southern China + + [27] 1
29 Southern China Tujia 49 Tibeto-Burman Southern China + + [27] 1
30 Southern China Yao 58 Hmong-Mien Southern China + + [27] 1
31 Southern China Taiwan 48 Austronesian Taiwan + + [27] 1
32 EISEA Philippines 48 Austronesian Philippines + + [27] 1
33 EISEA Moluccas 29 Austronesian Moluccas + + [27] 1
34 EISEA Sulawesi 54 Austronesian Sulawesi + + [27] 1
35 EISEA Timor{ 9 Austronesian Timor + + [27] 1
36 EISEA Alor 27 Austronesian Alor + + [27] 1
37 EISEA Lembata 89 Austronesian Lembata + + [27] 1
38 EISEA Flores 388 Austronesian Flores + + [27] 1
39 EISEA Sumba 349 Austronesian Sumba + + [27] 1
40 WISEA Bali 634 Austronesian Bali + + [27] 1
41 WISEA Borneo 85 Austronesian Borneo + + [27] 1
42 WISEA Java 61 Austronesian Java + + [27] 1
43 WISEA Mentawai 74 Austronesian Mentawai + + [27] 1
44 WISEA Nias 60 Austronesian Nias + + [27] 1
45 WISEA Sumatra 37 Austronesian Sumatra + + [27] 1
46 WISEA Malay 32 Austronesian Malaysia + + [27] 1
47 MSEA Vietnam2 48 Austro-Asiatic Hanoi, Vietnam +* + [11]
48 MSEA Thai2 40 Tai-Kadai Thailand +* + [11]
49 MSEA Mon 15 Austro-Asiatic Lamphum, Thailand - + [12] 1
50 MSEA Lawa 50 Austro-Asiatic Chiang Mai, Thailand - + [12] 1
NRY Variation in Cham Population
PLoS ONE | www.plosone.org 3 May 2012 | Volume 7 | Issue 5 | e36437
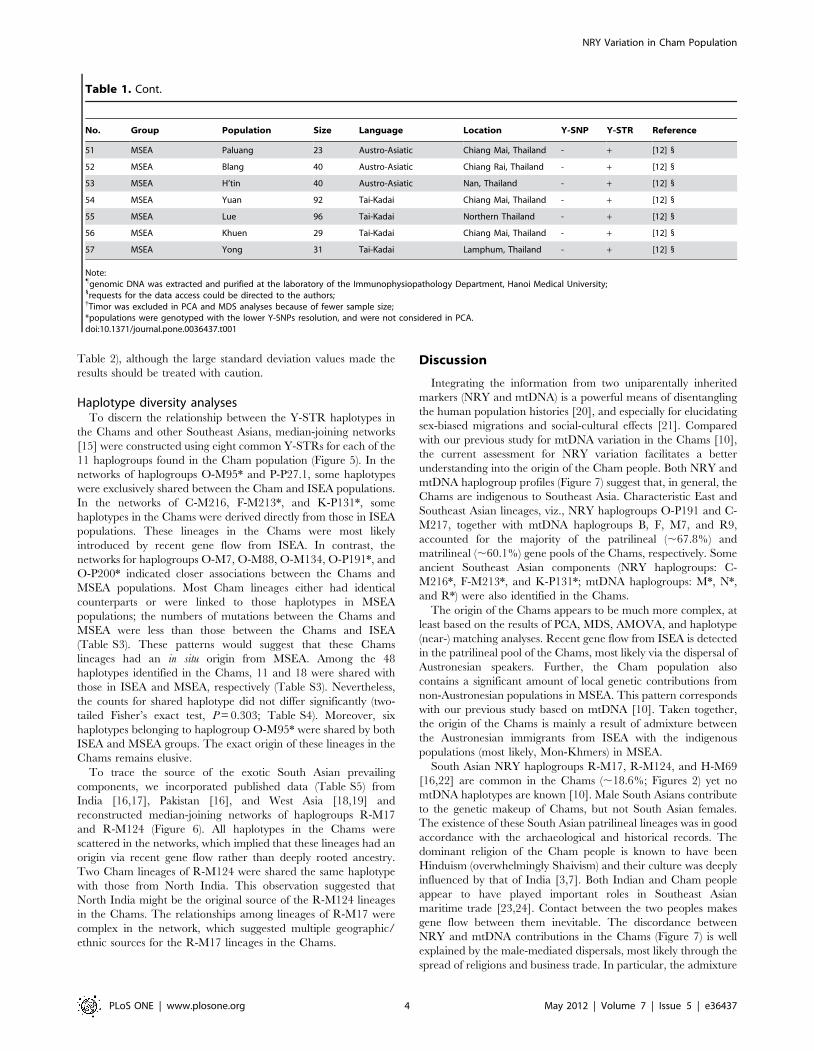
Table 2), although the large standard deviation values made the
results should be treated with caution.
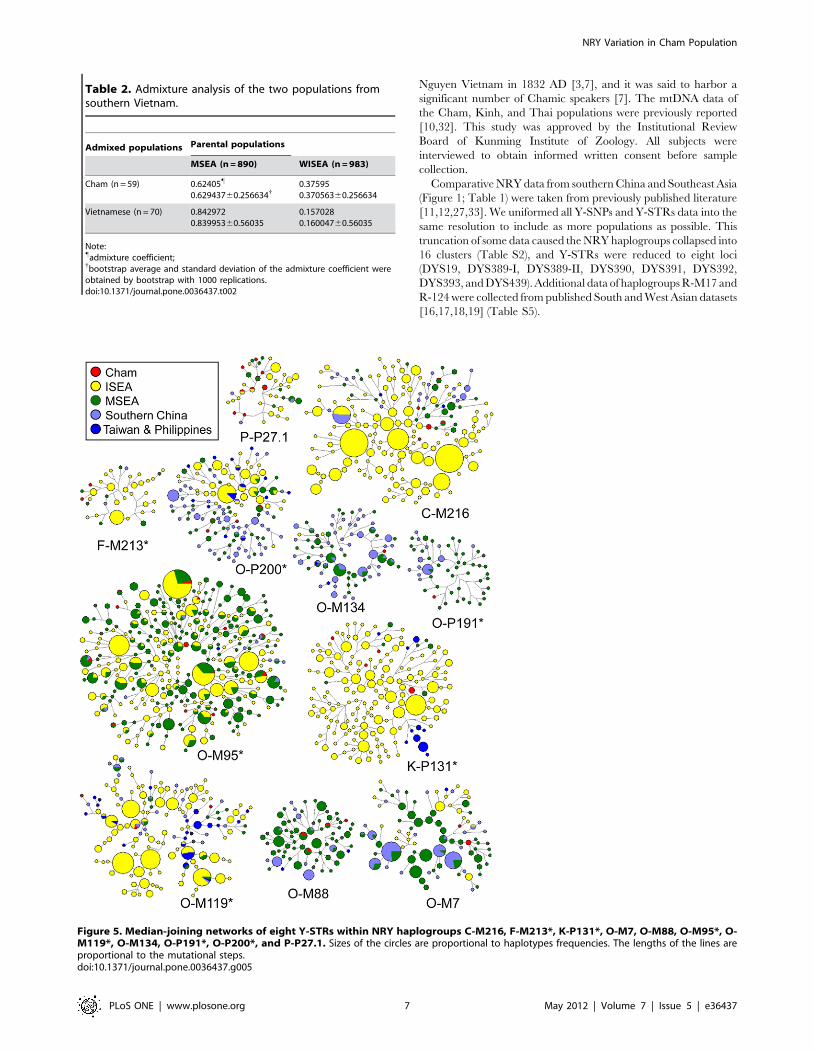
Haplotype diversity analysesTo discern the relationship between the Y-STR haplotypes in
the Chams and other Southeast Asians, median-joining networks
[15] were constructed using eight common Y-STRs for each of the
11 haplogroups found in the Cham population (Figure 5). In the
networks of haplogroups O-M95* and P-P27.1, some haplotypes
were exclusively shared between the Cham and ISEA populations.
In the networks of C-M216, F-M213*, and K-P131*, some
haplotypes in the Chams were derived directly from those in ISEA
populations. These lineages in the Chams were most likely
introduced by recent gene flow from ISEA. In contrast, the
networks for haplogroups O-M7, O-M88, O-M134, O-P191*, and
O-P200* indicated closer associations between the Chams and
MSEA populations. Most Cham lineages either had identical
counterparts or were linked to those haplotypes in MSEA
populations; the numbers of mutations between the Chams and
MSEA were less than those between the Chams and ISEA
(Table S3). These patterns would suggest that these Chams
lineages had an in situ origin from MSEA. Among the 48
haplotypes identified in the Chams, 11 and 18 were shared with
those in ISEA and MSEA, respectively (Table S3). Nevertheless,
the counts for shared haplotype did not differ significantly (two-
tailed Fisher’s exact test, P = 0.303; Table S4). Moreover, six
haplotypes belonging to haplogroup O-M95* were shared by both
ISEA and MSEA groups. The exact origin of these lineages in the
Chams remains elusive.
To trace the source of the exotic South Asian prevailing
components, we incorporated published data (Table S5) from
India [16,17], Pakistan [16], and West Asia [18,19] and
reconstructed median-joining networks of haplogroups R-M17
and R-M124 (Figure 6). All haplotypes in the Chams were
scattered in the networks, which implied that these lineages had an
origin via recent gene flow rather than deeply rooted ancestry.
Two Cham lineages of R-M124 were shared the same haplotype
with those from North India. This observation suggested that
North India might be the original source of the R-M124 lineages
in the Chams. The relationships among lineages of R-M17 were
complex in the network, which suggested multiple geographic/
ethnic sources for the R-M17 lineages in the Chams.
Discussion
Integrating the information from two uniparentally inherited
markers (NRY and mtDNA) is a powerful means of disentangling
the human population histories [20], and especially for elucidating
sex-biased migrations and social-cultural effects [21]. Compared
with our previous study for mtDNA variation in the Chams [10],
the current assessment for NRY variation facilitates a better
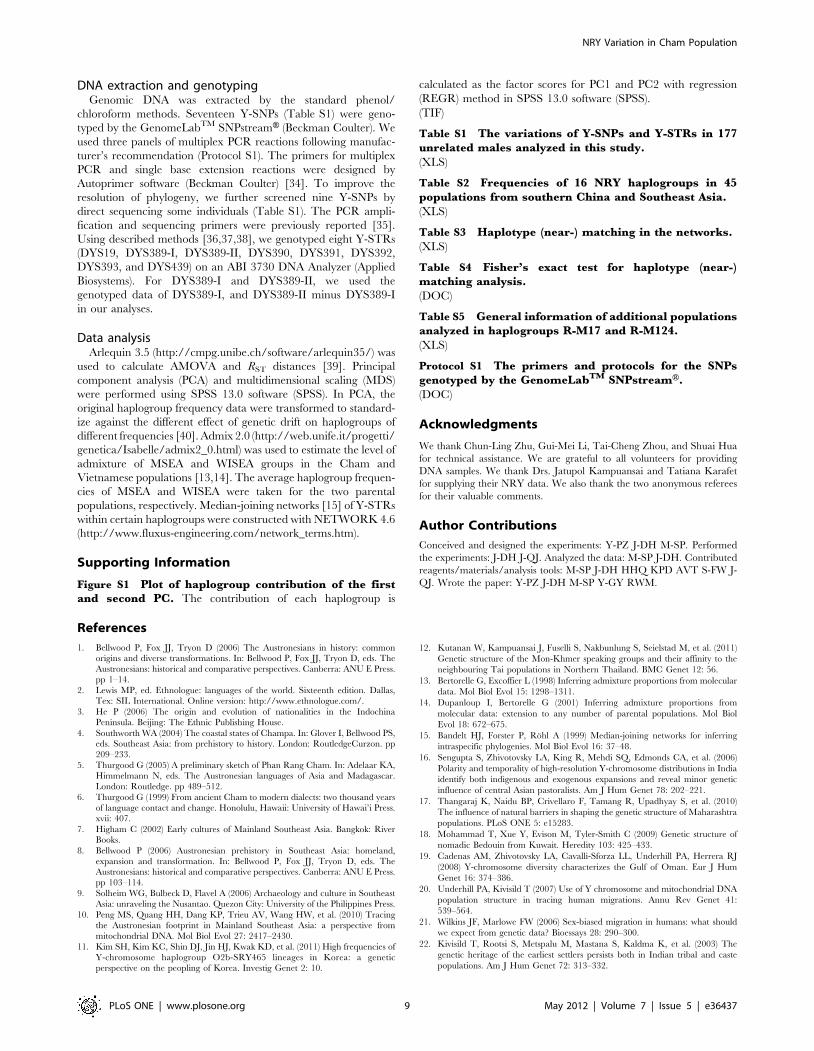
understanding into the origin of the Cham people. Both NRY and
mtDNA haplogroup profiles (Figure 7) suggest that, in general, the
Chams are indigenous to Southeast Asia. Characteristic East and
Southeast Asian lineages, viz., NRY haplogroups O-P191 and C-
M217, together with mtDNA haplogroups B, F, M7, and R9,
accounted for the majority of the patrilineal (,67.8%) and
matrilineal (,60.1%) gene pools of the Chams, respectively. Some
ancient Southeast Asian components (NRY haplogroups: C-
M216*, F-M213*, and K-P131*; mtDNA haplogroups: M*, N*,
and R*) were also identified in the Chams.
The origin of the Chams appears to be much more complex, at
least based on the results of PCA, MDS, AMOVA, and haplotype
(near-) matching analyses. Recent gene flow from ISEA is detected
in the patrilineal pool of the Chams, most likely via the dispersal of
Austronesian speakers. Further, the Cham population also
contains a significant amount of local genetic contributions from
non-Austronesian populations in MSEA. This pattern corresponds
with our previous study based on mtDNA [10]. Taken together,
the origin of the Chams is mainly a result of admixture between
the Austronesian immigrants from ISEA with the indigenous
populations (most likely, Mon-Khmers) in MSEA.
South Asian NRY haplogroups R-M17, R-M124, and H-M69
[16,22] are common in the Chams (,18.6%; Figures 2) yet no
mtDNA haplotypes are known [10]. Male South Asians contribute
to the genetic makeup of Chams, but not South Asian females.
The existence of these South Asian patrilineal lineages was in good
accordance with the archaeological and historical records. The
dominant religion of the Cham people is known to have been
Hinduism (overwhelmingly Shaivism) and their culture was deeply
influenced by that of India [3,7]. Both Indian and Cham people
appear to have played important roles in Southeast Asian
maritime trade [23,24]. Contact between the two peoples makes
gene flow between them inevitable. The discordance between
NRY and mtDNA contributions in the Chams (Figure 7) is well
explained by the male-mediated dispersals, most likely through the
spread of religions and business trade. In particular, the admixture
Table 1. Cont.
No. Group Population Size Language Location Y-SNP Y-STR Reference
51 MSEA Paluang 23 Austro-Asiatic Chiang Mai, Thailand - + [12] 1
52 MSEA Blang 40 Austro-Asiatic Chiang Rai, Thailand - + [12] 1
53 MSEA H’tin 40 Austro-Asiatic Nan, Thailand - + [12] 1
54 MSEA Yuan 92 Tai-Kadai Chiang Mai, Thailand - + [12] 1
55 MSEA Lue 96 Tai-Kadai Northern Thailand - + [12] 1
56 MSEA Khuen 29 Tai-Kadai Chiang Mai, Thailand - + [12] 1
57 MSEA Yong 31 Tai-Kadai Lamphum, Thailand - + [12] 1
Note:"genomic DNA was extracted and purified at the laboratory of the Immunophysiopathology Department, Hanoi Medical University;1requests for the data access could be directed to the authors;{Timor was excluded in PCA and MDS analyses because of fewer sample size;*populations were genotyped with the lower Y-SNPs resolution, and were not considered in PCA.doi:10.1371/journal.pone.0036437.t001
NRY Variation in Cham Population
PLoS ONE | www.plosone.org 4 May 2012 | Volume 7 | Issue 5 | e36437
between alien males and local females is compatible with the
matrilocal residence in the Cham people [25,26].
Patrilineal genetic structuring differs between the Chams and
Kinhs. For instance, in contrast to the Chams, frequently the
Kinhs have lineages (8/76, ,10.5%) from the characteristic
Chinese haplogroup O-M7 [27] yet only one lineage from the
South Asian haplogroup R-M17 (Figure 7). In addition to the
Sinicized cultures, substantial Chinese assimilation into the Kinh
people via immigration is suggested for northern Vietnam [3,7].
Thus, the different ethnohistories of the Chams and Kinhs are
reflected by their unique mtDNA and NRY patterns.
In summary, this study expands our knowledge on the complex
history of the Austronesian diffusion in MSEA. Further improve-
ments to the resolution of the NRY tree [20,28] will help to
unravel the story of the Cham people. This initiative will also
benefit from the employment of genome-wide autosomal markers
[29,30,31]. In the future, a comprehensive study involving
extensive sampling will pinpoint more details about the demo-
graphic history, such as the source and route for migration, the
timing for admixture and expansion.
Materials and Methods
Samples and data collectionBlood samples of 177 unrelated males were collected from four
populations (Table 1; Figure 1). Among them, samples from
59 Cham individuals were collected from Binh Thuan province,
southern Vietnam. Binh Thuan was part of the Cham principality
of Panduranga, the last Cham territory that had been annexed by
Figure 2. Classification tree of 26 NRY haplogroups along with their frequencies (%) in four populations. Haplogroup defining markersare given along the branches; corresponding markers genotyped in Karafet et al. [27] are noted in brackets. The names of haplogroups are shown tothe right of the branches using the mutation-based nomenclature of the Karafet et al. [35].doi:10.1371/journal.pone.0036437.g002
NRY Variation in Cham Population
PLoS ONE | www.plosone.org 5 May 2012 | Volume 7 | Issue 5 | e36437
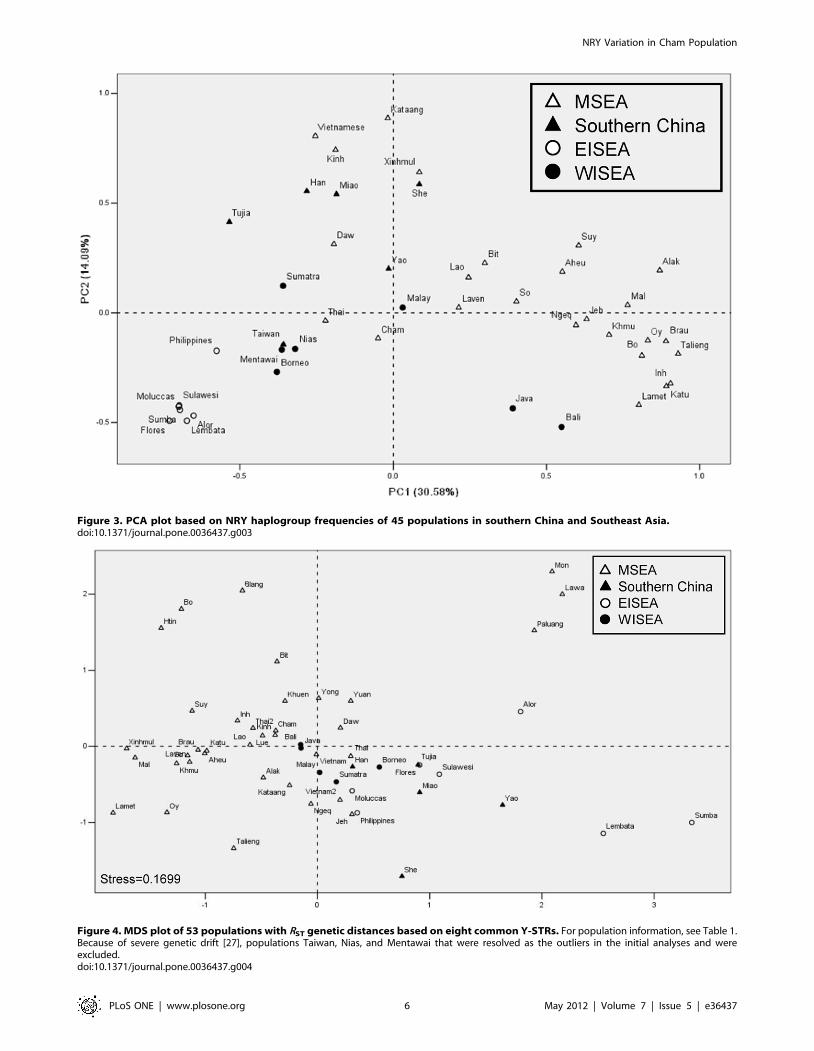
Figure 4. MDS plot of 53 populations with RST genetic distances based on eight common Y-STRs. For population information, see Table 1.Because of severe genetic drift [27], populations Taiwan, Nias, and Mentawai that were resolved as the outliers in the initial analyses and wereexcluded.doi:10.1371/journal.pone.0036437.g004
Figure 3. PCA plot based on NRY haplogroup frequencies of 45 populations in southern China and Southeast Asia.doi:10.1371/journal.pone.0036437.g003
NRY Variation in Cham Population
PLoS ONE | www.plosone.org 6 May 2012 | Volume 7 | Issue 5 | e36437
Nguyen Vietnam in 1832 AD [3,7], and it was said to harbor a
significant number of Chamic speakers [7]. The mtDNA data of
the Cham, Kinh, and Thai populations were previously reported
[10,32]. This study was approved by the Institutional Review
Board of Kunming Institute of Zoology. All subjects were
interviewed to obtain informed written consent before sample
collection.
Comparative NRY data from southern China and Southeast Asia
(Figure 1; Table 1) were taken from previously published literature
[11,12,27,33]. We uniformed all Y-SNPs and Y-STRs data into the
same resolution to include as more populations as possible. This
truncation of some data caused the NRY haplogroups collapsed into
16 clusters (Table S2), and Y-STRs were reduced to eight loci
(DYS19, DYS389-I, DYS389-II, DYS390, DYS391, DYS392,
DYS393, and DYS439). Additional data of haplogroups R-M17 and
R-124 were collected from published South and West Asian datasets
[16,17,18,19] (Table S5).
Figure 5. Median-joining networks of eight Y-STRs within NRY haplogroups C-M216, F-M213*, K-P131*, O-M7, O-M88, O-M95*, O-M119*, O-M134, O-P191*, O-P200*, and P-P27.1. Sizes of the circles are proportional to haplotypes frequencies. The lengths of the lines areproportional to the mutational steps.doi:10.1371/journal.pone.0036437.g005
Table 2. Admixture analysis of the two populations fromsouthern Vietnam.
Admixed populations Parental populations
MSEA (n = 890) WISEA (n = 983)
Cham (n = 59) 0.62405"
0.62943760.256634{0.375950.37056360.256634
Vietnamese (n = 70) 0.8429720.83995360.56035
0.1570280.16004760.56035
Note:"admixture coefficient;{bootstrap average and standard deviation of the admixture coefficient wereobtained by bootstrap with 1000 replications.doi:10.1371/journal.pone.0036437.t002
NRY Variation in Cham Population
PLoS ONE | www.plosone.org 7 May 2012 | Volume 7 | Issue 5 | e36437
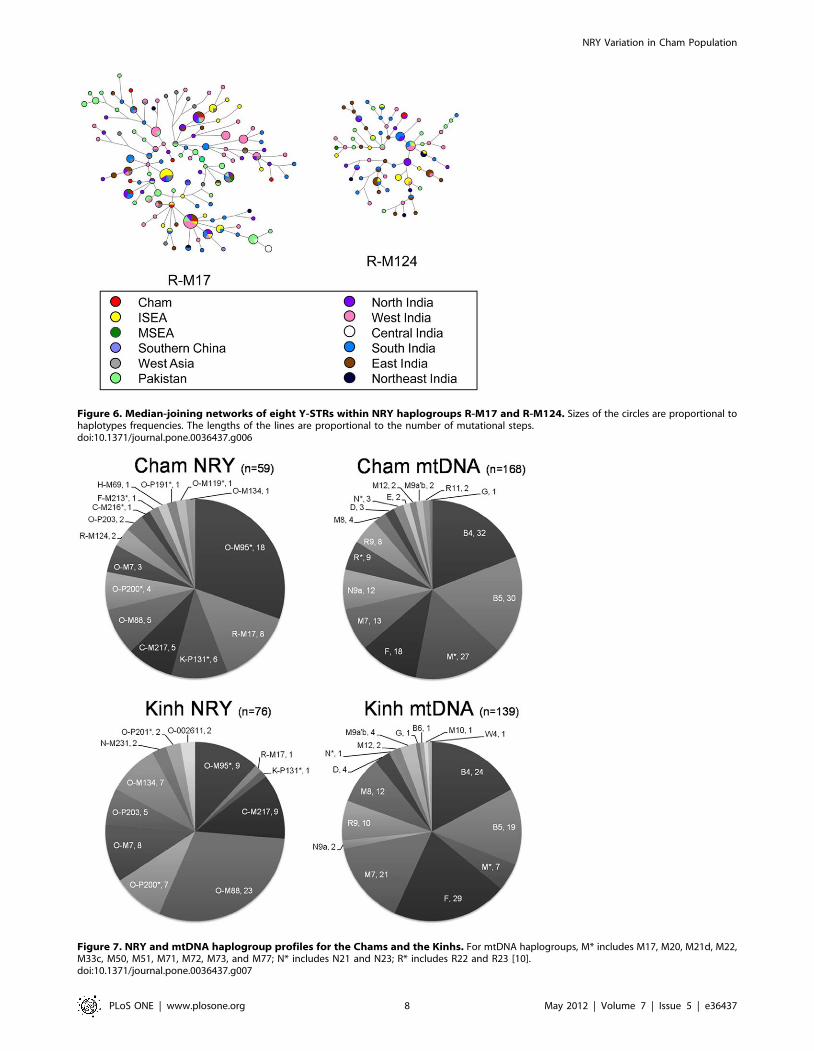
Figure 6. Median-joining networks of eight Y-STRs within NRY haplogroups R-M17 and R-M124. Sizes of the circles are proportional tohaplotypes frequencies. The lengths of the lines are proportional to the number of mutational steps.doi:10.1371/journal.pone.0036437.g006
Figure 7. NRY and mtDNA haplogroup profiles for the Chams and the Kinhs. For mtDNA haplogroups, M* includes M17, M20, M21d, M22,M33c, M50, M51, M71, M72, M73, and M77; N* includes N21 and N23; R* includes R22 and R23 [10].doi:10.1371/journal.pone.0036437.g007
NRY Variation in Cham Population
PLoS ONE | www.plosone.org 8 May 2012 | Volume 7 | Issue 5 | e36437
DNA extraction and genotypingGenomic DNA was extracted by the standard phenol/
chloroform methods. Seventeen Y-SNPs (Table S1) were geno-
typed by the GenomeLabTM SNPstreamH (Beckman Coulter). We
used three panels of multiplex PCR reactions following manufac-
turer’s recommendation (Protocol S1). The primers for multiplex
PCR and single base extension reactions were designed by
Autoprimer software (Beckman Coulter) [34]. To improve the
resolution of phylogeny, we further screened nine Y-SNPs by
direct sequencing some individuals (Table S1). The PCR ampli-
fication and sequencing primers were previously reported [35].
Using described methods [36,37,38], we genotyped eight Y-STRs
(DYS19, DYS389-I, DYS389-II, DYS390, DYS391, DYS392,
DYS393, and DYS439) on an ABI 3730 DNA Analyzer (Applied
Biosystems). For DYS389-I and DYS389-II, we used the
genotyped data of DYS389-I, and DYS389-II minus DYS389-I
in our analyses.
Data analysisArlequin 3.5 (http://cmpg.unibe.ch/software/arlequin35/) was
used to calculate AMOVA and RST distances [39]. Principal
component analysis (PCA) and multidimensional scaling (MDS)
were performed using SPSS 13.0 software (SPSS). In PCA, the
original haplogroup frequency data were transformed to standard-
ize against the different effect of genetic drift on haplogroups of
different frequencies [40]. Admix 2.0 (http://web.unife.it/progetti/
genetica/Isabelle/admix2_0.html) was used to estimate the level of
admixture of MSEA and WISEA groups in the Cham and
Vietnamese populations [13,14]. The average haplogroup frequen-
cies of MSEA and WISEA were taken for the two parental
populations, respectively. Median-joining networks [15] of Y-STRs
within certain haplogroups were constructed with NETWORK 4.6
(http://www.fluxus-engineering.com/network_terms.htm).
Supporting Information
Figure S1 Plot of haplogroup contribution of the firstand second PC. The contribution of each haplogroup is
calculated as the factor scores for PC1 and PC2 with regression
(REGR) method in SPSS 13.0 software (SPSS).
(TIF)
Table S1 The variations of Y-SNPs and Y-STRs in 177unrelated males analyzed in this study.
(XLS)
Table S2 Frequencies of 16 NRY haplogroups in 45populations from southern China and Southeast Asia.
(XLS)
Table S3 Haplotype (near-) matching in the networks.
(XLS)
Table S4 Fisher’s exact test for haplotype (near-)matching analysis.
(DOC)
Table S5 General information of additional populationsanalyzed in haplogroups R-M17 and R-M124.
(XLS)
Protocol S1 The primers and protocols for the SNPsgenotyped by the GenomeLabTM SNPstreamH.
(DOC)
Acknowledgments
We thank Chun-Ling Zhu, Gui-Mei Li, Tai-Cheng Zhou, and Shuai Hua
for technical assistance. We are grateful to all volunteers for providing
DNA samples. We thank Drs. Jatupol Kampuansai and Tatiana Karafet
for supplying their NRY data. We also thank the two anonymous referees
for their valuable comments.
Author Contributions
Conceived and designed the experiments: Y-PZ J-DH M-SP. Performed
the experiments: J-DH J-QJ. Analyzed the data: M-SP J-DH. Contributed
reagents/materials/analysis tools: M-SP J-DH HHQ KPD AVT S-FW J-
QJ. Wrote the paper: Y-PZ J-DH M-SP Y-GY RWM.
References
1. Bellwood P, Fox JJ, Tryon D (2006) The Austronesians in history: commonorigins and diverse transformations. In: Bellwood P, Fox JJ, Tryon D, eds. The
Austronesians: historical and comparative perspectives. Canberra: ANU E Press.
pp 1–14.
2. Lewis MP, ed. Ethnologue: languages of the world. Sixteenth edition. Dallas,
Tex: SIL International. Online version: http://www.ethnologue.com/.
3. He P (2006) The origin and evolution of nationalities in the Indochina
Peninsula. Beijing: The Ethnic Publishing House.
4. Southworth WA (2004) The coastal states of Champa. In: Glover I, Bellwood PS,eds. Southeast Asia: from prehistory to history. London: RoutledgeCurzon. pp
209–233.
5. Thurgood G (2005) A preliminary sketch of Phan Rang Cham. In: Adelaar KA,
Himmelmann N, eds. The Austronesian languages of Asia and Madagascar.
London: Routledge. pp 489–512.
6. Thurgood G (1999) From ancient Cham to modern dialects: two thousand years
of language contact and change. Honolulu, Hawaii: University of Hawai’i Press.xvii: 407.
7. Higham C (2002) Early cultures of Mainland Southeast Asia. Bangkok: RiverBooks.
8. Bellwood P (2006) Austronesian prehistory in Southeast Asia: homeland,
expansion and transformation. In: Bellwood P, Fox JJ, Tryon D, eds. TheAustronesians: historical and comparative perspectives. Canberra: ANU E Press.
pp 103–114.
9. Solheim WG, Bulbeck D, Flavel A (2006) Archaeology and culture in Southeast
Asia: unraveling the Nusantao. Quezon City: University of the Philippines Press.
10. Peng MS, Quang HH, Dang KP, Trieu AV, Wang HW, et al. (2010) Tracingthe Austronesian footprint in Mainland Southeast Asia: a perspective from
mitochondrial DNA. Mol Biol Evol 27: 2417–2430.
11. Kim SH, Kim KC, Shin DJ, Jin HJ, Kwak KD, et al. (2011) High frequencies of
Y-chromosome haplogroup O2b-SRY465 lineages in Korea: a genetic
perspective on the peopling of Korea. Investig Genet 2: 10.
12. Kutanan W, Kampuansai J, Fuselli S, Nakbunlung S, Seielstad M, et al. (2011)
Genetic structure of the Mon-Khmer speaking groups and their affinity to the
neighbouring Tai populations in Northern Thailand. BMC Genet 12: 56.
13. Bertorelle G, Excoffier L (1998) Inferring admixture proportions from molecular
data. Mol Biol Evol 15: 1298–1311.
14. Dupanloup I, Bertorelle G (2001) Inferring admixture proportions from
molecular data: extension to any number of parental populations. Mol Biol
Evol 18: 672–675.
15. Bandelt HJ, Forster P, Rohl A (1999) Median-joining networks for inferring
intraspecific phylogenies. Mol Biol Evol 16: 37–48.
16. Sengupta S, Zhivotovsky LA, King R, Mehdi SQ, Edmonds CA, et al. (2006)
Polarity and temporality of high-resolution Y-chromosome distributions in India
identify both indigenous and exogenous expansions and reveal minor genetic
influence of central Asian pastoralists. Am J Hum Genet 78: 202–221.
17. Thangaraj K, Naidu BP, Crivellaro F, Tamang R, Upadhyay S, et al. (2010)
The influence of natural barriers in shaping the genetic structure of Maharashtra
populations. PLoS ONE 5: e15283.
18. Mohammad T, Xue Y, Evison M, Tyler-Smith C (2009) Genetic structure of
nomadic Bedouin from Kuwait. Heredity 103: 425–433.
19. Cadenas AM, Zhivotovsky LA, Cavalli-Sforza LL, Underhill PA, Herrera RJ
(2008) Y-chromosome diversity characterizes the Gulf of Oman. Eur J Hum
Genet 16: 374–386.
20. Underhill PA, Kivisild T (2007) Use of Y chromosome and mitochondrial DNA
population structure in tracing human migrations. Annu Rev Genet 41:
539–564.
21. Wilkins JF, Marlowe FW (2006) Sex-biased migration in humans: what should
we expect from genetic data? Bioessays 28: 290–300.
22. Kivisild T, Rootsi S, Metspalu M, Mastana S, Kaldma K, et al. (2003) The
genetic heritage of the earliest settlers persists both in Indian tribal and caste
populations. Am J Hum Genet 72: 313–332.
NRY Variation in Cham Population
PLoS ONE | www.plosone.org 9 May 2012 | Volume 7 | Issue 5 | e36437
23. Reid A (1988) Southeast Asia in the age of commerce, 1450–1680 Volume One:
the lands below the winds. New Heaven: Yale University Press.24. Reid A (1988) Southeast Asia in the age of commerce, 1450–1680 Volume Two:
expansion and crisis. New Heaven: Yale University Press.
25. Jordan FM, Gray RD, Greenhill SJ, Mace R (2009) Matrilocal residence isancestral in Austronesian societies. Proc R Soc B 276: 1957–1964.
26. Nakamura R (2009) Awar-Ahier: Two Keys to Understanding the Cosmology andEthnicity of the Cham People (Ninh Thuan Province, Vietnam). In: Hardy A,
Cucarzi M, Zolese P, eds. Champa and the archaeology of My So’n (Vietnam).
Singapore: NUS Press. pp 78–106.27. Karafet TM, Hallmark B, Cox MP, Sudoyo H, Downey S, et al. (2010) Major
east-west division underlies Y chromosome stratification across Indonesia. MolBiol Evol 27: 1833–1844.
28. Cruciani F, Trombetta B, Massaia A, Destro-Bisol G, Sellitto D, et al. (2011) Arevised root for the human y chromosomal phylogenetic tree: the origin of
patrilineal diversity in Africa. Am J Hum Genet 88: 814–818.
29. Friedlaender JS, Friedlaender FR, Reed FA, Kidd KK, Kidd JR, et al. (2008)The genetic structure of Pacific Islanders. PLoS Genet 4: e19.
30. Kayser M, Lao O, Saar K, Brauer S, Wang XY, et al. (2008) Genorne-wideanalysis indicates more Asian than melanesian ancestry of polynesians.
Am J Hum Genet 82: 194–198.
31. The HUGO Pan-Asian Consortium (2009) Mapping human genetic diversity inAsia. Science 326: 1541–1545.
32. Yao YG, Nie L, Harpending H, Fu YX, Yuan ZG, et al. (2002) Geneticrelationship of Chinese ethnic populations revealed by mtDNA sequence
diversity. Am J Phys Anthropol 118: 63–76.
33. Cai X, Qin Z, Wen B, Xu S, Wang Y, et al. (2011) Human migration through
bottlenecks from Southeast Asia into East Asia during Last Glacial Maximum
revealed by Y chromosomes. PLoS ONE 6: e24282.
34. Debnath M, Palanichamy MG, Mitra B, Jin JQ, Chaudhuri TK, et al. (2011) Y-
chromosome haplogroup diversity in the sub-Himalayan Terai and Duars
populations of East India. J Hum Genet 56: 765–771.
35. Karafet TM, Mendez FL, Meilerman MB, Underhill PA, Zegura SL, et al.
(2008) New binary polymorphisms reshape and increase resolution of the human
Y chromosomal haplogroup tree. Genome Res 18: 830–838.
36. Thomas MG, Bradman N, Flinn HM (1999) High throughput analysis of 10
microsatellite and 11 diallelic polymorphisms on the human Y-chromosome.
Hum Genet 105: 577–581.
37. Ayub Q, Mohyuddin A, Qamar R, Mazhar K, Zerjal T, et al. (2000)
Identification and characterisation of novel human Y-chromosomal microsat-
ellites from sequence database information. Nucleic Acids Res 28: e8.
38. Prinz M, Boll K, Baum H, Shaler B (1997) Multiplexing of Y chromosome
specific STRs and performance for mixed samples. Forensic Sci Int 85: 209–218.
39. Excoffier L, Lischer HEL (2010) Arlequin suite ver 3.5: a new series of programs
to perform population genetics analyses under Linux and Windows. Mol Ecol
Resour 10: 564–567.
40. Richards M, Macaulay V, Torroni A, Bandelt HJ (2002) In search of
geographical patterns in European mitochondrial DNA. Am J Hum Genet
71: 1168–1174.
NRY Variation in Cham Population
PLoS ONE | www.plosone.org 10 May 2012 | Volume 7 | Issue 5 | e36437