Embed Size (px)
Citation preview

Patrick Kelly
National Center for Higher Education Management Systems
Presentation to the Louisiana Postsecondary Education Review Commission
September 29, 2009
Productivity and the Impact of Shifting Enrollments and Resources

Different Approaches to Analyzing Productivity
State and Local AppropriationsTuition and FeesEndowment IncomeGovernment Grants and ContractsPrivate Gifts, Grants and ContractsOther E&G Revenue
InstructionStudent ServicesAcademic SupportInstitutional SupportPlant Operation and MaintenanceResearchPublic ServiceScholarships and Fellowships
Programmatic CostsStudent/Faculty RatiosFaculty WorkloadFaculty and Staff Attrition Administrative Staffing PatternsAcademic Program MixCourse Delivery ModesSpace Utilization
Public Investment vs. Performance
Institutional Spending vs. Performance
Cost Savings and Efficiency
General Revenues
General Expenditures Internal Operations
Degree ProductionRetention and Graduation RatesExternal Research
Outcomes and Performance
2

Different Approaches to Analyzing Productivity
State and Local AppropriationsTuition and FeesEndowment IncomeGovernment Grants and ContractsPrivate Gifts, Grants and ContractsOther E&G Revenue
InstructionStudent ServicesAcademic SupportInstitutional SupportPlant Operation and MaintenanceResearchPublic ServiceScholarships and Fellowships
Programmatic CostsStudent/Faculty RatiosFaculty WorkloadFaculty and Staff Attrition Administrative Staffing PatternsAcademic Program MixCourse Delivery ModesSpace Utilization
Public Investment vs. Performance
Institutional Spending vs. Performance
Cost Savings and Efficiency
General Revenues
General Expenditures Internal Operations
Degree ProductionRetention and Graduation RatesExternal Research
Outcomes and Performance
NCHEMS Approach
Total Unrestricted Revenues
3

Different Approaches to Analyzing Productivity
State and Local AppropriationsTuition and FeesEndowment IncomeGovernment Grants and ContractsPrivate Gifts, Grants and ContractsOther E&G Revenue
InstructionStudent ServicesAcademic SupportInstitutional SupportPlant Operation and MaintenanceResearchPublic ServiceScholarships and Fellowships
Programmatic CostsStudent/Faculty RatiosFaculty WorkloadFaculty and Staff Attrition Administrative Staffing PatternsAcademic Program MixCourse Delivery ModesSpace Utilization
Public Investment vs. Performance
Institutional Spending vs. Performance
Cost Savings and Efficiency
General Revenues
General Expenditures Internal Operations
Degree ProductionRetention and Graduation RatesExternal Research
Outcomes and Performance
Delta Approach
Education Related Expenses
4
Different Approaches to Analyzing Productivity
State and Local AppropriationsTuition and FeesEndowment IncomeGovernment Grants and ContractsPrivate Gifts, Grants and ContractsOther E&G Revenue
InstructionStudent ServicesAcademic SupportInstitutional SupportPlant Operation and MaintenanceResearchPublic ServiceScholarships and Fellowships
Programmatic CostsStudent/Faculty RatiosFaculty WorkloadFaculty and Staff Attrition Administrative Staffing PatternsAcademic Program MixCourse Delivery ModesSpace Utilization
Public Investment vs. Performance
Institutional Spending vs. Performance
Cost Savings and Efficiency
General Revenues
General Expenditures Internal Operations
Degree ProductionRetention and Graduation RatesExternal Research
Outcomes and Performance
5

A New Look at the Institutional Component of Higher Education Finance: A Guide for Evaluating Performance
Relative to Financial Resources (2005)
The Dreaded “P” Work: An Examination of Productivity in Public Postsecondary Education (2009)
NCHEMS Reports on Higher Education Productivity
Available at www.nchems.org 6

The Dreaded “P’ Word: An Examination of Productivity in Public
Postsecondary Education
7

Internal
Public Investment from State and
Students
Postsecondary Education
Institutions
Costs of Producing Degrees
Production of Degrees – and Value to Students
and the State
Policy Focus
External
Focus of this Report
8
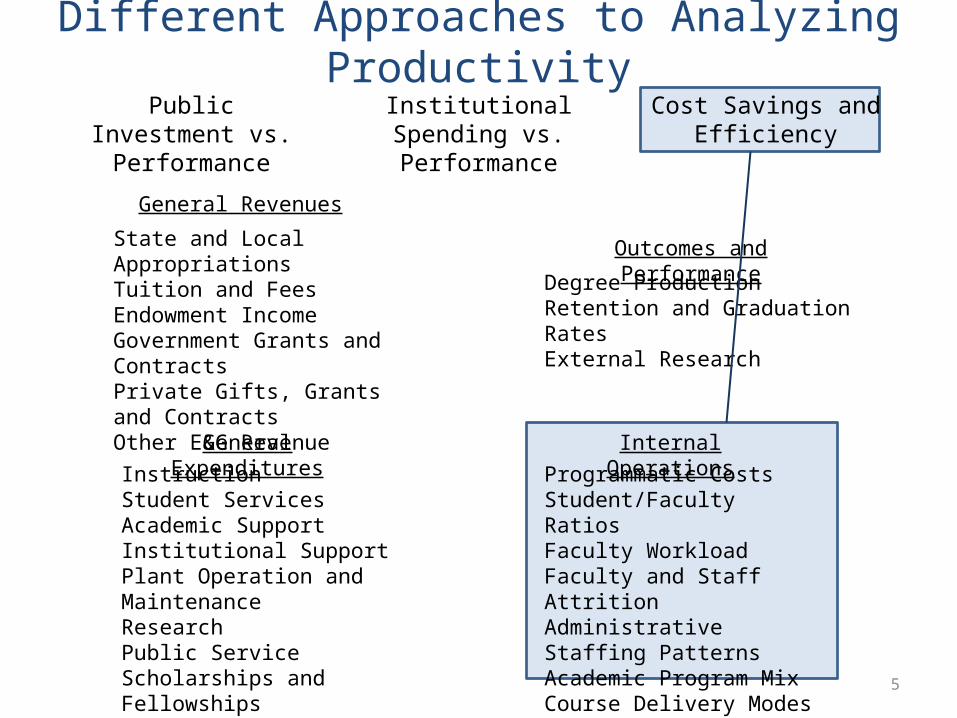
Calculating Public Higher Education Productivity(Using Alabama as an Example)
Total State and Local Appropriations and Tuition Revenues for Public Higher Education = $2,394,572,347
Total Funding =
Annual Degrees and Certificates Awarded in Public Colleges and Universities (Weighted for Market Value) = 42,548
Certificates and Degrees Awarded
=
Productivity Total Funding per Certificate and Degree Produced = $56,280 =
1.
3.
2.
Degrees Weighted by Value to the State and Individuals: Median Earnings in the State Employment Market
Note: STEM includes credentials awarded in computer science and technology, architecture and engineering, mathematics and statistics, and biological and life sciences.
Degree-LevelMedian Earnings
Indexed to Bachelor's Degrees
AwardsWeighted Awards
Certificates 27,423 0.68 3,682 2,485 Certificates STEM 44,690 1.10 250 275 Associates 32,502 0.80 6,977 5,582 Associates STEM 47,737 1.18 466 548 Bachelors 40,627 1.00 15,590 15,590 Bachelors STEM 67,035 1.65 2,909 4,800 Masters 44,893 1.11 8,270 9,138 Masters STEM 76,176 1.88 825 1,547 Doctorates 66,019 1.63 485 788 Doctorates STEM 71,097 1.75 200 350 First-Professionals 87,348 2.15 672 1,445 TOTAL 40,326 42,548
*
* “Some college, but no degree” was used as a proxy for median earnings of certificate degree-holders.
9

NJ
DE
CT
MD
ME
VA
PA RI
NC
MANHNY
VT
WV
OH
FL
SC
INIL
KY
TN
GAALMS
MI
WI
MN
IA
MO
AR
LA
OK
KS
NE
SD
ND
CO
TX
NMAZ
UT
ID
NV
CA
WY
MT
OR
WA
AK
HI
12,484 to 18,35210,741 to 12,4849,715 to 10,7417,873 to 9,715
Total Funding per FTE Student (2007-08)
Source: SHEEO State Higher Education Finance Survey 200810

Total Funding per FTE Student by State and Student Share (2007-08)
Source: SHEEO State Higher Education Finance Survey 2008
AlaskaD
elaware
Wyom
ingConnecticutH
awaii
Vermont
New
JerseyRhode IslandM
assachusetts
Maryland
Alabama
PennsylvaniaM
ichiganM
aineN
ew York
KentuckyIow
aTennesseeN
ew H
ampshire
IndianaSouth CarolinaArizonaN
ew M
exicoM
innesotaVirginiaO
hioTexasU
nited StatesN
ebraskaW
isconsinN
evadaN
orth CarolinaIllinoisIdahoG
eorgiaKansasM
issouriSouth D
akotaO
klahoma
Oregon
Utah
ArkansasLouisianaM
ississippiColoradoM
ontanaW
ashingtonW
est VirginiaN
orth Dakota
CaliforniaFlorida
-
5,000
10,000
15,000
20,000
25,000
30,000
35,000
40,000
18,
352
17,
738
17,
408
16,
726
15,
484
14,
616
14,
579
14,
514
14,
487
13,
614
13,
127
13,
073
13,
048
12,
484
12,
317
12,
299
11,
731
11,
513
11,
382
11,
319
11,
205
10,
940
10,
932
10,
911
10,
881
10,
741
10,
635
10,
618
10,
540
10,
419
10,
387
10,
253
10,
165
10,
143
10,
096
10,
023
9,8
47
9,8
24
9,7
15
9,6
11
9,5
14
9,3
68
9,2
74
9,2
40
9,1
59
9,1
24
8,9
84
8,9
52
8,7
31
8,4
25
7,8
73
Tuition and FeesState and Local
11

Annual FTE Enrollment by Public Sector (2006-07)
Source: NCES, IPEDS Fall Enrollment Survey
CaliforniaW
yoming
IllinoisW
ashingtonFloridaIow
aArizonaN
orth CarolinaN
ew M
exicoN
ew Jersey
TexasM
ississippiO
regonH
awaii
Nevada
Nebraska
Nation
Minnesota
South CarolinaN
ew York
Maryland
ConnecticutG
eorgiaM
assachusetts
KansasM
ichiganM
issouriVirginiaO
klahoma
Ohio
ArkansasW
isconsinAlabam
aRhode IslandTennesseeKentuckyD
elaware
ColoradoPennsylvaniaM
aineIndianaLouisianaU
tahN
orth Dakota
IdahoN
ew H
ampshire
South Dakota
Vermont
West Virginia
Montana
Alaska
0%
20%
40%
60%
80%
100%
Public Two-Year Public Bachelor's and Masters Public Research
12

Degrees and Certificates Awarded* per 100 FTE Students (2006-07)
ColoradoU
tahO
klahoma
KentuckyFloridaW
ashingtonN
ew H
ampshire
Iowa
KansasW
isconsinSouth D
akotaG
eorgiaArizonaN
orth Dakota
Minnesota
ConnecticutM
ichiganVerm
ontW
est VirginiaM
ontanaIdahoIllinoisIndianaVirginiaH
awaii
LouisianaD
elaware
Alabama
PennsylvaniaSouth CarolinaO
hioM
arylandM
aineN
ew Jersey
United States
Massachusett
sTexasN
ebraskaO
regonTennesseeArkansasW
yoming
New
YorkM
ississippiM
issouriAlaskaN
ew M
exicoN
orth CarolinaRhode IslandN
evadaCalifornia
0
7
14
21
28
3530
28 28 2827 27 27 26 26 26 26 26 26 25 25 25 25 25 25 24 24 24 24 24 23 23 23 23 23 23 23 23 23 23 23 22 22 22 22 22 22 22 22 22 21 21
21 2120
1816
* Adjusted for value of degrees in the state employment market (median earnings by degree type and level)Sources: SHEEO State Higher Education Finance Survey 2008; NCES, IPEDS Completions Survey; U.S. Census Bureau, American Community Survey (Public Use Microdata Samples)
13

Degrees and Certificates Awarded* by Level (2006-07)
* Adjusted for value of degrees in the state employment market (median earnings by degree type and level)
Alabama
AlaskaArizonaArkansasCaliforniaColoradoConnecticutD
elaware
FloridaG
eorgiaH
awaii
IdahoIllinoisIndianaIow
aKansasKentuckyLouisianaM
aineM
arylandM
assachusetts
Michigan
Minnesota
Mississippi
Missouri
Montana
Nebraska
Nevada
New
Ham
pshireN
ew Jersey
New
Mexico
New
YorkN
orth CarolinaN
orth Dakota
Ohio
Oklahom
aO
regonPennsylvaniaRhode IslandSouth CarolinaSouth D
akotaTennesseeTexasU
tahVerm
ontVirginiaW
ashingtonW
est VirginiaW
isconsinW
yoming
United States
0%
20%
40%
60%
80%
100%
Undergraduate Certificates Associates BachelorsMasters Doctorate Professional
Sources: NCES, IPEDS Completions Survey; U.S. Census Bureau, American Community Survey (Public Use Microdata Samples)
14

Percentage of Degrees and Certificates Awarded in STEM Fields (2006-07)
South Dakota
North D
akotaM
arylandIndianaM
ontanaM
ichiganColoradoVirginiaD
elaware
IdahoAlaskaTexasN
orth CarolinaO
hioN
ebraskaN
ew M
exicoG
eorgiaPennsylvaniaW
yoming
South CarolinaN
ew Jersey
New
Ham
pshireO
regonW
est VirginiaVerm
ontM
aineIow
aU
nited StatesM
issouriM
assachusetts
Nevada
CaliforniaAlabam
aW
isconsinW
ashingtonM
innesotaH
awaii
LouisianaConnecticutIllinoisKentuckyM
ississippiO
klahoma
Utah
KansasN
ew York
Rhode IslandTennesseeArkansasArizonaFlorida
0%
4%
8%
12%
16%
20%
17.7
%16
.5%
16.3
%15
.9%
15.8
%15
.0%
14.3
%14
.3%
14.0
%13
.8%
13.8
%13
.6%
13.1
%12
.8%
12.8
%12
.8%
12.7
%12
.6%
12.5
%12
.3%
12.3
%12
.3%
12.2
%12
.1%
12.1
%12
.0%
11.8
%11
.7%
11.7
%11
.7%
11.7
%11
.5%
11.5
%11
.4%
11.3
%10
.8%
10.7
%10
.6%
10.5
%10
.3%
10.2
%10
.0%
9.9%
9.7%
9.6%
9.5%
9.3%
8.9%
8.5%
8.5%
8.2%
Sources: NCES, IPEDS Completions Survey15

Productivity: Degrees Awarded per FTE vs. Total Funding per FTE
AL
AK
AZ
AR
CA
CO
CT
DE
FL
GA
HIIDIL IN
IAKS
KY
LAME MD
MA
MI
MN
MS MO
MT
NE
NV
NH
NJ
NM
NY
NC
ND
OH
OK
OR
PA
RI
SC
SD
TNTX
UT
VTVA
WA
WV
WI
WYUS
14
17
20
23
26
29
32
5,000 8,000 11,000 14,000 17,000 20,000
Low Resources, High Production
Low Resources, Low Production
High Resources, High Production
High Resources, Low Production
Performance:Degrees
Awarded per 100 FTE
Resources: Total Funding per FTE16

Productivity: Total Funding per Degree*
* Adjusted for value of degrees in the state employment market (median earnings by degree type and level)
Florida
Washington
North D
akota
West Virginia
South Dakota
Georgia
Wisconsin
New
Ham
pshire
Mississippi
Arkansas
Oregon
Iowa
Missouri
Ohio
Nebraska
South Carolina
Michigan
New
Mexico
Maine
Alabama
Nevada
Vermont
Massachusett
s
Connecticut
Delaw
are
Alaska
-
20,000
40,000
60,000
80,000
100,000
120,000
140,000
160,000
180,000
200,000
29,
075
30,
619
33,
273
33,
756
34,
330
34,
594
36,
498
37,
823
38,
364
38,
365
39,
516
39,
516
39,
918
42,
177
42,
198
42,
408
42,
693
42,
847
42,
873
42,
948
43,
820
44,
272
44,
371
45,
833
45,
904
46,
522
46,
880
47,
453
47,
672
47,
749
48,
611
49,
894
52,
491
52,
572
52,
888
53,
535
54,
553
56,
090
56,
280
56,
888
56,
960
59,
420
59,
465
63,
822
64,
934
65,
975
66,
623 7
2,84
6 7
5,74
4 7
9,79
4 86,
009
Tuition and FeesState and Local
Sources: SHEEO State Higher Education Finance Survey 2008; NCES, IPEDS Completions Survey; U.S. Census Bureau, American Community Survey (Public Use Microdata Samples)
17

Annual Certificates and Degrees Awarded by Control/Sector (2006-07)
Source: NCES, IPEDS Copmpletions Survey
AlaskaM
ontanaArkansasM
ississippiAlabam
aN
ew M
exicoN
orth Dakota
KansasW
ashingtonSouth CarolinaKentuckyTexasLouisianaG
eorgiaW
isconsinO
klahoma
North Carolina
Michigan
Nevada
South Dakota
West Virginia
Maryland
New
JerseyO
regonW
yoming
VirginiaD
elaware
IdahoCaliforniaU
tahH
awaii
FloridaM
aineN
ebraskaIndianaO
hioN
ationColoradoM
innesotaIow
aTennesseeIllinoisConnecticutArizonaN
ew H
ampshire
Vermont
Missouri
PennsylvaniaN
ew York
Rhode IslandM
assachusetts
0%
20%
40%
60%
80%
100%
Public Private Non-Profit Private For-Profit
18
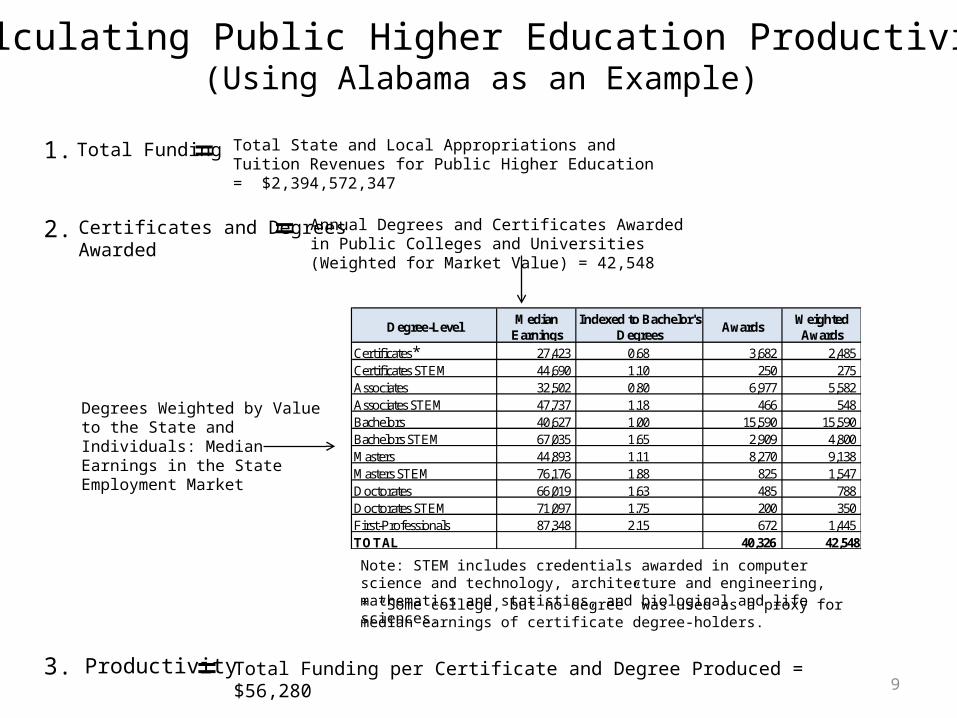
Productivity vs. Educational Attainment of the Adult Population
Percent of Adults (25 to 64) with
Associate Degrees or
Higher (2006)
Productivity: Total Funding per Degree (2006-07)
Sources: SHEEO State Higher Education Finance Survey 2008; NCES, IPEDS Completions Survey; U.S. Census Bureau, American Community Survey (Public Use Microdata Samples)
AL
AKAZ
AR
CA
COCT
DEFL
GA
HI
ID
IL
IN
IAKS
KY
LA
ME
MD
MA
MI
MN
MS
MO
MT
NE
NV
NH NJ
NM
NY
NC
ND
OH
OK
ORPA
RI
SC
SD
TN
TX
UT
VT
VAWA
WV
WI
WY
US
20
27
34
41
48
55
25,000 35,000 45,000 55,000 65,000 75,000 85,000 95,000
High Productivity, Low Attainment Low Productivity, Low Attainment
High Productivity, High Attainment Low Productivity, High Attainment
19

Productivity: Total Funding per Degree(Two-Year Institutions)
* Adjusted for value of degrees in the state employment market (median earnings by degree level)Source: Louisiana Board of Regents
Baton Rouge Community College
L.E. Fletcher Technical Community College
Louisiana Delta Community College
River Parishes Community College
South Louisiana Community College
Delgado Community College
L.S.U. at Eunice
Bossier Parish Community College
Southern University in Shreveport
Elaine P. Nunez Community College
LTC
Sowela Technical Community College
-
20,000
40,000
60,000
80,000
100,000
120,000
140,000
160,000
137,191
100,768
96,345
92,412
90,194
80,965
63,901
61,030
52,022
51,788
50,295
42,502
20

Productivity: Total Funding per Degree(Four-Year Institutions)
* Adjusted for value of degrees in the state employment market (median earnings by degree level)Source: Louisiana Board of Regents
Grambling State University
Southern University and A&M College
L.S.U. at Alexandria
University of New Orleans
University of Louisiana at Monroe
Southern University in New Orleans
Nicholls State University
University of Louisiana at Lafayette
Southeastern Louisiana University
Northwestern State University
L.S.U. in Shreveport
Louisiana Tech University
McNeese State University
0 20,000 40,000 60,000 80,000 100,000
83,125
70,952
69,064
60,436
58,712
58,477
54,274
53,388
53,003
48,684
47,236
46,854
45,486
21

The Impact of Shifting Enrollment and Resources
22

Louisiana = 56.5Sources: Louisiana Board of Regents. Louisiana Dept. of Education.
Note: High school graduates not available for 2008. High school graduates for Orleans Parish for 2007 only (2006 affected by hurricane).
Public 4YrPublic 2Yr, CCLTC
Vermilion
Jefferson DavisAcadia
Pointe Coupee
St. LandryWest Baton Rouge
East Feliciana
East Baton Rouge
Caldwell
EvangelineAllen
Tensas
St. Martin Iberville
Plaquemines
Jefferson
West Feliciana
Calcasieu
CameronIberia
Assumption
St. Mary
Terrebonne
Lafourche
St. Bernard
Orleans
St. Tammany
Tangipahoa
St. Helena
GrantLa Salle
Concordia
CatahoulaNatchitoches
Winn
Sabine
Red RiverDe Soto
Bienville
Richland
East Carroll
West CarrollMorehouse
Caddo
Bossier
Webster
Ascension
Avoyelles
Beauregard
Claiborne
Franklin
Jackson
Lafayette
Lincoln
Livingston
MadisonOuachita
Rapides
St. CharlesSt. James
St. John the Baptist
Union
Vernon
Washington
60.7 to 74.055.8 to 60.752.6 to 55.848.5 to 52.636.4 to 48.5
Louisiana Public Sector – First-Time Undergraduates Directly Out of HighSchool as a Percent of High School Graduates, 2006-08 Annual Average
23

Louisiana = 42.1Sources: Louisiana Board of Regents. Louisiana Dept. of Education.
Note: High school graduates not available for 2008. High school graduates for Orleans Parish for 2007 only (2006 affected by hurricane).
Vermilion
Jefferson DavisAcadia
Pointe Coupee
St. LandryWest Baton Rouge
East Feliciana
East Baton Rouge
Caldwell
EvangelineAllen
Tensas
St. Martin Iberville
Plaquemines
Jefferson
West Feliciana
Calcasieu
CameronIberia
Assumption
St. Mary
Terrebonne
Lafourche
St. Bernard
Orleans
St. Tammany
Tangipahoa
St. Helena
GrantLa Salle
Concordia
CatahoulaNatchitoches
Winn
Sabine
Red RiverDe Soto
Bienville
Richland
East Carroll
West CarrollMorehouse
Caddo
Bossier
Webster
Ascension
Avoyelles
Beauregard
Claiborne
Franklin
Jackson
Lafayette
Lincoln
Livingston
MadisonOuachita
Rapides
St. CharlesSt. James
St. John the Baptist
Union
Vernon
Washington
46.2 to 56.141.3 to 46.237.9 to 41.332.7 to 37.924.0 to 32.7
Louisiana Public 4-Year Sector – First-Time Undergraduates Directly Out ofHigh School as a Percent of High School Graduates,
2006-08 Annual Average
24

Louisiana = 12.1Sources: Louisiana Board of Regents. Louisiana Dept. of Education.
Note: High school graduates not available for 2008. High school graduates for Orleans Parish for 2007 only (2006 affected by hurricane).
Vermilion
Jefferson DavisAcadia
Pointe Coupee
St. LandryWest Baton Rouge
East Feliciana
East Baton Rouge
Caldwell
EvangelineAllen
Tensas
St. Martin Iberville
Plaquemines
Jefferson
West Feliciana
Calcasieu
CameronIberia
Assumption
St. Mary
Terrebonne
Lafourche
St. Bernard
Orleans
St. Tammany
Tangipahoa
St. Helena
GrantLa Salle
Concordia
CatahoulaNatchitoches
Winn
Sabine
Red RiverDe Soto
Bienville
Richland
East Carroll
West CarrollMorehouse
Caddo
Bossier
Webster
Ascension
Avoyelles
Beauregard
Claiborne
Franklin
Jackson
Lafayette
Lincoln
Livingston
MadisonOuachita
Rapides
St. CharlesSt. James
St. John the Baptist
Union
Vernon
Washington
17.4 to 31.910.8 to 17.47.0 to 10.84.6 to 7.01.7 to 4.6
Louisiana Public 2-Year/CC Sector – First-Time Undergraduates Directly Out of High School as a Percent of High School Graduates,
2006-08 Annual Average
25

Louisiana = 2.3Sources: Louisiana Board of Regents. Louisiana Dept. of Education.
Note: High school graduates not available for 2008. High school graduates for Orleans Parish for 2007 only (2006 affected by hurricane).
Louisiana Technical College Sector – First-Time Undergraduates Directly Out of High School as a Percent of High School Graduates,
2006-08 Annual Average
Vermilion
Jefferson DavisAcadia
Pointe Coupee
St. LandryWest Baton Rouge
East Feliciana
East Baton Rouge
Caldwell
EvangelineAllen
Tensas
St. Martin Iberville
Plaquemines
Jefferson
West Feliciana
Calcasieu
CameronIberia
Assumption
St. Mary
Terrebonne
Lafourche
St. Bernard
Orleans
St. Tammany
Tangipahoa
St. Helena
GrantLa Salle
Concordia
CatahoulaNatchitoches
Winn
Sabine
Red RiverDe Soto
Bienville
Richland
East Carroll
West CarrollMorehouse
Caddo
Bossier
Webster
Ascension
Avoyelles
Beauregard
Claiborne
Franklin
Jackson
Lafayette
Lincoln
Livingston
MadisonOuachita
Rapides
St. CharlesSt. James
St. John the Baptist
Union
Vernon
Washington
6.5 to 24.13.8 to 6.53.1 to 3.81.7 to 3.10.1 to 1.7
26

L.S.U. and A&M College
Northwestern State University
Southeastern Louisiana University
University of Louisiana at Lafayette
Delgado Community College
Nicholls State University
Louisiana Tech University
University of Louisiana at Monroe
University of New Orleans
Bossier Parish Community College
L.S.U. at Alexandria
Southern University and A&M College
Grambling State University
McNeese State University
Southern University in New Orleans
L.S.U. in Shreveport
South Louisiana Community College
L.S.U. at Eunice
L.E. Fletcher Technical Community College
Southern University in Shreveport
Baton Rouge Community College
L.T.C. - Young Memorial
0 20 40 60 80 100 120 140 160 180 200
175
105
95
93
61
60
56
54
54
45
39
35
32
28
24
22
16
15
14
12
11
10
Additional First-Time Freshmen Enrollments Directly Out of High School if Participation Rates of High School Graduates in Low Participation Parishes
are Raised to the Current State Level (55.9%)
Source: Louisiana Board of Regents. Louisiana Department of Education.27

L.S.U. and A&M CollegeSoutheastern Louisiana University
University of Louisiana at LafayetteNorthwestern State University
Louisiana Tech UniversityNicholls State University
Delgado Community CollegeUniversity of Louisiana at Monroe
McNeese State UniversityUniversity of New Orleans
Baton Rouge Community CollegeBossier Parish Community College
Southern University and A&M CollegeL.S.U. at Eunice
Grambling State UniversityL.S.U. at AlexandriaL.S.U. in Shreveport
South Louisiana Community CollegeSouthern University in New Orleans
L.E. Fletcher Technical Community CollegeSouthern University in Shreveport
Louisiana Delta Community CollegeSowela Technical Community College
River Parishes Community CollegeL.T.C. - Young Memorial
Elaine P. Nunez Community CollegeL.T.C. - Sullivan
L.T.C. - River Parishes
0 200 400 600 800 1,000 1,200 1,400
1,172761
726450
419381381
370305301
270264
246200191
138133
114857777
5352
333231
2320
Additional First-Time Freshmen Enrollments Directly Out of High School if Participation Rates of High School Graduates in all Parishes are Raised to
Best-Performing Parish (Madison = 74.0%)
Source: Louisiana Board of Regents. Louisiana Department of Education.28

University of Louisiana at LafayetteNorthwestern State University
Southeastern Louisiana UniversityL.S.U. and A&M College
L.S.U. at EuniceMcNeese State University
South Louisiana Community CollegeLouisiana Tech University
Baton Rouge Community CollegeUniversity of Louisiana at Monroe
Nicholls State UniversityL.T.C. - Young Memorial
L.S.U. at AlexandriaBossier Parish Community College
Delgado Community CollegeSouthern University and A&M College
Grambling State UniversityL.T.C. - Lamar Salter
L.E. Fletcher Technical Community CollegeRiver Parishes Community College
L.T.C. - LafayetteL.T.C. - SullivanL.T.C. - Oakdale
L.T.C. - Florida ParishesL.T.C. - Baton Rouge
L.T.C. - Teche AreaUniversity of New Orleans
0 50 100 150 200 250 300 350 400
367224
221188
137119
1049896
9283
7465
6156
5349
4644
3936
322323222121
Additional First-Time Freshmen Enrollments if Participation Rates of Popu-lation Age 18-44 with Just a High School Diploma and No College in Low Par-
ticipation Parishes are Brought to Current State Level (5.7%)
Source: Louisiana Board of Regents. U.S. Census Bureau, 2005-07 American Community Survey.Note: Population by education level is not available from the ACS for some Parishes due to low population counts. For theseParishes, population by education level is estimated using current population estimates and Census 2000 education levels.
29

L.S.U. and A&M CollegeUniversity of Louisiana at LafayetteSoutheastern Louisiana University
Delgado Community CollegeNorthwestern State University
McNeese State UniversityBaton Rouge Community College
Louisiana Tech UniversityNicholls State University
University of Louisiana at MonroeBossier Parish Community College
L.S.U. at EuniceUniversity of New Orleans
Southern University and A&M CollegeL.T.C. - Young Memorial
South Louisiana Community CollegeGrambling State University
L.E. Fletcher Technical Community CollegeL.S.U. at Alexandria
Sowela Technical Community CollegeL.S.U. in Shreveport
Southern University in ShreveportRiver Parishes Community College
L.T.C. - Baton RougeLouisiana Delta Community College
L.T.C. - LafayetteSouthern University in New Orleans
0 500 1,000 1,500 2,000 2,500 3,000
2,3972,130
1,8581,328
1,1911,0471,039
1,002911
870867
799628615
557546
465418
400304300288
255236
216213198
Additional First-Time Freshmen Enrollments if Participation Rates of Popu-lation Age 18-44 with Just a High School Diploma and No College in all
Parishes are Raised to Best Performing Parish (Winn = 10.0%)
Source: Louisiana Board of Regents. U.S. Census Bureau, 2005-07 American Community Survey.Note: Population by education level is not available from the ACS for some Parishes due to low population counts. For theseParishes, population by education level is estimated using current population estimates and Census 2000 education levels.
30

What Some States are Doing to Address Cost Efficiency an Productivity
• Funding Completions – OK, OH, IN, TN, and TX
• Re-Designing Coursework – Particularly Remedial Education (TN, MS)
• Major Structural Delivery Changes– AZ, LA
• Establish Effectiveness and Efficiency Commissions – OH, MD
• Reaching Out to Adults with College Credit – KY, TN, NM, CO, IN, and OK
• Stackable Certificates – OH, OR, KY 31

Ohio and Maryland
• Ohio’s Effectiveness and Efficiency Commission– Identified five major areas of focus for cost savings –
healthcare, IT-education, energy, procurement, and academic– Workgroup in place to work with institutions on best
practices and establishing metrics to track progress in the five areas
• Maryland’s Strategies– Recognition that higher education system is growing faster
than the state budget– Agreed to pay for three-quarters of the growth and
institutions pay for one-quarter through cost-saving– Mandated that each institution increase student credit hours
per FTE faculty by 10 percent32