Embed Size (px)
Citation preview

Patient-Led Assessments of the Care Environment (PLACE): England - 2013, Experimental Statistics
Published September 2013

Patient-Led Assessments of the Care Environment (PLACE), England – 2013, Experimental Statistics
2 Copyright © 2013, Health and Social Care Information Centre. All rights reserved.
We are the trusted source of authoritative data and information relating to health and care.
www.hscic.gov.uk
Author: Graham Jacob, Workforce and Facilities Health and Social Care Information Centre
Responsible statistician: Kate Anderson, Programme Manager
Version: V1.0
Date of publication
18th September 2013
Patient-Led Assessments of the Care Environment (PLACE), England – 2013, Experimental Statistics
Copyright © 2013, Health and Social Care Information Centre. All rights reserved. 3
Table of Contents
Experimental Statistics 3
Executive Summary 4
Principles 5
2013 programme 8
Results 11
Data Quality 26
EXPERIMENTAL STATISTICS
This is the first publication of Patient-Led Assessments of the Care Environment results. These figures are presented as experimental. Experimental statistical publications seek feedback from users on content, accuracy and methodology. The collection is subject to annual review and may therefore change in the future. The HSCIC welcomes feedback on the methodology and tables within this publication. Please contact Graham Jacob with your comments and suggestions, clearly stating ‘Patient-Led Assessments of the Care Environment’ as the subject heading, via: Email: [email protected] Telephone: 0845 300 6016 Post: 1 Trevelyan Square, Boar Lane, Leeds, LS1 6AE. Patient/Public interest The information contained in this publication and supporting tables will assist members of the public when making choices about where they may go to receive healthcare.

Patient-Led Assessments of the Care Environment (PLACE), England – 2013, Experimental Statistics
4 Copyright © 2013, Health and Social Care Information Centre. All rights reserved.
Executive Summary
The NHS Constitution establishes a number of principles and values of the NHS in England, which additionally extend to private and voluntary sector providers supplying NHS services.
Included amongst these are:-
- Putting patients first; - Actively encouraging feedback from the public, patients and staff to help improve
services; - Striving to get the basics of quality of care right; - A commitment to ensure that services are provided in a clean and safe environment
that is fit for purpose.
Patient-Led Assessments of the Care Environment (PLACE) are a self-assessment of a range of non-clinical services which contribute to the environment in which healthcare is delivered in the both the NHS and independent/private healthcare sector in England. Participation is voluntary. These assessments were introduced in April 2013 to replace the former Patient Environment Action Team (PEAT) assessments which had been undertaken from 2000 – 2012 inclusive.
The PLACE programme aims to promote the above principles and values by ensuring that the assessment focuses on the areas which patients say matter, and by encouraging and facilitating the involvement of patients, the public and other bodies with an interest in healthcare (e.g. Local Healthwatch) in assessing providers in equal partnership with NHS staff to both identify how they are currently performing against a range of criteria and to identify how services may be improved for the future.
Key findings In 2013: The number of assessments undertaken was 1,358; The national average score for Cleanliness was 95.74% The national average score for Condition, Appearance and Maintenance was 88.75% The national average score for Privacy, Dignity and Wellbeing was 88.87% The national average score for Food and Hydration was 84.98% There were a total of 5,869 Patient Assessor involvements in assessments. Please note this is not the number of individual members of the public involved since some will have undertaken more than one assessment or attended on more than one day of an assessment spread over two or more days.

Patient-Led Assessments of the Care Environment (PLACE), England – 2013, Experimental Statistics
Copyright © 2013, Health and Social Care Information Centre. All rights reserved. 5
The Patient-Led Assessments of the Care Environment (PLACE) programme - background
Principles
The aim of PLACE assessments is to provide a snapshot of how an organisation is performing against a range of non-clinical activities which impact on the patient experience of care – cleanliness; the condition, appearance and maintenance of healthcare premises; the extent to which the environment supports the delivery of care with privacy and dignity; and the quality and availability of food and drink.
The assessment of cleanliness covers all items commonly found in healthcare premises including patient equipment; baths, toilets and showers; furniture; floors and other fixtures and fittings.
The assessment of condition, appearance and maintenance includes the above items as well as a range of other aspects of the general environment including décor, tidiness, signage, lighting (including access to natural light), linen, access to car parking (excluding the costs of car parking), waste management and the external appearance of buildings and the tidiness and maintenance of the grounds.
The assessment of privacy, dignity and wellbeing includes infrastructural/organisational aspects such as provision of outdoor/recreation areas, changing and waiting facilities, access to television, radio, computers and telephones; and practical aspects such as appropriate separation of sleeping and bathroom/toilet facilities for single sex use, bedside curtains being sufficient in size to create a private space around beds and ensuring patients are appropriately dressed to protect their dignity.
The assessment of food and hydration includes a range of questions relating to the organisational aspects of the catering service (e.g. choice, 24-hour availability, meal times, access to menus) as well as an assessment of the food service at ward level and the taste and temperature of food.
The criteria included in PLACE assessments are not standards, but they do represent both those aspects of care which patients and the public have identified as important, and good practice as identified by professional organisations whose members are responsible for the delivery of these services, including but not limited to the Healthcare Estates Facilities Managers Association, the Association of Healthcare Cleaning Professionals and the Hospital Caterers Association.
The assessments undertaken in 2013 were the first under this programme. It is the intention that they will be undertaken annually.
The criteria for the inclusion of sites1 in the programme are:-
1 The PLACE programme applies to a variety of healthcare including Treatment Centres, Hospices, community-
based premises providing mental health and/or learning disabilities services, and hospitals providing mental health, learning disabilities community, general acute, children’s and specialist services. The term ‘site’ is used generically to cover all environments.

Patient-Led Assessments of the Care Environment (PLACE), England – 2013, Experimental Statistics
6 Copyright © 2013, Health and Social Care Information Centre. All rights reserved.
- All sites with 10 or more in-patient beds; - Sites with fewer than 10 beds where the services provided and the environment in
which they are provided clearly are, or are analogous to, a hospital. For example, a small Eye Hospital or Birthing Centre would meet the eligibility criteria since the care and environment provided would be seen as hospital care, whereas a small community-based residential home for e.g. individuals with learning disabilities or those recovering from addiction, where the individuals concerned have an assisted living care service and where the environment is analogous to their home would not meet the eligibility criteria.
However in the latter case any organisation is free to include such sites as they wish regardless of whether they meet the eligibility criteria, and some choose to do so.
The precise scope of the assessment varies according to the site’s size, subject to certain minima:-
- Sites should assess all of their wards up to 10, or 25% whichever is greater. Therefore a site with two wards would assess both; a site with 10 wards would assess all; a site with 30 wards would assess 10; and a site with 60 wards would assess 15 (25%);
- All emergency departments should be assessed; - A minimum of 25% of out-patient departments should be assessed; - A representative sample of 25% of ‘common’ areas (e.g. corridors) should be
assessed; - External areas should be assessed.
With regard to the food assessment, this should be undertaken on one to five wards depending on the number of wards on the site according to the following:-
- Up to six wards, one food assessment; - Seven to 12 wards, two food assessments; - 13 to 18 wards, three food assessments; - 19 to 24 wards, four food assessments; - 25 or more wards, five food assessments.
Although the basic assessment process is common to all, the precise areas undertaken in any particular site will vary according to size, services provision, and the precise services on offer. For example there are variations between those sites providing acute services and those providing mental health services, and not all sites will provide emergency and/or out-patient services. To this extent therefore the assessment is tailored to reflect the actual position in any given site.
The week in which assessments are to be undertaken is determined by the Health and Social Care Information Centre (HSCIC) and individual organisations are given 6 weeks’ notice. Thereafter it is for them to arrange the precise date(s) of the assessment. Whilst organisations are urged to undertake assessments in the week identified, external

Patient-Led Assessments of the Care Environment (PLACE), England – 2013, Experimental Statistics
Copyright © 2013, Health and Social Care Information Centre. All rights reserved. 7
circumstances may require an alternative date to be identified and this is done in consultation with HSCIC. In 2013 the assessment period was from April to June.
A fundamental part of assessments is the inclusion of lay assessors known generically as Patient Assessors. In this regard there are two specific conditions which organisations are requested to ensure:-
- That there never be fewer than two patient assessors in any assessment team (or sub-team where assessment teams are split into more than one due e.g. to the hospital’s size); and
- That the ratio between staff and patient assessors never be less than 50/50. This ratio can be increased in favour of patient assessors but should not be increased in favour of staff assessors.
Anyone can act as a patient assessor except:-
- Existing members of staff from the organisation (e.g. NHS Trust) being assessed; - Ex-staff from the organisation who have left within the last two years (this allowing
for a common sense approach so that someone who is within a few weeks of having been left two years may be deemed eligible).
It is a matter for each organisation to recruit their patient assessors, although they have been urged to always approach their local Healthwatch to offer them the opportunity to provide patient assessors. Whether local Healthwatch choose to do so is entirely a matter for them to determine.
All guidance and assessment forms issued in relation to the programme can be found on the NHS England website http://www.england.nhs.uk/ourwork/qual-clin-lead/place/

Patient-Led Assessments of the Care Environment (PLACE), England – 2013, Experimental Statistics
8 Copyright © 2013, Health and Social Care Information Centre. All rights reserved.
The Patient-Led Assessments of the Care Environment (PLACE) programme
2013 Programme
The 2013 Patient-Led Assessments of the Care Environment was the first undertaken following its replacement of the former Patient Environment Action Team process which ran from 2000 – 2012 inclusive.
During April – June 2013 a total of 1,358 assessments were undertaken in sites (e.g. Treatment Centres, Hospices) across 274 organisations. Of these 1,140 (233 organisations) were NHS and 218 (41 organisations) were from the voluntary/independent/private sectors. All eligible NHS organisations participated in the programme. The precise number of private/independent sector organisations who may be eligible to participate is not known.
The breakdown by hospital type was:-
SITE TYPE NUMBER OF ASSESSMENTS
Acute/Specialist 445
Mixed Acute And Mental Health/Learning Disabilities 38
Community 312
Learning Disabilities Only 45
Mental Health Only 428
Mental Health And Learning Disabilities 53
Treatment Centre 17
Hospice 20
TOTAL 1,358
Time taken to complete assessments
The 1,358 assessments undertaken comprised a total of 1,670 days, with 121 (8.9%) assessments taking two or more days to complete. In some instances e.g. small units an assessment may take less than a day to complete.
1,237 (91.1%) assessments were completed in one day;
79 (5.8%) assessments were completed over two days;
22 (1.6%) assessments were completed over three days;
12 (0.9%) assessments were completed over four days;
8 (0.6%) assessments were completed over five days.

Patient-Led Assessments of the Care Environment (PLACE), England – 2013, Experimental Statistics
Copyright © 2013, Health and Social Care Information Centre. All rights reserved. 9
Public/Patient Involvement
A total of 5,869 members of the public (whether as patients or former patients, individuals or representatives of other organisations (e.g. local Healthwatch)) were involved in assessments during the 2013 programme. This number relates to the number of involvements, not the number of individuals since some may have been involved in more than one assessment or on more than one day of a single assessment.
On 47 (3%) occasions the recommended minimum number of patient assessors (two) was not met and on 84 (5%) occasions the recommended ratio of staff to patient assessors (50/50) was not met. These figures are based on the total number of days on which assessments were undertaken (1,549) not the total number of assessments (1,358), so if an assessment was undertaken over three separate days and on one of these days the staff/patient assessor ratio was not met, this would count as one ‘occasion’. The reasons for this are not known but may be due to local difficulties in securing sufficient numbers or patient assessors not being available/not attending on the day of the assessment. Where either of these situations occurs organisations are asked wherever possible to postpone and reschedule the assessment, however this becomes increasingly difficult as the deadline for assessments approaches.
A survey was undertaken to gather views and experiences of those who participated in the 2013 programme which included the question ‘Would you be prepared to take part in further PLACE assessments’. Of 359 Patient Assessors who responded to this question, 323 (90%) said they definitely would, and 32 (8.9%) said they possibly would. Of the remainder four (1.1%) said they probably would not and none said they definitely would not.
Results
At the end of the process, each hospital/unit which has undertaken an assessment is provided with a result against each of the four areas of the assessment namely Cleanliness; Condition Appearance and Maintenance; Privacy Dignity and Wellbeing; and Food and Hydration. This result is calculated by reference to the score (points) achieved expressed as a percentage of the maximum score (points) which could have been achieved had every aspect of the assessment they undertook achieved the maximum score. The maximum score for any question is 2, therefore a hospital which answered 150 questions relating to cleanliness would have a maximum score of 300 points, and an actual score of 256 would lead to a result of 85.33%.
No attempt is made to further interpret these scores e.g. by equating them to a rating system. Participating organisations and others who may use these data will be able to benchmark their performance or the performance of particular types of organisations.
For the purposes of comparison, a national average of scores from all participating hospitals/units has been calculated. This average is weighted to take account of the fact that

Patient-Led Assessments of the Care Environment (PLACE), England – 2013, Experimental Statistics
10 Copyright © 2013, Health and Social Care Information Centre. All rights reserved.
hospitals vary in size and that in larger hospitals not all areas are assessed. The weighting factor used in this calculation is bed numbers. Bed numbers are used since they are common to all organisations, whereas some premises in which assessments are undertaken do not have wards e.g. certain mental health/learning disabilities units and Treatment Centres.
The calculation used to produce the National Average is:-
The sum of [Each site’s score (points) multiplied by the number of beds in that site]
_______________________________________________________________
The total number of beds in all assessed sites.

Patient-Led Assessments of the Care Environment (PLACE), England – 2013, Experimental Statistics
Copyright © 2013, Health and Social Care Information Centre. All rights reserved. 11
The Patient-Led Assessments of the Care Environment (PLACE) programme
National Results - 2013
The national average score for Cleanliness was 95.74%
The national average score for Condition, Appearance and Maintenance was 88.75%
The national average score for Privacy, Dignity and Wellbeing was 88.87%
The national average score for Food and Hydration was 84.98%
The highest and lowest scores across the four domains of the assessment were
HIGHEST SCORE
LOWEST SCORE
INTER-QUARTILE
RANGE2
Cleanliness 100% 24.46% 94.71% - 99.38%
Condition, Appearance and Maintenance
100% 36.25% 82.95% - 92.71%
Privacy, Dignity and Wellbeing
100% 52.26% 82.36% - 93.13%
Food and Hydration3 100% 26.67% 83.62% - 92.73%
2 The interquartile range is the difference between the first quartile (25th percentile) and the third quartile (75th percentile) of an ordered range of data. It contains the middle 50 per cent of the distribution and is unaffected by extreme values.
3 The lowest scores for Food and Hydration are those from Treatment Centres without in-patient beds where the assessment of food and hydration is substantially different from all others to reflect that a full catering service is not provided in such environments

Patient-Led Assessments of the Care Environment (PLACE), England – 2013, Experimental Statistics
12 Copyright © 2013, Health and Social Care Information Centre. All rights reserved.
Distribution of scores across all organisations
The distribution of scores for all sites assessed for the four domains of the assessment are shown in Figs. 1 – 4 and the distribution by organisations for the same four domains are at Figs. 5 - 8. For those organisations with only one site the result for both site and organisation will be identical. Where an organisation has more than one site, the calculation of an organisation-level score is weighted to take account of the relative sizes of the sites using bed numbers as a proxy for size in the same way as is used to calculate the national average.

Patient-Led Assessments of the Care Environment (PLACE), England – 2013, Experimental Statistics
Copyright © 2013, Health and Social Care Information Centre. All rights reserved. 13
Fig 1
The national average score for cleanliness across all sites is 95.74% with a lowest score of 24.46% and a highest score of 100%.
The interquartile range is 94.71% - 99.38% and the median score is 97.81%.

Patient-Led Assessments of the Care Environment (PLACE), England – 2013, Experimental Statistics
14 Copyright © 2013, Health and Social Care Information Centre. All rights reserved.
Distribution of Cleanliness scores at Site level by bandwidths (5% from lowest score)
BANDWIDTH NUMBER % (rounded to one decimal place)
0% - 24.99% 1 0.1%
25% - 29.99% 0 0%
30% - 34.99% 0 0%
35% - 39.99% 0 0%
40% - 44.99% 0 0%
45% - 49.99% 2 0.1%
50% - 54.99% 1 0.1%
55% - 59.99% 1 0.1%
60% - 64.99% 1 0.1%
65% - 69.99% 6 0.4%
70% - 74.99% 10 0.7%
75% - 79.99% 17 1.3%
80% - 84.99% 32 2.4%
85% - 89.99% 97 7.1%
90% - 94.99% 854 62.9%
95% - 99.99% 192 14.1%
100% 144 10.6%
Total 1,358 100.00%
Patient-Led Assessments of the Care Environment (PLACE), England – 2013, Experimental Statistics
Copyright © 2013, Health and Social Care Information Centre. All rights reserved. 15
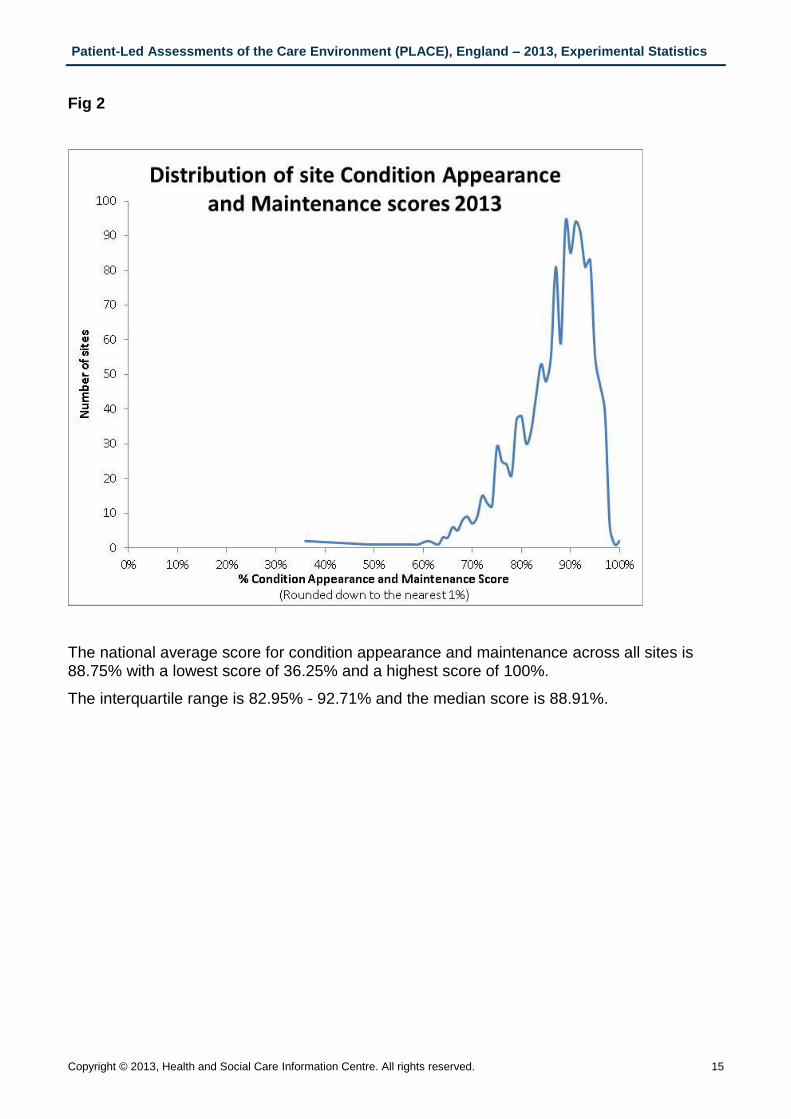
Fig 2
The national average score for condition appearance and maintenance across all sites is 88.75% with a lowest score of 36.25% and a highest score of 100%.
The interquartile range is 82.95% - 92.71% and the median score is 88.91%.

Patient-Led Assessments of the Care Environment (PLACE), England – 2013, Experimental Statistics
16 Copyright © 2013, Health and Social Care Information Centre. All rights reserved.
Distribution of Condition Appearance and Maintenance scores at Site level by bandwidths (5% from lowest score)
Bandwidth Number % (rounded to one decimal place)
0% - 34.99% 0 0%
35% - 39.99% 2 0.1%
40% - 44.99% 0 0%
45% - 49.99% 1 0.1%
50% - 54.99% 3 0.2%
55% - 59.99% 3 0.2%
60% - 64.99% 6 0.4%
65% - 69.99% 31 2.3%
70% - 74.99% 56 4.1%
75% - 79.99% 136 10.0%
80% - 84.99% 199 14.7%
85% - 89.99% 337 24.8%
90% - 94.99% 434 32.0%
95% - 99.99% 148 10.9%
100% 2 0.1%
Total 1,358 100.0%
Patient-Led Assessments of the Care Environment (PLACE), England – 2013, Experimental Statistics
Copyright © 2013, Health and Social Care Information Centre. All rights reserved. 17
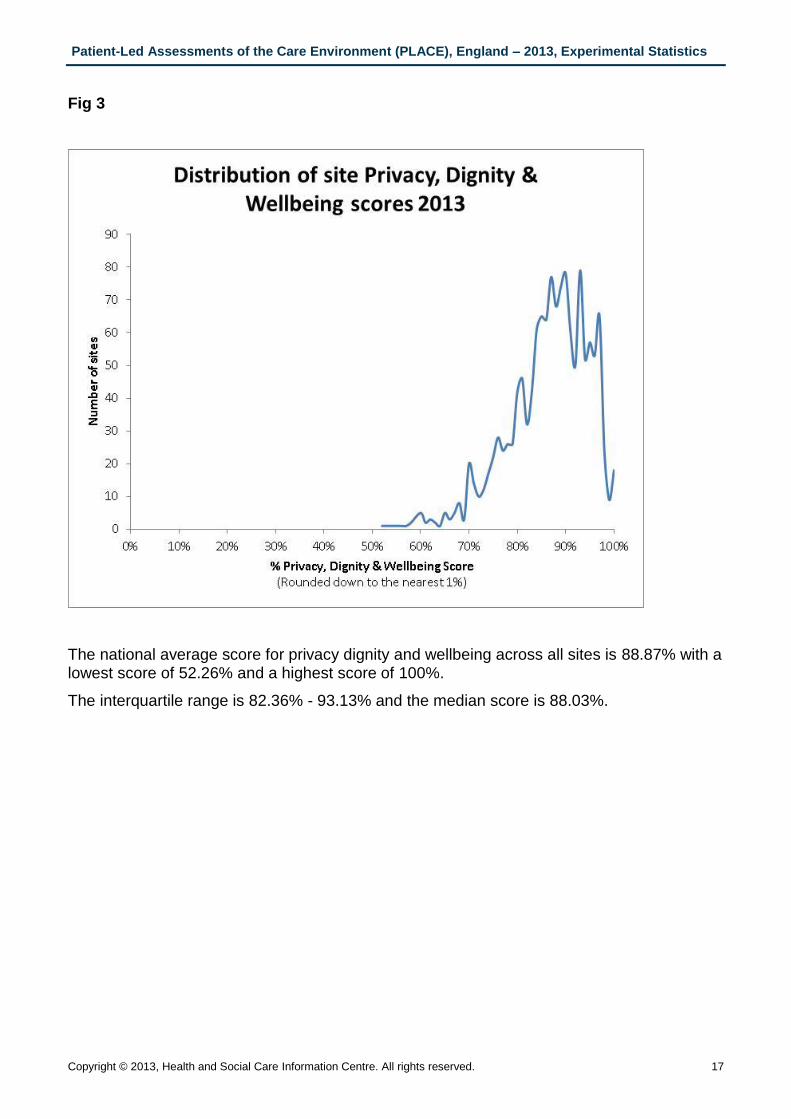
Fig 3
The national average score for privacy dignity and wellbeing across all sites is 88.87% with a lowest score of 52.26% and a highest score of 100%.
The interquartile range is 82.36% - 93.13% and the median score is 88.03%.

Patient-Led Assessments of the Care Environment (PLACE), England – 2013, Experimental Statistics
18 Copyright © 2013, Health and Social Care Information Centre. All rights reserved.
Distribution of Privacy Dignity and Wellbeing scores at Site level by bandwidths (5% from lowest score)
BANDWIDTH NUMBER % (rounded to one decimal p[lace)
0 – 49.99% 0 0%
50% - 54.99% 2 0.1%
55% - 59.99% 4 0.3%
60% - 64.99% 13 1.0%
65% - 69.99% 24 1.8%
70% - 74.99% 73 5.4%
75% - 79.99% 126 9.3%
80% - 84.99% 223 16.4%
85% - 89.99% 348 25.6%
90% - 94.99% 319 23.5%
95% - 99.99% 208 15.3%
100% 18 1.3%
Total 1,358 100.0%

Patient-Led Assessments of the Care Environment (PLACE), England – 2013, Experimental Statistics
Copyright © 2013, Health and Social Care Information Centre. All rights reserved. 19
Fig 4
The national average score for food and hydrations across all sites is 84.98% with a lowest score of 26.67% and a highest score of 100%.
The interquartile range is 83.62% - 92.73% and the median score is 88.60%.
Treatment Centres without in-patient beds complete a considerably different and smaller assessment of food and hydration services. Five Treatment Centres did not submit a food assessment.
A number of hospitals/sites are classed as self-catering and do not undertake a food assessment and so are excluded from the food and hydration scores. These are hospitals/sites where as part of an assisted daily living pattern of care (for example in learning disabilities and certain mental health settings) service users choose, buy prepare and cook their own food. In the 2013 PLACE programme there were 50 such hospitals/sites.
Patient-Led Assessments of the Care Environment (PLACE), England – 2013, Experimental Statistics
20 Copyright © 2013, Health and Social Care Information Centre. All rights reserved.
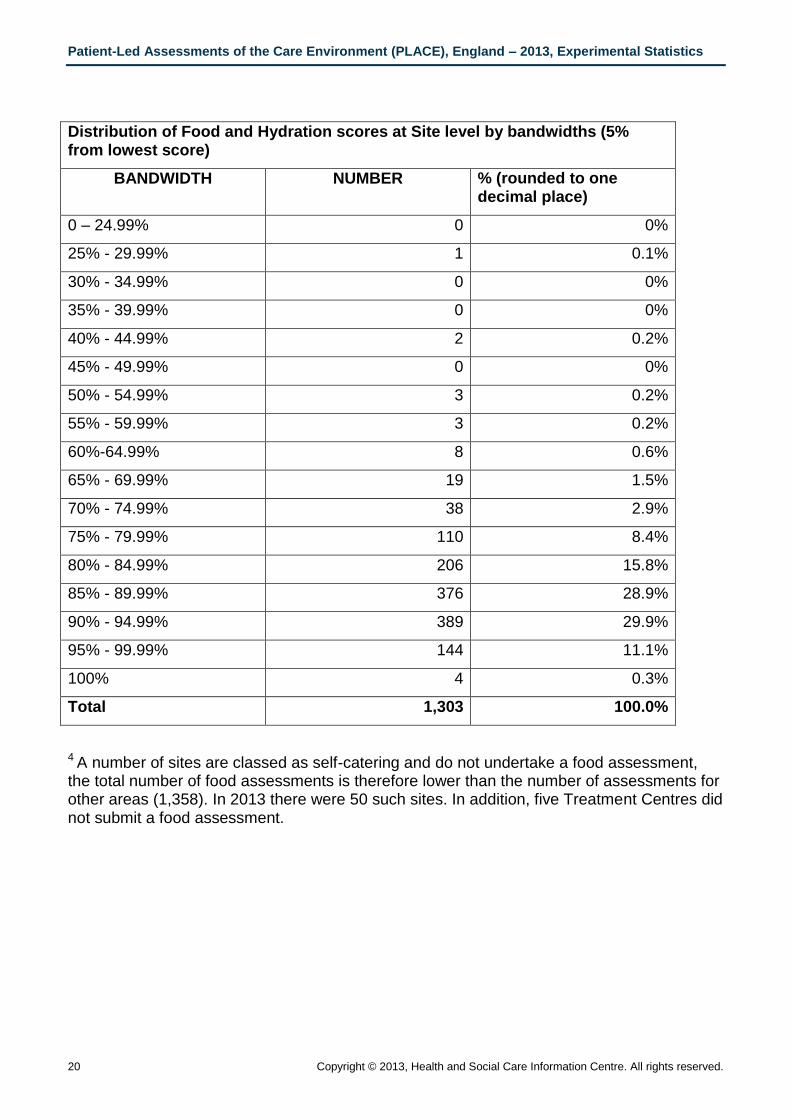
Distribution of Food and Hydration scores at Site level by bandwidths (5% from lowest score)
BANDWIDTH NUMBER % (rounded to one decimal place)
0 – 24.99% 0 0%
25% - 29.99% 1 0.1%
30% - 34.99% 0 0%
35% - 39.99% 0 0%
40% - 44.99% 2 0.2%
45% - 49.99% 0 0%
50% - 54.99% 3 0.2%
55% - 59.99% 3 0.2%
60%-64.99% 8 0.6%
65% - 69.99% 19 1.5%
70% - 74.99% 38 2.9%
75% - 79.99% 110 8.4%
80% - 84.99% 206 15.8%
85% - 89.99% 376 28.9%
90% - 94.99% 389 29.9%
95% - 99.99% 144 11.1%
100% 4 0.3%
Total 1,303 100.0%
4 A number of sites are classed as self-catering and do not undertake a food assessment, the total number of food assessments is therefore lower than the number of assessments for other areas (1,358). In 2013 there were 50 such sites. In addition, five Treatment Centres did not submit a food assessment.

Patient-Led Assessments of the Care Environment (PLACE), England – 2013, Experimental Statistics
Copyright © 2013, Health and Social Care Information Centre. All rights reserved. 21
Fig 5
Distribution of Cleanliness scores at Organisation level by bandwidths (5% from lowest score)
BANDWIDTH NUMBER % (rounded to one decimal place)
0 – 74.99% 0 0%
75% - 79.99% 1 0.4%
80% - 84.99% 5 1.8%
85% - 89.99% 20 7.3%
90% - 94.99% 58 21.2%
95% - 99.99% 183 66.8%
100% 7 2.6%
Total 274 100%

Patient-Led Assessments of the Care Environment (PLACE), England – 2013, Experimental Statistics
22 Copyright © 2013, Health and Social Care Information Centre. All rights reserved.
Fig 6
Distribution of Condition Appearance and Maintenance scores at Organisation level by bandwidths (5% from lowest score)
BANDWIDTH NUMBER % (rounded to one decimal place)
0 – 69.99% 0 0%
70% - 74.99% 7 2.6%
75% - 79.99% 19 6.9%
80% - 84.99% 32 11.7%
85% - 89.99% 84 30.7%
90% - 94.99% 103 37.6%
95% - 99.99% 29 10.6%
100% 0 0.0%
Total 274 100%

Patient-Led Assessments of the Care Environment (PLACE), England – 2013, Experimental Statistics
Copyright © 2013, Health and Social Care Information Centre. All rights reserved. 23
Fig 7
Distribution of Privacy Dignity and Wellbeing scores at Organisation level by bandwidths (5% from lowest score)
BANDWIDTH NUMBER % (rounded to one decimal place)
0 – 69.99% 0 0%
70% - 74.99% 2 0.7%
75% - 79.99% 20 7.3%
80% - 84.99% 35 12.8%
85% - 89.99% 91 33.2%
90% - 94.99% 86 31.4%
95% - 99.99% 37 13.5%
100% 3 1.1%
Total 274 100%

Patient-Led Assessments of the Care Environment (PLACE), England – 2013, Experimental Statistics
24 Copyright © 2013, Health and Social Care Information Centre. All rights reserved.
Fig 8
Distribution of Food and Hydration scores at Organisation level by bandwidths (5% from lowest score)
BANDWIDTH NUMBER % (rounded to one decimal place)
0 – 59.99% 0 0%
60% - 64.99% 3 1.1%
65% - 69.99% 2 0.7%
70% - 74.99% 17 6.25%
75% - 79.99% 29 10.6%
80% - 84.99% 50 18.2%
85% - 89.99% 94 34.3%
90% - 94.99% 61 22.2%
95% - 99.99% 15 5.5%
100% 3 1.1%
Total 274 100%

Patient-Led Assessments of the Care Environment (PLACE), England – 2013, Experimental Statistics
Copyright © 2013, Health and Social Care Information Centre. All rights reserved. 25
Complete data tables will be available at www.hefs.hscic.gov.uk at a future date.
The HSCIC welcomes feedback on the methodology and the tables which accompany this publication. Please contact us with your comments and suggestions, clearly stating ‘Patient-Led Assessments of the Care Environment’’ as the subject heading via:
Email: [email protected]
Telephone: 0845 300 6016
Post: 1 Trevelyan Square, Boar Lane, Leeds LS1 6AE

Patient-Led Assessments of the Care Environment (PLACE), England – 2013, Experimental Statistics
26 Copyright © 2013, Health and Social Care Information Centre. All rights reserved.
Data Quality
Accuracy:
All data is provided by participating organisations through an on-line reporting system. All possible responses to each question are provided through a ‘drop-down’ facility and out-of-range responses are not possible. The collection system additionally has internal validation systems which prevent contradictory responses.
Final submission of data cannot be completed until all required responses have been entered. Where any data is missing the collection system will highlight this to those entering data. Once committed no changes to submitted data can be made without prior consultation with the HSCIC.
As part of the reporting process organisations are asked whether the assessment has been approved at Board level (NB: this does not necessarily mean by the whole Board, but could be by an individual who sits on the Board). In 2013 907 sites (67%) answered ‘Yes’ to this.
Since this is the first collection of its kind this report and the tables which accompany it carry the Experimental Statistics label. This is in keeping with the UK Statistics Authority’s Code of Practice.
Validation
Owing to the nature of the collection retrospective validation is not possible. Accuracy of scoring is achieved through the provision of guidance and training to teams undertaking the assessments, but there is an inherent element of judgement in this which cannot be questioned, however where required scores should be agreed between the staff and patient assessors.
Although not a requirement of the process, Peer Review (also known as External Validation) is a recommended good practice and in 2013 199 (15%) hospitals included this in their assessment. In the light of the Francis Review which recommended greater involvement of peer review in the (former) PEAT process, further guidance will be issued on this for the 2014 programme, however this recommendation was not available at the commencement of the 2013 programme and so could not be fully taken into account.
Once the full results are available, each organisation is notified of the outcome for each of their hospitals/units and are provided with a two week period to query or challenge them, after which time the results are ratified and no further changes accepted to supplied data.

Patient-Led Assessments of the Care Environment (PLACE), England – 2013, Experimental Statistics
Copyright © 2013, Health and Social Care Information Centre. All rights reserved. 27
Relevance:
The scope and content of PLACE assessments was determined by the NHS Quality Board and a sub-group of the Board, and through consultations and discussions with patient/public representative bodies and professional organisations.
Relevance will be maintained through review following the collection of comments from those involved in the undertaking of assessments. Changes to either or both of the process and content of assessments will be subject to approval by NHS England.
Comparability and Coherence:
This is the first collection under the PLACE process. The question set, scoring methodology and manner in which results are displayed is so different from the PEAT system which it replaced to render any comparisons meaningless.
Additionally, since this is the first collection of its kind this report and the tables which accompany it carry the Experimental Statistics label. This is in keeping with the UK Statistics Authority’s Code of Practice.
Timeliness and punctuality:
PLACE data will be published within 3 months of the date of the final assessments. This publication is based on data supplied following assessments which took place between April 1st and June 28th 2013 and for which data was required to be submitted by July 26th. In future years the assessment period will be March to May.
Accessibility:
The Patient-Led Assessment of the Care Environment publication consists of tables showing the results at both site and organisational level together with the detailed results submitted by each site.
Performance cost and respondent burden:
The collection exploits on-line technology to reduce the burden on organisations in completing and returning this data. As part of the review of the 2013 programme further enhancements to further reduce this burden will be considered and, where possible, acted upon.
Confidentiality, Transparency and Security
The standard HSCIC data security and confidentiality policies have been applied in the production of these statistics.

Patient-Led Assessments of the Care Environment (PLACE), England – 2013, Experimental Statistics
28 Copyright © 2013, Health and Social Care Information Centre. All rights reserved.
Users and Uses
Since this is the first collection, it is not yet clear precisely what uses will be made of the data. However, early indications include the following:-
Department of Health
Information from the collection will be used to brief Ministers, answer Parliamentary Questions, provide responses to correspondence and to inform policy decisions around areas such as the patient environment and dementia strategy.
Care Quality Commission
As with the former PEAT collection, the CQC have indicated that they will use data from the PLACE collection in formulating Quality and Risk Profiles of healthcare providers.
NHS England
Information from the collection will be used for a range of purposes including:-
- informing quality improvement programmes, including on nutrition - informing compassion on practice implementation in relation to privacy and dignity - informing patient engagement work in terms of the level of patient involvement and
related processes
Others
We believe other key users of the statistics will be:
- Ministers and their advisers; - Clinical Commissioning Groups - Healthcare providers to produce action/improvement plans and for benchmarking
purposes; - Students, academics and researchers; - Individual citizens to support choosing their provider of healthcare.

Patient-Led Assessments of the Care Environment (PLACE), England – 2013, Experimental Statistics
Copyright © 2013, Health and Social Care Information Centre. All rights reserved. 29
Related information
http://www.england.nhs.uk/ourwork/qual-clin-lead/place/
Copies of the assessment forms and accompanying guidance used in undertaking PLACE assessments.
These are currently under review and revised versions will be issued to support the 2014 assessment programme.
www.hefs.ic.nhs.uk
The Hospital Estates and Facilities Statistics (HEFS) is the national data warehouse for England extracted from the ERIC (Estates Return Information Collection) return which is collected and published by the HSCIC on behalf of the Department of Health. It is the main central data collection for estates and facilities services from the NHS containing information dating back to 1999/2000
www.hscic.gov.uk/catalogue/PUB06906
www.ic.nhs.uk/pubs/peatresults2011
http://www.ic.nhs.uk/statistics-and-data-collections/facilities/patient-environment-action-team-peat/patient-environment-action-team-peat-archive-data-2001--2010
PEAT results for the period 2001 – 2012. Note only high level results were published for the period 2001 – 2009, and in 2010 only a limited range of additional data was published. Please note that PEAT results and those from the 2013 PLACE programme are not comparable
Patient-Led Assessments of the Care Environment (PLACE), England – 2013, Experimental Statistics
30 Copyright © 2013, Health and Social Care Information Centre. All rights reserved.
Published by the Health and Social Care Information Centre
Part of the Government Statistical Service
Responsible Statistician
Kate Anderson, Programme Manager
ISBN 978-1-84-636947-6
This publication may be requested in large print or other formats.
For further information:
www.hscic.gov.uk
0845 300 6016
Copyright © 2013 Health and Social Care Information Centre. All rights reserved.
This work remains the sole and exclusive property of the Health and Social Care Information Centre and may only be reproduced where there is explicit reference to the ownership of the Health and Social Care Information Centre.
This work may be re-used by NHS and government organisations without permission.