Embed Size (px)
Citation preview

DATA LINKAGE SERIES NUMBER 10
Australian Institute of Health and Welfare Canberra
Cat. no. CSI 10
Pathways in Aged Care: program use after assessment
February 2011

© Australian Institute of Health and Welfare 2011 This work is copyright. Apart from any use as permitted under the Copyright Act 1968, no part may be reproduced without prior written permission from the Australian Institute of Health and Welfare. Requests and enquiries concerning reproduction and rights should be directed to the Head of the Communications, Media and Marketing Unit, Australian Institute of Health and Welfare, GPO Box 570, Canberra ACT 2601. This publication is part of the Australian Institute of Health and Welfare’s Data linkage series. A complete list of the Institute’s publications is available from the Institute’s website <www.aihw.gov.au>. ISSN 1833-1238 ISBN 978-1-74249-115-8
Suggested citation
Australian Institute of Health and Welfare 2011. Pathways in Aged Care: program use after assessment. Data linkage series no. 10. CSI 10. Canberra: AIHW.
Australian Institute of Health and Welfare
Board Chair Hon. Peter Collins, AM, QC Director David Kalisch Any enquiries about or comments on this publication should be directed to: Data Linkage Unit Australian Institute of Health and Welfare GPO Box 570 Canberra ACT 2601 Phone: (02) 6244 1000 Email: <[email protected] > Published by the Australian Institute of Health and Welfare
The Australian Institute of Health and Welfare is Australia’s national health and welfare statistics and information agency. The Institute’s mission is
better information and statistics for better health and wellbeing.
Please note that there is the potential for minor revisions of data in this report. Please check the online version at <www.aihw.gov.au> for any amendments.

iii
Contents
Acknowledgments............................................................................................................................... v Abbreviations ...................................................................................................................................... vi Symbols used in tables ..................................................................................................................... vii Executive summary ............................................................................................................................ ix
Main findings ................................................................................................................................ ix Overview .............................................................................................................................................. xi
Background ................................................................................................................................... xi The PIAC cohort study ................................................................................................................ xi Re-assessment ............................................................................................................................. xiii Care pathways ............................................................................................................................ xiii Changes over time ...................................................................................................................... xiv
1 Introduction .................................................................................................................................... 1 1.1 Background .............................................................................................................................. 1 1.2 The PIAC study ....................................................................................................................... 3 1.3 Overview of data ..................................................................................................................... 3 1.4 This report .............................................................................................................................. 10
2 Re-assessment .............................................................................................................................. 11 2.1 Summary ................................................................................................................................ 11 2.2 Re-assessments within 12 months ...................................................................................... 12 2.3 Re-assessments and residential respite care ...................................................................... 17
3 Care pathways .............................................................................................................................. 20 3.1 Summary ................................................................................................................................ 20 3.2 Diversity of pathways .......................................................................................................... 20 3.3 Care transitions ..................................................................................................................... 23 3.4 Common care pathways ...................................................................................................... 28
4 Changes over time ....................................................................................................................... 31 4.1 Summary ................................................................................................................................ 31 4.2 Time to care ............................................................................................................................ 32 4.3 Changes in program use over time .................................................................................... 35 4.4 Concurrent program use ...................................................................................................... 37
Appendix A: PIAC cohort characteristics ...................................................................................... 45 A.1 Summary ................................................................................................................................ 45 A.2 Demographic characteristics ............................................................................................... 46 A.3 Living arrangements ............................................................................................................. 55 A.4 Assessment priority and location ....................................................................................... 60

iv
A.5 Health and care needs at time of assessment .................................................................... 61 A.6 Assessment outcomes ........................................................................................................... 68
Appendix B: Data issues ................................................................................................................... 76 B.1 ACAP ...................................................................................................................................... 76 B.2 HACC: derivation of periods of use ................................................................................... 76 B.3 VHC: derivation of periods of use ...................................................................................... 81
Appendix C: Data linkage strategy for the PIAC cohort study ................................................. 84 C.1 Introduction ........................................................................................................................... 84 C.2 Linkage strategy .................................................................................................................... 84 C.3 Results ..................................................................................................................................... 95 C.4 Validation ............................................................................................................................... 98 C.5 Conclusion ........................................................................................................................... 102
References .......................................................................................................................................... 103 List of tables ...................................................................................................................................... 105 List of boxes and figures ................................................................................................................. 108

v
Acknowledgments
The authors of this report were Rosemary Karmel and Phil Anderson of the Data Linkage Unit at the Australian Institute of Health and Welfare (AIHW).
Diane Gibson (University of Canberra) and Ann Peut (Ageing and Aged Care Unit, AIHW) designed the Pathways in Aged Care (PIAC) project. Stephen Duckett (University of Queensland) provided advice on research design, particularly in relation to maximizing policy relevance. Yvonne Wells (La Trobe University) provided advice on the interpretation and use of the Aged Care Assessment Program National Minimum Data Set. Rosemary Karmel was the principal developer of the linkage strategy and undertook the data linkage. Phil Anderson provided statistical advice on developing the linkage strategy. Evon Bowler prepared the Veterans’ Home Care data for inclusion in the care pathways.
The authors thank the Department of Health and Ageing, the Department of Veterans’ Affairs and Home and Community Care Officials (from various state and territory departments and the Department of Health and Ageing) for permission to use data in the PIAC project.
This report was funded through a National Health and Medical Research Council Strategic Award (Grant Round 2 2005 number 41002).

vi
Abbreviations
_ in a key description indicates that the component is not included in the match key
ACAP Aged Care Assessment Program
ACAT Aged Care Assessment Team
AIHW Australian Institute of Health and Welfare
CACP Community Aged Care Package
dmob day and month of birth
DoHA Department of Health and Ageing
EACH Extended Aged Care at Home
EACH(D) EACH and/or EACHD
EACHD Extended Aged Care at Home Dementia
FMR false match rate
g2 the 2nd and 3rd letters of the given name substituting ‘2’ for short names
HACC Home and Community Care
NDI National Death Index
NMDS National Minimum Data Set
NRCP National Respite for Carers Program
pc 4 digit postcode
pc2 first two digits of 4 digit postcode
PIAC Pathways in Aged Care
RAC residential aged care
RCCP residential care and community care packages (includes RAC, EACH, EACHD and CACP)
s sex
s3 the 2nd, 3rd and 5th letters of the family name substituting ‘2’ for short names
st state
ur usual residence
v1 version 1
v2 version 2
VHC Veterans’ Home Care
yob year of birth

vii
Symbols used in tables
— nil or rounded to zero
. . not applicable
N number
n.e.c. not elsewhere classified
n.e.s. not elsewhere specified
n.p. not published

viii

ix
Executive summary
Coordination of aged care services is important, both to provide services cost-effectively and to provide the appropriate care for people at the appropriate time. Using linked data from the Pathways in Aged Care (PIAC) cohort study, this report presents groundbreaking large-scale analysis of people’s use of aged care services. This analysis includes information on time to key events, changes in use of care programs over time and concurrent use of programs.
The PIAC cohort comprises 105,000 people who had a completed assessment by an Aged Care Assessment Team (ACAT) under the Aged Care Assessment Program (ACAP) in 2003–04. Their ACAP assessment data were linked to data for five key aged care programs: Home and Community Care (HACC), Veterans’ Home Care (VHC), Community Aged Care Packages (CACPs), Extended Aged Care at Home packages (EACH) including EACH (Dementia), and residential aged care (RAC). Program use was identified for 2003–06.
For analytical purposes, the PIAC cohort was divided into groups based on use of aged care programs before the first completed assessment in 2003–04: • Continuing path cohort: clients who had used ACAT-dependent services (27,640 people) • HACC and/or VHC before cohort: clients who had used only HACC or VHC services
(42,974) • No previous care cohort: clients who had not previously used aged care services (34,463).
Main findings • People do not need an ACAT assessment to access HACC or VHC. However, for many
people their first contact with the aged care system is through an ACAT: just over 40% of the cohort with no previous use of aged care programs accessed HACC or VHC following their ACAT assessment (Figure 3.2).
• Although approval for program use from an ACAT assessment is valid for 12 months, re-assessment within that period is common: 30% of the no previous care cohort had a re-assessment within 12 months, and two-fifths of these had no intervening program use (Table 2.3).
• Before 1 July 2009, approval to use residential respite care had to be renewed annually to maintain access. This requirement was an important cause of re-assessment (Table 2.6).
• Assessments do not necessarily result in program use: 25% of the no previous care cohort did not newly access any care programs within 2 years. Nearly one-quarter of these people had died (Table 3.3).
• The use of care programs by the cohort increased over time (Figure 4.3). In particular, among no previous care cohort members the proportion who were in permanent RAC more than doubled between 3 months and 24 months after their first assessment in 2003–04—from 17% of clients still living to 34% (Table 4.7).
• Some care programs can be accessed simultaneously. For the no previous care cohort, 6 months after assessment: – One in six CACP recipients (16%) were also using services from other programs.
x
– Almost 40% of people who were clients of VHC were also accessing services from the large HACC program.
– Just under 10% of those using HACC were also accessing other programs. – Two-fifths of the people in respite RAC were also using a community care program
when they were at home. • Nearly one-third of the PIAC cohort died within the 2-year study period (Table 4.8).

xi
Overview
Background Since the early 1980s the Australian Government has implemented a range of reforms that have increasingly placed emphasis on formal assessment processes. These reforms have also expanded the focus of care provision from residential aged care (RAC) to include a wide range of community care services. While there has been a proliferation of programs, between 2001–02 and 2005–06 four key programs accounted for around 85% of government expenditure on programs delivering community aged care (excluding assessment services): Home and Community Care (HACC), Veterans’ Home Care (VHC), Community Aged Care Packages (CACPs) and EACH packages (Extended Aged Care at Home), including EACHD (EACH Dementia).
Coordination of aged care services is important both to provide services cost-effectively and to provide the appropriate care for people at the appropriate time. Until recently there has been no capacity to describe statistically the way in which the aged care system functions as a whole. However, with the implementation of client-level National Minimum Data Set (NMDS) for HACC in 2001–02 and ACAP (NMDS version 2) in 2003–04, unit-record data were available nationally for most of the main national aged care programs. Even so, the data collections for the different programs were, and are, held on different databases so that analyses were still generally program-specific.
The PIAC cohort study In 2006 a consortium of researchers at the Australian Institute of Health and Welfare (AIHW), University of Queensland and La Trobe University was successful in obtaining a National Health and Medical Research Council (NHMRC) grant to undertake analysis of care pathways in the aged care sector. The Pathways in Aged Care (or PIAC) project is a cohort study designed to explore the care transitions and care pathways for older Australians.
The PIAC cohort study linked data for key national aged care services for a cohort of 105,000 people. The cohort comprises people who had a completed assessment by an Aged Care Assessment Team (ACAT) under the Aged Care Assessment Program (ACAP) in 2003–04 which was recorded on version 2 of the ACAP National Minimum Data Set. ACAP data for the cohort were linked to data sets which showed use of five main aged care programs between 2003–04 and 2006–07: HACC, VHC, CACP, the two related programs of EACH and EACHD, and residential aged care (RAC). Program use data for 2002–03 were also matched to allow identification of people with previous program use, and deaths among the cohort were also identified.
The PIAC cohort For analytical purposes, the PIAC cohort is divided into groups based on their program use before the first completed ACAT assessment in 2003–04: • Continuing path cohort: clients identified as having previously used ACAT-dependent
services (CACP, EACH, EACHD, RAC) (27,640 people)

xii
• HACC and/or VHC before cohort: clients identified as having previously used only HACC or VHC services. This group consists of three subsets: – HACC only before (37,546 people) – VHC only before (2,471 people) – HACC and VHC before (2,957)
• No previous care cohort: clients identified as not having previously used HACC, VHC or ACAT-dependent care programs (34,463).
The subset of the cohort that had not used ACAT-dependent programs before their first completed assessment of 2003–04 (i.e. the ‘HACC and/or VHC before’ and ‘No previous care’ groups) constitute the PIAC new-pathways cohort. To simplify the discussion, the first completed ACAT assessment recorded for a cohort member in 2003–04 on ACAP NMDS v2 is referred to as the reference assessment.
Analysis of the characteristics of the PIAC cohort groups suggests that people in the new-pathways cohort who had already accessed HACC or VHC before their reference assessment had higher care needs than those who had had no previous care, and so were further along their ‘care needs pathway’. As expected, those in the continuing pathway group had the highest care needs.
In summary: • The average age of the PIAC cohort was 81 years and 4 months; 15% of the cohort were
aged 90 or over at the reference assessment. • Just 36% of the PIAC cohort were men. This varied with PIAC group: 31% of the
continuing path cohort were men, compared with 34% of those with HACC or VHC only before the reference assessment, and 41% of those with no previous care.
• New-pathways cohort members who had used VHC had a different demographic profile from other cohort members as a consequence of the eligibility criteria for this program.
• Across the PIAC groups, between 20% and 23% of the cohort had their ACAT reference assessment in hospital.
• Almost 40% of the continuing path cohort were reported as already living in permanent residential care.
• Among cohort members living in the community at the reference assessment, nearly 80% had a carer available. Carers were most commonly a spouse (35% of carers) or daughter (also 35%).
• On average between three and four health conditions were reported as contributing to the care needs of cohort members. The level of co-morbidity was least among cohort members who had not previously used care programs.
• The most common health conditions affecting care needs were circulatory system diseases (60% of the cohort), mental disorders (40%, including 27% with dementia), musculoskeletal diseases (42%), and endocrine, nutritional and metabolic disorders (21%). The first three of these were also commonly identified by ACATs as the main health condition impacting on need for assistance.
• Among people recommended to live in the community, 48% did not receive an ACAT approval to use any of the ACAT-dependent programs at their reference assessment. However, nearly two-thirds of those without any approvals got recommendations for community care programs.

xiii
Re-assessment An ACAT approval for a particular program cannot be given without the consent of the client. During the period covered by the study (2003–2006), approvals for all programs remained valid for 12 months. Re-assessment within the 12 month period may have occurred for a number of reasons, including changes in client circumstances and maintaining access to programs.
Nearly one-third (31%) of the PIAC cohort had a re-assessment within 12 months of their first completed ACAT assessment in 2003–04. These people averaged 1.25 re-assessments. Examination of assessment patterns revealed the following: • New-pathways members who had accessed HACC or VHC services before the reference
assessment were more likely to have a re-assessment than other cohort members. • Among people who had a re-assessment within 12 months, the first event in their care
pathway after the reference assessment was commonly a further ACAT assessment (46% of the continuing path PIAC group and 49% of the new-pathways cohort). This suggests either a change in circumstances or a change in attitude since their earlier assessment, as clients must agree to a type of care before it can be approved by an ACAT.
• Among the no previous care cohort, the most common event after their assessment was use of HACC or VHC (43% compared with less than 15% for other PIAC groups). This indicates that many people were being directed towards these community care services by the ACATs, even though these programs could be accessed without an ACAT assessment.
• Analysis suggests that, during the study period, people were having re-assessments in order to retain access to residential respite care.
Changes in repeat approval requirements for residential respite care and high-level residential and packaged care from 1 July 2009 will reduce the number of re-assessments in the future.
Care pathways People access services to suit their particular circumstances, and so patterns of service use are diverse in terms of the programs accessed and the frequency and order in which they are used. Among the full PIAC cohort, the linked data commonly identified over five program access events for a client, with a small number having over 25 distinct periods of program use over the study period. The occurrence of large numbers of events combined with the variety of care programs available means that there are many thousands of different care pathways.
Examination of care pathways is simplified if a clear starting point can be identified. To achieve this, the analysis was restricted to the new-pathways cohort.
Different approaches can be used to examine pathways. For example, looking at the order in which people access care programs but without considering the timing or re-assessments, the 77, 400 people in the PIAC new-pathways cohort had 1,003 distinct care pathways over 2 years, including those ending in death.
While there were many different care pathways, a relatively small set was used by a large proportion of the cohort. Looking at the first three care changes after the reference ACAT assessment, for new-pathways cohort members:

xiv
• 14 path combinations were used by 82% of people. • The most common path was the ‘no change’ path: 16% of the cohort were still alive
2 years after the reference assessment and had not newly accessed any care programs in that time. However, almost half of these people were, or had already been, HACC or VHC clients.
• 8% of the cohort died before taking up any new program services; two-thirds of these people had been HACC or VHC clients prior to their ACAT assessment.
• 22% of the cohort only accessed permanent residential care after their reference assessment, with just over 40% of these dying within the 2-year study period.
• 14% only accessed HACC or VHC services within 2 years of their reference assessment.
Analysis again shows that people were being pointed towards non-ACAT-dependent community care services by ACATs: five of the top 14 care pathways began with accessing, or re-accessing, HACC or VHC services. These five paths were used by over one-quarter (29%) of the new-pathways cohort with no previous care.
Changes over time Linking program data which includes information on dates of program use allows us to look at time to key events, changes in use of care programs over time and at concurrent use of programs. Among the new-pathways cohort: • Nearly 13% had accessed a CACP within 1 year of their reference ACAT assessment, and
43% had been admitted to permanent residential aged care. • The first 3 months after the reference assessment saw the largest take-up rates for both
packaged and residential care. • Take-up rates were higher among those who had previously used HACC and VHC, as
were death rates. These results support the hypothesis that new-pathways cohort members with no previous care were not as advanced along their care needs pathways as other members.
As expected, the service use profile of the cohort groups changed over time: • In all PIAC groups, the proportions of living cohort members in permanent RAC
increased over time. The increase in use of permanent RAC was accompanied by relative decreases in the use of respite RAC, and, more noticeably, HACC.
• At the time of their first completed assessment in 2003–04, 41% of the continuing path group were in permanent RAC, 28% were on a care package and 15% were using HACC or VHC only. Within 2 years, 39% of these people had died, and of those still alive, 70% were in permanent residential care and 14% were package recipients. A further 7% were using HACC and/or VHC services.
• People who had not used aged care services before their reference assessment were less likely than others to take up these services within the study period. In the 2-year period after the ACAT assessment, just over a quarter of the no previous care group died. Just over one-third (34%) of those still alive after 2 years were in permanent residential care, 8% were in receipt of a community care package and 15% were HACC or VHC clients only.
• Concurrent use of HACC services was common among community care package recipients and VHC clients.

xv
• Because of its short term nature, at any one time few people were in residential respite care (always under 3%). However, for all cohort groups and at all time periods considered, more than half of those in respite RAC were accessing at least one community care program when they were at home.
• Two-fifths ( 39%) of the continuing path group died within 2 years of their reference ACAT assessment, as did 32% of the new-pathways cohort who had used HACC or VHC before and 27% of those who had not previously used care programs.

xvi

1
1 Introduction
1.1 Background By the early 1980s there was ‘a general recognition in the aged care field that Australia had an overly large and expensive long-term institutional-care sector, and a correspondingly under-developed home-based sector’ (AIHW 2001). To address this imbalance, there has been a range of reforms that have increasingly placed emphasis on formal assessment processes and expanded the focus of care provision from residential care to providing a continuum of care, with community care being developed to both supplement and complement residential care (AIHW 2001; AIHW 2007a). This evolution reflected the wishes of older people, with assessment teams ‘finding that not only did many frail older people not need nursing home or hostel [residential] care, they did not want it either’ (Bruen 2005).
In response to expressed preferences, the Australian Government developed—and continues to expand—a range of community care and information programs (see Figure 1.1 for key programs in care provision). By 2004 the Australian Government was funding 17 community care programs, with program initiatives still continuing (DoHA 2004, AIHW 2007a). While there has been a proliferation of programs, between 2001–02 and 2005–06 four key programs accounted for around 85% of government expenditure on programs delivering community aged care (excluding assessment services): Home and Community Care (HACC), Veterans’ Home Care (VHC), Community Aged Care Packages (CACPs) and EACH packages (Extended Aged Care at Home), including EACH (Dementia) (EACHD) (AIHW 2007a).
The aged care sector within Australia is very complex, with a wide range of services available to older people in need of assistance. Moreover, different programs have different access processes: an approval through the Aged Care Assessment Program (ACAP) is required before a person can access residential aged care (RAC) or the aged care package programs (CACP, EACH and EACHD), but program-specific assessment processes regulate access to other community care programs like HACC and VHC (Figure 1.1). Therefore, coordination of aged care services is important both to provide services cost-effectively and to provide the appropriate care for people at the appropriate time. However, until recently there has been no capacity to describe statistically the way in which the aged care system functions as a whole (Gray 2001). Computerised person-level administrative data have been maintained for residential aged care (RAC) and CACPs since the 1990s, and administrative data have been collected for each of VHC, EACH, EACHD and the Transition Care Program (TCP) as they became operational. In addition, the client-level HACC National Minimum Data Set (NMDS) was implemented in 2001. For ACAP, from 1994 there was a nationally-agreed minimum data set with jurisdictional data sets maintained by each state and territory. However, it wasn’t until the ACAP National Data Repository (NDR) was established late in 2003 to collect the client-level ACAP NMDS (version 2) that unit-record data became available nationally. Consequently, with the implementation of client-level NMDSs for HACC in 2001–02 and ACAP in 2003–04 data became available for most of the main national aged care programs. Even so, the data collections for the different programs were, and are, held on different databases so that analyses were still generally program-specific (ACAP NDR 2006; AIHW 2006a, 2006c; DoHA 2005).

2
(a) Excluding payments from government pensions and benefits.
Note: Figure includes selected government-funded programs only, for 2003–04.
ACATCACPEACH EACHDHACCNRCPVHC
Independent
with unpaid care(a)
without unpaid care(a)
ACAT assessment
Care services not recommended
Care services recommended
HACC/VHCEACH CACP
Person at home with/out unpaid care(a)
and:
Permanent residential
care
Primary care and allied health
services
Carer services including NRCP
Use of service
Change in care needs
HACC/VHC agency assessment
HACC/VHC care approved
Acute care in hospital
Sub-acute/ interim care
Change in care arrangements
With care needs:
Respite residential
care
Person at home
EACH-D
Aged Care Assessment TeamCommunity Aged Care PackageExtended Aged Care at HomeExtended Aged Care at Home – Dementia Home and Community CareNational Respite for Carers ProgramVeterans' Home Care
Source: Adapted from Runge et al. 2009:10.
Figure 1.1: Possible movements through the Australian health and aged care system (2003–04)

3
Given that there are national data sets which separately contain data on individuals’ use of various care programs, integrating the data from these sources would provide a valuable resource for examining people’s use of different programs and relationships between programs. Statistical data linkage is a powerful tool for achieving such integration to extend the utility of data sets beyond their individual boundaries (Brook et al. 2005). In addition, there is an emerging recognition that statistical data linkage between existing data sets greatly facilitates investigations into many issues for which it is very difficult and/or expensive to obtain purpose-specific data (AIHW: Community Services Ministers’ Advisory Council 2004). This is particularly true when examining movements between services for which considerable data are collected as part of program administration.
Although some analyses of trajectories of care and cross-program use have been undertaken in the past (see AIHW 2001; AIHW: Karmel 2005b, 2006; AIHW: Karmel & Braun 2004), before the establishment of the ACAP NMDS version 2 (v2) in 2003 it was not possible to obtain longitudinal data to examine care pathways for clients of aged care programs from assessment without instituting expensive purpose-specific longitudinal surveys. The advent of the ACAP NMDS v2 means that, using statistical data linkage to link the assessment, community care and residential care data sets, it is now feasible to derive a database that is suitable for analysis of care transitions and pathways, from the point of assessment by ACATs through the community care and residential care sectors.
1.2 The PIAC study In 2006 a consortium of researchers at the Australian Institute of Health and Welfare (AIHW), University of Queensland and La Trobe University was successful in obtaining a National Health and Medical Research Council (NHMRC) grant to undertake analysis of care pathways in the aged care sector. The Pathways in Aged Care (or PIAC) project is a cohort study designed to explore the care transitions and care pathways for older Australians.
The PIAC project used statistical data linkage to create a national database linking data from the ACAP aged care assessment process to data on actual service use patterns of RAC, community care packages, HACC and VHC. This linked data allows investigation into movement between programs within the aged care system.
1.3 Overview of data
Scope and data sources The PIAC study is based on a cohort approach. The cohort of interest is the 105,000 people who had a completed assessment by an Aged Care Assessment Team (ACAT) in 2003–04 that is recorded on ACAP NMDS v2. Using record linkage, the care pathways of these people are identified in terms of their use of aged care services between 2003–04 and 2005–06. This allows analysis of pathways for at least 2 years after an assessment in 2003–04. Service use in 2002–03 is also included to identify people with previous program use.
The data used in this project cover six aged care programs (including assessment), as well as deaths. The latter is important for distinguishing between cohort members who didn’t get

4
any assistance and those who died before getting assistance. The programs included in PIAC are ACAP, RAC, CACP, EACH, EACHD, HACC and VHC (described in Box 1.1)
Box 1.1: Aged care programs in the PIAC project
● Aged Care Assessment Program (ACAP), under which multi-disciplinary Aged Care Assessment Teams (ACATs) determine people’s care needs and make recommendations concerning the preferred long-term living arrangement. Relevant approvals are required from an ACAT in order to access RAC, CACP and EACH(D) programs. During the study period approvals were valid for 12 months.
● Residential aged care (RAC), which provides both permanent and short-term respite care in residential aged care facilities. An ACAT approval is required to access funded places.
● Community Aged Care Packages (CACPs) program, which provides support services for older people with complex needs living at home who would otherwise be eligible for admission to ‘low-level’ residential care. CACPs provide a range of home-based services, (but excluding home nursing assistance and allied health services), with care being coordinated by the package provider. An ACAT approval is required for access.
● Extended Aged Care at Home (EACH) program (operational from 2002), which provides care at home that is equivalent to high-level residential care. An EACH place is commonly called a package, and an ACAT approval is required.
● The associated program Extended Aged Care at Home (Dementia) (EACHD) program (operational from 2006) provides a community care option specifically targeted to high care clients with dementia and behavioural and psychological symptoms (ACAT approval also required).
● Home and Community Care (HACC), which provides a large range of services (including allied health and home nursing services) to support people at home and to prevent premature or inappropriate admission to residential care. An ACAT approval is not required to access HACC services.
● Veterans’ Home Care (VHC), which provides a limited range of services to help veterans, war widows and widowers with low-level care needs to remain living in their own homes longer. As for HACC, an ACAT approval is not required. Eligible veterans who need higher amounts of personal care than provided under VHC may be referred to the Community Nursing program (Gold or White Repatriation Health Card holders only).
Source: AIHW 2007a.
The data come from two main sources: program-specific NMDSs and administrative program data (Table 1.1). Note that age restrictions (e.g. 65+) were not applied to the data sets for this study to allow identification of early use of aged care programs.
While the program data sets are designed to have universal coverage, take-up of the ACAP NMDS v2 was not completed until October 2005 (see Appendix B). For 2003–04, all assessments in Queensland and 40% of those in New South Wales were not reported to the ACAP NDR using version 2 of the NMDS. Queensland was also not included the following year. Consequently, the cohort under study is not truly national. Nevertheless, 70% of assessments in 2003–04 were reported on ACAP NMDS v2 and, since the study is based on a cohort identified by their inclusion on the 2003–04 ACAP NMDS v2, this incompleteness of the data set should not affect the utility of the linked data as, beyond reducing the size of the

5
cohort under study, there is no apparent reason why it should effect the analyses undertaken in this report. In particular, while there are some differences in the way assessment teams operate across the states and territories, the ACATs in Queensland and New South Wales do not appear to have major operational differences compared with those in other parts of the country that would suggest particular biases in the data for the PIAC cohort (ACAP NDR 2005).
Table 1.1: Programs and data included in the PIAC study
Program/event Years included in study Data Size of program (clients aged 65+) Data source
ACAP 2003–04 and 2004–05 • demographics • dependency level • health conditions • carer availability • assessment dates
and team
121,533 in 2004–05(a) ACAP NMDS v2(a)
RAC 2002–03 to 2005–06 • demographics • care needs • dates of episodes of
care
145,175 permanent residents as at 30 June 2006 33,801 in respite care in 2005–06
SPARC database within ACCMIS(b)
EACH and EACHD 2002–03 to 2005–06 • demographics • dates of episodes of
care
1,984 as at 30 June 2006
SPARC database within ACCMIS
CACP 2002–03 to 2005–06 • demographics • dates of episodes of
care
29,972 as at 30 June 2006
MERLIN database within ACCMIS
HACC 2002–03 to 2005–06 • demographics • quarterly use of
service types
561,789 in 2004–05 HACC NMDS v1 and v2 (from January 2006)
VHC 2002–03 to 2005–06 • demographics • use of service types • dates of service
provision
70,997 in 2005–06 VHC management information system(c)
Deaths 1 July 2003– 31 December 2006
• demographics • date of death • cause of death
103,486 in 2005 NDI
(a) For 2003–04 and 2004–05 Queensland and some parts of New South Wales did not report in ACAP NMDS v2. For these years it is estimated that ACAP NMDS v2 covered 70.1% and 85.2% of ACAT assessments, respectively. (ACAP NDR 2005, 2006).
(b) ACCMIS = Aged and Community Care Management Information System, held by the DoHA. The PIAC study uses the ACCMIS 2006 refresh—a snapshot of the database from October 2006.
(c) Maintained by the Australian Department of Veterans’ Affairs
Source: Program use from AIHW 2007a; deaths from AIHW 2007b.

6
A second constraint comes through the coverage of the HACC NMDS. While all HACC providers are required to submit data for the NMDS, in practice not all do, and between 2002–03 and 2005–06, 82–83% of HACC agencies provided data to the NMDS (DoHA 2005, 2006b, 2007). In addition, the service use information on the HACC NMDS is reported only by quarter. These data issues result in some under-identification of the use of HACC services by the cohort and in imprecision in the timing of reported service use relative to use of other programs (see Appendix B).
Data linkage As the information recorded for an individual may change from data set to data set—due to either differences in reporting (e.g. in first name) or errors—a robust linkage process should allow for some discrepancy in reported characteristics. Probabilistic matching allows for such variation by deriving a measure of similarity across match variables, called the match weight. This is then used to decide whether a particular pair-wise comparison between records on two data sets is accepted (high weight) or rejected (low weight) as a match, or link. Clerical review of possible record matches is generally used to decide both the total weight above which comparison pairs are acceptable as a match and to determine whether matches with weights near this cut-off should be considered to be valid matches. Such review commonly involves manual inspection of full name and/or address data for the potential matched pair (Jaro 1995; Herzog et al. 2007).
Full-name data is available on only a subset of the data sets included in the PIAC study, but all either explicitly contain or have sufficient information to derive the SLK-581 statistical linkage key (SLK) where the SLK-581 for a person is the concatenation of five letters of name, date of birth (represented as eight digits) and sex (AIHW: Karmel 2005b). Previous analysis has shown that SLK-581 distinguishes well between individuals in aged care data sets (AIHW: Karmel 2005a, 2005b, 2006; AIHW: Karmel & Braun 2004). Consequently, the linkage strategy is based on matching records primarily via SLK-581. In addition, for many data set pairs there are other common data items, and these are also employed in the linkage.
While, theoretically, probabilistic matching could be applied to the components of SLK-581 and other variables available for matching, it was not used in this study because of difficulties in setting weight cut-offs to determine acceptable and unacceptable matches in the absence of information suitable for clerical review (in particular, full name and/or address). Instead, successive matches were made using different linkage keys, each key being defined in terms of components of SLK-581 and any available additional linkage data. Incorporating non-SLK-581 information into the linkage strategy allowed further variation to be considered when matching, and so facilitated linking records for people who had slightly different personal information recorded in the different data sets. Also, in the small number of cases where different people have the same SLK-581, additional match variables aids correct matching.
Initial keys to be considered for matching were identified by considering all possible keys based on components of the SLK-581, region, and additional common data (for particular data set pairs). Three measures of likely link quality were developed to decide whether a particular key combination should be used for matching and to determine the order in which keys should be used (see Appendix C; also Karmel et al. 2010). Results from the linkage process are presented in Table 1.2. Before data linkage was undertaken, ethics approval and permission to use the required data were obtained from all relevant bodies. In addition, to

7
protect the privacy of individuals the linkage was carried out within the AIHW using the Institute’s data linkage protocol (AIHW 2006b).
Analysis of the linked data shows that the stepwise linkage process resulted in high quality links, with few false positives (Table C.8). For example, although 43% of the PIAC cohort linked to a death record, under 1% of care paths for PIAC cohort members included a link which implied services had been accessed after death (Table C.8).
Table 1.2: Summary of links to the PIAC cohort
Data set Clients Links Per cent of
cohort Per cent of
data set
ACAT-dependent aged care RAC/EACH(D) 373,183 68,742 65.4 18.4
CACP 80,028 20,879 19.9 26.1
All 415,057 76,289 72.6 18.4
Other aged care
HACC 02–03 615,642 48,604 46.3 7.9
HACC 03–04 675,446 61,447 58.5 9.1
HACC 04–05 710,781 41,483 39.5 5.8
HACC 05–06 705,261 27,500 26.2 3.9
All HACC 75,357 71.7 . .
VHC 164,192 12,827 12.2 7.8
Other
ACAP 2004–05 141,911 32,443 30.9 22.9
NDI 470,121 44,930 42.8 9.6
Any link . . 100,398 95.5 . .
Total cohort (ACAP 2003–04) 105,077 . . . . . .
Note: Cohort members may use more than one program, or the same program in more than 1 year, and so percentages of cohort do not sum to 100.
PIAC groups To facilitate analysis, the PIAC cohort has been divided into five groups, depending on whether they had used care services prior to their first completed ACAT assessment in 2003–04, and, if they had, the type of services they had used. These groups are described in Box 1.2 and illustrated in Figure 1.2. In addition, to simplify discussion the first completed ACAT assessment recorded for a cohort member in 2003–04 on ACAP NMDS v2 is referred to as the reference assessment (Box 1.2). A detailed description of the PIAC groups at the time of their reference assessment, and the related assessment outcomes, is given in Appendix A. A summary is provided below.

8
Box 1.2: Definition of PIAC groups
The PIAC cohort is divided into five groups for analytical purposes: 1. Continuing path: clients identified through data linkage as having used ACAT-
dependent services (CACP, EACH(D), RAC) before their first completed assessment of 2003–04
2. HACC only before: clients identified through data linkage as having only used HACC services before their first completed assessment of 2003–04
3. VHC only before: clients identified through data linkage as having only used VHC services before their first completed assessment of 2003–04
4. HACC and VHC before: clients identified through data linkage as having only used HACC and VHC services before their first completed assessment of 2003–04
5. No previous care: clients identified through data linkage as having used neither HACC or VHC services nor ACAT-dependent care programs before their first completed assessment of 2003–04.
Together, groups 2 to 5 constitute the PIAC new-pathways cohort; that is, this subset of the PIAC cohort had not used ACAT-dependent programs before their first completed assessment of 2003–04 (Figure 1.2). Groups 2 to 4 are often combined for analyses, and in tables are referred to as HACC/VHC before. To simplify discussion, the first completed ACAT assessment recorded for 2003–04 on ACAP NMDS v2 is referred to as the reference assessment. Clients in group 1 above would necessarily have had an earlier ACAT assessment to access ACAT-dependent services. In addition, it is estimated that 15%–20% of the 2003–04 new-pathways cohort had an earlier assessment in 2002–03 (based on 2003–04 and 2004–05 ACAT assessment patterns).
Summary of characteristics Analysis of the PIAC cohort groups suggests that people in the new-pathways cohort who had already accessed HACC or VHC before their reference assessment had higher care needs than those who had had no previous care, and so were further along their ‘care needs pathway’. As expected, those in the continuing pathway group had the highest care needs.
The PIAC cohort has the following characteristics: • The average age of the PIAC cohort was 81.4 years; 15% of the cohort were aged 90 or
over at the time of the reference assessment. Continuing path group members were, on average, older (83.3 years) than others. Those with no previous care had an average age of 79.5 years.
• Just 36% of the PIAC cohort were men, but this varied with the PIAC group: 31% of the continuing path cohort were men, compared with 34% of those with HACC or VHC only before the reference assessment, and 41% of those with no previous care.
• New-pathways cohort members who had used VHC had a different demographic profile from other cohort members as a consequence of the eligibility criteria for this program. They were more likely to be male (over 50% versus 36% for the full PIAC cohort), to be aged 80–89 years (70% versus 49%) and to be born in Australia (94% versus 68%), and less likely to be Aboriginal or a Torres Strait Islander (0.1% versus 1.0%).

9
• Almost 40% of the continuing path cohort were reported as already living in permanent residential care. In all PIAC groups, small proportions of ACAP clients were living in other institutions and supported accommodation.
Continuing path cohort: People who had used an ACAT-
dependent program prior to their first completed assessment in
2003–04 (27,640)
With HACC/VHC before: People with use of
HACC or VHC before their first completed
ACAT assessment in 2003–04 (42,974)
No previous care: People without use of HACC or VHC before their first completed
ACAT assessment in 2003–04 (34,463)
With HACC only before (37,546)
With VHC only before (2,471)
With HACC and VHC before
(2,957)
PIAC cohort: People with a completed
ACAT assessment in 2003–04 on ACAP
NMDS V2 (105,077)
PIAC new-pathways cohort: People without prior use of an
ACAT-dependent program prior to their first completed
assessment in 2003–04 (77,437)
Figure 1.2: PIAC groups
• Among cohort members living in the community at the reference assessment, over two-fifths lived alone. However, nearly 80% of those who reported carer status had a carer available. Carers were most commonly a spouse (35% of carers) or daughter (also 35%).
• Over two-fifths (43%) of cohort members needed assistance with three or more activities of daily living (out of a possible five). Such care needs were lowest among those with no previous care (average of 1.9 needs) and highest among those in the continuing path group (average of 3.0).
• Across the PIAC groups, between 20% and 23% of the cohort had their ACAT reference assessment in hospital.
• On average between three and four health conditions were reported as contributing to the care needs of cohort members. The level of co-morbidity was least among cohort members who had not previously used aged care programs (average of 3.4 health conditions) and highest among those in the continuing path group (average of 4.0).

10
• The most common health conditions affecting care needs were circulatory system diseases (60% of the cohort), mental disorders (40%, including 27% with dementia), musculoskeletal diseases (42%), and endocrine, nutritional and metabolic disorders (21%). The first three of these were also commonly identified by ACATs as the main health condition impacting on need for assistance (for 22%, 24% and 13% of the cohort, respectively).
• Among people recommended to live in the community, just over one-half got an ACAT approval to use an ACAT-dependent program at their reference assessment. Nearly two-thirds of the remainder got recommendations for community care programs.
• Nearly 60% of the PIAC cohort received approval for at least one care program that required an ACAT assessment. Those with no previous use of care programs were the least likely to get one or more approvals (52%), and people continuing on their care pathway were most likely (64%), including 26% with an approval for high-level permanent residential care.
• Among new-pathways cohort members, 20% of those with no previous care were recommended to live in permanent residential care, compared with 25% of those who had used HACC or VHC before.
1.4 This report The purpose of this report is to provide a broad description of care pathways of the PIAC groups. Aspects of the care pathways analysed include: • re-assessments by ACATs (Chapter 2) • patterns of service use (Chapter 3) • time to starting on a community package or entry into permanent residential care
(Chapter 4) • use of services over time and survival times (Chapter 4).
Appendix A describes in detail the PIAC cohort in terms of their circumstances at the time of their reference assessment and their assessment outcomes. Issues concerning the ACAP, HACC and VHC data used in the analyses are discussed in Appendix B, and details of the linkage process are given in Appendix C.

11
2 Re-assessment
An approval for a particular program cannot be given without the consent of the client. During the period covered by the study (2003–2006), approvals for all programs remained valid for 12 months. Re-assessment within the 12 month period may have occurred for a number of reasons. People who wanted to make sure that they had continuous access to residential respite care would have needed to have a further assessment within the original 12 month approval period. Also, while use of long-term care programs, such as community packages and permanent RAC do not require annual re-assessment to maintain access once taken up, until 30 June 2004 all permanent aged care residents required an ACAT assessment to change from low to high care, and not just those who were changing care facilities as was the case from 1 July 2004 (AIHW 2005). Changes in client attitude and circumstances may also result in a new ACAT assessment within a 12 month period.
In this chapter, re-assessment patterns are examined. For the analysis in this and following chapters, the distinction between HACC and VHC services is dropped. Consequently, the new-pathways group is split into just two groups: those who had used HACC or VHC before their reference assessment and those with no previous care. This was done to simplify the discussion as VHC services are a subset of those provided through HACC, with only a small number of people using only VHC services before their reference assessment (3% of the new-pathways cohort).
2.1 Summary Nearly one-third (31%) of the PIAC cohort had a re-assessment within 12 months of their first completed ACAT assessment in 2003–04. These people averaged 1.25 re-assessments. Re-assessment within the 12 month period may have occurred for a number of reasons. Examination of assessment patterns revealed the following: • New-pathways members who had accessed HACC or VHC services before the reference
assessment were more likely to have a re-assessment than other cohort members. • Among people who had a re-assessment within 12 months, the re-assessment was
commonly the first event in their care pathway after the reference assessment (46% of the continuing path PIAC group and 49% of the new-pathways cohort). This suggests either a change in circumstances or a change in attitude since their earlier assessment, as clients must agree to a type of care before it can be approved by an ACAT.
• For new-pathways people who had not previously used HACC or VHC services the most common event after their assessment was use of these services (43% compared with less than 15% for other PIAC groups). This indicates that many people were being directed towards these community care services by the ACATs, even though these programs could be accessed without an ACAT assessment.
• Analysis suggests that, during the study period, people were having re-assessments in order to retain access to residential respite care.
Changes in repeat approval requirements for residential respite care and high-level residential and packaged care from 1 July 2009 will be expected to reduce the number of re-assessments in the future.

12
2.2 Re-assessments within 12 months Nearly one-third (31%) of the PIAC cohort had a re-assessment within 12 months of the end of their first completed ACAT assessment in 2003–04 (Table 2.1).1,2 New-pathways members who had accessed HACC or VHC services before this assessment were more likely to have a re-assessment than other cohort members (35% compared with less than 30%). Overall, 32,900 cohort members together had 41,000 re-assessments within 1 year of their reference assessment—an average of 1.25 re-assessments (Table 2.2).
Continuing path cohort New-pathways cohort
0
10
20
30
40
50
60
70
80
90
Per cent of all re-assessments
PIAC group
In permanent care
In respite care
In community and other
Source: Table 2.2
Figure 2.1: Completed re-assessments by location and PIAC group (as per cent of all re-assessments within PIAC group)
An ACAT assessment may end before completion for a number of reasons, including client withdrawal, changes in health status, and death: across all PIAC groups around 15% of the re-assessments ended before completion of the assessment process. In addition, for our cohort 10% of additional assessments were for people already living permanently in residential care at the time of re-assessment. This percentage was higher for those who had accessed ACAT-dependent programs before their reference assessment (17%) than for those who had not (8%). Overall, 70% of re-assessments for people continuing their care pathway and 77% of those for the new-pathways cohort were completed assessments for people living 1 Published data from the ACAP NMDS suggest a re-assessment rate of 18% within the financial year
(assuming at most one re-assessment per person) (ACAP NDR 2006:60,191). The higher proportion here results from looking at a full 12 month window, rather than being restricted to re-assessments within a financial year.
2 It is estimated that between 15% and 20% of the 2003–04 new-pathways cohort had an earlier assessment in 2002–03 (based on 2003–04 and 2004–05 ACAT assessment patterns in the linked data).

13
in the community; for a small percentage of these the ACAP client was in residential respite care at the time (3.6% out of 75.6% for the entire PIAC cohort) (Table 2.2, Figure 2.1).
Among people who had a re-assessment within 12 months, the first event in their care pathway after the reference assessment was commonly a further ACAT assessment (45% of the continuing path PIAC group and 49% of the new-pathways cohort) (Table 2.3). This suggests either a change in circumstances or a change in attitude since their earlier assessment, as clients must agree to a type of care before it can be approved by an ACAT.
For new-pathways people who had not previously used HACC or VHC services the most common event after their assessment was use of these services (43% compared with less than 15% for other PIAC groups) (Table 2.3). This suggests that many people were being directed towards these community care services by the ACATs, even though these programs could be accessed without an ACAT assessment. Further evidence of this is seen in the common care pathways discussed later. This pattern may result from a combination of factors related to knowledge of the service system and eligibility criteria for care packages. For example, potential clients—or those who refer people to aged care services—may not be sure about the various services available or how to access them, and so approach an ACAT. In addition, ACATs must ensure that certain requirements are met before approving use of care packages. In particular: • the ACAT should only approve use of a package if the client meets the eligibility criteria.
To be eligible for a package a person must be eligible to receive residential care at least at the low level of care and have complex care needs that can only be met by a co-ordinated care package of care services (DoHA 2006a).
• the ACAT should take into account the availability of services (AIHW 2002). Limited availability of packages in some areas may therefore have resulted in recommending other community care services to clients (ACAP NDR 2005).
One-third of the continuing path group who had re-assessments accessed residential respite care first after their reference assessment. Only 14% for the new-pathways group had this use pattern, indicating that the high figure most likely reflects the 12 month limit on the currency of an ACAT approval.
From Table 2.3 we see that 13,400 cohort members (13% of the PIAC cohort) had followed their reference assessment with another completed assessment. Furthermore, 14% of these people (1,814, or 2% of the PIAC cohort) then had another completed assessment without accessing any care programs in between (Table 2.4). From the above analysis, in conjunction with that on approvals in Appendix A, we see that it is reasonably common for assessments not to result in any changes in care program use.

14
Table 2.1: PIAC cohort: number of ACAT re-assessments within 12 months per person by PIAC group (per cent)
ACAT re-assessments within 12 months of reference assessment
Continuing path
HACC and/or VHC
before
No previous
care
All new-pathways
cohort Total
Number per person Number
0 72.3 64.7 70.5 67.3 68.6 71,976
1 23.0 28.1 23.9 26.2 25.4 26,631
2 3.8 5.6 4.4 5.1 4.7 4,953
3 0.7 1.1 0.9 1.0 1.0 1,001
4 0.2 0.3 0.2 0.2 0.2 244
5+ 0.1 0.1 0.1 0.1 0.1 88
Total 100.0 100.0 100.0 100.0 100.0 . .
Total clients (number) 27,545 42,920 34,428 77,348 . . 104,893
Notes
1. Table excludes 184 cases with a pathway that indicated death before receipt of care (excluding HACC) (see Table C.8).
2. The reference date for additional assessments is the date of the end of the first completed assessment in 2003–04.
3. Components may not add to total due to rounding.

15
Table 2.2: ACAT re-assessments within 12 months by completion status and place of assessment, by PIAC group
Assessment completion status and location
Continuing path
HACC and/or VHC
before
No previous
care
All new-pathways
cohort Total
Completed Per cent Number
In residential aged care 20.5 11.6 10.5 11.2 13.3 5,447
In permanent care 15.7 8.2 7.3 7.9 9.6 3,954
In respite care 4.8 3.4 3.2 3.3 3.6 1,493
Not in residential aged care 64.7 73.2 75.5 74.1 72.0 29,528
Total 85.3 84.9 86.0 85.3 85.3 34,975
Incomplete
In residential aged care 3.8 2.5 1.7 2.2 2.5 1,044
In permanent care 3.0 1.8 1.4 1.7 2.0 808
In respite care 0.8 0.6 0.3 0.5 0.6 236
Not in residential aged care 10.9 12.7 12.3 12.5 12.2 4,982
Total 14.7 15.1 14.0 14.7 14.7 6,026
Total 100.0 100.0 100.0 100.0 100.0 . .
Total (number) 9,280 19,098 12,623 31,721 . . 41,001
Total (row %) 22.6 46.6 30.8 77.4 100.0 . .
Clients (number) 7,630 15,135 10,152 25,287 . . 32,917
Clients (% of cohort group) 27.7 35.3 29.5 32.7 31.4 . .
Average number per person 1.22 1.26 1.24 1.25 . . 1.25
Notes
1. Table excludes 184 cases with a pathway that indicated death before receipt of care (excluding HACC) (see Table C.8).
2. The reference date for re-assessments is the date of the end of the first completed ACAT assessment in 2003–04.
3. An ACAT assessment may end before completion due to a number of reasons, personal or medical.
4. Location of assessment is based on use of RAC at start of the assessment, as derived from linked events.
5. Components may not add to total due to rounding.

16
Table 2.3: PIAC cohort with re-assessments within 12 months: first post-assessment care pathway event by PIAC group
First post-assessment event
Continuing path
HACC and/or VHC
before
No previous
care
All new-pathways
cohort Total
Per cent Number
Incomplete ACAT assessment 7.0 8.1 5.7 7.1 7.1 2,335
Completed ACAT assessment 37.7 47.1 33.5 41.6 40.7 13,395
HACC 12.1 12.2 40.8 23.7 21.0 6,912
VHC 0.7 1.8 1.9 1.8 1.6 515
CACP 1.9 8.4 4.1 6.7 5.6 1,834
EACH(D) 0.4 0.2 0.1 0.2 0.2 67
Respite RAC 32.7 16.3 9.1 13.4 17.9 5,890
Permanent RAC 7.5 5.9 4.9 5.5 6.0 1,969
Total 100.0 100.0 100.0 100.0 100.0 . .
Total (number) 7,630 15,135 10,152 25,287 . . 32,917
Notes
1. Table excludes 184 cases with a pathway that indicated death before receipt of care (excluding HACC) (see Table C.8). 2. The reference assessment is the first completed ACAT assessment in 2003–04. 3. An ACAT assessment may end before completion due to a number of reasons—personal or medical. 4. Components may not add to total due to rounding.
Table 2.4: PIAC cohort with re-assessments within 12 months and a completed assessment as the first post-assessment care pathway event: second post-assessment care pathway event by PIAC group
Second post-assessment event
Continuing path
HACC and/or VHC
before
No previous
care
All new-pathways
cohort Total
Per cent Number
No second event 14.6 12.9 17.5 14.4 14.4 1,935
Incomplete ACAT assessment 3.0 2.5 1.9 2.3 2.4 327
Completed ACAT assessment 11.1 15.6 11.4 14.2 13.5 1,814
HACC 8.1 9.6 18.8 12.6 11.6 1,556
VHC 0.4 1.1 1.8 1.3 1.1 150
CACP 1.6 8.2 5.6 7.3 6.1 818
EACH(D) 1.3 0.7 0.4 0.6 0.8 104
Respite RAC 17.9 17.2 13.1 15.9 16.3 2,183
Permanent RAC 33.2 25.3 24.1 24.9 26.7 3,578
Death 8.8 7.0 5.3 6.4 6.9 930
Total 100.0 100.0 100.0 100.0 100.0 . .
Total (number) 2,873 7,126 3,396 10,522 . . 13,395
Notes
1. Table excludes 184 cases with a pathway that indicated death before receipt of care (excluding HACC) (see Table C.8). 2. The reference assessment is the first completed ACAT assessment in 2003–04. 3. An ACAT assessment may end before completion due to a number of reasons—personal or medical. 4. Components may not add to total due to rounding.

17
2.3 Re-assessments and residential respite care The above analysis suggests that some cohort members were having re-assessments in order to retain access to residential respite care. Examination of care pathways shows that, within 12 months of the completion of their first assessment in 2003–04, 9% of the cohort only accessed respite RAC out of the ACAT-dependent programs. This was highest among those who were continuing their pathway (12%) and lowest among those who had not accessed community care programs prior to the reference assessment (7%) (Table 2.5). Extending the window up to 2 years, 7% of the new-pathways cohort and 10% of the continuing path group accessed respite RAC but neither permanent RAC nor community packages after the reference assessment. Larger proportions used both respite and permanent RAC (15% overall, including nearly 2% of the cohort who also used care packages).
That maintaining access to respite RAC was one of the causes of re-assessment can be further examined by looking at the number of assessments people had by use of respite RAC. Within all PIAC groups, people who only accessed respite RAC out of the ACAT-dependent programs within 2 years of their reference assessment on average had higher numbers of assessments in the first 12 months than those who had not, averaging 1.5 completed assessments compared with 1.3 for the whole cohort (Table 2.6). Furthermore, people accessing respite RAC as well as another program (or programs) tended to have more assessments than those using only the non-respite care: for example, cohort members who used both care packages and respite RAC average 1.7 completed assessments over 2 years compared with 1.3 for those who only accessed CACP or EACH packages.
Those who never accessed ACAT-dependent programs tended to have relatively few assessments (mean of 1.2 completed assessments). This group includes those who died before accessing any programs, which accounts to some extent for the lower number: 8% of the cohort died within 3 months of the reference assessment (see Table 4.8).
Assessment patterns were similar within the various PIAC groups, although those of the ‘continuing care’ group who had accessed at least one program other than respite RAC after their reference assessment, had a relatively low average number of assessments (1.3 completed assessments compared with over 1.4 for other groups). Entry into permanent RAC explains this difference. Over one-third (36%) of the ‘continuing care’ group moved into permanent RAC after their reference assessment without using any other ACAT-dependent programs and these people averaged 1.2 completed assessments. Among the new-pathways cohort only 27% similarly went into permanent RAC, and averaged slightly more completed assessments (1.4).
In order to improve the efficiency of the ACAT assessment process and increase access to assessments by older people, changes were implemented from 1 July 2009. From this time approvals for residential respite care, high-level residential care, EACH and EACHD no longer lapse unless specified as time limited by the ACAT.

18
Table 2.5: PIAC cohort: use of respite RAC after reference assessment, by PIAC group
ACAT-dependent programs accessed after reference assessment
Continuing path
HACC and/or VHC
before
No previous
care
All new-pathways
cohort Total
Respite RAC only within 12 months Per cent Number
No 87.8 90.8 93.5 92.0 90.9 95,348
Yes 12.2 9.2 6.5 8.0 9.1 9,545
Total 100.0 100.0 100.0 100.0 100.0 104,893
Respite RAC only within 2 years
No 90.5 92.0 93.9 92.8 92.2 96,751
Yes 9.5 8.0 6.1 7.2 7.8 8,142
Total 100.0 100.0 100.0 100.0 100.0 . .
Total 27,545 42,920 34,428 77,348 . . 104,893
All ACAT-dependent programs accessed after reference assessment within 2 years
Respite RAC only 9.5 8.0 6.1 7.2 7.8 8,142
Other 56.2 57.2 47.5 52.9 53.8 56,393
Care packages only 1.7 8.6 6.6 7.7 6.1 6,445
Respite RAC and care packages 1.3 2.2 1.4 1.8 1.7 1,779
Permanent RAC only 36.4 27.8 25.7 26.9 29.4 30,807
Respite and permanent RAC 15.2 13.7 10.6 12.3 13.1 13,700
Care packages and permanent RAC 0.5 2.5 1.8 2.2 1.7 1,833
Care packages and respite and permanent RAC 1.0 2.4 1.5 2.0 1.7 1,829
No ACAT-dependent programs 34.3 34.8 46.4 40.0 38.5 40,358
Total 100.0 100.0 100.0 100.0 100.0 . .
Total (number) 27,545 42,920 34,428 77,348 . . 104,893
Notes
1. Table excludes 184 cases with a pathway that indicated death before receipt of care (excluding HACC) (see Table C.8).
2. The reference assessment is the first completed ACAT assessment in 2003–04.
3. Components may not add to total due to rounding.

19
Table 2.6: PIAC cohort: mean number of assessments within 12 months of the referenced assessment, by PIAC group
ACAT-dependent programs accessed after reference assessment within 2 years
Continuing path
HACC and/or VHC
before
No previous
care
All new-pathways
cohort Total
All assessments within 12 months (mean)
Respite RAC only 1.59 1.53 1.51 1.53 1.55
Other 1.40 1.54 1.50 1.52 1.49
Care packages only 1.42 1.40 1.39 1.40 1.40
Respite RAC and care packages 1.69 1.74 1.73 1.73 1.73
Permanent RAC only 1.27 1.44 1.39 1.42 1.37
Respite and permanent RAC 1.63 1.67 1.68 1.67 1.66
Care packages and permanent RAC 1.71 1.85 1.87 1.86 1.85
Care packages and respite and permanent RAC 1.89 1.92 1.97 1.94 1.93
No ACAT-dependent programs 1.17 1.27 1.21 1.24 1.22
Total 1.34 1.44 1.37 1.41 1.39
Completed assessments within 12 months (mean)
Respite RAC only 1.53 1.47 1.45 1.46 1.49
Other 1.34 1.46 1.44 1.45 1.42
Care packages only 1.35 1.35 1.33 1.34 1.34
Respite RAC and care packages 1.65 1.65 1.64 1.65 1.65
Permanent RAC only 1.22 1.37 1.34 1.36 1.31
Respite and permanent RAC 1.55 1.59 1.61 1.59 1.58
Care packages and permanent RAC 1.60 1.70 1.75 1.72 1.71
Care packages and respite and permanent RAC 1.79 1.80 1.87 1.82 1.82
No ACAT-dependent programs 1.14 1.22 1.17 1.19 1.18
Total 1.29 1.38 1.32 1.35 1.33
Notes
1. Table excludes 184 cases with a pathway that indicated death before receipt of care (excluding HACC) (see Table C.8).
2. The reference assessment is the first completed ACAT assessment in 2003–04. The reference assessment is included in the mean.
3. The use of HACC and VHC services are not considered in this table.
20
3 Care pathways
People access services to suit their particular circumstances, and so patterns of service use are diverse in terms of the programs accessed and the frequency and order in which they are used. Among the full PIAC cohort, the linked data commonly identified over five program access events for a client, with a small number having over 25 distinct periods of program use over the study period (predominantly regular residential respite care). The occurrence of large numbers of events combined with the variety of care programs available means that there are many thousands of different care pathways.
3.1 Summary Examination of care pathways is simplified if a clear starting point can be identified. To achieve this, the discussion in this chapter is restricted to the new-pathways cohort.
Different approaches can be used to examine pathways. For example, looking at the order in which people access care programs but without considering the timing or assessments, the 77, 400 people in the PIAC new-pathways cohort had 1,003 distinct care pathways over 2 years, including those ending in death.
While there were many different care pathways, a relatively small set was used by a large proportion of the cohort. Looking at the first three care changes after the reference ACAT assessment: • 14 path combinations were used by 82% of new-pathways cohort members. • The most common path was the ‘no change’ path: 16% of the cohort were still alive
2 years after the reference assessment and had not newly accessed any care programs in that time. However, almost half of these people had already been HACC or VHC clients.
• 8% of the cohort died before taking up any new program services; two-thirds of these people had been HACC or VHC clients prior to their reference assessment.
• 22% of the cohort only accessed permanent residential care after their reference assessment, with just over 40% of these dying within the 2-year study period.
• 14% accessed only HACC or VHC services within 2 years of their reference assessment.
Analysis again shows that people were being pointed towards non-ACAT-dependent community care services by ACATs: five of the top 14 care pathways began with accessing, or re-accessing, HACC or VHC services. These five paths were used by over one-quarter (29%) of the new-pathways cohort with no previous care.
3.2 Diversity of pathways The great variety in people’s use of care programs is illustrated in Table 3.1, with all possible combinations occurring. In particular, around one-quarter of the PIAC cohort did not newly access any care programs within 2 years of the first 2003–04 assessment (26% of the cohort) while just under 1% accessed all of the care programs included in the study.
Identifying a clear starting point simplifies examination of care pathways. With this in mind, the discussion below is restricted to those who had not accessed ACAT-dependent programs

21
before their first completed assessment in 2003–04, that is to the new-pathways cohort. Note, however, that some of the new-pathways cohort may have had one or more ACAT assessments before July 2003 (see footnote 2), or may have used the HACC or VHC programs.
As illustrated in Figure 3.1, different approaches can be used to examine pathways. For example, looking at the order of program access events and death but without considering the timing, the 77,400 people in the PIAC new-pathways cohort had 9,200 distinct pathways following their reference assessment (Approach A in Figure 3.1 and Table 3.2). If use of HACC or VHC services prior to the reference assessment is also considered, this number increases to 10,743.
The above multiplicity of care pathways makes it difficult to identify common patterns. To overcome this, one approach is to consider the order in which people access, or re-access, care programs. For such an analysis the picture can be simplified by excluding ACAT assessments as these enable access to services rather than provide assistance. Also within-program transfers do not indicate new access or re-access to a care program, and so can be excluded. Taking this approach, cohort members had 2,030 different program-use pathways—including those ending in death—over the 2 years following the end of the reference assessment (Approach B in Figure 3.1 and Table 3.2). This number increases to 2,619 if the use of HACC or VHC services before that assessment is taken into account.
People can access the same care program several times in a row (e.g. have regular periods in residential respite care). Changes in the care programs being accessed over time can be examined by ignoring such repeat use of a program when there has been no intervening use of a different program. Considering only these changes, there were 1,003 distinct care pathways over the 2-year period among the new-pathways cohort (1,358 allowing for use of HACC or VHC services before the reference assessment) (Approach C in Figure 3.1 and Table 3.2).
ACAP
HAC
C
Res
pite
Res
pite
ACAP
CAC
P
Res
pite
ACAP
Perm
anen
t Transfer
Approach A. Order of all events: A A H R R A C R P A transfer deathApproach B. Order of care program episodes: H R R C R P deathApproach C. Order of care program changes: H R C R P death
Time
At home
In RAC
x x
ACAP
x x x x
x x
deat
h}}
Figure 3.1: Example of a person’s aged care pathway, starting from the ACAT reference assessment

22
Table 3.1: PIAC cohort: aged care programs accessed within 2 years of the reference assessment, by PIAC group
Community care program use starting after reference ACAT assessment
ACAT-dependent program use starting after reference ACAT assessment
Continuing path
HACC and/or
VHC before
No previous
care
All new-pathways
cohort Total
No HACC/VHC Respite RAC only 5.8 5.1 2.3 3.9 4.4
Care packages only 1.0 4.8 2.7 3.9 3.1
Respite RAC and care packages 0.7 1.2 0.3 0.8 0.8
Permanent RAC only 33.7 24.3 18.7 21.8 24.9
Respite and permanent RAC 11.4 10.6 5.4 8.3 9.1
Care packages and permanent RAC 0.3 1.6 0.7 1.2 1.0
Care packages and respite and permanent RAC 0.5 1.5 0.6 1.1 0.9
No ACAT-dependent programs 30.0 23.5 24.6 24.0 25.6
Subtotal 83.4 72.7 55.3 65.0 69.8
With HACC/VHC Respite RAC only 3.6 2.9 3.8 3.3 3.4
Care packages only 0.7 3.8 3.9 3.8 3.0
Respite RAC and care packages 0.6 1.0 1.0 1.0 0.9
Permanent RAC only 2.8 3.5 6.9 5.0 4.4
Respite and permanent RAC 3.8 3.0 5.2 4.0 3.9
Care packages and permanent RAC 0.2 0.9 1.1 1.0 0.8
Care packages and respite and permanent RAC 0.5 0.9 0.9 0.9 0.8
No ACAT-dependent programs 4.3 11.3 21.8 16.0 12.9
Subtotal 16.6 27.3 44.7 35.0 30.2
All Respite RAC only 9.5 8.0 6.1 7.2 7.8
Care packages only 1.7 8.6 6.6 7.7 6.1
Respite RAC and care packages 1.3 2.2 1.4 1.8 1.7
Permanent RAC only 36.4 27.8 25.7 26.9 29.4
Respite and permanent RAC 15.2 13.7 10.6 12.3 13.1
Care packages and permanent RAC 0.5 2.5 1.8 2.2 1.7
Care packages and respite and permanent RAC 1.0 2.4 1.5 2.0 1.7
No ACAT-dependent programs 34.3 34.8 46.4 40.0 38.5
Total 100.0 100.0 100.0 100.0 100.0
Total N 27,545 42,920 34,428 77,348 104,893
Notes
1. Table excludes 184 cases with a pathway that indicated death before receipt of care (excluding HACC) (see Table C.8).
2. The reference assessment is the first completed ACAT assessment in 2003–04.
3. HACC and VHC are combined for this table because as VHC delivers a subset of the HACC service type, and VHC clients are also often HACC clients. CACP and EACH(D) are combined because of the small number of EACH(D) packages and to aid presentation.
4. Components may not add to total due to rounding.

23
Table 3.2: Distinct aged care pathways over 2 years after reference ACAT assessment, PIAC new-pathways cohort (number)
Approach to counting distinct pathways
With HACC/VHC
before No previous
care Total Ignoring early
HACC/VHC use
A. Pathways showing all program use: • including
– all episodes of care program use – all ACAT assessments – all with-in program transfers – death 5,933 4,810 10,743 9,200
B. Pathways showing care program use: • including
– all episodes of care program use – death
• excluding – ACAT assessments – with-in program transfers 1,361 1,258 2,619 2,030
C. Pathways showing care type changes: • including
– changes in care program use – death
• excluding – ACAT assessments – with-in program transfers
• ignoring multiple program use when there has been no intervening use of another program. 686 372 1,358 1,003
Notes
1. Table excludes 89 records with a pathway that indicated death before receipt of care as this implies linkage errors.
2. Changes in HACC and VHC use prior to the first completed ACAT assessment are not considered.
3. Completed pathways (i.e. those ending in death) are distinguished from those still ongoing after 2 years.
3.3 Care transitions The variety in the number and order of episodes of program use is illustrated in Figure 3.2 and Figure 3.3. These figures show, for the new-pathways cohort, the first three episodes of program use within 2 years of the reference assessment (as per Approach B in Table 3.2), split into those with and without previous use of HACC or VHC. The percentages in brackets show the proportion that made each particular transition.
Of the 34,400 cohort members who had not used HACC or VHC services prior to their reference assessment, 19% neither accessed any of the PIAC aged care programs nor died within 2 years of the assessment (group 2 in Figure 3.2). A further 6% died before accessing any care programs (group 1). As seen in Chapter 2, for a large proportion (41%) first care program use involved HACC or VHC services (group 3). Nearly one-fifth (19%) of people accessed permanent RAC first (group 81), while one in ten used respite RAC (group 32). Reflecting the smaller size of the community care package programs, just over 5% became care package recipients before doing anything else (group 57).
Whether people had more than one episode of care varied with the initial step. As expected, most people who went into permanent RAC either died (37%, group 83) or stayed in

24
permanent care for the remainder of the study period (57%, group 82). On the other hand, relatively few people beginning their care pathway on other programs died without a further care episode (between 5% and 10%: groups 5, 34 and 59). The proportion who had no further care episodes (i.e. the ‘no change’ groups) had a larger range, from 11% among those who accessed respite RAC only (group 33) to 43% of people who used only a care package (group 58).
The proportion of clients using a particular program at their second care episode depended on the first program accessed. For example, 43% of people who used respite RAC in the first episode next used permanent RAC (group 53), compared with 12–15% of those whose first episode involved community care (HACC, VHC or a care package: groups 27 and 77). Repeated access of HACC or VHC services and respite RAC was relatively common. In addition, evidence of use of respite RAC as a stepping stone into permanent RAC is seen in the high proportions of people who follow a period in respite care with admission into permanent RAC (see groups 26, 52, 53 and 76 in Figure 3.2).
As an ACAT assessment commonly leads to accessing HACC services, the pathways for people who first access HACC following their ACAT assessment (groups 3 to 31 in Figure 3.2) can be compared with those for the 42,900 members of the new-pathways cohort who had accessed HACC or VHC services before their 2003–04 reference assessment (Figure 3.3). An obvious difference between the two is the larger proportion among the ‘no previous care’ cohort who neither died nor accessed other care within 2 years: 29% versus 14% for the ‘with previous care’ group (group 4 in Figure 3.2 versus group 2 in Figure 3.3). This disparity is largely counter-balanced by the proportions going into permanent RAC: 25% among the cohort who had previously used HACC or VHC compared with 14% of those who had not (group 27 in Figure 3.2 versus group 86 in Figure 3.3). These differences could result from the older age and higher needs profiles of the ‘with HACC/VHC’ group, and again imply that members of this latter group were further along their ‘care needs pathways’ (see Appendix A).
Apart from the above differences, among other subsets the patterns of care in the two groups are alike. For example, the transition proportions following use of respite RAC after HACC or VHC were similar for those starting on HACC or VHC after the reference assessment (groups 20 to 26 in Figure 3.2) and for those who had used these services beforehand (following group 32 in Figure 3.3).

25
New-pathways cohort: no previous
care34,428
2. None 6,391 (19%)
3. HACC/VHC14,100 (41%)
1. Death 2,077 (6.0%)
13. Package1,498 (11%)
27. P RAC2,044 (14%)
20. Respite 2,211 (16%)
4. No change 4,143 (29%)
5. Death 1,340 (9.5%)
6. HACC/VHC2,864 (20%)
10. Package179 (6.3%)
12. P RAC264 (9.2%)
11. Respite 317 (11%)
7. No change 1,399 (49%)
8. Death 220 (7.7%)
9. HACC/VHC485 (17%)
17. Package25 (1.7%)
19. P RAC223 (15%)
18. Respite 250 (17%)
14. No change 526 (35%)
15. Death 122 (8.1%)
16. HACC/VHC352 (23%)
24. Package89 (4.0%)
26. P RAC856 (39%)
25. Respite 641 (29%)
22. Death 129 (5.8%)
23. HACC/VHC215 (9.7%)
21. No change 281 (13%)
29. Death 673 (33%)
31. HACC/VHC71 (3.5%)
28. No change 1,236 (60%)
30. Other 64
(3.1%)
42. Package90 (2.6%)
53. P RAC1,454 (43%)
46. Respite 761 (22%)33. No change
383 (11%)
34. Death 180 (5.3%)
35. HACC/VHC541 (16%)
39. Package28 (5.2%)
41. P RAC89 (16%)
40. Respite 189 (35%)
36. No change 140 (26%)
37. Death 31 (5.7%)
38. HACC/VHC64 (12%)
43. No change 27 (30%)
44. Death 3 (3.3%)
50. Package14 (1.8%)
52. P RAC243 (32%)
51. Respite 273 (36%)
48. Death 35 (4.6%)
49. HACC/VHC90 (12%)
47. No change 106 (14%)
55. Death 406 (28%)
54. No change 966 (66%)
45. Other 60
(67%)32. Respite 3,409 (9.9.%)
56. Other 82
(5.6%)
Figure 3.2: PIAC new-pathways cohort with no previous care before reference assessment: first three care events of care pathway within 2 years of first completed ACAT assessment in 2003–04

26
67. Package51 (2.8)
77. P RAC228 (12%)
71. Respite 242 (13%)
58. No change 785 (43%)
59. Death 127 (6.9%)
60. HACC/VHC397 (22%)
64. Package23 (5.8%)
66. P RAC45 (11%)
65. Respite 64 (16%)
61. No change 186 (47%)
62. Death 30 (7.5%)
63. HACC/VHC49 (12%)
68. No change 30 (59%)
69. Death 3 (5.9%)
76. P RAC109 (45%)
75. Respite 64 (26%)
73. Death 11 (4.6%)
72. No change 29 (12%)
79. Death 54 (24%)
78. No change 163 (71%)
70. Other 18 (35%)
80. Other 11 (4.8%)
57. Package1,830 (5.3%)
Second eventFirst event Third event
89. P RAC222 (3.4%)
82. No change 3,753 (57%)
83. Death 2,479 (37%)
84. HACC/VHC116 (1.8%)
85. No change 51 (44%) 86. Death
7 (6.0%)
91. Death 66 (30%)
90 No change 146 (66%)
88. Other 51
(0.77%)
92. Other 10 (1.4%)
81. P RAC6,621 (19%)
74. Other 29 (12%)
87. Other 58 (50%)
Shape format is: Group number. Program client number (per cent of parent group)
Program abbreviations: Package: CACP, EACH and EACHDP RAC: permanent RACRespite: respite RAC
Note: Figure uses Approach B in Table 3.2. Width of shape’s border indicates size of group. ‘Package’ includes CACP, EACH and EACHD.
Figure 3.2 (continued): PIAC new-pathways cohort with no previous care before reference assessment: first three care events of care pathway within 2 years of first completed ACAT assessment in 2003–04

27
New-pathways
cohort: HACC/VHC
before42,920
2. None 5,989 (14%)
3. HACC/VHC8,531 (20%)
1. Death 4,113 (9.6%)
13. Package833 (9.8%)
27. P RAC1,131 (13%)
20. Respite 1,262 (15%)
4. No change 2,784 (33%)
5. Death 712 (8.3%)
6. HACC/VHC1,809 (21%)
10. Package93 (5.1%)
12. P RAC151 (8.3%)
11. Respite 172 (9.5%)
7. No change 1,001 (55%)
8. Death 100 (5.5%)
9. HACC/VHC292 (16%)
17. Package10 (1.2%)
19. P RAC95 (11%)
18. Respite 134 (16%)
14. No change 339 (41%)
15. Death 66 (7.9%)
16. HACC/VHC189 (23%)
24. Package55 (4.4%)
26. P RAC442 (35%)
25. Respite 397 (31%)
22. Death 69 (5.5%)
23. HACC/VHC151 (12%)
21. No change 148 (12%)
29. Death 338 (30%)
31. HACC/VHC22 (1.9%)
28. No change 737 (65%)
30. Other 32
(2.8%)
42. Package394 (4.7%)
56. P RAC3,322 (39%)
49. Respite 2,478 (29%)
33. No change 820 (9.7%)
34. Death 591 (7.0%)
35. HACC/VHC872 (10%)
39. Package42 (4.8%)
41. P RAC138 (16%)
40. Respite 298 (34%)
36. No change 223 (26%)
37. Death 67 (7.7%)
38. HACC/VHC104 (12%)
43. No change 84 (21%)
44. Death 22 (5.6%)
53. Package76 (3.1%)
55. P RAC813 (33%)
54. Respite 1,020 (69%)
51. Death 114 (4.6%)
52. HACC/VHC192 (7.8%)
50. No change 263 (11%)
58. Death 1,024 (31%)
57. No change 2,085 (63%)
32. Respite 8,477 (20%)
59. Other 90
(2.7%)
47. Respite 138 (35%)
60. P RAC123 (3.7%)
46. Package4 (1.0%)
45. HACC/VHC68 (17%)
48. P RAC78 (20%)
Figure 3.3: PIAC new-pathways cohort with HACC/VHC before reference assessment: first three care events of care pathway within 2 years of first completed ACAT assessment in 2003–04

28
71. Package80 (1.6%)
82. P RAC706 (14%)
75. Respite 832 (16%)
62. No change 1,566 (31%)
63. Death 446 (8.8%)
64. HACC/VHC1,435 (28%)
68. Package71 (4.9%)
70. P RAC184 (13%)
69. Respite 219 (15%)
65. No change 653 (46%)
66. Death 87 (6.1%)
67. HACC/VHC221 (15%)
72. No change 41 (51%)
73. Death 10 (13%)
79. Package14 (1.7%)
81. P RAC320 (38%)
80. Respite 230 (28%)
77. Death 37 (4.4%)
78. HACC/VHC90 (11%)
76. No change 141 (17%)
84. Death 204 (29%)
83. No change 472 (67%)
74. Other
29 (36%)
85. Other 30
(4.2%)
61. Package5,065 (12%)
Second eventFirst event Third event
97. P RAC356 (3.3%)
87. No change 5,751 (54%)
88. Death 4,343 (40%)
89. HACC/VHC259 (2.4%)
93. Package21 (8.1%)
95. P RAC55 (21%)
94. Respite 31 (12%)
90. No change 93 (36%)
91. Death 28 (11%)
92. HACC/VHC31 (12%)
99. Death 133 (37%)
98. No change 200 (56%)
96. Other 36
(0.34%)
100. Other
23 (6.5%)
86. P RAC10,745 (25%)
Shape format is: Group number. Program client number (per cent of parent group)
Program abbreviations: Package: CACP, EACH and EACHDP RAC: permanent RACRespite: respite RAC
Note: Figure uses Approach B in Table 3.2. Width of shape’s border indicates size of group. ‘Package’ includes CACP, EACH and EACHD.
Figure 3.3 (continued): PIAC new-pathways cohort with HACC/VHC before reference assessment: first three care events of care pathway within 2 years of first completed ACAT assessment in 2003–04
3.4 Common care pathways While there were many different care pathways, a relatively small set was used by a large proportion of the cohort. Looking at the first three care changes after the reference ACAT assessment (Approach C in Table 3.2), 14 combinations applied to 82% of cohort members (Table 3.3).
Overall, the most common path was the ‘no change’ path: 16% of the cohort were still alive 2 years after the reference assessment and had not newly accessed any care programs in that time (path A in Table 3.3). However, almost half (48%) of these clients had already accessed

29
HACC or VHC services beforehand, and use of these programs often continued after the ACAT assessment (see Chapter 4). Other paths followed by a relatively large proportion of the cohort included going into permanent residential care without accessing other services (paths B and D, accounting for 23% of the cohort, 40% of whom died), and only accessing HACC or VHC services (paths C and H, accounting for 14%, including those who died). Eight per cent of the cohort died before taking up any new program services; however, two-thirds of these people had accessed HACC or VHC services prior to their ACAT assessment (path E).
Highlighting the importance of community care in aged care pathways, use of either HACC or VHC was the first step in five of the 14 most common post-assessment pathways (paths C, H, I, L, M) (Table 3.3). These five paths were used by 28% of those with no previous care, and by 21% of all new-pathways cohort members. These findings again show that, in 2003–04, ACAP teams were acting as a conduit for information about these programs even though an ACAT approval was not required for access.
That respite RAC is also an integral part of the aged care system is indicated by its appearance in four of the top 14 pathways, with these paths being used by 13% of the cohort (paths F, J, K, L). Pathways incorporating respite RAC were more common among those who had accessed HACC or VHC before the reference assessment (16%) than among those who had not (10%). Use of respite care was often followed at a later date by admission into permanent residential care (paths F, K, L).

30
Table 3.3: PIAC new-pathways cohort: first three care changes for care pathways over 2 years after reference assessment
Path no. First Second Third
With HACC/VHC
before
No previous
care Total All
(a)Per cent with
HACC/VHC
Per cent N Cum. %
A — — — 14.0 18.6 16.0 12,380 16.0 48.4
B Perm. RAC — — 13.9 11.3 12.8 9,865 28.8 60.4
C HACC/VHC — — 8.9 14.8 11.5 8,893 40.3 42.9
D Perm. RAC Death — 10.4 7.4 9.1 7,028 49.3 63.8
E Death — — 9.6 6.0 8.0 6,190 57.3 66.4
F Resp. RAC Perm. RAC — 7.3 3.7 5.7 4,396 63.0 70.9
G CACP — — 3.6 2.3 3.0 2,313 66.0 65.9
H HACC/VHC Death — 1.8 4.2 2.9 2,228 68.9 35.5
I HACC/VHC Perm. RAC — 1.9 4.0 2.8 2,196 71.7 37.9
J Resp. RAC — — 3.4 1.6 2.6 2,002 74.3 71.9
K Resp. RAC Perm. RAC Death 3.2 1.5 2.5 1,912 76.8 72.9
L HACC/VHC Resp. RAC Perm. RAC 1.6 3.6 2.5 1,911 79.3 35.3
M HACC/VHC Perm. RAC Death 0.9 2.1 1.4 1,080 80.7 34.2
N CACP HACC/VHC — 1.8 0.6 1.3 1,013 82.0 78.1
All other paths 17.8 18.3 18.0 13,941 100.0 54.7
Total 100.0 100.0 100.0 77,348 . . 55.5
Number of distinct paths used 123 113 132 . . . . . .
(a) For some people access to HACC/VHC may have continued after the reference ACAT assessment.
Notes
1. Table uses pathway definition C in Table 3.2.
2. Table excludes 89 records with a pathway that indicated death before receipt of care as this implies linkage errors.
3. Changes in HACC and VHC use prior to the first completed ACAT assessment are not considered. All ACAT assessments, transfers due to a change in service provider and multiple program use when there has been no intervening use of another program are also not considered.
4. HACC and VHC are combined for this table as VHC delivers a subset of the HACC service types.
5. Completed pathways (i.e. those ending in death) are distinguished from those still ongoing after 2 years.

31
4 Changes over time
Linking program data which includes information on dates of program use allows us to look at time to key events, changes in use of care programs over time and at concurrent use of programs.
4.1 Summary Among the new-pathways cohort: • Nearly 13% had accessed a CACP within 1 year of their reference assessment, and
43% had been admitted to permanent residential aged care. • The first 3 months after the reference assessment saw the largest take-up rates for both
packaged and residential care. • Take-up rates were higher among those who had previously used HACC and VHC, as
were death rates. These results support the hypothesis that new-pathways cohort members with no previous care were not as advanced along their ‘care needs pathway’ as other members.
As expected, the service use profile of the cohort groups changed over time: • In all PIAC groups, the proportions of living cohort members in permanent RAC
increased over time. The increase in use of permanent RAC was accompanied by relative decreases in the use of respite RAC, and, more noticeably, HACC.
• At the time of their reference assessment, 41% of the continuing path group were in permanent RAC, 28% were on a care package and 15% were using HACC or VHC only. Within 2 years, 39% of these people had died; 70% of those still alive were in permanent residential care and 14% were package recipients. A further 7% were using HACC and/or VHC services.
• People who had not used aged care services before their reference assessment were less likely than others to take up these services within the study period. In the 2-year period after the ACAT assessment, just over a quarter of this group died; 34% of those still alive after 2 years were in permanent residential care, 8% were in receipt of a community care package and 15% were HACC or VHC clients only.
• Concurrent use of HACC services was common among community care package recipients and VHC clients.
• Because of its short term nature, at any one time few people were in residential respite care (always under 3%). However, for all cohort groups and at all time periods considered, more than half of those in respite RAC were accessing at least one community care program when they were at home.
• Two-fifths (39%) of the continuing path group died within 2 years of their reference ACAT assessment, as did 32% of the new-pathways cohort who had used HACC or VHC before and 27% of those who had not previously used aged care programs.

32
4.2 Time to care Two ways of looking at program use by individuals over time are examined: • the time to using particular care programs after the reference assessment, and • changing program use over time.
In this section we look at the first of these. The second perspective is considered in the next section.
Time to use of the two key ACAT-dependent programs—CACPs and permanent RAC—are explored below. In this analysis, use of particular services is considered for all cohort members, including those who did not access services for which they were approved and those who may not have originally been given approvals for some services.3 Consequently, we are examining elapsed time from the reference assessment to program use, and not elapsed time from the ACAT approval for use of a particular program. The resulting measure is different from waiting time, as ideally a measure of waiting time only includes people with a particular approval and would exclude periods in which factors other than service availability affected the take-up of services. Such factors include unwillingness to use particular service providers, changes in social or health circumstances and death of the potential client.
0 91 183 274 365 456 548 639 7300
5
10
15
20
25
30
35
40Per cent who have started on a CACP
Days after reference assessment
Continuing path
HACC / VHC before
No previous care
Source: Table 4.1.
Figure 4.1: Take up of CACPs over time, by PIAC cohort group (per cent of group)
3 The data reported here include clients who did not access services and so are not comparable with those
reported in SCRGSP 2009.

33
Over one-quarter (28%) of those continuing on their path were recipients of a CACP at the start of their reference ACAT assessment, and two-fifths (41%) were in permanent residential aged care (Table 4.1, Table 4.2). Within 3 months after the assessment a further 8%began on a package. However, very few did so after that, and only an additional 1% started on a CACP between 3 and 24 months after assessment (Figure 4.1).
While many (18%) among the continuing path group were admitted to permanent residential care in the 3 months after assessment, unlike starts on CACPs, admissions continued over time in steadily decreasing numbers (Figure 4.2). In the 2 years after assessment, 36% of this group entered permanent presidential care, so that by the end of the study period 77% had been in permanent residential care.
Nearly 11% of the new-pathways cohort had accessed a CACP within 1 year of their reference ACAT assessment, with a further 2% taking up a package in the following year (Table 4.1). People who had previously used HACC or VHC services were more likely to take up a community care package than those who had not: 12% within a year versus 9% (Figure 4.1). For both groups, just under 60% of these moves in the first year onto a package happened within 3 months of the reference assessment.
As with the continuing path group, admission into permanent residential care was common among the PIAC new-pathways members in the 2 years after their reference assessment: 46% of those who had previously used HACC or VHC, and 40% of those who had not, had been admitted to permanent residential care within 2 years of their reference assessment. The majority of admissions were within 1 year (Table 4.2 , Figure 4.2). For both groups, over two-fifths of first admissions in the period were within 3 months of the assessment; however, within each quarter the proportions entering permanent RAC were smaller among those with no previous care than among those who had accessed HACC or VHC.
0 91 183 274 365 456 548 639 7300
10
20
30
40
50
60
70
80Per cent who have entered permanent RAC
Days after reference assessment
Continuing path
HACC and/or VHC before
No previous care
Source: Table 3.2.
Figure 4.2: Movement into permanent RAC over time, by PIAC cohort group (per cent of group)

34
The above results may seem counter-intuitive; that is, that the new-pathways group which had not previously used HACC or VHC had both lower admission rates into community care packages and permanent RAC than those who had used these community care services. However, analysis in Appendix A shows that people with no previous care had a younger age profile than other new-pathways members (Table A.5). In addition, people with no previous use of care programs seemed to have fewer care needs, averaging fewer health conditions and slightly lower care need scores (Table A.18, Table A.19 and Table A.20). The tendency seen in Chapter 2 for an ACAT assessment to provide a pathway into HACC (and to a lesser extent, VHC) also suggests that that new-pathways cohort members with no previous care were not as advanced along their ‘care needs pathway’ as other cohort members, and so would be expected to have longer periods before admission into packages or residential care. The higher death rate among the latter group (discussed in the next section) corroborates this hypothesis.
Table 4.1: PIAC cohort: Time to starting on a CACP after reference assessment, by PIAC group (per cent)
Time after completion of reference ACAT assessment
Continuing path
HACC and/or VHC before
No previous care
All new-pathways
cohort All Total
number
In CACP at start of assessment 28.0 . . . . . . . . 7,720
Q1: ≤ 91 days 7.9 7.2 5.0 6.2 6.7 6,978
Q2: 92–183 days 0.3 2.6 1.9 2.3 1.8 1,844
Q3: 184–274 days 0.2 1.4 1.2 1.3 1.0 1,054
Q4: 275–365 days 0.1 1.1 0.7 0.9 0.7 765
Within 1 year 36.4 12.3 8.8 10.8 17.5 18,361
Q5: 366–456 days 0.1 0.8 0.6 0.7 0.6 577
Q6: 457–548 days 0.1 0.7 0.6 0.6 0.5 504
Q7: 549–639 days 0.1 0.5 0.4 0.5 0.4 395
Q8: 640–730 days 0.1 0.6 0.4 0.5 0.4 385
Within 1 to 2 years 0.3 2.6 2.0 2.3 1.8 1,861
Within 2 years 36.7 14.9 10.8 13.1 19.3 20,222
No event 63.3 85.1 89.2 86.9 80.7 84,671
Total 100.0 100.0 100.0 100.0 100.0 . .
Total (number) 27,545 42,920 34,428 77,348 . . 104,893
Notes
1. Table excludes 184 cases with a pathway that indicated death before receipt of care (excluding HACC) (see Table C.8).
2. The reference date is the date of the end of the first completed ACAT assessment in 2003–04.

35
Table 4.2: PIAC cohort: Time to entry into permanent care after reference assessment, by PIAC group (per cent)
Time after completion of reference ACAT assessment
Continuing path
HACC and/or VHC before
No previous care
All new-pathways
cohort All Total
number
In permanent RAC at start of assessment 41.3 . . . . . . 10.8 11,377
Q1: ≤ 91 days 18.3 19.6 18.4 19.1 18.9 19,777
Q2: 92–183 days 5.5 7.1 5.5 6.4 6.2 6,479
Q3: 184–274 days 3.4 4.8 4.0 4.4 4.2 4,359
Q4: 275–365 days 2.4 3.9 3.0 3.5 3.2 3,372
Within 1 year 70.9 35.5 30.8 33.4 43.2 45,364
Q5: 366–456 days 2.2 3.4 2.6 3.0 2.8 2,918
Q6: 457–548 days 1.7 2.8 2.4 2.6 2.4 2,481
Q7: 549–639 days 1.3 2.5 2.0 2.3 2.0 2,110
Q8: 640–730 days 1.1 2.3 1.8 2.1 1.8 1,910
Within 1 to 2 years 6.4 10.9 8.7 9.9 9.0 9,419
Within 2 years 77.3 46.4 39.5 43.3 52.2 54,783
No event 22.7 53.6 60.5 56.7 47.8 50,110
Total 100.0 100.0 100.0 100.0 100.0 104,893
Total (number) 27,545 42,920 34,428 77,348 104,893
Notes
1. Table excludes 184 cases with a pathway that indicated death before receipt of care (excluding HACC) (see Table C.8).
2. The reference date is the date of the end of the first completed ACAT assessment in 2003–04.
4.3 Changes in program use over time As seen above, and as expected, use of care programs by cohort members increased over time. In the following analysis we look at the changing use of aged care services over time by examining the programs being used at selected points after assessment. People who had died before each time point are not included in the related percentages to aid the discussion. Overall, one-fifth of the PIAC cohort died within 1 year of the reference assessment, and another 12% died the following year (Table 4.8).
For people who had accessed aged care services prior to their reference assessment, the proportion of live clients accessing a care program levelled off at about 12 months after the assessment, at just over 92% for the continuing path group a (Figure 4.3). At the time of their reference assessment, 41% of this group were in permanent RAC, 28% were on a care package and 15% were using HACC or VHC only. Within 2 years, 39% of these people had died, and 70% of those still alive were in permanent residential care and 14% were package recipients (Table 4.4). A further 7% were using HACC and/or VHC services.
Among the new-pathways cohort who had used HACC or VHC services before their reference assessment, the proportion using care services increased from 78% at the reference assessment to around 85–86% of live clients 1 year later, where it remained for the next year (Table 4.6). After 2 years, nearly one-third of this group had died; of the remaining two-

36
thirds, 42% were in permanent residential care, 12% were care package recipients and 35% were accessing HACC and/or VHC services (some in conjunction with a care package).
People who had not used aged care services before their reference assessment were less likely than others to take up these services within the study period. However, a considerable proportion did, with the proportions accessing services slowing down over time but not levelling off within 2 years as it did for the other two groups (Figure 4.3). Three months after assessment, 17% of this ‘no previous care’ group who were still alive were in permanent residential care, 5% were using a care package and 21% were in receipt of HACC and/or VHC services (including a small proportion who were also package recipients). Two years after the reference assessment just over a quarter of the group had died; 34% of those still alive were in permanent residential care, 8% were in receipt of a community care package and 15% were HACC or VHC clients only.
In all PIAC groups, the proportions in permanent RAC increased over time (Table 4.3). For the two new-pathways groups, the proportion of living cohort members who were in permanent RAC more than doubled between 3 and 24 months after the reference assessment. And even among people who were continuing their path at the time of the reference assessment the proportion in permanent RAC rose from 54% after 3 months to 70% after 2 years. The increase in use of permanent RAC was accompanied by relative decreases in the use of respite RAC, and, more noticeably, HACC. At the time of the reference assessment, 78% of the ‘HACC/VHC before’ new-pathways group were using HACC or VHC services compared with 35% 2 years later. For the other two PIAC groups, the proportion using HACC or VHC decreased—from 25% at assessment to 12% at 24 months after the reference assessment among the continuing path group, and from 21% at 3 months to 17% at 24 months among those with no previous care.
The proportion of people receiving CACPs decreased over time among people who had already accessed ACAT-dependent services prior to the reference assessment. In contrast, in the new-pathways groups the proportions on CACPs increased over the 2-year period, steadying after 12 months at around 11% among those who had previously used HACC or VHC and at just over 7% among those who had not. The proportion on EACH or EACHD packages increasing gradually over time for all groups, most likely reflecting the more than ten-fold growth in program places between 2003 and 2006 (AIHW 2007a:133).

37
Continuing path HACC/VHC before No previous care0
10
20
30
40
50
60
70
80
90
100
Per cent of living clients
PIAC new-pathways group
At start
At 3 months
At 6 months
At 12 months
At 18 months
At 24 months
Source: Table 4.3.
Figure 4.3: Proportion of people using aged care programs over time, by PIAC cohort group (per cent of living cohort at time point)
4.4 Concurrent program use People who are recipients of a CACP can also access certain services from other community care programs. In particular, CACP recipients may access HACC for nursing and allied health services, and for centre-based day care. Recipients of EACH and EACHD packages can also use HACC-provided centre-based day care. In addition, clients of community care services may use residential respite care, and eligible veterans can access in-home respite care and emergency short-term respite under VHC.
Six months after assessment, 19% of the continuing path group were CACP recipients, with around one-third of these people also being HACC or VHC clients (7% of the cohort who were still alive) (Table 4.3 and Table 4.4). Interestingly, just over one-third of the continuing path group using HACC or VHC services at 6 months were also a package recipient (6.4% out of 18.1%). Use of packages among HACC clients was much lower for the other cohort groups.
For the new-pathways cohort who had previously used HACC or VHC, just over one-third of the 9% on a CACP after 6 months were also accessing HACC or VHC services (Table 4.6). In contrast, fewer than one in six of the new-pathways group with no previous care who were on a CACP after 6 months were also using HACC or VHC services (1.0% out of 6.4%).4
4 Previous analysis looking at concurrent use of CACP and HACC estimated that around 35% of CACP
recipients had concurrent use of HACC (AIHW: Karmel & Braun 2004). The lower levels found here (considering that VHC is also included) is explained by more detailed data preparation carried out on HACC service use data for the PIAC project.

38
A similar pattern was seen at 24 months after assessment (Table 4.7). Similar comparisons cannot be made for EACH and EACHD recipients due the small numbers involved.
Reflecting the more limited nature of VHC, overlap between VHC and HACC was also quite common, with 25–40% of people who were VHC clients at the 6 month point also accessing HACC services, depending on the PIAC group (Table 4.3, Table 4.4, Table 4.6 and Table 4.7). On the other hand, fewer than one in 16 people using the large HACC program were also accessing VHC services.
Although use of respite RAC was among the first three care types used for over 13% of the new-pathways cohort (Table 3.3), at any one time few people were using this service. This reflects its short term nature. At 6 months after the reference assessment less than 1.5% of the new-pathways groups who were still alive were accessing residential respite care at any one time. Among those continuing their path, nearly 3% were in respite RAC at the start of their reference assessment. This had dropped to 1.5% at 12 months after the assessment. However, for all cohort groups and at all time periods considered, more than half of those in respite RAC were accessing at least one community care program when they were at home.
Analysis in Section 4.3 showed that a substantial proportion of the PIAC cohort had not used CACPs or entered permanent RAC within 2 years of their reference assessment. In fact, some people never use such care, dying before they need to (or can) take up such care. Two-fifths (39%) of the continuing path group died within 2 years of the reference assessment, 32% of the new-pathways cohort who had used HACC or VHC died, as did 27% of those who had no previous care. Within each quarterly period, the death rate was highest among those in the continuing path group and lowest among people who had not accessed care programs before their reference assessment. In all three PIAC groups, the highest death rate occurred in the 3 months immediately after assessment (Table 4.8, Figure 4.4).
0 91 183 274 365 456 548 639 7300
5
10
15
20
25
30
35
40
Per cent who have died
Days after reference assessment
Continuing path
HACC and/or VHC before
No previous care
Source: Table 4.8.
Figure 4.4: Deaths over time, by PIAC cohort group (per cent of group)

39
Table 4.3: PIAC cohort: summary of program use at specific intervals from reference assessment
Program use at start of
assessment
Care program use at time after end of reference assessment:
Programs being used 3 months 6 months 12 months 18 months 24 months
Continuing path Per cent of clients alive at the time
Not using a care program 12.5 9.5 8.4 7.7 7.7 7.7
Permanent RAC 41.3 54.0 59.2 64.6 68.1 70.0
Any HACC 23.8 19.4 17.2 14.6 12.5 11.5
Any VHC 2.2 1.8 1.6 1.4 1.1 1.0
Any HACC/VHC 25.0 20.5 18.1 15.4 13.1 12.1
Any CACP 28.0 21.5 19.2 16.3 14.3 13.0
Any EACH(D) 0.4 0.8 0.9 1.0 1.2 1.4
Any respite RAC 2.9 2.8 2.1 1.5 1.2 1.2
Deaths as per cent of clients alive at previous time point — 9.3 6.4 10.2 10.2 10.4
Clients alive at time (number) 27,544 24,978 23,373 21,000 18,862 16,891
HACC/VHC before
Not using a care program 22.1 17.9 16.7 15.7 16.1 15.1
Permanent RAC . . 18.0 24.4 32.1 37.7 42.0
Any HACC 71.9 53.8 47.8 40.8 34.9 31.6
Any VHC 9.3 8.2 7.4 6.3 5.5 5.1
Any HACC/VHC 77.9 58.5 52.1 44.5 38.2 34.8
Any CACP . . 7.1 9.3 10.7 10.9 11.0
Any EACH(D) . . 0.2 0.3 0.4 0.5 0.7
Any respite RAC . . 2.3 1.5 1.2 1.1 0.9
Deaths as per cent of clients alive at previous time point — 8.0 5.4 8.4 7.7 8.0
Clients alive at time (number) 42,920 39,505 37,358 34,217 31,573 29,055
No previous care
Not using a care program 100.0 56.6 53.6 48.1 45.4 42.8
Permanent RAC . . 16.6 21.1 26.9 31.0 34.0
Any HACC . . 20.2 17.9 17.1 15.5 15.3
Any VHC . . 1.5 1.5 1.5 1.6 1.7
Any HACC/VHC . . 21.2 19.0 18.3 16.8 16.5
Any CACP . . 4.9 6.4 7.2 7.5 7.4
Any EACH(D) . . 0.1 0.2 0.3 0.4 0.5
Any respite RAC . . 1.7 1.0 0.9 0.6 0.7
Deaths as per cent of clients alive at previous time point — 7.3 4.1 6.5 5.9 5.9
Clients alive at time (number) 34,428 31,911 30,610 28,615 26,919 25,331
Note: Clients may use more than one program at a time, and so percentages do not sum to 100. Fewer than five clients were using Transition Care at the 18 and 24 month time points, respectively. This is not shown in the table.

40
Table 4.4: PIAC continuing path cohort: program use at specific intervals from ACAT reference assessment
Program use at start of
assessment
Care program use at time after end of reference assessment:
Programs being used 3 months 6 months 12 months 18 months 24 months
Per cent of clients alive at the time
Not using a care program 12.5 9.5 8.4 7.7 7.7 7.7
HACC only 13.6 10.8 9.5 8.2 7.0 6.3
VHC only 1.0 0.8 0.7 0.6 0.5 0.4
HACC and VHC only 0.8 0.6 0.6 0.5 0.4 0.4
HACC and/or VHC only 15.4 12.2 10.8 9.3 7.9 7.2
CACP only 19.1 13.8 12.6 10.8 9.4 8.6
CACP and HACC/VHC only 8.4 6.9 6.0 5.1 4.5 4.1
EACH(D) only 0.3 0.7 0.8 0.8 1.0 1.1
EACH(D) and HACC/VHC only 0.0 0.1 0.1 0.1 0.1 0.2
Respite RAC only 1.3 0.9 0.6 0.4 0.3 0.3
Respite RAC and HACC/VHC only 1.1 1.0 0.9 0.6 0.4 0.5
Respite RAC and CACP/EACH(D) only 0.4 0.6 0.4 0.3 0.3 0.3
Respite RAC, CACP/EACH(D) and HACC/VHC 0.1 0.3 0.3 0.2 0.2 0.1
Permanent RAC 41.3 54.0 59.2 64.6 68.1 70.0
Any HACC 23.8 19.4 17.2 14.6 12.5 11.5
Any VHC 2.2 1.8 1.6 1.4 1.1 1.0
Any HACC/VHC 25.0 20.5 18.1 15.4 13.1 12.1
Any CACP 28.0 21.5 19.2 16.3 14.3 13.0
Any EACH(D) 0.4 0.8 0.9 1.0 1.2 1.4
Any respite RAC 2.9 2.8 2.1 1.5 1.2 1.2
Clients alive at time (number) 27,544 24,978 23,373 21,000 18,862 16,891
Deaths
Clients who died in the time period (number) (a)<3 2,566 1,605 2,373 2,138 1,971
Deaths as per cent of all clients — 9.3 5.8 8.6 7.8 7.2
Deaths as per cent of clients alive at previous time point — 9.3 6.4 10.2 10.2 10.4
(a) Relates to clients dying on the day that the assessment started.
Note: Clients may use more than one program at a time, and so percentages do not sum to 100. In addition, fewer than three clients were using Transition Care at the 24 month time point. This is not shown in the table.

41
Table 4.5: PIAC new-pathways cohort: program use at specific intervals from reference ACAT assessment
Program use at start of
assessment
Care program use at time after end of reference assessment:
Programs being used 3 months 6 months 12 months 18 months 24 months
Per cent of clients alive at the time
Not using a care program 56.8 35.2 33.3 30.4 29.6 28.0
HACC only 38 34.1 29.7 25.5 21.7 19.8
VHC only 3.3 3.0 2.8 2.4 2.3 2.1
HACC and VHC only 1.8 2.1 1.8 1.5 1.3 1.2
HACC and/or VHC only 43.2 39.1 34.3 29.5 25.3 23.2
CACP only . . 4.3 5.7 6.5 6.7 6.6
CACP and HACC/VHC only . . 1.7 2.2 2.5 2.5 2.6
EACH(D) only . . 0.2 0.2 0.3 0.4 0.5
EACH(D) and HACC/VHC only . . — — — 0.1 0.1
Respite RAC only . . 1.0 0.5 0.4 0.3 0.3
Respite RAC and HACC/VHC only . . 0.9 0.6 0.5 0.4 0.4
Respite RAC and CACP/EACH(D) only . . 0.1 0.1 0.1 0.1 0.1
Respite RAC, CACP/EACH(D) and HACC/VHC . . — — — 0.1 0.1
Permanent RAC . . 17.4 22.9 29.7 34.6 38.2
Any HACC 39.9 38.8 34.3 30 26 24
Any VHC 5.2 5.2 4.7 4.1 3.7 3.5
Any HACC/VHC 43.2 41.9 37.2 32.6 28.3 26.3
Any CACP . . 6.1 8.0 9.1 9.3 9.3
Any EACH(D) . . 0.2 0.3 0.3 0.5 0.6
Any respite RAC . . 2.0 1.2 1.1 0.9 0.8
Clients alive at time (number) 77,348 71,416 67,968 62,832 58,492 54,386
Deaths
Clients who died in the time period (number) — 5,932 3,448 5,136 4,340 4,106
Deaths as per cent of all clients — 7.7 4.5 6.6 5.6 5.3
Deaths as per cent of clients alive at previous time point — 7.7 4.8 7.6 6.9 7.0
Note: Clients may use more than one program at a time, and so percentages do not sum to 100. Fewer than five clients were using Transition Care at the 18 month time point and 24 month time point. This is not shown in the table.

42
Table 4.6: PIAC new-pathways cohort with previous use of HACC or VHC: program use at specific intervals from reference ACAT assessment
Program use at start of
assessment
Care program use at time after end of reference assessment:
Programs being used 3 months 6 months 12 months 18 months 24 months
Per cent of clients alive at the time
Not using a care program 22.1 17.9 16.7 15.7 16.1 15.1
HACC only 68.6 46.7 40.8 34.0 28.6 25.7
VHC only 6.0 4.5 4.1 3.5 3.2 3.0
HACC and VHC only 3.3 3.4 3.0 2.6 2.1 1.9
HACC and/or VHC only 77.9 54.6 48.0 40.1 33.9 30.5
CACP only . . 4.5 6.0 7.0 7.2 7.2
CACP and HACC/VHC only . . 2.5 3.1 3.6 3.6 3.6
EACH(D) only . . 0.2 0.3 0.4 0.4 0.6
EACH(D) and HACC/VHC only . . — — — 0.1 0.1
Respite RAC only . . 0.8 0.4 0.3 0.3 0.2
Respite RAC and HACC/VHC only . . 1.4 0.9 0.7 0.6 0.5
Respite RAC and CACP/EACH(D) only . . 0.1 0.1 0.1 0.2 0.1
Respite RAC, CACP/EACH(D) and HACC/VHC . . — 0.1 0.1 0.1 0.1
Permanent RAC . . 18.0 24.4 32.1 37.7 42.0
Any HACC 71.9 53.8 47.8 40.8 34.9 31.6
Any VHC 9.3 8.2 7.4 6.3 5.5 5.1
Any HACC/VHC 77.9 58.5 52.1 44.5 38.2 34.8
Any CACP . . 7.1 9.3 10.7 10.9 11.0
Any EACH(D) . . 0.2 0.3 0.4 0.5 0.7
Any respite RAC . . 2.3 1.5 1.2 1.1 0.9
Clients alive at time (number) 42,920 39,505 37,358 34,217 31,573 29,055
Deaths
Clients who died in the time period (number) 0 3,415 2,147 3,141 2,644 2,518
Deaths as per cent of all clients 0.0 8.0 5.0 7.3 6.2 5.9
Deaths as per cent of clients alive at previous time point 0.0 8.0 5.4 8.4 7.7 8.0
Note: Clients may use more than one program at a time, and so percentages do not sum to 100. Fewer than three clients were using Transition Care at the 18 month time point and 2 at the 24 month time point. This is not shown in the table.

43
Table 4.7: PIAC new-pathways cohort with no previous care: program use at specific intervals from reference ACAT assessment
Program use at start of
assessment
Care program use at time after end of reference assessment:
Programs being used 3 months 6 months 12 months 18 months 24 months
Per cent of clients alive at the time
Not using a care program 100.0 56.6 53.6 48.1 45.4 42.8
HACC only . . 18.6 16.2 15.3 13.7 13.2
VHC only . . 1.0 1.1 1.1 1.2 1.2
HACC and VHC only . . 0.4 0.4 0.3 0.3 0.4
HACC and/or VHC only . . 20.0 17.7 16.8 15.2 14.8
CACP only . . 4.1 5.4 5.9 6.1 5.9
CACP and HACC/VHC only . . 0.8 1.0 1.2 1.3 1.4
EACH(D) only . . 0.1 0.2 0.2 0.3 0.4
EACH(D) and HACC/VHC only . . 0.0 — — 0.1 0.1
Respite RAC only . . 1.2 0.6 0.5 0.3 0.3
Respite RAC and HACC/VHC only . . 0.4 0.3 0.3 0.2 0.2
Respite RAC and CACP/EACH(D) only . . — 0.1 0.1 0.1 0.1
Respite RAC, CACP/EACH(D) and HACC/VHC . . — — — — —
Permanent RAC . . 16.6 21.1 26.9 31.0 34.0
Any HACC . . 20.2 17.9 17.1 15.5 15.3
Any VHC . . 1.5 1.5 1.5 1.6 1.7
Any HACC/VHC . . 21.2 19.0 18.3 16.8 16.5
Any CACP . . 4.9 6.4 7.2 7.5 7.4
Any EACH(D) . . 0.1 0.2 0.3 0.4 0.5
Any respite RAC . . 1.7 1.0 0.9 0.6 0.7
Clients alive at time (number) 34,428 31,911 30,610 28,615 26,919 25,331
Deaths
Clients who died in the time period (number) — 2,517 1,301 1,995 1,696 1,588
Deaths as per cent of all clients — 7.3 3.8 5.8 4.9 4.6
Deaths as per cent of clients alive at previous time point — 7.3 4.1 6.5 5.9 5.9
Note: Clients may use more than one program at a time, and so percentages do not sum to 100. Fewer than three clients were using Transition Care at the 24 month time point. This is not shown in the table.

44
Table 4.8: PIAC cohort: time to death after reference assessment, by PIAC group (per cent)
Time after completion of reference ACAT assessment
Continuing path
HACC and/or VHC before
No previous care
All new-pathways
cohort All Total
number
Q1: ≤ 91 days 9.5 8.2 7.4 7.8 8.3 8,658
Q2: 92-183 days 5.8 4.9 3.8 4.4 4.8 5,008
Q3: 184-274 days 4.6 3.9 3.1 3.5 3.8 3,997
Q4: 275-365 days 4.0 3.4 2.7 3.1 3.3 3,481
Within 1 year 23.9 20.4 16.9 18.8 20.2 21,144
Q5: 366-456 days 4.0 3.2 2.5 2.9 3.2 3,344
Q6: 457-548 days 3.8 3.0 2.4 2.7 3.0 3,134
Q7: 549-639 days 3.5 2.9 2.3 2.6 2.9 3,021
Q8: 640-730 days 3.6 2.9 2.3 2.7 2.9 3,039
Within 1 to 2 years 14.9 12.0 9.5 10.9 12.0 12,538
Within 2 years 38.8 32.4 26.5 29.7 32.1 33,682
No event 61.2 67.6 73.5 70.3 67.9 71,211
Total 100.0 100.0 100.0 100.0 100.0 . .
Total (number) 27,545 42,920 34,428 77,348 . . 104,893
Notes
1. Table excludes 184 cases with a pathway that indicated death before receipt of care (excluding HACC) (see Table C.8).
2. The reference date is the date of the end of the first completed ACAT assessment in 2003–04.

45
Appendix A: PIAC cohort characteristics
The characteristics of the PIAC cohort at the time of their first completed ACAT assessment in 2003–04 are discussed in detail below. Some characteristics, such as sex and cultural background, should remain unchanged over time; however, others (e.g. social circumstances and care needs) may change from assessment to assessment.
A.1 Summary Analysis of the characteristics of the PIAC cohort groups suggests that people in the new-pathways cohort who had already accessed HACC or VHC before their reference assessment had higher care needs than those who had had no previous care, and so were further along their ‘care needs pathway’. As expected, those in the continuing pathway group had the highest care needs. Several results point to this conclusion: • Continuing path group members were, on average, older (83.3 years) than new-
pathways cohort members who had accessed HACC or VHC services before their reference ACAT assessment (81.6 years). This latter group in turn tended to be older than those who had had no previous care (79.5 years).
• Among people living in the community at the time of their reference assessment, people who had already accessed ACAT-dependent services were less likely to be living alone (43%) than other cohort members. People who had not previously accessed aged care programs were the least likely to be living alone (37%).
• People who had not previously used ACAT-dependent, HACC or VHC programs were more likely than others to need a high priority assessment.
• On average between three and four health conditions were reported as contributing to the care needs of cohort members. The level of co-morbidity was least among cohort members who had not previously used care programs, with this group averaging 3.4 health conditions compared with 3.8 among other new-pathways members and 4.0 for those in the continuing path group.
• People in the continuing path group tended to require assistance with more activities of daily living (ADLs) and instrumental activities of daily living (IADLs) than others. In addition, new-pathways cohort members who had previously used HACC or VHC tended to have more care needs than those who had not, in particular with IADLs.
• Among new-pathways cohort members, those with no previous care were less likely to be recommended to live in permanent residential care than others, particularly for low-level care (20% versus 25%).
• Residential respite care was more often recommended for new-pathways cohort members who had previously used HACC or VHC than for those who had not (69% compared with 54%).
• Among people recommended to live in the community, 48% did not get approval to use any of the ACAT-dependent programs at their reference assessment. However, nearly two thirds of those without any approvals got recommendations for community care programs.

46
• Overall, nearly one quarter of those recommended to live in the community had no community care recommendations. This percentage was much higher among those who had not previously used any care programs: 33% compared with 10–17% for other cohort groups.
• Nearly 60% of the PIAC cohort received approval for at least one care program that required an ACAT assessment. Those with no previous use of care programs were the least likely to get at least one approval (52%). People continuing on their care pathway at the time of the reference assessment were most likely to get one or more approvals—64%, including 26% with an approval for high-level permanent residential care.
Other characteristics of interest include: • The average age of the PIAC cohort was 81.4 years; 15% of the cohort were aged 90 or
over at the reference ACAT assessment. • Just 36% of the PIAC cohort were men. This varied the PIAC group: 31% of the
continuing path cohort were men, compared with 34% of those with HACC or VHC only before the reference assessment, and 41% of those with no previous care.
• New-pathways cohort members who had used VHC had a different demographic profile from other cohort members as a consequence of the eligibility criteria for this program. They were more likely to be male (over 50% versus 36% for the full PIAC cohort), to be aged 80–89 years (70% versus 49%) and to be born in Australia (94% versus 68%), and less likely to be Aboriginal or a Torres Strait Islander (0.1% versus 1.0%).
• Almost 40% of the continuing path cohort were reported as already living in permanent residential care. In all PIAC groups, small proportions of ACAP clients were living in other institutions and supported accommodation.
• Among cohort members living in the community at the reference assessment, nearly 80% had a carer available. Carers were most commonly a spouse (35% of carers) or daughter (also 35%).
• Across the PIAC groups, between 20% and 23% of the cohort had their ACAT reference assessment in hospital.
• The most common health conditions affecting care needs were circulatory system diseases (60% of the cohort), mental disorders (40%, including 27% with dementia), musculoskeletal diseases (42%), and endocrine, nutritional and metabolic disorders (21%). The first three of these were also commonly identified by ACATs as the main health condition impacting on need for assistance (for 22%, 24% and 13% of the cohort, respectively).
A.2 Demographic characteristics
Regional coverage Table A.1 shows the distribution of the PIAC cohort for the states and territories. The absence of Queenslanders and the relatively small number of cohort members from New South Wales reflect the incomplete coverage of ACAP NMDS v2 in 2003–04 (see Appendix B). Use of HACC and VHC prior to the reference ACAT assessment was more prevalent in some jurisdictions than others. In particular, cohort members from New South Wales and the Northern Territory were less likely than others to have used these services:

47
just under 60% of cohort members in these jurisdictions had accessed any care services prior to their reference ACAT assessment, compared with over 70% of clients in the other states and territories (Table A.1).
Sex and age Reflecting the greater longevity of women than men, nearly two-thirds (64%) of the cohort were women (Table A.2). However, as expected, there were relatively more men among people who had used VHC prior to their reference assessment, and they constituted 60% of those who only used VHC services previously (and not HACC).
Overall, women were more likely than men to have previously accessed ACAT-dependent services (28% versus 23%). As a consequence of the differential access to VHC services, men were more likely to have used VHC services prior to accessing ACAP.
Not surprisingly, older clients were more likely than younger clients to have already used ACAT-dependent services at the start of the study period (Table A.3). Almost 22% of cohort members who had accessed ACAT-dependent services prior to their reference assessment were aged 90 or more compared with 11% of the cohort who had not accessed any care programs before their reference assessment. Furthermore, new-pathways cohort members who had accessed HACC or VHC services before their reference ACAT assessment tended to be older than those who had not (64% versus 56%for people aged 80+).
Overall, in the PIAC cohort women tended to be older than the men, again reflecting the greater longevity of women than men (Table A.4, Table A.5). However, among clients who had accessed VHC services before their reference ACAT assessment a larger proportion of women were aged under 80 than men. This is explained by the tendency for men (that is, in this case usually the veteran) to marry women younger than themselves.
Overall, it is estimated that 15% of the PIAC cohort had either a gold or white DVA card. Relatively few people with VHC gold cards had accessed only HACC services prior to their reference assessment, and, as expected, few people reported as having no DVA entitlement were identified as new-pathways cohort members who had used VHC prior to their assessment (Table A.6). While the majority of new-pathways people accessing VHC services were reported as having a DVA entitlement, 12% were not. This, in conjunction with the high rate of missing values, suggests that this data may not be very reliable.
Cultural diversity Indigenous people made up less than 2% of the PIAC cohort (Table A.7). In general, a smaller proportion of Indigenous people had accessed either HACC or VHC before their reference assessment (31% versus 41% for non-indigenous people). In particular, very few Indigenous people had used VHC services (only 14 PIAC cohort members).
The English Proficiency (EP) Groups classification is used to indicate a migrant’s level of English proficiency (Box A.1). People born in Australia and in EP1 countries had similar profiles in terms of previous use of ACAT-dependent programs and other community care (Table A.8). For the other EP groups, decreasing English proficiency was associated with decreasing levels of previous use of care programs: 54% of EP4 cohort members had no previous use of care programs compared with around 30% of those born in Australia or EP1 countries. Analysis by country of birth shows similar results (Table A.9). As expected, only a

48
small proportion of people who used VHC services prior to their reference assessment had been born overseas.
Box A.1: English Proficiency groups
The English Proficiency (EP) Groups classification is used to indicate a migrant’s level of English proficiency using an English proficiency index, the person’s country of birth and the number of that country’s immigrants living in Australia (DIMA 2003). The EP index is defined as the percentage of recent immigrants (those entering in the 5 years before the Census) who speak English only or another language and good English. Good English is defined as those who reported at the Census that they spoke ‘English Only’ or spoke English ‘Very Well’ or ‘Well’. The 2001 English proficiency groups are defined such that: EP1 = All countries rating 98.5% or higher with at least 10,000 residents in Australia EP2 = Countries rating 84.5% or higher on the EP index, other than those in EP1 EP3 = Countries rating 57.5% to less than 84.5% EP4 = Countries rating less than 57.5%. Source: DIMA 2003.
Table A.1: PIAC cohort: state/territory of client usual residence, by PIAC group
HACC and/or VHC before No
previous care
Continuing
path HACC
only VHC only
HACC and VHC Subtotal Total
Row per cent % N
NSW 25.1 28.0 2.1 2.3 32.3 42.5 100.0 32,017
Vic 26.6 39.0 2.3 3.2 44.5 29.0 100.0 41,603
WA 28.0 36.6 2.8 2.8 42.1 29.9 100.0 12,533
SA 25.9 41.8 2.2 2.7 46.8 27.2 100.0 12,054
Tas 27.7 40.9 4.3 4.0 49.2 23.1 100.0 3,953
ACT 25.7 41.8 2.9 3.7 48.3 26.0 100.0 2,033
NT 28.4 29.3 0.7 0.9 30.9 40.7 100.0 700
Total 26.3 35.8 2.4 2.8 40.9 32.8 100.0 . .
Total (number) 27,545 37,502 2,466 2,952 42,920 34,428 . . 104,893
Notes
1. See Box 1.2 for definition of the PIAC groups. Reference date is date of referral to ACAP for first completed ACAT assessment in 2003–04.
2. Implementation of the ACAP NMDS v2 was done on a regional basis, and full implementation was not achieved until October 2005 when Queensland moved to this version of the NMDS. Seventy per cent of all ACAT assessments carried out in 2003–04 were reported using NMDS v2, with all of Queensland and parts of New South Wales being reported using the earlier version (v1) of the NMDS v2 (ACAP NDR 2005).
3. Table excludes 184 cases with a pathway that indicated death before receipt of care (excluding HACC) (see Table C.8)
4. Components may not add to total due to rounding.
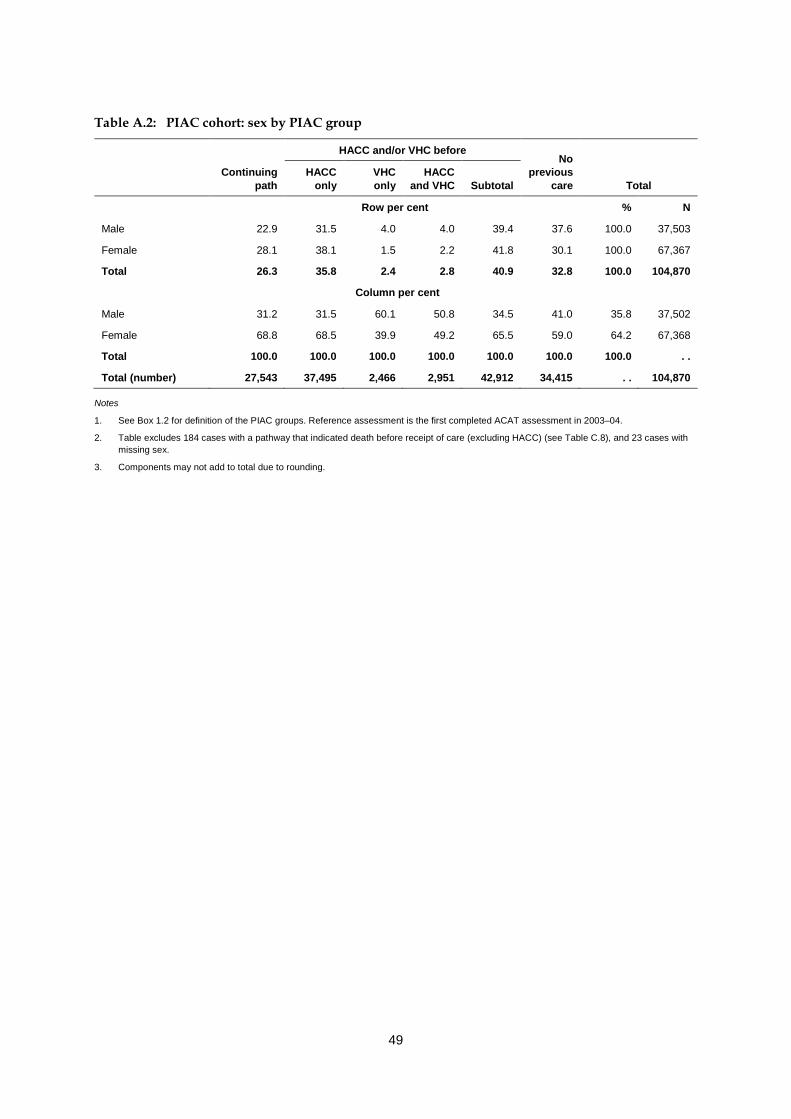
49
Table A.2: PIAC cohort: sex by PIAC group
HACC and/or VHC before No
previous care
Continuing
path HACC
only VHC only
HACC and VHC Subtotal Total
Row per cent % N
Male 22.9 31.5 4.0 4.0 39.4 37.6 100.0 37,503
Female 28.1 38.1 1.5 2.2 41.8 30.1 100.0 67,367
Total 26.3 35.8 2.4 2.8 40.9 32.8 100.0 104,870
Column per cent
Male 31.2 31.5 60.1 50.8 34.5 41.0 35.8 37,502
Female 68.8 68.5 39.9 49.2 65.5 59.0 64.2 67,368
Total 100.0 100.0 100.0 100.0 100.0 100.0 100.0 . .
Total (number) 27,543 37,495 2,466 2,951 42,912 34,415 . . 104,870
Notes
1. See Box 1.2 for definition of the PIAC groups. Reference assessment is the first completed ACAT assessment in 2003–04.
2. Table excludes 184 cases with a pathway that indicated death before receipt of care (excluding HACC) (see Table C.8), and 23 cases with missing sex.
3. Components may not add to total due to rounding.

50
Table A.3: PIAC cohort: client age, by PIAC group
HACC and/or VHC before No
previous care
Age group at date of referral to ACAP
Continuing path
HACC only
VHC only
HACC and VHC Subtotal Total
Row per cent % N
0–49 12.5 31.4 0.1 - 31.5 56.0 100.0 1,052
50–64 19.4 36.5 0.2 0.2 36.9 43.8 100.0 4,641
65–79 21.2 36.8 1.5 1.7 40.1 38.7 100.0 32,682
80–84 23.7 35.3 3.9 4.3 43.5 32.8 100.0 27,193
85–89 30.0 36.3 2.8 3.6 42.6 27.3 100.0 23,980
90+ 38.6 33.6 1.6 2.2 37.4 24.0 100.0 15,334
Total 26.3 35.8 2.4 2.8 40.9 32.8 100.0 104,882
Column per cent
0–49 0.5 0.9 0.0 — 0.8 1.7 1.0 1,052
50–64 3.3 4.5 0.4 0.3 4.0 5.9 4.4 4,641
65–79 25.2 32.1 19.9 19.2 30.5 36.7 31.2 32,682
80–84 23.4 25.6 43.2 39.6 27.6 25.9 25.9 27,193
85–89 26.1 23.2 26.8 29.4 23.8 19.0 22.9 23,980
90+ 21.5 13.7 9.7 11.6 13.4 10.7 14.6 15,334
Total 100.0 100.0 100.0 100.0 100.0 100.0 100.0 . .
Total (number) 27,543 37,501 2,466 2,952 42,919 34,420 . . 104,882
Notes
1. See Box 1.2 for definition of the PIAC groups. Reference date is date of referral to ACAP for first completed ACAT assessment in 2003–04.
2. Table excludes 184 cases with a pathway that indicated death before receipt of care (excluding HACC) (see Table C.8), and 11 cases with missing age.
3. Components may not add to total due to rounding.

51
Table A.4: PIAC cohort: client sex and age, by PIAC group (per cent)
Sex by PIAC group Age at referral date
0–49 50–64 65–79 80–84 85–89 90+ Total Number
Male
Continuing path 0.7 5.4 33.3 22.8 22.5 15.3 100.0 8,600
HACC only before 1.4 6.5 38.1 23.0 19.8 11.3 100.0 11,803
VHC only before — 0.4 17.5 46.8 26.3 9.0 100.0 1,482
HACC and VHC before — 0.3 15.1 43.5 31.0 10.1 100.0 1,500
HACC/VHC subtotal 1.1 5.3 33.7 27.4 21.6 11.0 100.0 14,785
No HACC or VHC before 2.4 8.0 40.2 24.0 16.8 8.6 100.0 14,111
Total 1.5 6.3 36.1 25.1 20.0 11.1 100.0 37,496
Female
Continuing path 0.4 2.3 21.5 23.7 27.8 24.3 100.0 18,941
HACC only before 0.6 3.6 29.3 26.8 24.8 14.9 100.0 25,691
VHC only before 0.1 0.3 23.6 37.9 27.4 10.7 100.0 984
HACC and VHC before — 0.3 23.4 35.5 27.8 13.0 100.0 1,451
HACC/VHC subtotal 0.6 3.3 28.8 27.6 25.0 14.6 100.0 28,126
No HACC or VHC before 1.2 4.4 34.3 27.2 20.6 12.2 100.0 20,296
Total 0.7 3.4 28.4 26.4 24.5 16.6 100.0 67,363
Notes
1. See Box 1.2 for definition of the PIAC groups. Reference assessment is the first completed ACAT assessment in 2003–04.
2. Table excludes 184 cases with a pathway that indicated death before receipt of care (excluding HACC) (see Table C.8), and 34 cases with missing age and/or sex.
3. Components may not add to total due to rounding.

52
Table A.5: PIAC cohort: mean and median age, by sex and PIAC group (years)
HACC and/or VHC before No
previous care
Sex Continuing
path HACC
only VHC only
HACC and VHC Subtotal Total
Mean
Male 81.11 79.56 83.71 84.13 80.44 78.00 79.68
Female 84.32 82.01 83.57 83.82 82.15 80.61 82.30
Total 83.32 81.24 83.65 83.97 81.56 79.54 81.36
Median
Male 82.46 80.98 83.28 83.78 81.89 79.86 81.26
Female 85.40 83.12 83.39 83.62 83.16 81.90 83.34
Total 84.49 82.53 83.33 83.70 82.73 81.11 82.64
Notes
1. See Box 1.2 for definition of the PIAC groups. Reference date is date of referral to ACAP for first completed ACAT assessment in 2003–04.
2. Table excludes 184 cases with a pathway that indicated death before receipt of care (excluding HACC) (see Table C.8), and 34 cases with missing age and/or sex.
Table A.6: PIAC cohort: DVA entitlement status, by PIAC group (per cent)
HACC and/or VHC before No
previous care
Continuing path
HACC only
VHC only
HACC and VHC Subtotal Total
Row per cent % N
DVA gold card 24.8 17.5 14.2 17.1 48.8 26.4 100.0 11,806
DVA white card 25.6 37.2 2.5 5.1 44.8 29.6 100.0 1,033
DVA no card 27.7 25.7 5.1 5.1 35.9 36.5 100.0 4,038
No DVA entitlement 25.7 39.9 0.4 0.4 40.8 33.5 100.0 68,145
Total 25.7 36.1 2.6 3.0 41.7 32.6 100.0 85,022
Column per cent
DVA gold card 13.4 6.7 77.0 78.2 16.2 11.3 13.9 11,806
DVA white card 1.2 1.3 1.2 2.1 1.3 1.1 1.2 1,033
DVA no card 5.1 3.4 9.5 7.9 4.1 5.3 4.7 4,038
No DVA entitlement 80.3 88.6 12.3 11.9 78.4 82.3 80.1 68,145
Total 100.0 100.0 100.0 100.0 100.0 100.0 100 . .
Total (number) 21,823 30,712 2,174 2,582 35,468 27,731 . . 85,022
Notes
1. See Box 1.2 for definition of the PIAC groups. Reference assessment is the first completed ACAT assessment in 2003–04.
2. Table excludes 184 cases with a pathway that indicated death before receipt of care (excluding HACC) (see Table C.8), and 19,871 cases (18.9% of the cohort) with missing DVA entitlement status.
3. Components may not add to total due to rounding.
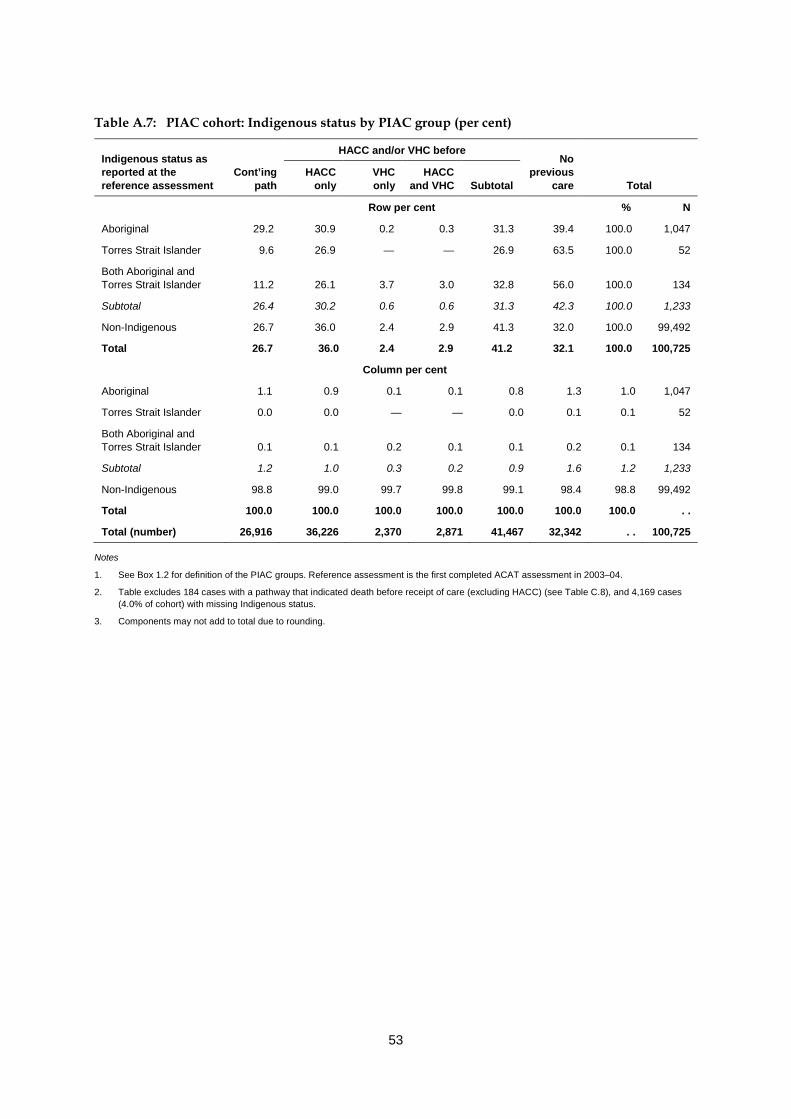
53
Table A.7: PIAC cohort: Indigenous status by PIAC group (per cent)
Indigenous status as reported at the reference assessment
HACC and/or VHC before No
previous care
Cont’ing path
HACC only
VHC only
HACC and VHC Subtotal Total
Row per cent % N
Aboriginal 29.2 30.9 0.2 0.3 31.3 39.4 100.0 1,047
Torres Strait Islander 9.6 26.9 — — 26.9 63.5 100.0 52
Both Aboriginal and Torres Strait Islander 11.2 26.1 3.7 3.0 32.8 56.0 100.0 134
Subtotal 26.4 30.2 0.6 0.6 31.3 42.3 100.0 1,233
Non-Indigenous 26.7 36.0 2.4 2.9 41.3 32.0 100.0 99,492
Total 26.7 36.0 2.4 2.9 41.2 32.1 100.0 100,725
Column per cent
Aboriginal 1.1 0.9 0.1 0.1 0.8 1.3 1.0 1,047
Torres Strait Islander 0.0 0.0 — — 0.0 0.1 0.1 52
Both Aboriginal and Torres Strait Islander 0.1 0.1 0.2 0.1 0.1 0.2 0.1 134
Subtotal 1.2 1.0 0.3 0.2 0.9 1.6 1.2 1,233
Non-Indigenous 98.8 99.0 99.7 99.8 99.1 98.4 98.8 99,492
Total 100.0 100.0 100.0 100.0 100.0 100.0 100.0 . .
Total (number) 26,916 36,226 2,370 2,871 41,467 32,342 . . 100,725
Notes
1. See Box 1.2 for definition of the PIAC groups. Reference assessment is the first completed ACAT assessment in 2003–04.
2. Table excludes 184 cases with a pathway that indicated death before receipt of care (excluding HACC) (see Table C.8), and 4,169 cases (4.0% of cohort) with missing Indigenous status.
3. Components may not add to total due to rounding.

54
Table A.8: PIAC cohort: English proficiency group by PIAC group (per cent)
EP group as derived from country of birth reported at the reference assessment
HACC and/or VHC before
No previous
care
Continuing path
HACC only
VHC only
HACC and VHC Subtotal Total
Row per cent % N
Born in Australia 27.0 35.4 3.1 3.8 42.3 30.7 100.0 71,838
EP1 28.8 39.1 1.0 1.2 41.2 30.0 100.0 11,383
EP2 25.4 37.5 0.1 0.3 37.8 36.8 100.0 5,881
EP3 22.9 35.6 0.1 0.1 35.8 41.3 100.0 11,099
EP4 16.2 29.2 0.2 0.2 29.6 54.2 100.0 493
Total 26.6 35.9 2.3 2.8 41.1 32.3 100.0 100,694
Column per cent
Born in Australia 72.4 70.3 94.6 94.4 73.4 67.9 71.3 71,838
EP1 12.2 12.3 4.7 4.6 11.3 10.5 11.3 11,383
EP2 5.6 6.1 0.3 0.6 5.4 6.7 5.8 5,881
EP3 9.5 10.9 0.4 0.4 9.6 14.1 11.0 11,099
EP4 0.3 0.4 0.0 0.0 0.4 0.8 0.5 493
Total 100.0 100.0 100.0 100.0 100.0 100.0 100.0 . .
Total (number) 26,787 36,199 2,360 2,861 41,420 32,487 . . 100,693
Notes
1. See Box 1.2 for definition of the PIAC groups. Reference assessment is the first completed ACAT assessment in 2003–04.
2. See Box A.1 for definition of the English Proficiency (EP) Groups classification.
3. Table excludes 184 cases with a pathway that indicated death before receipt of care (excluding HACC) (see Table C.8), and 4,200 cases (4.0% of cohort) with missing EP group.
4. Components may not add to total due to rounding.

55
Table A.9: PIAC cohort: country of birth by PIAC group (per cent)
Country of birth reported at the reference assessment
HACC and/or VHC before No
previous care
Continuing path
HACC only
VHC only
HACC and VHC Subtotal Total
Row per cent % N
Australia 27.0 35.4 3.1 3.8 42.3 30.7 100.0 71,865
New Zealand 25.7 33.7 0.9 1.2 35.8 38.5 100.0 561
Other Oceania 20.4 26.7 0.8 2.1 29.6 50.0 100.0 240
United Kingdom/Ireland 29.1 39.5 1.0 1.2 41.6 29.3 100.0 10,297
Europe 24.0 37.6 0.1 0.1 37.8 38.3 100.0 13,086
Asia 22.9 31.4 0.1 0.3 31.8 45.4 100.0 2,708
Other 22.6 34.0 0.1 0.3 34.3 43.1 100.0 1,937
Total 26.6 35.9 2.3 2.8 41.1 32.3 100.0 100,694
Column per cent
Australia 72.5 70.3 94.7 94.5 73.4 67.9 71.4 71,865
New Zealand 0.5 0.5 0.2 0.2 0.5 0.7 0.6 561
Other Oceania 0.2 0.2 0.1 0.2 0.2 0.4 0.2 240
United Kingdom/Ireland 11.2 11.2 4.4 4.2 10.4 9.3 10.2 10,297
Europe 11.7 13.6 0.4 0.5 11.9 15.4 13.0 13,086
Asia 2.3 2.3 0.1 0.3 2.1 3.8 2.7 2,708
Other 1.6 1.8 0.1 0.2 1.6 2.6 1.9 1,937
Total 100.0 100.0 100.0 100.0 100.0 100.0 100.0 . .
Total (number) 26,787 36,199 2,360 2,861 41,420 32,487 . . 100,694
Notes
1. See Box 1.2 for definition of the PIAC groups. Reference assessment is the first completed ACAT assessment in 2003–04.
2. Table excludes 184 cases with a pathway that indicated death before receipt of care (excluding HACC) (see Table C.8), and 4,200 cases (4.0% of cohort) with missing country of birth.
3. Components may not add to total due to rounding.
A.3 Living arrangements
Usual accommodation Almost 40% of people who had used ACAT-dependent programs prior to their first ACAT assessment in 2003–04 were reported as already living in permanent residential care (Table A.10). The majority of these assessments were because all permanent aged care residents up until 30 June 2004 required an ACAT assessment to change from low- to high-care—not just those who were changing care facilities as was the case from 1 July 2004 (AIHW 2005).
As would be expected from their definition, the majority of new-pathways clients were living in their own home at the time of their reference assessment. However, VHC users

56
were more likely than other new-pathways cohort members to be living in a home they owned (75% compared with 69% among those with no previous use of care services), and so were less likely to be renting, either privately or publicly. They were also more likely to be living independently in a retirement village (over 10% among those using VHC compared with 7% among those who had only accessed HACC or no other care prior to their assessment).
In all PIAC groups, small proportions of ACAP clients were living in other institutions and supported accommodation. However, small proportions of new-pathways PIAC cohort members were also reported as usually living in RAC. This discrepancy is a consequence of three factors: • use of unfunded places in Commonwealth-funded RAC facilities • inaccurate reporting of usual residence—estimated at about 1% for those with usual
residence reported as a RAC facility • misidentification of new-pathways clients due to missed links between ACAP and
ACCMIS data sets.
Estimates of the prevalence of unfunded places (see Appendix B) suggest that the first two reasons are likely to be the main causes of this apparent inconsistency.
Carers Among people living in the community at the time of their reference assessment, people who had accessed HACC or VHC services before this assessment were more likely to be living alone than others: 51% of those who had used HACC or VHC services compared with 37% of those with no previous care lived alone (Table A.11). Those who had already accessed ACAT-dependent programs were slightly more likely than others to have a carer (82% compared with 74%–78%) (Table A.12). Note, however, that there is a high rate of missing data for information on carers.
Nearly 60% of carers were co-resident (Table A.13). However, within PIAC groups this percentage ranged from 46% of carers among those who had used both HACC and VHC services before the reference ACAT assessment to 66% co-resident in the continuing path group.
Overall, children of the cohort member accounted for half of the carers, with a further 35% being the spouse of the ACAP client (Table A.14). Reflecting the VHC client base, new-pathways cohort members who had only used VHC before their reference ACAT assessment had the highest proportion of carers who were wives (41% compared with 21% across the cohort) and very few who were husbands (2% compared with 14%). Interestingly, carers of VHC clients who had also accessed HACC services were more commonly offspring than those for people who had only accessed VHC (57% versus 48%). Since VHC provides only a limited number of services, this may indicate that these clients were using HACC services to meet care needs that were being provided for by the wife-carer in the ‘VHC only’ group.
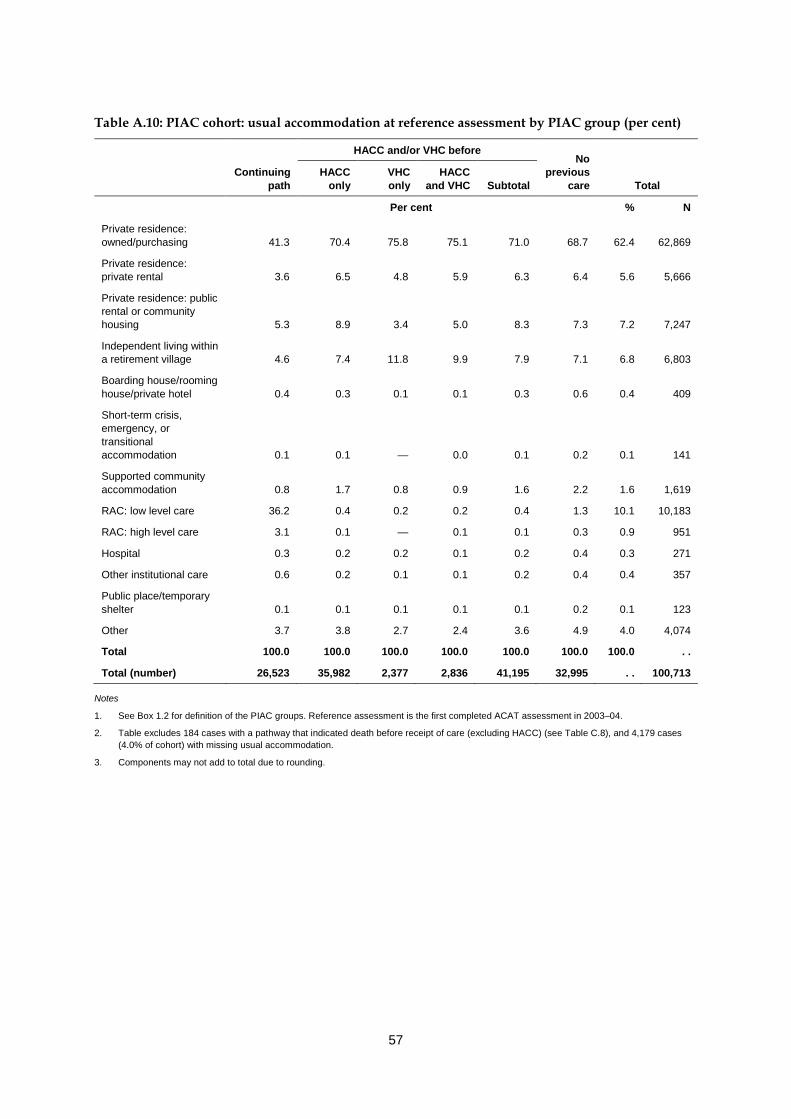
57
Table A.10: PIAC cohort: usual accommodation at reference assessment by PIAC group (per cent)
HACC and/or VHC before No
previous care
Continuing path
HACC only
VHC only
HACC and VHC Subtotal Total
Per cent % N
Private residence: owned/purchasing 41.3 70.4 75.8 75.1 71.0 68.7 62.4 62,869
Private residence: private rental 3.6 6.5 4.8 5.9 6.3 6.4 5.6 5,666
Private residence: public rental or community housing 5.3 8.9 3.4 5.0 8.3 7.3 7.2 7,247
Independent living within a retirement village 4.6 7.4 11.8 9.9 7.9 7.1 6.8 6,803
Boarding house/rooming house/private hotel 0.4 0.3 0.1 0.1 0.3 0.6 0.4 409
Short-term crisis, emergency, or transitional accommodation 0.1 0.1 — 0.0 0.1 0.2 0.1 141
Supported community accommodation 0.8 1.7 0.8 0.9 1.6 2.2 1.6 1,619
RAC: low level care 36.2 0.4 0.2 0.2 0.4 1.3 10.1 10,183
RAC: high level care 3.1 0.1 — 0.1 0.1 0.3 0.9 951
Hospital 0.3 0.2 0.2 0.1 0.2 0.4 0.3 271
Other institutional care 0.6 0.2 0.1 0.1 0.2 0.4 0.4 357
Public place/temporary shelter 0.1 0.1 0.1 0.1 0.1 0.2 0.1 123
Other 3.7 3.8 2.7 2.4 3.6 4.9 4.0 4,074
Total 100.0 100.0 100.0 100.0 100.0 100.0 100.0 . .
Total (number) 26,523 35,982 2,377 2,836 41,195 32,995 . . 100,713
Notes
1. See Box 1.2 for definition of the PIAC groups. Reference assessment is the first completed ACAT assessment in 2003–04.
2. Table excludes 184 cases with a pathway that indicated death before receipt of care (excluding HACC) (see Table C.8), and 4,179 cases (4.0% of cohort) with missing usual accommodation.
3. Components may not add to total due to rounding.

58
Table A.11: PIAC cohort living in the community: living arrangement at reference assessment by PIAC group (per cent)
HACC and/or VHC before No
previous care
Continuing path
HACC only
VHC only
HACC and VHC Subtotal Total
Per cent % N
Lives alone 43.1 50.0 48.2 58.0 50.5 37.1 44.3 38,333
Lives with family 52.9 47.6 50.2 40.3 47.2 59.1 52.5 45,396
Lives with others 4.0 2.4 1.6 1.7 2.3 3.8 3.1 2,707
Total 100.0 100.0 100.0 100.0 100.0 100.0 100.0 . .
Total (number) 15,178 34,863 2,319 2,770 39,952 31,306 . . 86,436
Notes
1. See Box 1.2 for definition of the PIAC groups. Reference assessment is the first completed ACAT assessment in 2003–04.
2. Table excludes 184 cases with a pathway that indicated death before receipt of care (excluding HACC) (see Table C.8), and 6,695 cases (6.4% of cohort) with missing living arrangement.
3. Not applicable cases: 11,762 (11.2%) recorded for people living permanently in RAC, hospitals and other institutional care, and multipurpose services).
4. Components may not add to total due to rounding.
Table A.12: PIAC cohort living in the community: carer availability at reference assessment by PIAC group (per cent)
HACC and/or VHC before No
previous care
Continuing path
HACC only
VHC only
HACC and VHC Subtotal Total
Per cent % N
Carer available 82.4 77.7 77.5 74.7 77.5 78.2 78.6 65,611
Carer not available 17.6 22.3 22.5 25.3 22.5 21.8 21.4 17,868
Total 100.0 100.0 100.0 100.0 100.0 100.0 100.0 . .
Total (number) 14,661 33,884 2,265 2,699 38,848 29,970 . . 83,479
Notes
1. See Box 1.2 for definition of the PIAC groups. Reference assessment is the first completed ACAT assessment in 2003–04.
2. Table excludes 184 cases with a pathway that indicated death before receipt of care (excluding HACC) (see Table C.8), and 9,650 cases (9.2% of cohort) with missing carer availability.
3. Not applicable cases: 11,763 (11.2%, recorded for people living permanently in RAC, hospitals and other institutional care, and multipurpose services).
4. Components may not add to total due to rounding.

59
Table A.13: PIAC cohort living in the community with a carer: carer co-residency at reference assessment by PIAC group (per cent)
HACC and/or VHC before No
previous care
Continuing path
HACC only
VHC only
HACC and VHC Subtotal Total
Per cent % N
Co-resident 60.5 53.4 56.2 45.8 53.0 65.5 58.9 38,357
Non-resident 39.5 46.6 43.8 54.2 47.0 34.5 41.1 26,803
Total 100.0 100.0 100.0 100.0 100.0 100.0 100.0 . .
Total (number) 11,998 26,165 1,749 2,004 29,918 23,244 . . 65,160
Notes
1. See Box 1.2 for definition of the PIAC groups. Reference assessment is the first completed ACAT assessment in 2003–04.
2. Table excludes 184 cases with a pathway that indicated death before receipt of care (excluding HACC) (see Table C.8), and 10,089 cases (9.6% of cohort) with missing carer residency.
3. Not applicable cases: 29,644 (28.3%, recorded for people living permanently in RAC, hospitals and other institutional care, and multipurpose services or for those living in the community without a carer).
4. Components may not add to total due to rounding.

60
Table A.14: PIAC cohort living in the community with a carer: carer relationship at reference assessment by PIAC group (per cent)
HACC and/or VHC before No
previous care
Continuing path
HACC only
VHC only
HACC and VHC Subtotal Total
Per cent % N
Wife 19.2 17.3 41.3 29.4 19.5 24.0 21.1 12,068
Husband 12.1 14.9 1.6 1.4 13.3 15.9 14.0 8,025
Mother 0.6 0.6 — 0.1 0.5 0.6 0.6 323
Father 0.1 0.1 — — 0.1 0.2 0.2 87
Daughter 38.2 35.9 33.1 37.4 35.8 31.2 34.6 19,785
Son 15.9 16.5 14.5 19.1 16.5 14.5 15.7 8,963
Daughter-in-law 2.3 2.4 1.5 2.1 2.3 2.3 2.3 1,306
Son-in-law 0.3 0.2 0.2 0.5 0.2 0.2 0.2 126
Other female relative 5.9 5.8 3.6 4.9 5.6 5.1 5.5 3,129
Other male relative 1.7 2.0 0.8 1.2 1.9 1.8 1.8 1,032
Friend/neighbour female 2.5 3.0 2.3 2.4 3.0 2.6 2.7 1,572
Friend/neighbour male 0.8 1.0 0.8 1.0 1.0 1.1 1.0 564
Private employee 0.6 0.3 0.4 0.3 0.3 0.6 0.5 268
Total 100.0 100.0 100.0 100.0 100.0 100.0 100.0 . .
Total (number) 10,443 22,676 1,559 1,661 25,896 20,909 . . 57,248
Notes
1. See Box 1.2 for definition of the PIAC groups. Reference assessment is the first completed ACAT assessment in 2003–04.
2. Table excludes 184 cases with a pathway that indicated death before receipt of care (excluding HACC) (see Table C.8), and 18,002 cases (17.2% of cohort) with missing carer relationship.
3. Not applicable cases: 29,644 (28.3%, recorded for people living permanently in RAC, hospitals and other institutional care, and multipurpose services or for those living in the community without a carer).
4. Components may not add to total due to rounding.
A.4 Assessment priority and location Overall, for 12% of the cohort the reference assessment was of the highest priority, requiring clinical contact by the ACAT within 48 hours (Table A.15). People who had had no previous use of care programs were slightly more likely to be given high priority than others (14%). In all PIAC groups, around 60% were assessed as requiring clinical contact by an ACAT within 14 days.
There was little variation by PIAC group in the proportion of assessments that occurred in hospital, ranging from 21% among those who had already accessed ACAT-dependent programs to 23% among cohort members with no previous use of care services (Table A.16). For new-pathways cohort members, around 70% of assessments were carried out in ‘other’ settings (predominantly their home in the community). For those continuing their care pathway, almost one-third (32%) of assessments were carried out in a RAC facility and two-fifths (43%) were done at the person’s home in the community.
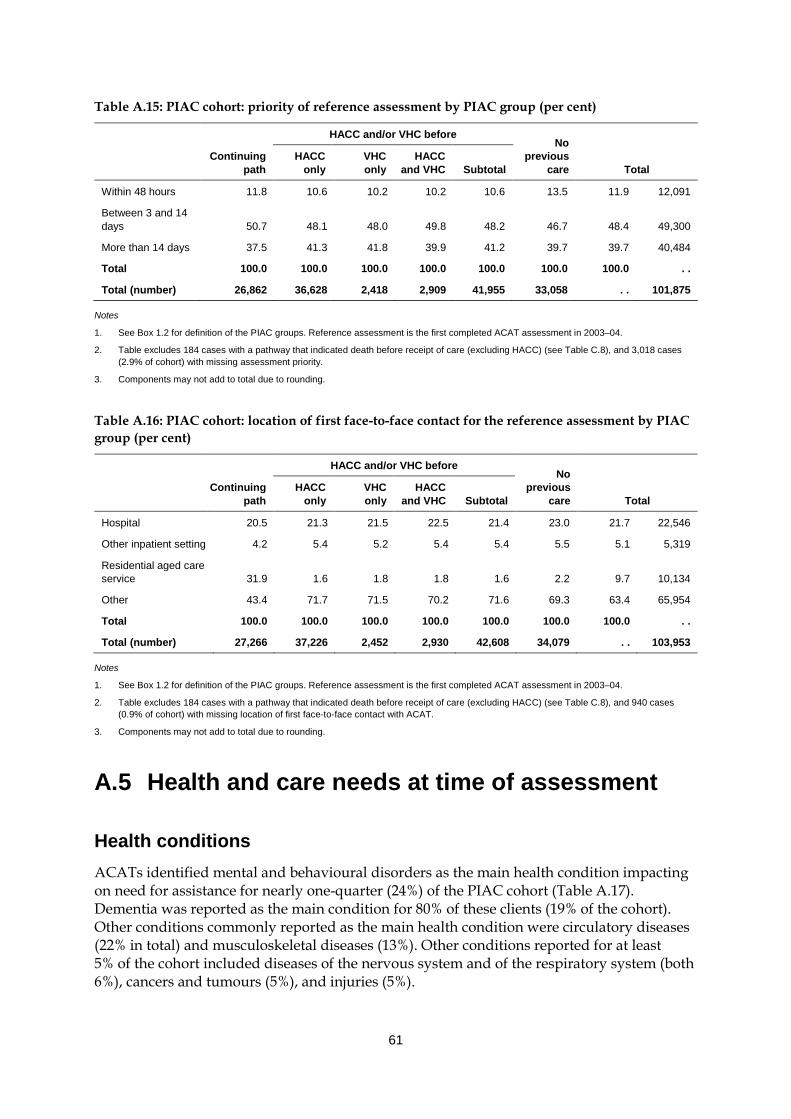
61
Table A.15: PIAC cohort: priority of reference assessment by PIAC group (per cent)
HACC and/or VHC before No
previous care
Continuing path
HACC only
VHC only
HACC and VHC Subtotal Total
Within 48 hours 11.8 10.6 10.2 10.2 10.6 13.5 11.9 12,091
Between 3 and 14 days 50.7 48.1 48.0 49.8 48.2 46.7 48.4 49,300
More than 14 days 37.5 41.3 41.8 39.9 41.2 39.7 39.7 40,484
Total 100.0 100.0 100.0 100.0 100.0 100.0 100.0 . .
Total (number) 26,862 36,628 2,418 2,909 41,955 33,058 . . 101,875
Notes
1. See Box 1.2 for definition of the PIAC groups. Reference assessment is the first completed ACAT assessment in 2003–04.
2. Table excludes 184 cases with a pathway that indicated death before receipt of care (excluding HACC) (see Table C.8), and 3,018 cases (2.9% of cohort) with missing assessment priority.
3. Components may not add to total due to rounding.
Table A.16: PIAC cohort: location of first face-to-face contact for the reference assessment by PIAC group (per cent)
HACC and/or VHC before No
previous care
Continuing path
HACC only
VHC only
HACC and VHC Subtotal Total
Hospital 20.5 21.3 21.5 22.5 21.4 23.0 21.7 22,546
Other inpatient setting 4.2 5.4 5.2 5.4 5.4 5.5 5.1 5,319
Residential aged care service 31.9 1.6 1.8 1.8 1.6 2.2 9.7 10,134
Other 43.4 71.7 71.5 70.2 71.6 69.3 63.4 65,954
Total 100.0 100.0 100.0 100.0 100.0 100.0 100.0 . .
Total (number) 27,266 37,226 2,452 2,930 42,608 34,079 . . 103,953
Notes
1. See Box 1.2 for definition of the PIAC groups. Reference assessment is the first completed ACAT assessment in 2003–04.
2. Table excludes 184 cases with a pathway that indicated death before receipt of care (excluding HACC) (see Table C.8), and 940 cases (0.9% of cohort) with missing location of first face-to-face contact with ACAT.
3. Components may not add to total due to rounding.
A.5 Health and care needs at time of assessment
Health conditions ACATs identified mental and behavioural disorders as the main health condition impacting on need for assistance for nearly one-quarter (24%) of the PIAC cohort (Table A.17). Dementia was reported as the main condition for 80% of these clients (19% of the cohort). Other conditions commonly reported as the main health condition were circulatory diseases (22% in total) and musculoskeletal diseases (13%). Other conditions reported for at least 5% of the cohort included diseases of the nervous system and of the respiratory system (both 6%), cancers and tumours (5%), and injuries (5%).

62
While the distribution of main health condition looks similar across the various PIAC groups, there are some significant differences: • People who had previously used ACAT-dependent services prior to their reference
assessment were more likely than others to have dementia identified as the main health condition: 28% compared with less than 19% for the other groups.
• Heart disease appeared to be a greater cause for increased care needs among veterans than non-veterans. This was identified as the main health condition for 13% of the group who had only used VHC services before their reference ACAT assessment, compared with 10% of those who had only used HACC services before and 8% of the ‘Continuing path’ group. A similar pattern is seen for diseases of the respiratory system (identified for 9% of the people who had previously used VHC services compared with 6% or less for the other groups).
• Musculoskeletal conditions were most common as the main health condition among people who had only used HACC services prior to their 2003–04 assessment (15%), and least common among those continuing on their pathway (11%).
• At 3%, cancers and tumours were least likely to be the main condition impacting on the need for assistance among those already accessing ACAT-dependent programs. Over 5% of other groups had these conditions identified as the main health condition.
The total prevalence of health conditions that were impacting on need for assistance is given in Table A.18. The high proportions for several conditions shows that there are substantial levels of co-morbidity in the cohort, and on average between three and four conditions were reported as contributing to the care needs of cohort members. The level of co-morbidity was lowest among cohort members who had not previously used care programs, with this group averaging 3.4 health conditions compared with 3.7 across the entire PIAC cohort.
The most common conditions affecting care needs were: • circulatory system diseases (60%) • mental disorders, affecting 40% of the cohort (27% with dementia) • musculoskeletal diseases (42%) • endocrine, nutritional and metabolic disorders, present for 21% of the cohort compared
with 4% with this reported as the main condition.
Nearly one-quarter of the cohort (24%) were reported as having ‘Symptoms, signs and abnormal findings not elsewhere classified’ that affected their need for assistance. This suggests that a sizeable minority of cohort members had unidentified health conditions that were affecting their need for assistance.
A number of conditions were fairly common but were unlikely to be the prime reason for the assessment. For example, ear diseases were rarely reported as the main condition (under 1%), but were affecting care needs for 9% of the cohort.
As with main health condition, there are some differences between the PIAC groups in the health conditions overall affecting care needs: • Those continuing on their care pathway at the time of the reference assessment had the
lowest prevalence of cancers and tumours (10%), and those in the ‘VHC only’ group had the highest (17%). The low rate among the ‘Continuing path’ group may result from the relatively short life expectancy of people in residential care with cancer (AIHW: Karmel et al. 2008).

63
• As for main condition, heart disease and respiratory system problems were more common among the ‘VHC only’ new-pathways group than other pathway groups.
• Musculoskeletal conditions were least common, but still highly prevalent, among new-pathways cohort members who had not previously accessed community care— 37% compared with over 44% for other PIAC groups.
• Reflecting to some extent their older age profile, people continuing their care pathway had higher rates of both dementia and other mental disorders: 38% had dementia reported and 21% had other mental disorders compared with 26% and 16% for the group with the next highest rates (people who had not used any care programs prior to their reference assessment).
Care needs Care needs with five activities of daily living (ADLs)—self care, movement activities (such as changing position or manipulating objects), moving around places, communication and health care tasks—are considered during the assessment process. As expected, people already on their care pathway tended to require assistance with more of these activities than others (Table A.19). Just over two-fifths of this group (41%) had four or more activities requiring assistance compared with 20% for those who had not previously used care services. On average those continuing their path needed assistance with 3.0 ADLs compared with 2.0 or fewer for people in the other groups.
Information on five instrumental activities of daily living (IADLs)—transport, social participation activities, domestic assistance, meals and home maintenance—are also reported on the ACAP NMDS for people usually living in the community at the time of assessment. As for ADLs, people who had not previously accessed care services had fewer IADL needs than others: 16% of the ‘No previous care’ group had under four IADL care needs and an average IADL score of 3.4 compared with under 10% for the other PIAC groups and average scores of 3.7 or more (Table A.20).
As part of the ACAT assessment, people are asked about their source of assistance for ADL and IADL care needs. Sources are categorised into formal (assistance provided through government programs, not-for-profit agencies and private for-profit agencies) and informal (family and friends). As expected, people who had not used either HACC, VHC or ACAT-dependent services before their reference assessment were less likely than others to be getting formal assistance with ADL care needs at the time of assessment (22% compared with over 40%) (Table A.21). This group was also more likely to be getting help only from informal sources, with 37% getting assistance only from family and friends compared with 27% of people who had previously accessed HACC and/or VHC services, and 21% who had accessed ACAT-dependent programs. Similar patterns were seen for assistance with IADLs (Table A.22).

64
Table A.17: PIAC cohort: main health condition impacting on need for assistance by PIAC group
Main health condition group
HACC and/or VHC before No
previous care
Continuing path
HACC only VHC only
HACC and VHC Subtotal Total
Per cent % N
1 Infectious and parasitic diseases 0.1 0.2 0.1 0.2 0.2 0.2 0.2 194
2 Neoplasms (cancers and tumours) 3.0 5.4 6.4 6.4 5.5 6.1 5.0 5,157
3 Blood, blood-forming organs and immunological disorders 0.5 0.6 0.8 0.5 0.6 0.5 0.5 525
4 Endocrine, nutritional and metabolic diseases 3.8 4.8 3.5 4.3 4.7 3.9 4.2 4,278
5a Mental/behavioural disorders – dementia 27.6 15.0 15.2 13.6 14.9 18.4 19.4 19,793
5b Mental/behavioural disorders – other 5.0 4.5 3.4 2.7 4.3 5.3 4.8 4,900
5 Mental/behavioural disorders 32.6 19.4 18.6 16.3 19.2 23.7 24.2 24,693
6 Nervous system 6.5 6.6 5.8 5.8 6.5 5.5 6.2 6,311
7 Eye and adnexa 3.0 3.5 2.6 3.9 3.4 2.7 3.1 3,163
8 Ear and mastoid process 0.6 0.8 0.7 0.5 0.8 0.8 0.7 732
9a Circulatory system – heart disease 7.8 9.7 13.0 11.5 10.0 9.0 9.1 9,283
9b Circulatory system – cerebrovascular 9.2 7.4 7.9 7.5 7.5 9.0 8.4 8,598
9c Circulatory system – other 3.7 5.1 4.3 5.5 5.1 5.5 4.9 4,967
9 Circulatory system 20.8 22.2 25.2 24.4 22.5 23.4 22.4 22,848
10 Respiratory system 4.8 6.2 8.9 8.6 6.5 5.2 5.6 5,768
11 Digestive system 0.9 1.3 1.3 1.3 1.3 1.4 1.2 1,235
12 Skin and subcutaneous tissue 0.4 0.6 0.5 0.2 0.6 0.6 0.6 563
13 Musculoskeletal system and connective tissue 11.3 15.1 12.8 14.1 14.9 12.6 13.2 13,472
14 Genitourinary system 1.4 1.6 1.9 2.1 1.7 1.7 1.6 1,648
15 Congenital malformations 0.1 0.1 0.0 — 0.1 0.2 0.1 120
16 Injury, poisoning and other consequences of external causes 4.9 5.2 5.0 4.9 5.1 5.2 5.1 5,220
17 Symptoms, signs and abnormal findings n.e.c. 4.8 5.9 5.3 6.1 5.9 5.7 5.5 5,661
18 Other n.e.s. 0.5 0.6 0.5 0.4 0.6 0.5 0.5 543
Total 100.0 100.0 100.0 100.0 100.0 100.0 100.0 . .
Total (number) 26,880 36,625 2,423 2,918 41,966 33,285 . . 102,131
Notes
1. See Box 1.2 for definition of the PIAC groups. Reference assessment is the first completed ACAT assessment in 2003–04.
2. Table excludes 184 cases with a pathway that indicated death before receipt of care (excluding HACC) (see Table C.8), and 2,762 cases (2.5% of cohort) with no reported health conditions affecting care needs.
3. Components may not add to total due to rounding.

65
Table A.18: PIAC cohort: health conditions impacting on need for assistance within PIAC group (prevalence, as per cent)
Health condition group
HACC and/or VHC before No
previous care
Continuing path
HACC only
VHC only
HACC and
VHC Subtotal Total Per cent % N 1 Infectious and parasitic diseases 0.6 0.7 0.7 0.9 0.7 0.6 0.6 640 2 Neoplasms (cancers and tumours) 10.0 12.0 16.7 15.4 12.5 12.2 11.7 11,969 3 Blood, blood-forming organs and immunological disorders 3.8 3.9 4.4 3.8 3.9 3.4 3.7 3,803 4 Endocrine, nutritional and metabolic diseases 21.3 22.5 20.1 21.2 22.2 19.6 21.1 21,595 5a Mental/behavioural disorders – dementia 38.1 21.6 22.1 20.4 21.5 25.5 27.2 27,764 5b Mental/behavioural disorders – other 20.6 16.1 13.6 12.7 15.7 15.8 17.0 17,400 5 Mental/behavioural disorders 51.6 34.3 32.4 30.4 33.9 37.4 39.7 40,563 6 Nervous system 14.6 13.1 13.0 12.9 13.1 11.3 12.9 13,196 7 Eye and adnexa 19.1 17.5 15.9 18.0 17.4 14.2 16.8 17,150 8 Ear and mastoid process 9.9 9.1 10.3 9.7 9.2 8.2 9.0 9,223 9a Circulatory system – heart disease 32.8 32.2 41.3 38.2 33.2 28.1 31.4 32,070 9b Circulatory system – cerebrovascular 18.4 14.6 16.1 16.9 14.9 15.0 15.8 16,182 9c Circulatory system – other 34.5 35.3 35.2 35.4 35.3 33.5 34.5 35,235 9 Circulatory system 61.6 60.0 65.7 65.6 60.7 56.6 59.6 60,892 10 Respiratory system 15.1 16.4 21.8 20.4 17.0 13.7 15.4 15,757 11 Digestive system 12.3 12.5 14.5 13.0 12.7 11.1 12.1 12,319 12 Skin and subcutaneous tissue 3.2 3.4 4.0 3.2 3.5 2.7 3.1 3,205 13 Musculoskeletal system and connective tissue 44.2 44.7 45.2 47.3 44.9 37.3 42.2 43,132 14 Genitourinary system 12.9 11.4 11.9 13.7 11.6 10.4 11.5 11,795 15 Congenital malformations 0.2 0.2 0.2 0.0 0.2 0.3 0.2 227 16 Injury, poisoning and other consequences of external causes 13.1 12.6 13.1 12.2 12.6 11.2 12.3 12,537 17 Symptoms, signs and abnormal findings n.e.c. 24.4 24.5 22.2 25.1 24.4 21.9 23.6 24,118 18 Other n.e.s. 3.1 3.3 3.8 3.1 3.3 2.7 3.0 3,110 Mean number of reported health conditions (number) 3.99 3.74 3.96 3.91 3.77 3.37 3.70 . .
All 26,880 36,625 2,423 2,918 41,966 33,285 . . 102,131
Notes
1. See Box 1.2 for definition of the PIAC groups. Reference assessment is the first completed ACAT assessment in 2003–04.
2. People may have more than one health condition reported relating to the same health condition group. Only one health condition was reported by Australian Capital Territory ACATs (see Section A.1).
3. Table excludes 184 cases with a pathway that indicated death before receipt of care (excluding HACC) (see Table C.8), and 2,762 cases (2.5% of cohort) with no reported health conditions affecting care needs.

66
Table A.19: PIAC cohort: ADL score at reference assessment by PIAC group (per cent)
ADL score (max=5)
HACC and/or VHC before No
previous care
Continuing path
HACC only
VHC only
HACC and VHC Subtotal Total
Per cent % N
0 6.3 18.7 22.0 18.6 18.9 23.8 17.2 16,993
1 11.8 22.2 23.2 22.7 22.3 22.2 19.5 19,281
2 19.0 21.9 22.1 23.5 22.0 18.9 20.2 19,955
3 21.5 16.6 15.9 17.8 16.7 14.6 17.3 17,045
4 25.8 14.0 12.0 12.9 13.9 12.9 16.7 16,475
5 15.6 6.6 4.8 4.6 6.3 7.5 9.1 9,020
Total 100.0 100.0 100.0 100.0 100.0 100.0 100.0 . .
Total (number) 25,777 35,529 2,345 2,811 40,685 32,307 . . 98,769
Mean score 3.0 2.0 1.9 2.0 2.0 1.9 2.2 . .
Notes
1. See Box 1.2 for definition of the PIAC groups. Reference assessment is the first completed ACAT assessment in 2003–04.
2. ADLs include self care, movement activities, moving around places, communication and health care tasks.
3. Table excludes 184 cases with a pathway that indicated death before receipt of care (excluding HACC) (see Table C.8), and 6,123 cases (5.8% of cohort) with missing ADL data.
4. Components may not add to total due to rounding.
Table A.20: PIAC cohort living in the community: IADL score at reference assessment by PIAC group (per cent)
IADL score (max=5)
HACC and/or VHC before No
previous care
Continuing path
HACC only
VHC only
HACC and VHC Subtotal Total
Per cent % N
0 3.0 3.8 3.2 2.9 3.7 9.1 5.5 4,852
1 2.4 4.9 5.7 4.4 4.9 6.6 5.1 4,465
2 7.4 10.1 11.0 9.2 10.1 11.7 10.2 8,952
3 12.1 15.3 17.1 16.0 15.4 15.2 14.7 12,976
4 28.1 26.9 25.5 26.7 26.8 24.1 26.1 22,956
5 46.9 39.1 37.5 40.7 39.1 33.3 38.4 33,830
Total 100.0 100.0 100.0 100.0 100.0 100.0 100.0 . .
Total (number) 15,851 35,303 2,337 2,799 40,439 31,741 . . 88,031
Mean score 4.0 3.7 3.7 3.8 3.7 3.4 3.7 . .
Notes
1. See Box 1.2 for definition of the PIAC groups. Reference assessment is the first completed ACAT assessment in 2003–04.
2. Table excludes 184 cases with a pathway that indicated death before receipt of care (excluding HACC) (see Table C.8), and 5,456 cases (5.2% of cohort) with missing IADL data.
3. Not applicable cases: 11,405 (10.9%) recorded for people living permanently in RAC, hospitals and other institutional care, and multipurpose services.
4. Components may not add to total due to rounding.

67
Table A.21: PIAC cohort living in the community: source of assistance(a) for ADLs at reference assessment by PIAC group (per cent)
Source of ADL care provision
HACC and/or VHC before No
previous care
Continuing path
HACC only
VHC only
HACC and VHC Subtotal Total
Per cent % N
Formal only 22.4 16.8 17.0 23.2 17.2 10.5 15.8 13,404
Informal only 21.4 27.5 23.0 18.3 26.6 37.3 29.4 24,942
Mixed 35.5 24.2 23.8 28.5 24.5 11.6 22.0 18,628
None 20.8 31.5 36.2 30.0 31.7 40.6 32.8 27,850
Total 100.0 100.0 100.0 100.0 100.0 100.0 100.0 . .
Total (number) 15,495 34,491 2,302 2,771 39,564 29,765 . . 84,824
(a) Source of assistance for ADLs is as reported by the client on the ACAP form. People may get formal assistance from services other than those included in the PIAC project, including private services. In addition, people may be getting HACC services, but not be identified as such through the data linkage due to the incomplete coverage of the HACC NMDS.
Notes
1. See Box 1.2 for definition of the PIAC groups. Reference assessment is the first completed ACAT assessment in 2003–04.
2. Table excludes 184 cases with a pathway that indicated death before receipt of care (excluding HACC) (see Table C.8), and 8,307 cases (7.9% of cohort) with missing source of care.
3. Not applicable cases: 11,762 (11.2%) recorded for people living permanently in RAC, hospitals and other institutional care, and public place.
4. Components may not add to total due to rounding.
Table A.22: PIAC cohort living in the community: source of assistance(a) for IADLs at reference assessment by PIAC group (per cent)
Source of IADL care provision
HACC and/or VHC before No
previous care
Continuing path
HACC only
VHC only
HACC and VHC Subtotal Total
Per cent % N
Formal only 16.8 14.4 17.5 18.7 14.9 9.8 13.4 11,403
Informal only 17.0 23.3 13.8 9.0 21.8 44.7 28.9 24,541
Mixed 55.6 52.5 60.9 65.6 53.9 25.9 44.4 37,664
None 10.6 9.8 7.8 6.7 9.4 19.6 13.2 11,216
Total 100.0 100.0 100.0 100.0 100.0 100.0 100.0 . .
Total (number) 15,495 34,491 2,302 2,771 39,564 29,765 . . 84,824
(a) Source of assistance for IADLs is as reported by the client on the ACAP form. People may get formal assistance from services other than those included in the PIAC project, including private services. In addition, people may be getting HACC services, but not be identified as such through the data linkage due to the incomplete coverage of the HACC NMDS.
Notes
1. See Box 1.2 for definition of the PIAC groups. Reference assessment is the first completed ACAT assessment in 2003–04.
2. Table excludes 184 cases with a pathway that indicated death before receipt of care (excluding HACC) (see Table C.8), and 8,307 cases (7.9% of cohort) with missing source of care.
3. Not applicable cases: 11,762 (11.2%) recorded for people living permanently in RAC, hospitals and other institutional care, and public place.
4. Components may not add to total due to rounding.

68
A.6 Assessment outcomes A completed ACAT assessment results in recommendations for long-term care setting and program support as part of a care plan. Only one long-term care setting can be recommended (either community or residential), but clients can be approved for use of more than one type of care. For example, a client may receive a recommendation for high-level residential care, and be approved to use high-level permanent residential care as well as an EACH package and/or residential respite care. In addition, a client recommended to live long term in the community may be recommended for several care programs.
Differences between recommendations and approvals may arise for three main reasons: • Some approvals are ‘just in case’, where a client may be recommended to live in the
community but is eligible for low-level residential care and approved for this care in case it is required.
• Some approvals are ‘interim until entry to residential care’ support, such as for a client who is recommended to live in residential care but to whom packaged care and residential respite care may be provided in the interim.
• In cases where the assessor and the client do not agree on care needs, approvals may reflect the client’s view, whereas the recommendations reflect the assessor’s view.
Once approval is granted, receiving services is subject to the availability of places and other considerations. Clients can be reassessed within the 12 month period if their care needs or attitudes change to the extent that a different level or type of care is required or desired (ACAP NDR 2006; AIHW 2007b).
Recommendations A high proportion (70%) of people continuing on their pathway were recommended to live long term in RAC (Table A.10). This is to be expected as nearly 40% of these people were already living in residential care. Of those already living in residential care at the time of their first 2003–04 assessment, a large majority (36% out of 39%) were in low-level care. However, the majority of those recommended to live long-term in residential care were recommended for high-level care (49% out of 69%) (Table A.23). This shift reflects the requirement until June 2004 to have an ACAP approval to move from low to high residential care even if staying in the same facility.
Around half of the people in the new-pathways groups had a recommendation for living long term in a private residence. The proportion recommended to live permanently in residential care ranged from 38%, for those with no previous care, to 45% among people who had accessed both HACC and VHC services previously. While there was little difference in the proportion recommended for high care, the proportions recommended to live in low care varied across groups—between 20% and 28%. However, in all groups low-level care was proposed for over half of those recommended to live permanently in residential care.
A recommendation for respite care can only be provided for people recommended to live long term in the community. Among people recommended to live in the community, 69% had a recommendation for use of respite care (Table A.24). Nearly all of these (66% out of 69%) included a recommendation for residential respite care.
A residential respite care recommendation was much more common among those in the community continuing their path (87%) than among other groups, with the lowest

69
recommendation rate observed among those who had not previously used any care programs (54%). This effect is most likely due to the 12 month duration of approvals which results in the need to renew an approval to use residential respite if it is more than a year since approval was given.
If a person is recommended to live in the community, an ACAT can also make recommendations for use of a range of community programs, including those that do not need an ACAT approval for access. Such ‘non-ACAP’ programs include HACC, VHC, Day Therapy, and the National Respite for Carers Program (NRCP). Multiple recommendations can be made.
For all PIAC groups, CACP and HACC were the most commonly recommended community care programs (34% and 38%, respectively, among all people recommended to live in the community) (Table A.25). However, there was considerable variation across the PIAC groups. Just over half (51%) of those who had already accessed ACAT-dependent programs were recommended for a CACP and 28% were recommended for HACC. People who had not previously used care programs were least likely to be recommended for a CACP (27%); however, one-third (32%) got a HACC recommendation. HACC was most commonly recommended to people who had already accessed that program, with 49% getting a recommendation. Not surprisingly, high proportions of those who had already accessed VHC were recommended to use this program (over 50% compared with 7% overall). Carer support services, through NRCP, were recommended for between 14% and 20% of those recommended to live in the community at their reference assessment.
For the PIAC cohort, 23% of those recommended to live in the community had no community care recommendations (Table A.26). This percentage was highest among those who had not previously used any care programs (33%), and lowest for new-pathways cohort members who had already accessed VHC (under 14%). Overall, no government care programs were recommended for almost one-quarter (24%) of the new-pathways cohort recommended to stay living in the community, equating to 14% of the entire new-pathways cohort.
People most commonly had only one recommendation for community care (52% of those eligible) (Table A.26). People already accessing HACC and VHC were more likely than others to have multiple recommendations, with 13% of this group having three or more (compared with 6% across all PIAC groups).
Approvals for program use Before ACAP clients can be given an approval to access a particular program they have to agree to the approval. In addition, clients can be given multiple approvals, including those ‘just in case’ a client needs to access a particular program (for example, residential respite care). Lack of client agreement is the likely cause for the smaller percentage of continuing path group members with an approval for permanent residential care compared with those with a corresponding recommendation: 57% had an approval for permanent residential care compared with 69% recommended to live long term in permanent residential care (Table A.23 and Table A.27). On the other hand, slightly greater percentages of the new-pathways groups were approved for permanent RAC than were recommended to live permanently in this setting.
Looking at the new-pathways groups, approval to use residential respite care varied between 40% and 53% of cohort members. Comparing these numbers with the respite

70
recommendations for those recommended to live long term in the community (over 54%; Table A.24) indicates that people recommended to live in residential care were less likely than others to get an approval for residential respite care. This could either be due to lack of agreement between client and assessment team or due to arrangements being put in place for the client to move directly into permanent residential care.
Around one-fifth of new-pathways group members and 17% of those continuing their pathway were approved for a CACP package (Table A.27). Reflecting the small size of the EACH program in 2003–04 (and noting that EACHD had not yet commenced), few people received an approval for an EACH package at their first assessment in 2003–04 (under 1% of the cohort).
Overall, 59% of the PIAC cohort got approval to use at least one ACAT-dependent care program (Table A.28). Those with no previous history of use of care programs were less likely than others to get approvals, with 52% of this group getting approvals and 48% not. People continuing on their care pathway at the time of the reference assessment were most likely to get at least one approval (64%). However, they were more likely than others to get only one approval, and further analysis showed that 26% of this group got an approval for high-level permanent residential care only compared with less than 9% in the other groups.
Among people recommended to live in the community, 48% did not get approval to use any of the ACAT-dependent programs at their reference assessment (23,778 out of 49,253; Table A.29). However, nearly two-thirds of those without any approvals (63%) got recommendations for community care programs. That some of these people (at least 13%) got recommendations for CACP and/or EACH packages even though they did not get approval reflects the disjuncture between approvals and recommendations caused by the former requiring agreement from the client. HACC use was commonly recommended for people without an approval: HACC was recommended for 52% of those with no approval and just one recommendation (6,051 out of 11,618). People who had not previously used care programs were less likely than others to have any community care recommendations: 52% of this group had community care recommendations compared with over 70% of other new-pathways ACAP clients.

71
Table A.23: PIAC cohort: recommended long-term care setting by PIAC group (per cent)
HACC and/or VHC before No
previous care
Continuing path
HACC only
VHC only
HACC and VHC Subtotal Total
Per cent % N
Private residence 26.9 53.3 51.0 49.5 52.9 55.0 46.8 49,043
Independent living within a retirement village 1.7 3.5 4.9 4.1 3.6 3.4 3.0 3,197
Supported community accommodation 0.7 1.4 1.0 0.7 1.3 1.6 1.2 1,310
RAC: low level 20.4 24.3 26.1 28.2 24.7 20.3 22.1 23,184
RAC: high level 49.2 16.3 16.1 16.6 16.3 17.3 25.2 26,475
Hospital 0.4 0.4 0.4 0.4 0.4 0.8 0.5 543
Other institutional care 0.1 0.1 0.1 - 0.1 0.2 0.1 118
Other 0.7 0.9 0.6 0.5 0.8 1.4 1.0 1,023
Total 100.0 100.0 100.0 100.0 100.0 100.0 100.0 . .
Total (number) 27,545 37,502 2,466 2,952 42,920 34,428 . . 104,893
Notes
1. See Box 1.2 for definition of the PIAC groups. Reference assessment is the first completed ACAT assessment in 2003–04.
2. Table excludes 184 cases with a pathway that indicated death before receipt of care (excluding HACC) (see Table C.8).
3. Components may not add to total due to rounding.
Table A.24: PIAC cohort recommended to live in the community: respite care recommendation by PIAC group (per cent)
HACC and/or VHC before No
previous care
Continuing path
HACC only
VHC only
HACC and VHC Subtotal Total
Recommended for Per cent % N
Residential respite 75.0 60.1 64.5 66.1 60.7 46.5 57.6 27,940
Non-residential respite 1.1 2.2 1.4 2.1 2.1 3.0 2.3 1,097
Both residential and non-residential residential 12.4 8.4 9.2 8.9 8.5 7.6 8.8 4,245
No recommendation 11.5 29.4 24.9 23.0 28.7 42.9 31.3 15,186
Total 100.0 100.0 100.0 100.0 100.0 100.0 100.0 . .
Total (number) 7,608 19,844 1,289 1,500 22,633 18,227 . . 48,468
Notes
1. See Box 1.2 for definition of the PIAC groups. Reference assessment is the first completed ACAT assessment in 2003–04.
2. Table excludes 184 cases with a pathway that indicated death before receipt of care (excluding HACC) (see Table C.8), and 6,106 cases (5.8% of cohort) with missing respite care recommendations.
3. Not applicable cases: 50,321 (48.0%) recorded for people recommended to live permanently in RAC, hospitals and other institutional care.

72
Table A.25: PIAC cohort recommended to live in the community: recommendations for community care programs by PIAC group (per cent)
Community care program
HACC and/or VHC before No
previous care
Continuing path
HACC only
VHC only
HACC and VHC Subtotal Total
Per cent with recommendation within PIAC group % N
CACP 51.1 35.3 28.2 33.5 34.7 27.1 34.2 18,687
EACH 3.5 1.5 0.6 1.1 1.4 0.9 1.6 846
HACC 28.3 49.2 18.3 29.0 46.2 32.0 38.0 20,721
VHC 4.8 2.9 56.0 50.8 9.0 4.9 6.8 3,696
Day therapy 6.0 4.5 3.6 4.8 4.5 3.7 4.4 2,420
NRCP 19.7 16.4 15.5 15.6 16.3 14.8 16.3 8,874
Other 5.9 7.8 8.3 8.3 7.9 8.0 7.6 4,157
Total 8,260 22,114 1,416 1,619 25,149 21,164 . . 54,573
Notes
1. See Box 1.2 for definition of the PIAC groups. Reference assessment is the first completed ACAT assessment in 2003–04.
2. Table excludes 184 cases with a pathway that indicated death before receipt of care (excluding HACC) (see Table C.8), and 4,445 cases (4.2% of cohort) with missing recommendations.
3. Not applicable cases: 50,321 (48.0%) recorded for people recommended to live permanently in RAC, hospitals and other institutional care.
4. ACATs may give more than one recommendation; consequently percentages do not sum to 100.
Table A.26: PIAC cohort recommended to live in the community: number of recommendations for community care programs by PIAC group (per cent)
Number of recommendations for community care programs
HACC and/or VHC before No
previous care
Continuing path
HACC only
VHC only
HACC and VHC Subtotal Total
All people Per cent % N
0 15.9 17.0 13.9 10.6 16.4 33.1 22.8 12,442
1 56.0 55.5 52.3 51.6 55.0 47.6 52.3 28,551
2 21.5 21.2 24.0 25.3 21.6 14.8 18.9 10,333
3 5.8 5.6 8.8 9.6 6.0 3.9 5.2 2,828
4+ 0.8 0.8 0.9 2.9 0.9 0.6 0.8 419
Total 100.0 100.0 100.0 100.0 100.0 100.0 100.0 . .
Total N 8,260 22,114 1,416 1,619 25,149 21,164 . . 54,573
Notes
1. See Box 1.2 for definition of the PIAC groups. Reference assessment is the first completed ACAT assessment in 2003–04.
2. Table excludes 184 cases with a pathway that indicated death before receipt of care (excluding HACC) (see Table C.8), and 4,445 cases (4.2% of cohort) with missing recommendations.
3. Not applicable cases: 50,321 (48.0%) recorded for people recommended to live permanently in RAC, hospitals and other institutional care).
4. Components may not add to total due to rounding.

73
Table A.27: PIAC cohort: approval for ACAT-dependent programs by PIAC group (per cent)
Care type
HACC and/or VHC before No
previous care
Continuing path
HACC only
VHC only
HACC and VHC Subtotal Total
Residential respite care Per cent % N
Low 22.2 35.4 40.4 39.6 36.0 28.8 30.0 27,818
High 15.2 12.3 13.0 12.3 12.4 10.8 12.6 11,695
Not approved 62.6 52.3 46.6 48.1 51.7 60.3 57.4 53,326
Total 100.0 100.0 100.0 100.0 100.0 100.0 100.0 92,839
Permanent residential care
Low 20.2 28.9 32.2 33.9 29.5 23.6 25.0 23,254
High 36.8 14.2 14.7 13.8 14.2 14.3 20.2 18,723
Not approved 43.0 56.9 53.2 52.3 56.4 62.1 54.8 50,862
Total 100.0 100.0 100.0 100.0 100.0 100.0 100.0 92,839
CACP
Approved 16.5 22.0 20.0 20.7 21.8 17.9 19.1 17,733
Not approved 83.5 78.0 80.0 79.3 78.2 82.1 80.9 75,106
Total 100.0 100.0 100.0 100.0 100.0 100.0 100.0 92,839
EACH/multi-purpose approval
EACH Package 0.9 0.7 0.6 0.5 0.7 0.5 0.7 636
Multipurpose service/other 0.4 0.6 0.5 0.3 0.6 0.7 0.5 506
Not approved 98.8 98.7 98.9 99.2 98.7 98.8 98.8 91,697
Total 100.0 100.0 100.0 100.0 100.0 100.0 100.0 92,839
Total (number) 24,420 32,458 2,195 2,621 37,274 31,145 . . 92,839
Notes
1. See Box 1.2 for definition of the PIAC groups. Reference assessment is the first completed ACAT assessment in 2003–04.
2. Table excludes 184 cases with a pathway that indicated death before receipt of care (excluding HACC) (see Table C.8), and 12,054 cases (11.5% of cohort) with missing approvals (note: no approvals were recorded for South Australia).
3. Components may not add to total due to rounding.
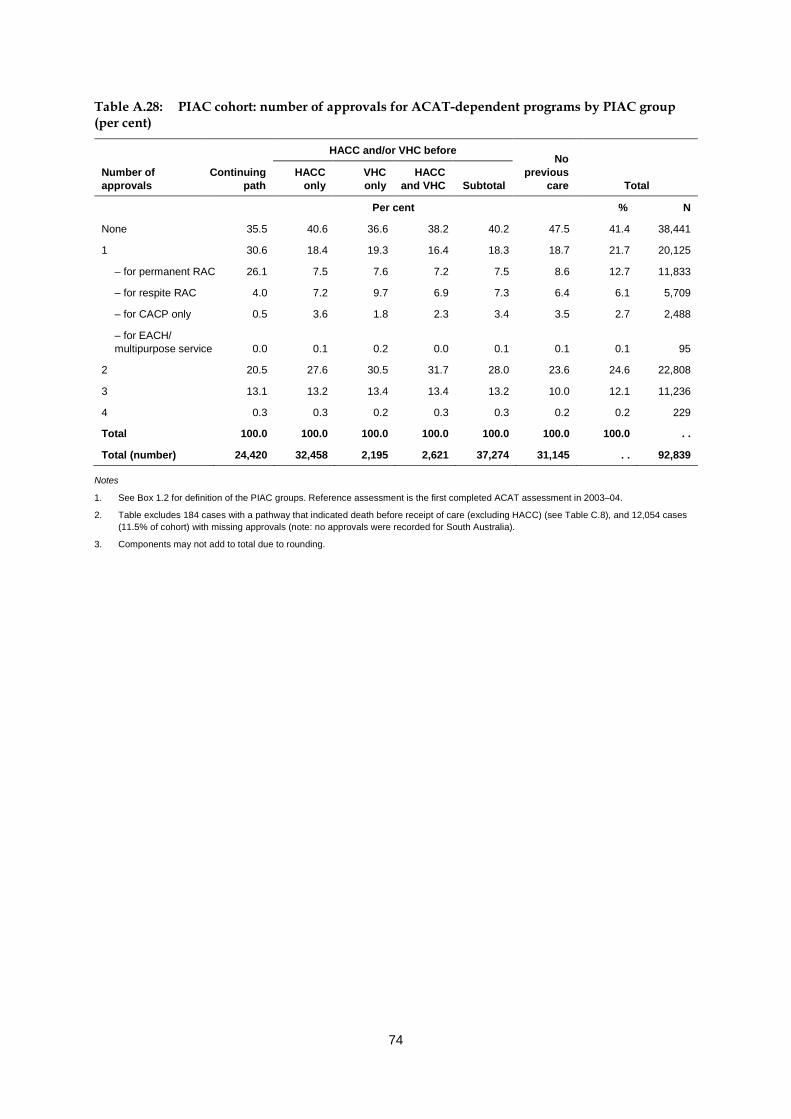
74
Table A.28: PIAC cohort: number of approvals for ACAT-dependent programs by PIAC group (per cent)
Number of approvals
HACC and/or VHC before No
previous care
Continuing path
HACC only
VHC only
HACC and VHC Subtotal Total
Per cent % N
None 35.5 40.6 36.6 38.2 40.2 47.5 41.4 38,441
1 30.6 18.4 19.3 16.4 18.3 18.7 21.7 20,125
– for permanent RAC 26.1 7.5 7.6 7.2 7.5 8.6 12.7 11,833
– for respite RAC 4.0 7.2 9.7 6.9 7.3 6.4 6.1 5,709
– for CACP only 0.5 3.6 1.8 2.3 3.4 3.5 2.7 2,488
– for EACH/ multipurpose service 0.0 0.1 0.2 0.0 0.1 0.1 0.1 95
2 20.5 27.6 30.5 31.7 28.0 23.6 24.6 22,808
3 13.1 13.2 13.4 13.4 13.2 10.0 12.1 11,236
4 0.3 0.3 0.2 0.3 0.3 0.2 0.2 229
Total 100.0 100.0 100.0 100.0 100.0 100.0 100.0 . .
Total (number) 24,420 32,458 2,195 2,621 37,274 31,145 . . 92,839
Notes
1. See Box 1.2 for definition of the PIAC groups. Reference assessment is the first completed ACAT assessment in 2003–04.
2. Table excludes 184 cases with a pathway that indicated death before receipt of care (excluding HACC) (see Table C.8), and 12,054 cases (11.5% of cohort) with missing approvals (note: no approvals were recorded for South Australia).
3. Components may not add to total due to rounding.

75
Table A.29: PIAC cohort recommended to live in the community but who did not get any approvals: number of recommendations for community care programs by PIAC group (per cent)
Number of recommendations for community care programs
HACC and/or VHC before No
previous care
Continuing path
HACC only
VHC only
HACC and VHC Subtotal Total
0 26.3 28.6 25.9 19.4 27.9 47.6 36.9 8,772
1 54.2 55.0 51.1 55.1 54.8 42.2 48.9 11,617
– for CACP 32.1 12.3 8.4 9.6 11.9 7.5 12.1 2,870
– for EACH 2.1 0.7 — 0.2 0.6 0.7 0.8 187
– for HACC 12.7 34.0 9.0 13.9 31.5 22.9 25.4 6,051
– for VHC 1.6 1.5 28.5 26.3 4.5 2.4 3.2 756
– for Day therapy 0.8 1.0 0.6 0.6 1.0 1.1 1.0 236
– for NRCP 2.4 1.9 1.9 1.6 1.9 2.7 2.3 549
– for Other 2.4 3.6 2.7 2.9 3.5 5.0 4.1 968
2 15.9 13.6 18.6 18.4 14.2 8.5 11.7 2,784
3 3.3 2.5 4.0 5.4 2.8 1.7 2.3 552
4+ 0.3 0.2 0.4 1.6 0.3 0.1 0.2 52
Total 100.0 100.0 100.0 100.0 100.0 100.0 100.0
Total N 2,617 8,962 522 624 10,108 11,052 . . 23,777
Total recommended to live in the community 7,430 19,550 1,260 1,452 22,262 19,562 . . 49,254
Notes
1. See Box 1.2 for definition of the PIAC groups. Reference assessment is the first completed ACAT assessment in 2003–04.
2. Table excludes South Australia as no approvals were reported for that state; hence the difference between the bottom row in this table and that in Table A.26.
3. Table excludes 184 cases with a pathway that indicated death before receipt of care (excluding HACC) (see Table C.8), and 9,764 cases (9.3% of cohort) with missing approvals (including 5,319 cases for South Australia).
4. Not applicable cases: 50,321 (48.0%) recorded for people recommended to live permanently in RAC, hospitals and other institutional care.
5. Components may not add to total due to rounding.

76
Appendix B: Data issues
B.1 ACAP The following data quality issues should be noted.
1. Implementation of the ACAP NMDS v2 was done on a regional basis. By 14 July 2003, all jurisdictions except New South Wales and Queensland were reporting on ACAP using NMDS version 2. For the latter two states, implementation was as follows: • New South Wales: progressive implementation from 1st July 2003 to June 2005.
– In June 2004, 36 teams were collecting NMDS v2 and 14 teams were collecting NMDS v1 data.
– In June 2005, all 50 teams were collecting NMDS v2; however, 4 teams still collected some NMDS v1 data during this month.
• Queensland: No NMDS v2 data was collected in 2003–04 or 2004–05. Take up was completed in October 2005. Overall, 70% of all ACAT assessments carried out in 2003–04 were reported at the person-level using NMDS v2, and there was 85% coverage in 2004–05 (ACAP NDR 2005, ACAP NDR 2006).
2. Postcode was not correctly recorded by Northern Territory ACATs in 2003–04 or 2004–05. However, first digit of postcode (‘0’) was sufficiently reliable for identifying Northern Territory clients.
3. Australian Capital Territory ACAT clients in 2003–04 and 2004–05 NMDS v2: • usual accommodation cannot be determined with any certainty from the NMDS as the data were missing or unreliable in that period. This makes it difficult to determine whether a client recommended to residential care was already living in residential care or not. This problem affects analysis rather than data linkage. • place of assessment data are poor • only one health condition was reported.
4. South Australian ACAP data has poor date information, and all approvals (but not recommendations) are missing on the NMDS for 2003–04 and 2004–05. Poor dates could have a small effect on the reliability of links for South Australian data, and will affect the analysis of pathways for South Australian clients in that the order of program use may not always be reliable. Missing approvals data will impinge on the analysis of pathways for South Australian clients.
5. Continence data (as a medical condition) are poor in ACAP NMDS v2. 6. Several data items had high missing value rates for applicable cases for the first
completed assessment in 2003–04: • carer availability (10%) • carer co-residency status (13%) • carer relationship (24%) • DVA entitlement (19%)

77
7. People may access unfunded places in government-funded residential aged care facilities without having an ACAT assessment. These RAC residents do not receive a government RAC subsidy. Stays in RAC associated with unfunded places are not included on the ACCMIS database as this is primarily a subsidy payment system. However, an ACAT assessment is needed before someone in an unfunded place can move into a funded place (that is, receive the subsidy). People in this situation would be reported as usually living in a RAC at the time of their assessment.
Residents in unfunded places are commonly partners of people in funded places, and it is estimated that they number between 1% and 3% of the number of funded places (James Underwood & Associates Pty Ltd 2002). At 30 June 2003 there were just over 151,000 funded RAC places (AIHW 2004), suggesting that there were between 1,500 and 4,500 unfunded places at that time.
B.2 HACC: derivation of periods of use A wide range of services is provided through HACC, and those reported on the HACC NMDS are listed in Table B.1. For the PIAC study, HACC clients were defined as out of scope if they only used assessment and/or case management and/or carer services during the period of interest. In the HACC NMDS carer services include respite care and carer counselling, with the latter only introduced with the implementation of HACC NMDS v2 in 2005–06. These exclusion rules were applied to the quarterly data prior to the linkage process.
The issues The HACC NMDS data in the PIAC project only indicate quarter of use and not specific dates. In addition, just over 80% of HACC agencies participate in the NMDS. Furthermore, some HACC services can be accessed by people on community care packages and some cannot, depending on the package type. Specifically: • Nursing and allied health can be accessed by Community Aged Care Package (CACP)
recipients. • Centre-based day care can be accessed by CACP and EACH(D) package recipients. • Other HACC services should not be accessed by CACP and EACH(D) package
recipients. • HACC services should not be accessed by people living permanently in residential aged
care (RAC).
These issues raise the question of how to present HACC use in the PIAC care pathways. In particular, • How can we tell if HACC services were accessed before or after the first ACAT
assessment when they occurred in the same quarter? • How do we deal with incomplete coverage of the NMDS? • Given the poor service use dates available on the NMDS, how do we allow for
concurrent HACC and community package use in the care pathways?
Based on a range of analyses the following approach has been adopted (AIHW 2009).

78
The approach HACC service events to be used in the presentation of care pathways are given dates that are derived using the following algorithm: 1. Use of HACC services is assumed to be as reported on the NMDS; that is, no adjustment
or imputation is made for agency non-participation. 2. HACC events are initially identified in terms of four service groups:
• Nursing and Allied health services • Centre-based day care • other high-frequency services • low-frequency services.
3. To start with, HACC event start dates are assumed to be the first day of the first quarter of a set of contiguous quarters in which the service group use was identified; end dates are assumed to be the last day of the last quarter in the set.
4. All HACC services are considered to have stopped (or not to have started) when links in the care pathway that indicate the person: • was in permanent RAC, or • had died.
5. For other start and end dates: • Concurrent use of HACC Centre-based day care services and a CACP or EACH package is allowed, and so does not affect HACC event dates. • Concurrent use of HACC Nursing and Allied health services and a CACP is allowed, and so does not affect HACC event dates. • Nursing and Allied health service use is considered to have stopped once a person started on an EACH(D) package, or not to have started until a person ceased using the EACH(D) package. • All other HACC service use is considered to have stopped once a person started on a CACP or EACH(D) package, or not to have started until a person ceased using a CACP or EACH package.
6. To derive HACC events across service groups, derived HACC service group events are combined if they overlap at all. (Note, however, that pathways can also be presented using HACC service group types.)
7. HACC assessment dates and first-ever quarter of HACC use (including HACC services that are out-of-scope for PIAC) are used to identify a ‘first use of HACC’ date and so to indicate whether HACC services were used/approached before the first ACAT assessment started. In cases where no HACC assessment dates were reported for a client on the NMDS and first HACC contact was in the same quarter as the start of the ACAT assessment, it is assumed that the ACAT assessment led to the use of HACC services.
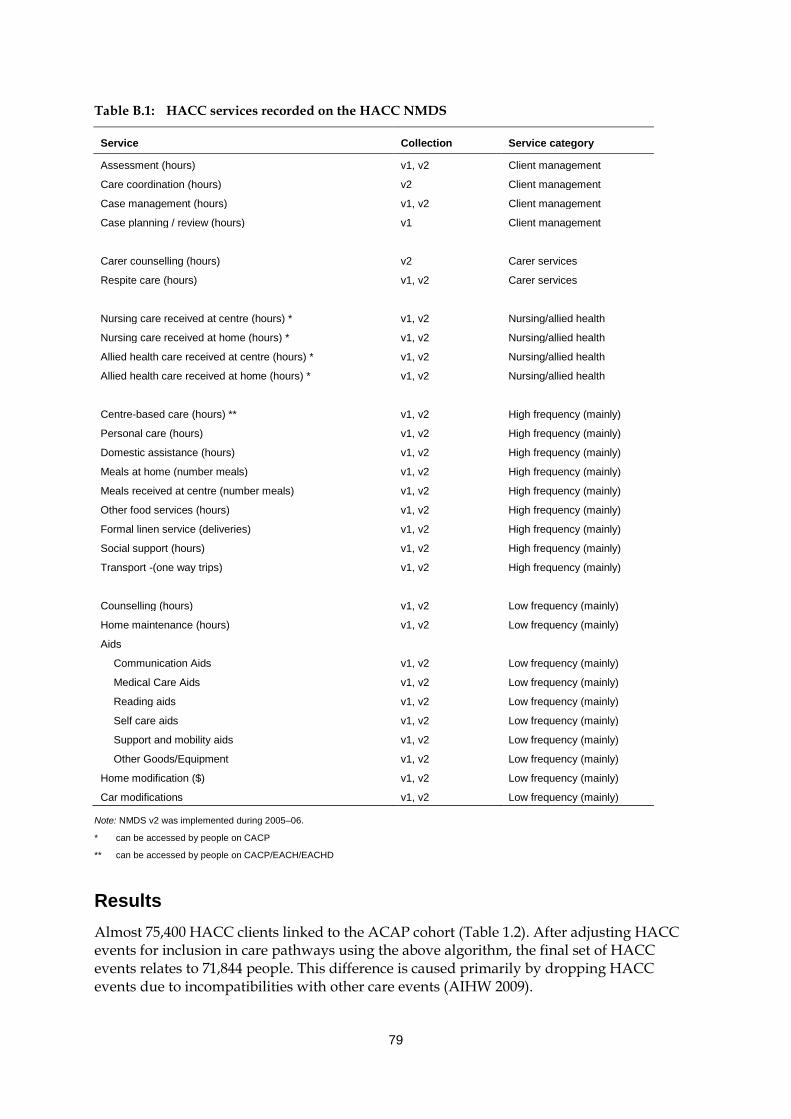
79
Table B.1: HACC services recorded on the HACC NMDS
Service Collection Service category
Assessment (hours) v1, v2 Client management
Care coordination (hours) v2 Client management
Case management (hours) v1, v2 Client management
Case planning / review (hours) v1 Client management
Carer counselling (hours) v2 Carer services
Respite care (hours) v1, v2 Carer services
Nursing care received at centre (hours) * v1, v2 Nursing/allied health
Nursing care received at home (hours) * v1, v2 Nursing/allied health
Allied health care received at centre (hours) * v1, v2 Nursing/allied health
Allied health care received at home (hours) * v1, v2 Nursing/allied health
Centre-based care (hours) ** v1, v2 High frequency (mainly)
Personal care (hours) v1, v2 High frequency (mainly)
Domestic assistance (hours) v1, v2 High frequency (mainly)
Meals at home (number meals) v1, v2 High frequency (mainly)
Meals received at centre (number meals) v1, v2 High frequency (mainly)
Other food services (hours) v1, v2 High frequency (mainly)
Formal linen service (deliveries) v1, v2 High frequency (mainly)
Social support (hours) v1, v2 High frequency (mainly)
Transport -(one way trips) v1, v2 High frequency (mainly)
Counselling (hours) v1, v2 Low frequency (mainly)
Home maintenance (hours) v1, v2 Low frequency (mainly)
Aids
Communication Aids v1, v2 Low frequency (mainly)
Medical Care Aids v1, v2 Low frequency (mainly)
Reading aids v1, v2 Low frequency (mainly)
Self care aids v1, v2 Low frequency (mainly)
Support and mobility aids v1, v2 Low frequency (mainly)
Other Goods/Equipment v1, v2 Low frequency (mainly)
Home modification ($) v1, v2 Low frequency (mainly)
Car modifications v1, v2 Low frequency (mainly)
Note: NMDS v2 was implemented during 2005–06.
* can be accessed by people on CACP
** can be accessed by people on CACP/EACH/EACHD
Results Almost 75,400 HACC clients linked to the ACAP cohort (Table 1.2). After adjusting HACC events for inclusion in care pathways using the above algorithm, the final set of HACC events relates to 71,844 people. This difference is caused primarily by dropping HACC events due to incompatibilities with other care events (AIHW 2009).

80
The adjustments to HACC events resulted in an overall reduction in the number of HACC events by between 3% (Centre-based day care) and 12% (low frequency services) (Table B.2). As would be expected, the number of reductions increased as the number of allowable concurrent program uses decreased. It is thought that this apparent ‘illegal’ use of services could be due to poor data recording practices (e.g. recording a service against the wrong program by service providers who get funding from more than one program), and/or by the use of services in one program when ‘on leave’ from another program (e.g. when on social leave from permanent RAC).
The number of first HACC events with the initial ACAP assessment in the same quarter varied between 7% and 12%, depending on the HACC service group. Overall 8.5% of the adjusted HACC events (9,095 events combined across service groups) had first use of HACC and first ACAT assessment in the same quarter (Table B.2). Using the algorithm described above, it was assumed that the ACAT assessment led to the use of HACC services for 28% of these 9,095 events (2,573 events, Table B.3).
Table B.2: Summary of HACC event adjustments for ACAP cohort, NMDS 2002–03 to 2005–06, clients in PIAC cohort
HACC service group
Nursing/Allied
health High frequency Low frequency Centre-based
day care All combined(a)
N % N % N % N % N %
Events before adjusting 65,461 100.0 80,419 100.0 46,287 100.0 20,889 100.0 . . . .
Adjusted events for pathway 62,831 96.0 72,642 90.3 40,909 88.4 20,209 96.7 107,443 . .
First HACC event in same quarter as first ACAP assessment(b) 7,197 11.5 6,472 8.9 4,249 10.4 1,432 7.1 9,095 8.5
(a) Overlapping HACC events of different types are combined into single HACC events for more general analysis of HACC use in pathways.
(b) Per cent given as per cent of ‘Adjusted events for pathway’.
Table B.3: ‘First seen’ HACC date compared with first ACAP assessment date, PIAC cohort with first HACC and first ACAP event in the same quarter
HACC use/assessment compared with ACAP assessment quarter Number Per cent
Earlier quarter 1,321 14.5
Same quarter
With known assessment date before ACAP assessment 1,655 18.2
With known assessment date same or after ACAP assessment 3,500 38.4
Sub-total 5,155 56.7
With unknown assessment date 2,573 28.3
Total 7,728 85.0
Later quarter 46 0.5
Total 9,095 100.0
Note: ‘First seen’ on HACC includes use of PIAC ‘out-of-scope’ HACC services. HACC assessment date for comparing to ACAP assessment date is derived as the earliest date out of the first HACC assessment date and the last date of first quarter that a client is reported for HACC.

81
B.3 VHC: derivation of periods of use The VHC program provides a limited range of services to help veterans, war widows and widowers with low-level care needs to remain living in their own homes longer. The types of assistance provided through the program are: • Domestic assistance (DA) • Home and garden maintenance (HG) • Transitional home and garden maintenance (HT) provided to clients who transferred
from HACC and so who may have a higher service level entitlement • Personal care (PC): clients with a higher level of need than provided by VHC may be
transferred to DVA community nursing services, so a gap in provision may mean either an improvement or deterioration in health.
• Emergency respite (RE), generally limited to 3 days duration and three episodes a year • In-home respite care (RI): the service limits for this are related to the provision of
residential respite care • Residential respite care (that is, respite RAC).
The data Detailed administrative data on the provision of services through VHC are maintained by the Department of Veterans’ Affairs. Information on client characteristics, assessments for service use, approvals for service provision and actual service provision are collected separately for each of the above service types for each client, except for respite RAC. For this last, VHC data report service plans (thereby indicating approval for use) for care but not the amount of residential respite care received by the client. Since use of respite RAC is incorporated into PIAC using data from ACCMIS this gap affects the care pathways only to the extent that we may not identify that the client accessed RAC via VHC.
The data collected on service provision has two components: • Service plans, or approvals (by service type). For each service plan the data recorded are
– a service plan start, always starting on a Monday – a service plan end date, always finishing on a Sunday – total approved hours.
• Claim data, showing – each date the service was provided – the actual number of hours provided at that visit.
Where a service is provided more than once a day, each attendance has its own claim data.
Comparison of the service plan and claim data show that a client may have approval to receive services but not receive them. In addition, in the VHC data available for PIAC, while the dates of actual service provision were generally within the service plan period, around 7% of provision dates care occurred outside stated service plan dates.

82
Derivation of periods of service provision for PIAC To incorporate the provision of VHC services into the PIAC pathways, it was necessary to combine the above very detailed data on service provision into information on periods of service provision during which the client could be said to have been accessing VHC services. The method used to amalgamate the data on service plans and provision to obtain periods of VHC access was as follows.
For each service type (except respite RAC): 1. Exclude service plans during which there was no associated service provision. 2. Amalgamate service plans directly adjacent (that is, a plan finishing on one day and the
next plan starting on the following day), or overlapping, another. 3. Amalgamate ‘close’ service plans, where two adjacent service plans were said to be
‘close’ if the gap between the end of one service plan and the beginning of the next was less than a specified number of weeks. ‘Close’ (or allowable) gaps were defined as follows: • For DA and PC: ≤ 4 weeks • For RI: ≤ 8 weeks • For HG and HT: ≤ 13 weeks, to allow for people who receive this service once every 3 months • For ER: no amalgamation as this is an emergency service which should not be provided on a regular basis (that is, all gaps retained).
The concept of allowable gaps arose from the common occurrence of a client being given a single instance of service in a service plan that lasted 1 or 2 weeks, followed by a gap and then a similar service plan. Consequently, the person was getting a single instance of service at a regular period, say every 4 or 6 weeks, but associated service plans and provision were not being amalgamated in step 2. The allowable gap to identify ‘close’ service plans was determined separately for each service type by looking at the gap between service plans, the length of service plans, the gap between service provision in adjacent service plans, and the number of times the person received assistance for the service type. 4. Dates of period of use for a particular service type for PIAC were then:
• start date = first service provision date within the combined service plans • end date = last service provision date within the combined service plans.
Periods of use of VHC considering all service types together were derived by amalgamating periods of use with up to a 14 day gap (including overlapping periods, as derived in steps 1 to 4 above) across all service types, and using the first and last service use dates from the resulting combined periods.

83
Results After amalgamation of records into episodes of care using the algorithm described above, the VHC data set contained 228,261 care episodes for 122,447 clients.
Table B.4: Summary of VHC events for PIAC cohort study, VHC January 2001–March 2008
Episodes Clients
Domestic assistance 121,675 106,901
Home and garden maintenance 64,626 38,142
Transitional home and garden maintenance (clients transferred from HACC) 4,530 2,922
Personal care 10,082 9,376
Emergency respite 830 731
In-home respite care 26,518 22,254
All 228,261 122,447

84
Appendix C: Data linkage strategy for the PIAC cohort study5
C.1 Introduction The PIAC cohort study required linking 10 data sets covering six aged care programs and deaths. Data linkage for the PIAC cohort study was undertaken using multiple deterministic match passes in conjunction with an algorithm for identifying suitable match keys and the order in which they should be used. The deterministic match keys were based on (but not limited to) components of the statistical linkage key SLK-581 (consisting of 5 letters of name, date of birth and sex). To meet the conditions of the project’s ethics approvals, this practice was used even when name data were available.
To avoid unnecessary matching processes, a staged approach was employed which progressively linked the data sets two at a time (Figure C.1). Central to this strategy was the recognition that, for the PIAC study, the cohort of interest was those people who had a completed assessment reported on the 2003–04 ACAP NMDS. The order of linking the data sets was based on the availability of additional data for linkage and the quality of the linkage data. For PIAC, there were seven linkage stages in all, with match rates estimated to range from 3% to over 60%, depending on the stage (based on one-step deterministic matching using SLK-581, Table C.1).
C.2 Linkage strategy The stepwise deterministic linkage strategy for each stage consisted of four phases. These are outlined below using Stage 3 to illustrate the processes. Stage 3 matched integrated residential care and community care packages (RCCP) data to the 2003–04 ACAP NMDS (i.e. the PIAC cohort). Simple deterministic matching using SLK-581 showed that at least 64% of the PIAC cohort would link to the RCCP data set (Table C.1).
Phase 1: Client identification within the two data sets Individual clients are identified differently on the various data sets, depending on whether the data set contains an administrative program client identifier (Table C.1). There is no unique program client identifier in the ACAP NMDS, and full name is not recorded. Consequently, distinct clients can only be specified using SLK-581 and other distinguishing variables. Region of usual residence is commonly available and is also useful for distinguishing between individuals. When defining clients with such data there is a trade-off between under-identification and over-identification of individuals. In the PIAC study, a small level of over-identification was preferred to under-identification to avoid identifying people as using services they had not accessed. Accordingly, clients were defined using
5 Much of this discussion is presented in a reduced form in Karmel et al. 2010. It is repeated here in more detail
for completeness.

85
SLK-581 in conjunction with broad region of usual residence (first digit of postcode, corresponding broadly to the six states and the Northern Territory, with postcodes in the Australian Capital Territory grouping with New South Wales).
Stage 1 Linking
PIAC cohort: unlinked
PIAC cohort linking to RCCP
PIAC cohort: ACAP NMDS 2003–04 (with a completed assessment)
Unlinked PIAC cohort, deaths identified
PIAC cohort re-formed
ACAP 2004–05
indicates other data set
PIAC cohort with all links with deaths identified and identifying use of:• RAC• EACH(D)/CACP• HACC/VHC• ACAP
Stage 2 Linking
Stage 3 Linking
Stage 4 Linking
Stage 5 Linking
Stages 6 & 7 Linking
indicates PIAC cohort data set
RAC/EACH(D)
NDI
CACP
UnlinkedNDI records
RCCP
RCCP, deaths identified
PIAC cohort with links from stages
1–5
HACC (4 years separately)
VHC
6a 6b 6c 6d
7
Figure C.1: Linkage stages for PIAC cohort study

86
In the residential care data set and community care packages data set, clients are identified through administrative processes. Occasionally duplicate client records occur (AIHW: Karmel 2005a). Such duplicates were identified using data on name, date of birth and postcode of residence in the community; repeat records were deleted. These two data sets were linked in stage 1.
Table C.1: Linkage stages in the PIAC project
Minimum match rate (from one-step
deterministic linkage on SLK-581)
Final match rate (from stepwise deterministic
linkage)
Stage Data set 1 Data set 2 % data
set 1 % data
set 2 % data
set 1 % data
set 2
1 Residential care 2002–06(a)
Community care packages 2002–06(a) 9.4 44.0 10.2 47.7
2 Deaths July 2003–Dec 2006(a)
RCCP 2002–06(a) (from Stage 1) 32.6 36.9 36.2 41.0
3 PIAC cohort (ACAP 2003–04)(b) RCCP 2002–06 64.4 16.3 72.6 18.4
4
Deaths July 2003–Dec 2006 not linked to RCCP (a)
ACAP 2003–04 not linked to RCCP(b) 3.0 31.4 3.3 34.7
5 PIAC cohort(b)
Aged care assessments 2004–05(b) 29.4 21.8 30.9 22.9
6a PIAC cohort(b) HACC 2002–03(b) 41.6 7.1 46.3 7.9
6b PIAC cohort(b) HACC 2003–04(b) 53.4 8.3 58.5 9.1
6c PIAC cohort(b) HACC 2004–05(b) 35.9 5.3 39.5 6.0
6d PIAC cohort(b) HACC 2005–06(b) 22.8 3.4 26.2 3.9
7 PIAC cohort(b) VHC January 2001 – March 2008(a) 11.4 7.3 12.2 7.8
(a) Clients identified through administrative processes, and de-duplication.
(b) Clients identified by SLK-581 within broad region (1st digit of postcode).
Note: For the data sets with administratively-derived person identifiers, data for all years in the study were linked at the same time. For data sets with clients identified by SLK-581 data were linked for each year separately to allow for variation over time in reported SLK-581.
Phase 2: Identifying data for matching the specific data set pair The data to be used for linking are context-dependent (Table C.5). For Stage 3, three additional variables were identified for matching in addition to SLK-581: • Postcode of usual residence • ACAT assessment date • ACAT id
For ACAP, the postcode reported at the first completed assessment in 2003–04 was used for matching (available for 98% of clients). The ACAP assessment date and ACAT id data related to the same assessment. There are several dates reported on the ACAP NMDS. After some testing, a combination of two dates (delegation date and assessment end date) were

87
used for matching. Assessment end date was available for all ACAP clients and delegation date was available for 63%. The latter was preferred for matching when available.
The RCCP data can contain several postcodes relating to the same client over a year: the postcode of usual residence when on a CACP, the postcode of usual residence before going into RAC and the postcode of any RAC facility the person uses. When linking RCCP to ACAP up to three postcodes were used: the client’s postcode when the client was a CACP recipient, the client’s postcode in the community before entering RAC and the postcode of the RAC facility the client first used as a permanent resident in 2003–04. Not all postcodes were relevant and available for all clients: 99% had at least one community postcode (either for CACP or pre-RAC) and 46% had a postcode relating to a RAC facility. Because ACAP is a gate-keeper program for accessing CACP, EACH(D) and RAC, the community postcode(s) was preferred over that for RAC if both were available.
While ACAP assessments are required to access CACP, EACH(D) and RAC services, they are only required to maintain access in the case of short-term respite RAC. Consequently, only 27% of RCCP clients had an ACAP assessment in 2003–04. Data from the first assessment in 2003–04 on the RCCP data set were used for matching.
Phase 3: Identification of keys to use in matching Within a PIAC linkage stage, match keys were identified for linking by evaluating a large range of keys based on the following key elements: • three letters of surname (s3) in SLK-581 (always together) • two letters of given name (g2) in SLK-581 (always together) • day and month of birth (dmob, always together) • year of birth (yob) • sex (s) • region (using state (st), full four-digit postcode (pc), or first two digits of postcode (pc2)) • additional event date for matching • other additional data for matching.
The specific data used for linking at each stage were context-dependent (Table C.5). As stated above, for Stage 3, the linkage additional data were postcode, ACAT assessment date and ACAT id.
There are many combinations of the key elements that could be used to define match keys. For example, there are 128 possible keys based on the presence or absence of the first six elements above, using the three regional groupings separately (Table C.2). Many of the keys listed in Table C.2 are too broad to be considered for deterministic linking. To select keys to be considered for matching, only keys that were estimated to have fewer than four times as many people with non-unique match keys as there were for SLK-581 were investigated (i.e. duplicate rate of less than 4%, noting that previous analyses indicated that SLK-581 has a duplicate rate of under 1% in aged care programs) (AIHW: Karmel 2005a; AIHW: Ryan et al. 1999). Keys 1 to 20 in Table C.2 met this criterion. Using additional variables increases the number of theoretically possible distinct keys and hence the number of potential match keys that meet this criterion.

88
In the absence of data for clerical review (specifically name data for the NMDSs), the decision on whether a particular match key combination could be used for matching two particular data sets was based on three measures: • Measure A: A measure of discriminating power (termed the joint unique key rate, and
expressed as %). This is the product of the unique key rates for the two data sets being linked, where the unique key rate is the proportion of records within a data set that have a unique value for the key in question. A discriminating power of at least 95.0% was required for the key to be considered for matching, equating to a unique key rate of at least 97.5% within each data set. This measure assumes that rare combinations of variables within a data set are less likely than more common combinations to result in false matches between data sets.
• Measure B: An estimated false match rate (FMR) for links established using the match key. This measure had to be 0.5% or less for a key to be considered for the matching process.
• Measure C: Estimated trade-off between additional true and additional false matches for links established using the match key when compared with matches made by a slightly more precise key. The ratio of additional true to additional false matches had to be at least 2:1 for the key to be used for matching.
All three criteria had to be met by a potential match key for it to be included in the stepwise linking.
The above three measures were calculated prior to full linkage, with the latter two derived by applying the approximation methods outlined in Karmel & Gibson 2007. In the current context, when matching data for programs 1 and 2, FMR was approximated by
FMR = r x P / βα
where:
P is the size of the population (in 1,000s)
r is the usage rate of program 1 as indicated by its data set (per 1,000 people in population P)
α is the proportion of people using program 2 matching to those using program 1 when using a specific match key combination to match
β reflects the number of comparison cells specified by the components of the particular match key being used, allowing for uneven client spread across cells.
The linkage rate α for a specific match key was gauged by using only that key for simple deterministic matching. FMR (measure B) was then derived, which also allowed estimation of the trade-off between true and false matches for a specific match key combination when compared with the results from a more exact key (measure C).
Estimates for the above measures for Stage 3 are presented in Table C.3. For comparative purposes, an estimated ‘worst case’ false match rate is also presented. Overall, 115 match keys were selected to match the RCCP data set to the ACAP NMDS 2003–04, including 19 without ACAP assessment data.

89
Table C.2: Keys based on components of SLK-581 and region
Key no. Key description(a) Key no. Key description(a) Key no. Key description(a)
1 s3g2|dmyob|s|pc 44 s3g2|__yob|s|st 87 _g2|__yob|_|pc2 2 s3g2|dmyob|_|pc 45 _g2|dmyob|s|st 88 __|__yob|_|pc 3 s3g2|dm_ob|s|pc 46 s3_|dm_ob|_|pc2 89 s3g2|___ob|_|_ 4 s3g2|dmyob|s|pc2 47 s3g2|__yob|_|st 90 _g2|dm_ob|_|_ 5 s3_|dmyob|s|pc 48 _g2|dmyob|_|st 91 s3_|_yob|_|_ 6 s3g2|dm_ob|_|pc 49 _g2|__yob|s|pc 92 s3_|___ob|s|pc2 7 s3g2|dmyob|_|pc2 50 s3_|dm_ob|s|st 93 __|dmyob|_|_ 8 s3_|dmyob|_|pc 51 s3g2|__yob|s|_ 94 __|dm_ob|s|pc2 9 s3g2|dmyob|s|st 52 _g2|dmyob|s|_ 95 _g2|__yob|s|st 10 s3g2|dmyob|_|st 53 _g2|__yob|_|pc 96 s3_|___ob|_|pc2 11 s3g2|__yob|s|pc 54 s3_|dm_ob|_|st 97 __|dm_ob|_|pc2 12 _g2|dmyob|s|pc 55 s3g2|__yob|_|_ 98 _g2|__yob|_|st 13 s3g2|dmyob|s|_ 56 s3g2|___ob|s|pc2 99 s3_|___ob|s|st 14 s3g2|__yob|_|pc 57 s3_|___ob|s|pc 100 __|dm_ob|s|st 15 _g2|dmyob|_|pc 58 _g2|dmyob|_|_ 101 _g2|__yob|s|_ 16 s3g2|dmyob|_|_ 59 _g2|dm_ob|s|pc2 102 s3_|___ob|_|st 17 s3g2|dm_ob|s|pc2 60 __|dm_ob|s|pc 103 __|dm_ob|_|st 18 s3_|dm_ob|s|pc 61 s3_|__yob|s|pc2 104 _g2|__yob|_|_ 19 s3_|dmyob|s|pc2 62 __|dmyob|s|pc2 105 _g2|___ob|s|pc2 20 s3g2|dm_ob|_|pc2 63 s3_|dm_ob|s|_ 106 __|___ob|s|pc 21 s3_|dm_ob|_|pc 64 s3g2|___ob|_|pc2 107 __|__yob|s|pc2 22 s3_|dmyob|_|pc2 65 s3_|___ob|_|pc 108 s3_|___ob|s|_ 23 s3g2|dm_ob|s|st 66 _g2|dm_ob|_|pc2 109 __|dm__ob|s|_ 24 s3_|dmyob|s|st 67 __|dm_ob|_|pc 110 _g2|___ob|_|pc2 25 s3g2|dm_ob|_|st 68 s3_|__yob|_|pc2 111 __|___ob|_|pc 26 s3g2|___ob|s|pc 69 __|dmyob|_|pc2 112 __|__yob|_|pc2 27 s3_|dmyob|_|st 70 s3_|dm_ob|_|_ 113 s3_|_ob|_|_ 28 _g2|dm_ob|s|pc 71 s3g2|___ob|s|st 114 __|dm_ob|_|_ 29 s3g2|__yob|2|pc2 72 _g2|dm_ob|s|st 115 _g2|___ob|s|st 30 s3_|__yob|s|pc 73 s3_|__yob|s|st 116 __|__yob|s|st 31 _g2|dmyob|s|pc2 74 __|dmyob|s|st 117 _g2|___ob|_|st 32 __|dmyob|s|pc 75 s3g2|___ob|_|st 118 __|__yob|_|st 33 s3g2|dm_ob|s|_ 76 _g2|dm_ob|_|st 119 _g2|___ob|s|_ 34 s3g2|___ob|_|pc 77 s3_|__yob|_|st 120 __|__yob|s|_ 35 s3_|dmyob|s|_ 78 _g2|___ob|s|pc 121 _g2|___ob|_|_ 36 _g2|dm_ob|_|pc 79 __|dmyob|_|st 122 __|__yob|_|_ 37 s3g2|__yob|_|pc2 80 _g2|__yob|s|pc2 123 __|___ob|s|pc2 38 s3_|__yob|_|pc 81 __|__yob|s|pc 124 __|___ob|_|pc2 39 _g2|dmyob|_|pc2 82 s3g2|___ob|s|_ 125 __|___ob|s|st 40 __|dmyob|_|pc 83 _g2|dm_ob|s|_ 126 __|___ob|_|st 41 s3g2|dm_ob|_|_ 84 s3_|__yob|s|_ 127 __|___ob|s|_ 42 s3_|dmyob|_|_ 85 _g2|___ob|_|pc 128 __|___ob|_|_ 43 s3_|dm_ob|s|pc2 86 __|dmyob|s|_
(a) Key is a concatenation of data elements (see Abbreviations). ‘_’ indicates the element was used, with ‘___ob’ implying no elements of date of birth are included in the key. Key 128 is the null key (i.e. the same value for all records).
Note: Order is from multiplying the number of the largest categories that account for roughly half of the clients within each key element (s3: 204, g2: 20, dmob: 182, yob: 16, s: 1, st: 2, pc2: 8, pc: 290). Key 13 is SLK-581.

90
Table C.3: Criteria for selecting match keys for PIAC Stage 3
Key Linkage key
Joint. unique key rate
(measure A)
(a)Est. number of links
Est. FMR
(measure B)
(b)Comp-arison
key
Marginal true: false
(measure C)
(c)Est. ‘worst case’ FMR
1 s3g2|dmYOB|s|pc 99.999 55631 0.00 701 >1000 0.04 2 s3g2|dmYOB|_|pc 99.957 56120 0.00 702 >1000 0.09 3 s3g2|dm_ob|s|pc 99.878 57047 0.01 703 >1000 0.82 4 s3g2|dmYOB|s|pc2 99.993 63788 0.01 704 >1000 0.55 5 s3_|dmYOB|s|pc 99.896 56819 0.01 705 925.9 0.48 6 s3g2|dm_ob|_|pc 99.878 57547 0.02 706 578.7 1.63 7 s3g2|dmYOB|_|pc2 99.934 64338 0.02 707 592.1 1.09 8 s3_|dmYOB|_|pc 99.896 57326 0.03 708 466.2 0.95 9 s3g2|dmYOB|s|st 99.981 67206 0.04 709 317.7 1.93 10 s3g2|dmYOB|_|st 99.897 67781 0.08 710 159.5 3.82 11 s3g2|__YOB|s|pc 99.715 58484 0.12 711 103.9 15.40 12 _g2|dmYOB|s|pc 99.797 56031 0.14 712 88.2 3.17 13 s3g2|dmYOB|s|_ 99.792 67743 0.17 713 80.7 5.74 14 s3g2|__YOB|_|pc 99.613 59012 0.23 714 51.9 30.52 15 _g2|dmYOB|_|pc 99.707 56541 0.27 715 44.0 6.28 16 s3g2|dmYOB|_|_ 99.650 68327 0.29 716 44.9 10.23 17 s3g2|dm_ob|s|pc2 99.647 65447 0.34 717 36.9 10.16 18 s3_|dm_ob|s|pc 99.478 58319 0.41 718 28.9 8.84 19 s3_|dmYOB|s|pc2 99.583 65185 0.43 719 29.5 5.90 20 s3g2|dm_ob|_|pc2 99.496 66024 0.67 720 18.1 20.14 601 s3g2|dmYOB|s|pc 100.000 44977 0.00 . . . . 0.00 602 s3g2|dmYOB|_|pc 99.998 45392 0.00 601 >1000 0.00 603 s3g2|dm_ob|s|pc 99.998 46105 0.00 601 >1000 0.01 604 s3g2|dmYOB|s|pc2 100.000 51170 0.00 601 >1000 0.00 605 s3_|dmYOB|s|pc 99.992 45855 0.00 601 >1000 0.00 606 s3g2|dm_ob|_|pc 99.998 46529 0.00 603 >1000 0.01 607 s3g2|dmYOB|_|pc2 99.998 51629 0.00 604 >1000 0.01 608 s3_|dmYOB|_|pc 99.992 46276 0.00 602 >1000 0.01 609 s3g2|dmYOB|s|st 100.000 53592 0.00 604 >1000 0.02 610 s3g2|dmYOB|_|st 99.998 54071 0.00 609 >1000 0.03 611 s3g2|__YOB|s|pc 99.976 47166 0.00 601 >1000 0.12 612 _g2|dmYOB|s|pc 99.978 45258 0.00 601 >1000 0.02 613 s3g2|dmYOB|s|_ 100.000 53901 0.00 609 >1000 0.04 614 s3g2|__YOB|_|pc 99.962 47607 0.00 602 >1000 0.23 615 _g2|dmYOB|_|pc 99.976 45678 0.00 612 >1000 0.05 616 s3g2|dmYOB|_|_ 99.998 54382 0.00 613 >1000 0.09 617 s3g2|dm_ob|s|pc2 99.994 52466 0.00 604 >1000 0.08 618 s3_|dm_ob|s|pc 99.986 47016 0.00 606 776.8 0.07 619 s3_|dmYOB|s|pc2 99.968 52178 0.00 604 >1000 0.05 620 s3g2|dm_ob|_|pc2 99.992 52936 0.00 617 772.5 0.16 621 s3_|dm_ob|_|pc 99.935 47445 0.00 618 649.9 0.13 622 s3_|dmYOB|_|pc2 99.938 52643 0.00 619 611.2 0.09 623 s3g2|dm_ob|s|st 99.971 54950 0.00 609 569.9 0.28 624 s3_|dmYOB|s|st 99.946 54654 0.01 609 353.9 0.16 625 s3g2|dm_ob|_|st 99.969 55442 0.01 623 199.4 0.55 626 s3g2|___ob|s|pc 99.942 48638 0.01 611 251.6 2.18
(continued)

91
Table C.3 (continued): Criteria for selecting match keys for PIAC Stage 3
Key Linkage key
Joint. unique key rate
(measure A)
(a)Est. number of links
Est. FMR
(measure B)
(b)Comp-arison
key
Marginal true: false
(measure C)
(c)Est. ‘worst case’ FMR
627 s3_|dmYOB|_|st 99.946 55141 0.01 624 157.7 0.32 628 _g2|dm_ob|s|pc 99.971 46396 0.01 612 173.7 0.45 629 s3g2|__YOB|s|pc2 99.909 53717 0.01 604 367.5 1.48 630 s3_|__YOB|s|pc 99.950 48113 0.02 605 300.2 1.28 631 _g2|dmYOB|s|pc2 99.968 51490 0.02 612 825.8 0.30 632 __|dmYOB|s|pc 99.946 46390 0.02 612 137.2 0.26 633 s3g2|dm_ob|s|_ 99.960 55271 0.02 623 42.6 0.83 634 s3g2|___ob|_|pc 99.821 49083 0.02 626 73.0 4.33 635 s3_|dmYOB|s|_ 99.928 54969 0.02 624 33.2 0.48 636 _g2|dm_ob|_|pc 99.963 46825 0.03 615 87.1 0.90 637 s3g2|__YOB|_|pc2 99.889 54202 0.03 629 69.0 2.93 638 s3_|__YOB|_|pc 99.131 48494 0.03 630 49.7 2.54 639 _g2|dmYOB|_|pc2 99.966 51955 0.03 631 59.0 0.60 640 __|dmYOB|_|pc 99.905 46823 0.04 632 50.5 0.52 641 s3g2|dm_ob|_|_ 99.956 55765 0.04 625 20.9 1.65 642 s3_|dmYOB|_|_ 99.890 55458 0.04 627 16.2 0.96 643 s3_|dm_ob|s|pc2 99.950 53513 0.05 619 55.7 0.85 644 s3g2|__YOB|s|st 99.873 56264 0.10 609 46.8 10.44 645 _g2|dmYOB|s|st 99.926 53926 0.06 631 102.4 1.07 646 s3_|dm_ob|_|pc2 99.876 53988 0.09 622 27.6 1.68 647 s3g2|__YOB|_|st 99.850 56771 0.10 644 >1000 10.35 648 _g2|dmYOB|_|st 99.914 54412 0.12 645 14.5 2.13 649 _g2|__YOB|s|pc 99.833 47462 0.16 612 27.8 8.48 650 s3_|dm_ob|s|st 99.865 56058 0.18 624 13.8 3.00 651 s3g2|__YOB|s|_ 99.749 56590 0.20 613 23.1 15.58 652 _g2|dmYOB|s|_ 99.802 54239 0.23 645 2.3 3.21 653 _g2|__YOB|_|pc 99.783 47907 0.32 649 4.8 16.81 654 s3_|dm_ob|_|st 99.737 56555 0.35 627 6.4 5.95 655 s3g2|__YOB|_|_ 99.696 57098 0.39 651 3.5 30.87 656 s3g2|___ob|s|pc2 99.708 55424 0.40 629 6.9 27.19 657 s3_|___ob|s|pc 99.516 48638 0.49 630 1.3 24.03 658 _g2|dmYOB|_|_ 99.749 54727 0.46 648 0.7 6.35 659 _g2|dm_ob|s|pc2 99.762 52793 0.47 631 4.4 5.63 660 __|dm_ob|s|pc 99.621 47574 0.57 632 3.5 4.85 661 s3_|__YOB|s|pc2 99.491 54798 0.51 629 3.0 15.92 662 __|dmYOB|s|pc2 99.652 54045 0.57 631 7.5 3.18 653 s3_|dm_ob|s|_ 99.612 56395 0.70 635 2.7 8.95 664 s3g2|___ob|_|pc2 99.507 55911 0.79 656 1.2 53.91 701 s3g2|dmYOB|s|pc 100.000 49060 0.00 . . . . 0.00 702 s3g2|dmYOB|_|pc 99.984 49502 0.00 701 >1000 0.00 703 s3g2|dm_ob|s|pc 99.957 50305 0.00 701 >1000 0.04 704 s3g2|dmYOB|s|pc2 99.996 55840 0.00 701 >1000 0.03 705 s3_|dmYOB|s|pc 99.952 50034 0.00 701 >1000 0.02 706 s3g2|dm_ob|_|pc 99.957 50757 0.00 703 >1000 0.07 707 s3g2|dmYOB|_|pc2 99.977 56333 0.00 704 >1000 0.05
(continued)

92
Table C.3 (continued): Criteria for selecting match keys for PIAC Stage 3
Key Linkage key
Joint. unique key rate
(measure A)
(a)Est. number of links
Est. FMR
(measure B)
(b)Comp-arison
key
Marginal true: false
(measure C)
(c)Est. ‘worst case’ FMR
708 s3_|dmYOB|_|pc 99.952 50486 0.00 702 >1000 0.04 709 s3g2|dmYOB|s|st 99.989 58515 0.00 704 >1000 0.09 710 s3g2|dmYOB|_|st 99.965 59029 0.00 709 >1000 0.18 711 s3g2|__YOB|s|pc 99.847 51479 0.00 701 >1000 0.70 712 _g2|dmYOB|s|pc 99.869 49369 0.00 701 152.5 0.14 713 s3g2|dmYOB|s|_ 99.944 58836 0.01 709 144.2 0.26 714 s3g2|__YOB|_|pc 99.792 51951 0.01 702 679.1 1.39 715 _g2|dmYOB|_|pc 99.822 49816 0.01 712 220.5 0.29 716 s3g2|dmYOB|_|_ 99.892 59352 0.01 713 174.0 0.52 717 s3g2|dm_ob|s|pc2 99.855 57266 0.01 704 251.2 0.46 718 s3_|dm_ob|s|pc 99.715 51314 0.01 706 91.6 0.40 719 s3_|dmYOB|s|pc2 99.803 56960 0.01 704 156.5 0.27 720 s3g2|dm_ob|_|pc2 99.796 57771 0.02 717 85.5 0.92 721 s3_|dm_ob|_|pc 99.439 51768 0.02 718 70.7 0.80 722 s3_|dmYOB|_|pc2 99.664 57462 0.03 719 67.8 0.54 723 s3g2|dm_ob|s|st 99.498 60008 0.04 709 64.3 1.64 724 s3_|dmYOB|s|st 99.373 59687 0.05 709 39.8 0.96 725 s3g2|dm_ob|_|st 99.302 60534 0.08 723 21.3 3.25 726 s3g2|___ob|s|pc 97.812 53048 0.11 711 27.0 12.90 727 s3_|dmYOB|_|st 99.373 60209 0.10 724 16.7 1.89 728 _g2|dm_ob|s|pc 97.447 50592 0.13 712 18.5 2.67 729 s3g2|__YOB|s|pc2 98.614 58619 0.11 704 40.9 8.71 730 s3_|__YOB|s|pc 97.447 52448 0.14 705 32.5 7.55 731 _g2|dmYOB|s|pc2 98.211 56141 0.13 712 92.5 1.79 732 __|dmYOB|s|pc 96.954 50577 0.16 712 14.3 1.55 733 s3g2|dm_ob|s|_ 97.874 60336 0.16 725 3.6 4.90 734 s3g2|___ob|_|pc 96.848 53497 0.22 726 6.8 25.58 735 s3_|dmYOB|s|_ 97.451 60014 0.20 724 2.7 2.85 736 _g2|dm_ob|_|pc 96.591 51031 0.25 715 8.7 5.29 737 s3g2|__YOB|_|pc2 98.172 59137 0.23 729 6.8 17.28 738 s3_|__YOB|_|pc 94.249 52722 0.27 730 2.8 15.03 739 _g2|dmYOB|_|pc2 97.611 56634 0.26 731 5.6 3.56 740 __|dmYOB|_|pc 94.810 51033 0.32 732 4.6 3.06 741 s3g2|dm_ob|_|_ 97.126 60864 0.31 725 1.3 9.71 742 s3_|dmYOB|_|_ 95.756 60539 0.39 727 0.9 5.65 743 s3_|dm_ob|s|pc2 96.663 58374 0.40 719 5.3 5.01 744 s3g2|__YOB|s|st 99.453 61421 0.88 709 4.4 61.61 745 _g2|dmYOB|s|st 99.363 58823 0.51 731 10.9 6.35 746 s3_|dm_ob|_|pc2 98.265 58811 0.79 722 2.0 9.95
(a) Estimated number of links was derived from simple deterministic matching on the key (retaining only one occurrence of duplicates).
(b) Comparative linkage key is one which is slightly more detailed and includes all the match key elements of the current key. There is not a strict hierarchy for the linkage keys, so in some cases there may be more than one appropriate key for the comparison.
(c) ‘Worst case’ FMR is estimated assuming that the number of categories within a key element is equal to that implied by the most common category (s3: 72, g2: 11, dmob: 182, yob: 19, s: 2, st: 3, pc2: 11, pc: 156, ACAP date: 161, ACAT id: 25).
Note: Shaded keys are those identified as not selected for use. See note to Table C.2 for definition of keys; ‘600’ series include assessment date; ‘700’ series linkage keys include assessment team identifier. Table only includes keys that were expected to have fewer than four times as many people with non-unique match keys as SLK-581. This equates to key 20 if client region is the only additional match data, key 64 if ACAP date and region are included and key 46 if assessment team identifier and region are included.

93
Phase 4: Stepwise matching using selected match keys Using the selected match keys, stepwise linkage was then carried out, with order of use determined by the discriminating power of the keys (measure A, going from high to low). Variation in match key elements identified through previous stages was also incorporated into match steps where relevant. For Stage 3 this resulted in the use of 215 versions of the 115 selected match keys (Table C.4). All links identified by the selected match keys were accepted as valid, with the exception of duplicate matches. In this case, a match was selected at random.
Overall, 76,289 matches were identified in Stage 3: 60,780 using keys incorporating assessment date, a further 7,255 using keys with assessment team identifier, and 8,254 using keys which did not include assessment data (Table C.3). Under 600 matches (0.8%) were made using keys with an estimated ‘worst case’ FMR of more than 10% (just 15 matches with an estimated ‘worst case’ FMR of more than 20%).
Table C.4: Match results from stepwise matching for PIAC Stage 3
Step Linkage key Matches Step Linkage key Matches Step Linkage key Matches
1 key_601 45,031 73 key_632 252 145 key_717_2 — 2 key_601_2 904 74 key_626 313 146 key_717_3 — 3 key_601_3 1,357 75 key_621 1 147 key_717_4 — 4 key_601_4 26 76 key_622 — 148 key_711 220 5 key_604 5,151 77 key_635 3 149 key_711_2 2 6 key_604_2 99 78 key_635_2 — 150 key_711_3 15 7 key_604_3 — 79 key_645 14 151 key_711_4 2 8 key_604_4 146 80 key_645_2 — 152 key_715 1 9 key_609 2,027 81 key_648 1 153 key_719 18
10 key_609_2 28 82 key_629 258 154 key_719_2 — 11 key_613 257 83 key_629_2 2 155 key_719_3 1 12 key_613_2 3 84 key_629_3 10 156 key_719_4 — 13 key_602 383 85 key_629_4 — 157 key_720 — 14 key_602_2 13 86 key_640 9 158 key_714 6 15 key_602_3 4 87 key_642 1 159 key_718 4 16 key_602_4 — 88 key_637 1 160 key_722 1 17 key_603 883 89 key_646 1 161 key_723 5 18 key_603_2 12 90 key_644 86 162 key_723_2 — 19 key_603_3 19 91 key_644_2 4 163 key_721 1 20 key_603_4 1 92 key_650 8 164 key_724 3 21 key_606 8 93 key_647 1 165 key_724_2 — 22 key_607 36 94 key_649 17 166 key_727 — 23 key_607_2 — 95 key_634 8 167 key_725 — 24 key_607_3 3 96 key_652 7 168 key_729 32 25 key_607_4 — 97 key_652_2 — 169 key_729_2 — 26 key_610 15 98 key_653 — 170 key_729_3 3 27 key_610_2 — 99 key_659 11 171 key_729_4 — 28 key_616 1 100 key_651 15 172 key_731 10 29 key_616_2 — 101 key_651_2 1 173 key_731_2 — 30 key_617 113 102 key_654 4 174 key_731_3 — 31 key_617_2 2 103 key_656 70 175 key_731_4 — 32 key_617_3 6 104 key_655 — 176 key_737 3 33 key_617_4 — 105 key_638 3 177 key_733 —
(continued)

94
Table C.4 (continued): Match results from stepwise matching for PIAC Stage 3
Step Linkage key Matches Step Linkage key Matches Step Linkage key Matches
34 key_605 725 106 key_701 5,176 178 key_733_2 — 35 key_605_2 22 107 key_701_2 111 179 key_726 63 36 key_605_3 30 108 key_701_3 173 180 key_739 3 37 key_605_4 1 109 key_701_4 8 181 key_735 — 38 key_608 6 110 key_704 654 182 key_735_2 — 39 key_620 2 111 key_704_2 16 183 key_728 23 40 key_618 30 112 key_704_3 — 184 key_730 23 41 key_612 227 113 key_704_4 18 185 key_732 37 42 key_612_2 1 114 key_709 237 186 key_734 8 43 key_612_3 7 115 key_709_2 2 187 key_743 21 44 key_612_4 — 116 key_702 30 188 key_736 3 45 key_611 1,697 117 key_702_2 — 189 key_01 5,271 46 key_611_2 13 118 key_702_3 1 190 key_01_2 107 47 key_611_3 52 119 key_702_4 — 191 key_01_3 497 48 key_611_4 1 120 key_707 6 192 key_01_4 18 49 key_615 3 121 key_707_2 — 193 key_04 784 50 key_623 53 122 key_707_3 — 194 key_04_2 12 51 key_623_2 — 123 key_707_4 — 195 key_04_3 29 52 key_628 10 124 key_710 2 196 key_04_4 1 53 key_625 2 125 key_710_2 — 197 key_09 435 54 key_619 100 126 key_703 113 198 key_09_2 5 55 key_619_2 4 127 key_703_2 — 199 key_02 41 56 key_619_3 3 128 key_703_3 2 200 key_07 10 57 key_619_4 — 129 key_703_4 — 201 key_10 8 58 key_631 34 130 key_706 1 202 key_05 164 59 key_631_2 — 131 key_705 105 203 key_08 6 60 key_631_3 1 132 key_705_2 3 204 key_03 120 61 key_631_4 1 133 key_705_3 1 205 key_06 2 62 key_639 — 134 key_705_4 — 206 key_12 68 63 key_636 — 135 key_708 1 207 key_13 153 64 key_614 14 136 key_713 36 208 key_13_2 4 65 key_633 10 137 key_713_2 — 209 key_11 319 66 key_633_2 — 138 key_716 — 210 key_15 14 67 key_641 — 139 key_716_2 — 211 key_16 7 68 key_630 50 140 key_712 34 212 key_17 65 69 key_643 8 141 key_712_2 — 213 key_14 7 70 key_624 42 142 key_712_3 3 214 key_19 68 71 key_624_2 — 143 key_712_4 — 215 key_18 39 72 key_627 2 144 key_717 14
Matches with ACAT date (steps 1-105) 60,780
Matches with ACAT id (steps 106-188) 7,255
Other matches (steps 189-215) 8,254 Total matches 76,289
Legend for linkage key suffixes:
No suffix linkage used preferred RCCP SLK-581 and preferred postcode
_2 linkage used alternative RCCP SLK-581 and preferred postcode
_3 linkage used preferred RCCP SLK-581 and alternative postcode
_4 linkage used alternative RCCP SLK-581 and alternative postcode
Note: See Table A2 for definition of keys. Order of use is based on the joint unique key rate in Table A2. ‘600’ series linkage keys use assessment date, ‘700’ series linkage keys include the assessment team identifier.

95
C.3 Results Match rates between data set pairs varied considerably across the seven stages, ranging from just over 3% to 73% (Table C.5). Not all match keys identify links, and the number of keys used to identify matches (from among all those employed) depended both on the data sets being matched and the availability of data for matching in addition to SLK-581. Across all stages this number ranged from 12 to 160 keys (Table C.5).
Using auxiliary information in the linkage increased the match rate significantly. The proportion of links that had matching SLK-581s varied depending on the data sets being matched and the additional data available, from 90% (as in Stage 3) to just over 97% (Table C.6). Furthermore, between 1.1% and 2.3% of links were between records with incomplete SLK-581 information on ‘data set 1’ in Table C.6. Matches made using previously-identified variations in SLK-581 varied from 0.5% to almost 6% (Table C.6).
Data on region of residence were critical in identifying matches: Overall, 96% or more of matches at all stages could have been made by match keys which only used components of SLK-581 and region of residence. This result reflects the high availability of this data, the strong discriminating power of residence in small regions and the relatively low availability of event data in some of the data sets being compared.
Having event data in conjunction with region data to aid the matching did not necessarily lead to relatively high match rates. For stages which included event data in the matching, the proportion of links that had matching SLK-581s ranged from 90.0% (Stage 2) to 96.9% (Stage 7); for other stages this proportion varied between 90.4% (Stage 4) and 97.4% (Stage 5) (Table C.6).

96
Table C.5: Overview of matching in the PIAC study, by linkage stage
Stage 1 2 3 4 5 6a 6b 6c 6d 7 Data set 1 RAC/EACH
2002-06 NDI
July 03-Dec 06
ACAP 2003-04
NDI unlinked July 03-Dec
06
ACAP 2003-04
ACAP 2003-04
ACAP 2003-04
ACAP 2003-04
ACAP 2003-04
ACAP 2003-04 (with
links) Data set 2 CACP
2002-06 RAC/EACH/CA
CP 2002-06 RAC/EACH/CACP
2002-06 ACAP 2003-04 unlinked
ACAP 2004-05
HACC 2002-03
HACC 2003-04
HACC 2004-05
HACC 2005-06
VHC
Data set size Data set 1 373183 470121 105077 299879 105077 105077 105077 105077 105077 105077 Data set 2 80028 415057 415057 28788 141911 615642 675446 710781 705261 164192 Match keys Additional match variables
● ur community
region
● last ur region
● date of death
● 2003-04 ur community region ● 2003-04 RAC ur
● ACAP date ● ACAT id
● ur region ● ur region ● ur region ● ur region ● ur region ● ur region ● ur region ● date of death
Variation allowed in match keys
S3, G2, sex, yob, dmob
(only separately) if
have pc
S3, G2, sex, yob, dmob, in combinations
if have dod and pc
S3, G2, sex, yob, dmob, in
combinations if have assessment
information and pc
S3, sex, yob, dmob (only
separately) if have pc
S3, G2, sex, yob,
dmob (only separately)
if have pc
S3, G2, sex, yob, (only
separately) if have pc
S3, G2, sex, yob, (only
separately) if have pc
S3, G2, sex, yob, (only
separately) if have pc
S3, G2, sex, yob, (only
separately) if have pc
S3, G2, sex, yob, dmob, in
combinations if have dod and
pc Number of keys used in linkage (with variations(a))
16 47 (128) 115 (215) 12 17 (50) 12 (57) 12 (57) 12 (57) 12 (57) 75 (208)
Number of keys making matches, with variations(a)
16 64 160 12 40 16 29 27 12 40
Total matches 38154 170242 76289 9983 32443 48604 61447 41483 27500 12827 Match rate(b) Data set 1 10.2 36.2 72.6 3.3 30.9 46.3 58.5 39.5 26.2 12.2 Data set 2 47.7 41.0 18.4 34.7 22.9 7.9 9.1 6.0 3.9 7.8
(a) Includes keys using alternative SLK-581 or postcode information obtained through previous linkage stages, where available.
(b) Denominator in the match rate includes people in regions not included in the ACAP NMDS version 2. These regions, covering all of Queensland and the areas of New South Wales assessed by 14 out of the 50 ACATs operating in New South Wales, accounted for 30% of all assessments in 2003-04. Consequently, match rates understate the use of ACAP by people using the other service. For ACAP 2004-05, the proportion of assessments not included in Version 2 dropped to 15%.
Note: Table includes people of all ages using services.

97
Table C.6: Overview of link quality in the PIAC study, by linkage stage
Stage 1 2 3 4 5 6a 6b 6c 6d 7
Data set 1
RAC/ EACH(D) 2002-06
NDI July 03-Dec
06 ACAP
2003–04 NDI unlinked
July 03-Dec 06 ACAP
2003–04 ACAP
2003–04 ACAP
2003–04 ACAP
2003–04 ACAP
2003–04 ACAP
2003–04
Data set 2 CACP
2002-06 RCCP 2002-06 RCCP 2002-
06 ACAP 2003–
04 unlinked ACAP
2004–05 HACC
2002-03 HACC
2003–04 HACC
2004–05 HACC
2005–06
VHC up to Feb.
2008
Matches To cases with duplicate match key on either data set (max %) 0.01 0.04 0.01 0.10 0.02 0.08 0.08 0.10 0.12 0 To match keys using identified SLK-581 variations (%links) n.a. (a)0.3 (a)2.1 n.a. 2.4 4.4 3.8 3.7 3.3 5.8 To match keys using identified postcode variations (% links) n.a. 1.3 2.9 n.a. 0.7 0.5 0.4 0.7 1.1 13.7 Matches made requiring stage-specific data(a) (%) n.a. 4.1 2.0 n.a. n.a. n.a. n.a. n.a. n.a. 0.5 Using first (most detailed) match key (%) 74.6 43.8 59.0 65.1 84.0 72.8 79.0 80.4 75.8 27.4 Match on SLK-581(b) (%) 92.4 90.0 90.2 90.4 97.4 94.0 94.9 93.9 91.6 96.9 With ‘complete’ SLK-581 in data set 1(c) 98.7 97.7 98.3 98.5 98.5 98.8 98.7 98.7 98.6 98.9 With discriminating power ε (0.9985, 1.0] 100.0 99.5 99.6 100.0 99.3 94.0 94.9 93.9 91.6 100.0
(a) Includes event dates and non-region data
(b) Includes cases with identified SLK-581 and/or postcode variations.
(c) A ‘complete’ SLK-581 had no missing data and a date of birth not based on 1 January or 1 July.
Note: Table includes people of all ages using services.

98
C.4 Validation The quality of the linkage depends both on the quality of the data used to establish matches and on the ability of these data to distinguish between individuals. In the results below, the quality of the data used in the linkage is examined. Measures of link quality are then examined, both through match characteristics and validation checks.
Quality of match data The presence of missing data reduces the likelihood of identifying true matches. The number of missed matches will also be relatively high if there are unreliable data on one of the data sets. However, if both data sets being matched have similar processes for recording poor information (e.g. recording dates of birth as 1 January of the year derived from current age) then the likelihood of making false matches increases.
Reliable SLK-581 data were available for over 94% of client records for all data sets in the study (counting 1 January and 1 July dates of birth as possibly unreliable) (Table C.7). The NMDSs tended to have less reliable SLK-581 data (94%–98% reliable) than the administrative data sets (>97.6%). Poor date of birth data were more common than missing name or sex data. The variability of data quality over time even within data collections is illustrated by the ACAP and HACC NMDS data.
In all data sets, over 99% of client records with both complete name data and date of birth data (not 1 January) had a unique SLK-581 (Table C.7). This result for data sets with administratively-derived client identifiers indicates once again that SLK-581 distinguishes well between individuals when complete data are available.
The availability of additional data (i.e. other than SLK-581) varied depending on the data set and data item (Table C.7). For example, for Stage 3, less than 2% of records had missing postcode in either data set. ACAP assessment date and team data were available for all clients on the 2003–04 ACAP NMDS. On the other hand, many RCCP clients did not have an ACAP assessment in 2003-04, and so these data were available for just 27% of all RCCP clients.
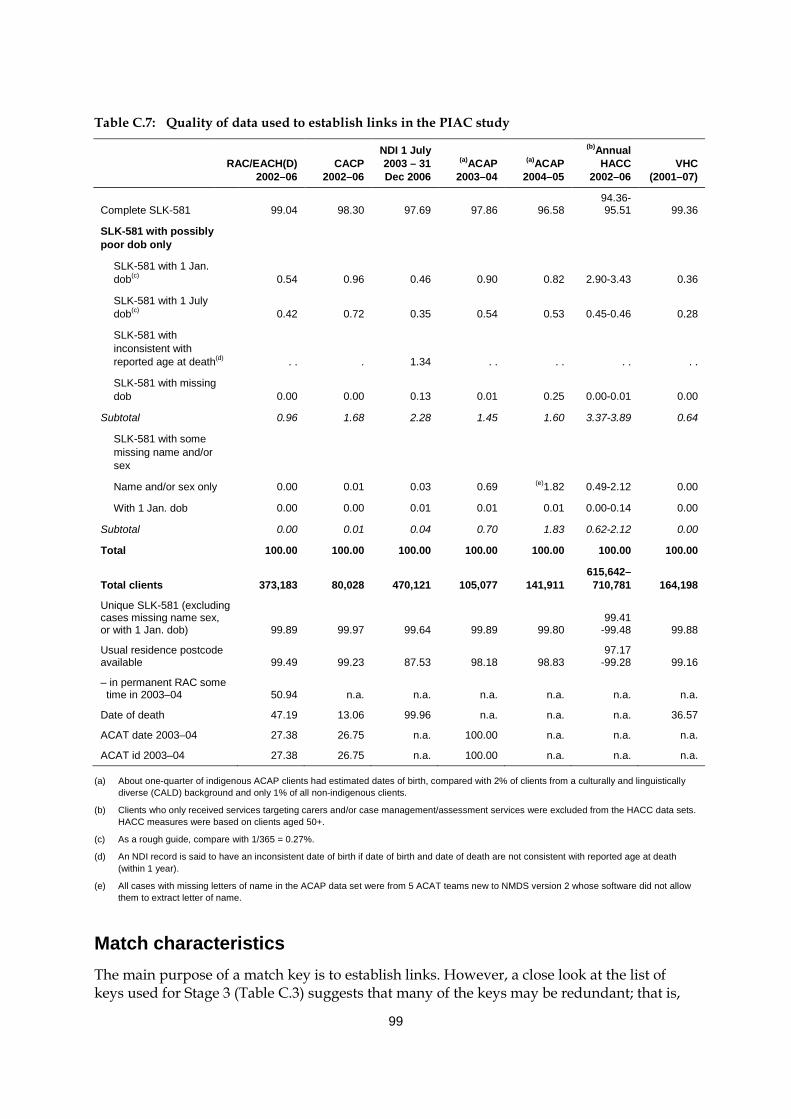
99
Table C.7: Quality of data used to establish links in the PIAC study
RAC/EACH(D)
2002–06 CACP
2002–06
NDI 1 July 2003 – 31 Dec 2006
(a)ACAP 2003–04
(a)ACAP 2004–05
(b)Annual HACC
2002–06 VHC
(2001–07)
Complete SLK-581 99.04 98.30 97.69 97.86 96.58 94.36-95.51 99.36
SLK-581 with possibly poor dob only
SLK-581 with 1 Jan. dob(c) 0.54 0.96 0.46 0.90 0.82 2.90-3.43 0.36
SLK-581 with 1 July dob(c) 0.42 0.72 0.35 0.54 0.53 0.45-0.46 0.28
SLK-581 with inconsistent with reported age at death(d) . . . 1.34 . . . . . . . .
SLK-581 with missing dob 0.00 0.00 0.13 0.01 0.25 0.00-0.01 0.00
Subtotal 0.96 1.68 2.28 1.45 1.60 3.37-3.89 0.64
SLK-581 with some missing name and/or sex
Name and/or sex only 0.00 0.01 0.03 0.69 (e)1.82 0.49-2.12 0.00
With 1 Jan. dob 0.00 0.00 0.01 0.01 0.01 0.00-0.14 0.00
Subtotal 0.00 0.01 0.04 0.70 1.83 0.62-2.12 0.00
Total 100.00 100.00 100.00 100.00 100.00 100.00 100.00
Total clients 373,183 80,028 470,121 105,077 141,911 615,642–710,781 164,198
Unique SLK-581 (excluding cases missing name sex, or with 1 Jan. dob) 99.89 99.97 99.64 99.89 99.80
99.41 -99.48 99.88
Usual residence postcode available 99.49 99.23 87.53 98.18 98.83
97.17 -99.28 99.16
– in permanent RAC some time in 2003–04 50.94 n.a. n.a. n.a. n.a. n.a. n.a.
Date of death 47.19 13.06 99.96 n.a. n.a. n.a. 36.57
ACAT date 2003–04 27.38 26.75 n.a. 100.00 n.a. n.a. n.a.
ACAT id 2003–04 27.38 26.75 n.a. 100.00 n.a. n.a. n.a.
(a) About one-quarter of indigenous ACAP clients had estimated dates of birth, compared with 2% of clients from a culturally and linguistically diverse (CALD) background and only 1% of all non-indigenous clients.
(b) Clients who only received services targeting carers and/or case management/assessment services were excluded from the HACC data sets. HACC measures were based on clients aged 50+.
(c) As a rough guide, compare with 1/365 = 0.27%.
(d) An NDI record is said to have an inconsistent date of birth if date of birth and date of death are not consistent with reported age at death (within 1 year).
(e) All cases with missing letters of name in the ACAP data set were from 5 ACAT teams new to NMDS version 2 whose software did not allow them to extract letter of name.
Match characteristics The main purpose of a match key is to establish links. However, a close look at the list of keys used for Stage 3 (Table C.3) suggests that many of the keys may be redundant; that is,

100
less discriminating keys would have established links identified by several more specific keys. This apparent redundancy was purposefully retained for two reasons. First, the role of many of the keys was to obviate the need to choose between records for clients with non-unique linkage information, thereby improving match quality. Across all stages, 0.12% or fewer matches were made between clients with non-unique match information for the identifying match key on either data set.
The second reason for the multiplicity of keys is to show the strength of identified matches. Over 99% of matches were made using match keys with discriminating power of more than 99.85, except for Stage 6 (Table C.6). For Stage 6 (matching ACAP and HACC NMDSs), over 91% of links were made using keys with this high level of uniqueness. The lower proportions in this stage resulted from the combined effect of having no event data to aid matching and the large size of the HACC data sets. The proportion of matches made with the most detailed (i.e. first) match key depended on the prevalence of the additional information in the data sets, and ranged from 27% to 84%.
Missing components of SLK-581 appear to have resulted in missed links when region was the only data element available for matching in addition to SLK-581. This particularly affected matching between NMDS data sets: for stages 5 and 6, relatively few links were made with records with incomplete SLK-581s: less than 2% of matches had possibly poor SLK-581 data compared with rates of 3-6% of records with poor SLK data in the original data sets (tables C.6 and C.7). Previous analysis of the HACC NMDS showed that ‘clients’ defined by an SLK-581 with some missing data tended to have fewer care episodes recorded against them than other clients (AIHW: Karmel 2005a). This suggests that some of those with missing SLK data could also have records associated with another SLK. In this case, the poor SLK data would result in missing periods of service use in the care pathway rather than total absence of use of a program.
Link validation Two main methods were used to validate links: consistency of links with record characteristics and clerical review of three samples of links.
Consistency of matches The consistency of links was examined looking particularly at links within ACAP place of assessment and links to deaths (Table C.8). For Stage 3, 97.6% of ACAP 2003–04 clients who were reported as being assessed in RAC linked to the RCCP data set. More generally, links to deaths were highly consistent, both with respect to different sources of date of death information and with regards to program links to ACAP. Overall, very few of the PIAC cohort (0.16%) had a link to a death record that was inconsistent with other elements in the identified care pathway; that is, almost all the NDI records linked to the ACAP cohort had a date of death after identified program use.

101
Table C.8: Measures of link consistency
Measure Numerator Denominator Per
cent
RCCP reported reason for last discharge
‘Death’: per cent linked to NDI 140,666 143,244 98.2
‘To hospital’: per cent linked to NDI 4,782 8,245 58.0
‘Return to family or home’: per cent linked to NDI 6,833 28,352 24.1
RCCP reported still in care on 30 June 2006
Per cent linked to a death after 30 June 2006 12,574 172,247 7.3
Per cent linked to a death before 30 June 2006 313 172,247 0.2
ACAP assessment reported as taking place in RAC
Per cent linked to RCCP 7,132 7,308 97.6
ACAP 2003–04 cohort linked to NDI death record and linked to VHC record
Dates of death on both data sets within 7 days 6,215 6,250 99.4
NDI date of death only (on linked ACAP cohort) 23 6250 0.4
VHC record linked to ACAP cohort
Date of death before 31 December 2006 and death only on VHC data: per cent links 148 12827 1.2
Inconsistent links to ACAP cohort(a)
ACAP cohort pathway with linking to inconsistent death: death before service provision 184 105,077 0.18
HACC care reported after linked death 895 105,077 0.85
(a) Because of limitations in data on dates of service provision for HACC dependent services, results for linking to HACC are presented separately.
Clerical verification As permitted under the ethics approvals, link quality was explicitly investigated using the name information available on the NDI and RCCP data sets to clerically review identified links. Lack of full name on the ACAP NMDS prevented this data set from being used in the comparisons.
Three samples of around 1,000 NDI–RCCP links were randomly selected and the full name, date of birth, sex, postcode and event data from the two data sources were compared clerically across the linked records to identify false positives. Examination of the random sample of 1,010 links taken from all 170,242 NDI–RCCP links identified just one wrong link (false positive) between the two data sets and a further seven with substantial first name differences but which were highly likely to be true positives (Table C.9). Another sample of 1,000 was selected from among the 16,128 links in which the matched records had differences in their SLK-581s (NDI versus RAC). In this sample, differences in sex (34% of sample) and date of birth (63%) were the main causes of the SLK-581 differences, with name differences (including spelling mistakes) affecting around 10%. Because of the SLK differences, these links were expected to be of lower quality; however, just five were identified as false positives (0.5%). Looking at a final sample of 1,000 links out of 26,741 in which date of death data had not been used in the linkage (i.e. reason for discharge on RCCP was not due to death), no false positives were found.

102
Table C.9: Link verification: samples estimating false positives between RCCP and NDI (stage 2)
Link comparison result
Sample from
NDI–RCCP links without identified DOD on ACCMIS
NDI–RCCP links with SLK-581 differences All NDI–RCCP links
Same person 1,000 987 1,009
Highly likely to be same person
Switched given names 0 4 5
Different given names, same dob and dod 0 4 2
Total 0 8 7
Wrong 0 5 1
Total sample 1,000 1,000 1,010
Link population 26,741 16,128 170,242
Note: Samples were selected randomly using a random number generator. Minor name differences (i.e. due to spelling) are not recorded in this table.
C.5 Conclusion The above results show that there can be considerable variation in recorded name and date of birth information, depending on the setting and reason for reporting. Allowing for this in the matching strategy is therefore important. The stepwise deterministic matching algorithm developed for the PIAC project allows for this variation and results in matches of good quality.

103
References
ACAP NDR 2005. Aged Care Assessment Program National Data Repository: minimum data set report, annual report 2003–04. Melbourne: La Trobe University. ACAP NDR 2006. Aged Care Assessment Program National Data Repository: minimum data set report, annual report 2004–05. Melbourne: La Trobe University. AIHW (Australian Institute of Health and Welfare) 2001. Australia’s welfare 2001. Cat. no. AUS 24. Canberra: AIHW. AIHW 2002. Aged care assessment program data dictionary version 1.0. Cat. no. AGE 26. Canberra: AIHW. AIHW 2004. Residential aged care in Australia 2002-03: a statistical overview. Cat. no. AGE 38. Canberra: AIHW. AIHW 2005. Australia’s welfare 2005. Cat. no. AUS 65. Canberra: AIHW. AIHW 2006a. Community Aged Care Packages in Australia 2004–05: a statistical overview. Cat. no. AGE 47. Canberra: AIHW. AIHW 2006b. Data linkage and protecting privacy: a protocol for linking between two or more data sets held within the Australian Institute of Health and Welfare. Canberra: AIHW. Viewed 28 July 2006, <http://www.aihw.gov.au/dataonline/aihw_privacy_protection_ protocols_data_linkage.pdf>. AIHW 2006c. Residential aged care in Australia 2004–05: a statistical overview. Cat. no. AGE 45. Canberra: AIHW. AIHW 2007a. Australia’s welfare 2007. Cat. no. AUS 93. Canberra: AIHW. AIHW 2007b. National GRIM books: all causes combined. Canberra: AIHW. Viewed 3 October 2007, <http://www.aihw.gov.au/mortality/data/grim_books_national.cfm>. AIHW 2009. Incorporating HACC use into aged care pathways: a technical report for the PIAC project. Data linkage series no. 7. Cat. no. CSI 7. Canberra: AIHW. AIHW: Community Services Ministers’ Advisory Council 2004. Statistical data linkage in community services data collections. Canberra: AIHW. AIHW: Karmel R 2005a. Data linkage protocols using a statistical linkage key. Cat. no. CSI 1. Canberra: AIHW. AIHW: Karmel R 2005b. Transitions between aged care services. Cat. no. CSI 2. Canberra: AIHW. AIHW: Karmel R 2006. The ins and outs of residential respite care. Cat. no. AUS 80. Canberra: AIHW. AIHW: Karmel R, Anderson P & Lloyd J 2008. Movement from hospital to residential aged care. Cat. no. CSI 6. Canberra: AIHW. AIHW: Karmel R & Braun P 2004. Statistical linkage across aged care programs: an exploratory example. Canberra: AIHW. AIHW: Ryan T, Holmes B & Gibson D 1999. A National Minimum Data Set for Home and Community Care. Cat. no. AGE 13. Canberra: AIHW. Brook EL, Rosman DL, Holman CDJ & Trutwein B 2005. Summary report: research outputs project, WA Data Linkage Unit (1995–2003). Perth: Department of Health Western Australia.

104
Bruen W 2005. Aged care in Australia: past, present and future. Australiasian Journal on Ageing 24:130–3. DIMA (Department of Immigration and Multicultural Affairs) 2003. 2001 classification of countries into English Proficiency Groups. Canberra: DIMA. DoHA (Department of Health and Ageing) 2004. A New Strategy for Community Care – The Way Forward. Canberra: DoHA. DoHA 2005. Home and Community Care Program minimum data set, 2003–04 annual bulletin. Canberra: DoHA. Viewed 30 July 2007, <http://www.health.gov.au/internet/ main/publishing.nsf/Content/hacc-pub_mds_sb.htm>. DoHA 2006a. Aged Care Assessment and Approval Guidelines – September 2006. Canberra: DoHA. Viewed 11 August 2009, <http://www.health.gov.au/internet/main/ publishing.nsf/Content/ageing-acat-acapaag.htm~ageing-acat-acapaag05.htm>. DoHA 2006b. Home and Community Care Program minimum data set, 2004–05 annual bulletin. Canberra: DoHA. Viewed 4 October 2007, <http://www.health.gov.au/internet/ main/publishing.nsf/Content/hacc-pub_mds_sb.htm>. DoHA 2007. Home and Community Care Program minimum data set, 2005–06 annual bulletin. Canberra: DoHA. Viewed 29 November 2007, <http://www.health.gov.au/ internet/main/publishing.nsf/Content/hacc-pub_mds_sb.htm>. Gray L 2001. Two year review of aged care reforms. Canberra: DHAC. Herzog T, Scheuren FJ & Winkler WE 2007. Data quality and record linkage techniques. New York: Springer. James Underwood & Associates Pty Ltd 2002. The prevalence and use of unfunded places in Australian Government Funded residential care services. Canberra: DoHA. Viewed 3 March 2009, <http://www.health.gov.au/internet/main/publishing.nsf/Content/ C07BC470B2C4A915CA256F1900101D48/$File/unfunded_rescare.rtf>. Jaro M 1995. Probabilistic linkage of large public health data files. Statistics in Medicine 14:112–21. Karmel R, Anderson P, Gibson D, Peut A, Duckett SJ & Wells Y 2010. Empirical aspects of record linkage across multiple data sets using statistical linkage keys: the experience of the PIAC cohort study. BMC Health Services Research 10:41. Karmel R & Gibson D 2007. Event-based record linkage in health and aged care services data: a methodological innovation. BMC Health Services Research 7:154. Runge C, Gilham J & Peut A 2009. Transitions in care of people with dementia: a systematic review. Sydney: Dementia Collaborative Research Centres UNSW. SCRGSP (Steering Committee for the Review of Government Service Provision) 2009. Report on Government Services 2009. Canberra: Productivity Commission.
105
List of tables
Table 1.1: Programs and data included in the PIAC study ..........................................................5 Table 1.2: Summary of links to the PIAC cohort ............................................................................7
Table 2.1: PIAC cohort: number of ACAT re-assessments within 12 months per person by PIAC group (per cent) .................................................................................14
Table 2.2: ACAT re-assessments within 12 months by completion status and place of assessment, by PIAC group ......................................................................................15
Table 2.3: PIAC cohort with re-assessments within 12 months: first post-assessment care pathway event by PIAC group .............................................................................16
Table 2.4: PIAC cohort with re-assessments within 12 months and a completed assessment as the first post-assessment care pathway event: second post-assessment care pathway event by PIAC group ...............................................16
Table 2.5: PIAC cohort: use of respite RAC after reference assessment, by PIAC group ................................................................................................................................18
Table 2.6: PIAC cohort: mean number of assessments within 12 months of the referenced assessment, by PIAC group .......................................................................19
Table 3.1: PIAC cohort: aged care programs accessed within 2 years of the reference assessment, by PIAC group ..........................................................................................22
Table 3.2: Distinct aged care pathways over 2 years after reference ACAT assessment, PIAC new-pathways cohort (number) ...................................................23
Table 3.3: PIAC new-pathways cohort: first three care changes for care pathways over 2 years after reference assessment .......................................................................30
Table 4.1: PIAC cohort: Time to starting on a CACP after reference assessment, by PIAC group (per cent) ..............................................................................................34
Table 4.2: PIAC cohort: Time to entry into permanent care after reference assessment, by PIAC group (per cent) .........................................................................35
Table 4.3: PIAC cohort: summary of program use at specific intervals from reference assessment ......................................................................................................39
Table 4.4: PIAC continuing path cohort: program use at specific intervals from ACAT reference assessment ..........................................................................................40
Table 4.5: PIAC new-pathways cohort: program use at specific intervals from reference ACAT assessment ..........................................................................................41
Table 4.6: PIAC new-pathways cohort with previous use of HACC or VHC: program use at specific intervals from reference ACAT assessment ......................42
Table 4.7: PIAC new-pathways cohort with no previous care: program use at specific intervals from reference ACAT assessment..................................................43
Table 4.8: PIAC cohort: time to death after reference assessment, by PIAC group (per cent) ..........................................................................................................................44

106
Table A.1: PIAC cohort: state/territory of client usual residence, by PIAC group .................48 Table A.2: PIAC cohort: sex by PIAC group .................................................................................49 Table A.3: PIAC cohort: client age, by PIAC group .....................................................................50 Table A.4: PIAC cohort: client sex and age, by PIAC group (per cent) .....................................51 Table A.5: PIAC cohort: mean and median age, by sex and PIAC group (years) ....................52 Table A.6: PIAC cohort: DVA entitlement status, by PIAC group (per cent) ...........................52 Table A.7: PIAC cohort: Indigenous status by PIAC group (per cent) ......................................53 Table A.8: PIAC cohort: English proficiency group by PIAC group (per cent) .......................54 Table A.9: PIAC cohort: country of birth by PIAC group (per cent)..........................................55
Table A.10: PIAC cohort: usual accommodation at reference assessment by PIAC group (per cent) ..............................................................................................................57
Table A.11: PIAC cohort living in the community: living arrangement at reference assessment by PIAC group (per cent) ..........................................................................58
Table A.12: PIAC cohort living in the community: carer availability at reference assessment by PIAC group (per cent) ..........................................................................58
Table A.13: PIAC cohort living in the community with a carer: carer co-residency at reference assessment by PIAC group (per cent) ........................................................59
Table A.14: PIAC cohort living in the community with a carer: carer relationship at reference assessment by PIAC group (per cent) ........................................................60
Table A.15: PIAC cohort: priority of reference assessment by PIAC group (per cent) .............61
Table A.16: PIAC cohort: location of first face-to-face contact for the reference assessment by PIAC group (per cent) ..........................................................................61
Table A.17: PIAC cohort: main health condition impacting on need for assistance by PIAC group ......................................................................................................................64
Table A.18: PIAC cohort: health conditions impacting on need for assistance within PIAC group (prevalence, as per cent) ..........................................................................65
Table A.19: PIAC cohort: ADL score at reference assessment by PIAC group (per cent) ..................................................................................................................................66
Table A.20: PIAC cohort living in the community: IADL score at reference assessment by PIAC group (per cent) ..............................................................................................66
Table A.21: PIAC cohort living in the community: source of assistance for ADLs at reference assessment by PIAC group (per cent) ........................................................67
Table A.22: PIAC cohort living in the community: source of assistance for IADLs at reference assessment by PIAC group (per cent) ........................................................67
Table A.23: PIAC cohort: recommended long-term care setting by PIAC group (per cent) ..................................................................................................................................71
Table A.24: PIAC cohort recommended to live in the community: respite care recommendation by PIAC group (per cent) ...............................................................71

107
Table A.25: PIAC cohort recommended to live in the community: recommendations for community care programs by PIAC group (per cent) ........................................72
Table A.26: PIAC cohort recommended to live in the community: number of recommendations for community care programs by PIAC group (per cent) ..........................................................................................................................72
Table A.27: PIAC cohort: approval for ACAT-dependent programs by PIAC group (per cent) ..........................................................................................................................73
Table A.28: PIAC cohort: number of approvals for ACAT-dependent programs by PIAC group (per cent) ....................................................................................................74
Table A.29: PIAC cohort recommended to live in the community but who did not get any approvals: number of recommendations for community care programs by PIAC group (per cent) ............................................................................75
Table B.1: HACC services recorded on the HACC NMDS .........................................................79
Table B.2: Summary of HACC event adjustments for ACAP cohort, NMDS 2002–03 to 2005–06, clients in PIAC cohort ................................................................................80
Table B.3: ‘First seen’ HACC date compared with first ACAP assessment date, PIAC cohort with first HACC and first ACAP event in the same quarter .......................80
Table B.4: Summary of VHC events for PIAC cohort study, VHC January 2001–March 2008 .............................................................................................................83
Table C.1: Linkage stages in the PIAC project ..............................................................................86 Table C.2: Keys based on components of SLK-581 and region ...................................................89 Table C.3: Criteria for selecting match keys for PIAC Stage 3 ....................................................90 Table C.4: Match results from stepwise matching for PIAC Stage 3 .........................................93 Table C.5: Overview of matching in the PIAC study, by linkage stage ....................................96 Table C.6: Overview of link quality in the PIAC study, by linkage stage ................................97 Table C.7: Quality of data used to establish links in the PIAC study ........................................99 Table C.8: Measures of link consistency ......................................................................................101
Table C.9: Link verification: samples estimating false positives between RCCP and NDI (stage 2)..................................................................................................................102

108
List of boxes and figures
Box 1.1: Aged care programs in the PIAC project ......................................................................4 Box 1.2: Definition of PIAC groups ..............................................................................................8 Box A.1: English Proficiency groups ...........................................................................................48
Figure 1.1: Possible movements through the Australian health and aged care system (2003–04) ............................................................................................................................2
Figure 1.2: PIAC groups ......................................................................................................................9
Figure 2.1: Completed re-assessments by location and PIAC group (as per cent of all re-assessments within PIAC group) ............................................................................12
Figure 3.1: Example of a person’s aged care pathway, starting from the ACAT reference assessment ......................................................................................................21
Figure 3.2: PIAC new-pathways cohort with no previous care before reference assessment: first three care events of care pathway within 2 years of first completed ACAT assessment in 2003–04 ....................................................................25
Figure 3.3: PIAC new-pathways cohort with HACC/VHC before reference assessment: first three care events of care pathway within 2 years of first completed ACAT assessment in 2003–04 ....................................................................27
Figure 4.1: Take up of CACPs over time, by PIAC cohort group (per cent of group) .............32
Figure 4.2: Movement into permanent RAC over time, by PIAC cohort group (per cent of group) ..........................................................................................................33
Figure 4.3: Proportion of people using aged care programs over time, by PIAC cohort group (per cent of living cohort at time point) ..............................................37
Figure 4.4: Deaths over time, by PIAC cohort group (per cent of group) ..................................38 Figure C.1: Linkage stages for PIAC cohort study .........................................................................85