Embed Size (px)
Citation preview
Microbial Pathogenesis 48 (2010) 131 - 142
Contents lists available at ScienceDirect
Microbial Pathogenesis
El ~LVll:R journal hom epage: www.e ls ev ie r .com / locate/ micpath
Pathogenesis of Escherichia coli 0157:H7 strain 86-24 following oral infection of BALB/c mice with an intact cotntnensal flora
Krystle L. Mohawk a. Angela R. Melton-Celsa a. Tonia Zangari a. Erica E. Carroll b, Alison D. O'Brien a .•
• Deparrment of Microbiology and Immunology. Uniformed Services Univer.;icy of the Health Sciences, 4301 jones Bridge Road. Becl•esda. MD 20814-4799. USA b Depamnent of Pathology, Naval Medical Research Center. 503 Habert Grant Avenue. Silver Spring. MD 20910-7500, USA
AR TICLE I NFO ABSTRACT
Article history: Received 18 November 2009 Received in revised form 12 january 2010 Accepted 14 january 2010 Available online 22 january 2010
Keywords: Escherichia coli 0157:H7 mouse model Shiga toxin intimin
Esclrericltia coli 0 157:H7 is a food-borne pathogen that can cause hemorrhagic colitis and. occasionally, hemolytic uremic syndrome, a sequela of infenion that can result in renal failu re and death. Here we sought to model the pathogenesis of ora lly-administered E. coli OJ57:H7 in BALB/c mice with an intact intestinal nora. First. we defined the optimal dose that permitted sustained fecal shedding of E. coli 0 157:H7 over 7 days ( -109 colony forming units). Next, we monitored the load of E. coli 0 157:H7 in intestinal sections over time and observed that the cecum was consistently the tissue with the highest £.coli 0 157:H7 recovel)'. We then followed the expression of rwo key E. coli 0 157:H7 virulence factors, the adhesin intimin and Shiga toxin type 2. and detected both proteins early in infection when bacterial burdens were highest. Additionally, we noted that during infection. animals lost weight and - 30% died. Moribund anim,1ls also exhibited elevated levels of blood urea nitrogen. and, on necropsy, showed evidence of renal tubular damage. We conclude that conventional mice inoculated orally with high doses of E. coli 0 157:1-17 can be used to model bo1·h intestinal colonization and subsequent development of certain extraintestinal manifestations of£. coli 0 157:H7 disease.
1. Introduction
Esc/Jerichia coli 0 157: H7 is a food-borne pathogen that results in an estimated annual incidence of 73,000 cases of diarrheal illness each year in the United States [ 11. Hemolytic uremic syndrome, or I·IUS, is the most serious sequela of E. coli 0157:H7 infection that occurs on average in 4% of those infected 121- However. the recent 2006 spinach-associated E. coli 0 157:H7 outbreak in the United States had a higher rate of HUS (1 6%) that was perhaps actributable to the emergence of a more virulen t clade of E. coli 0 157: H713. 4 1. HUS consists of a triad of symptoms that include microangiopathic hemolytic anemia, thrombocytopenia, and acute renal fa ilure 151. Although most people recover from HUS, late complications and even death can result [61.
The sequence of events by which E. coli 0157:H7 establishes infection and causes disease is imperfectly understood. It is known that E. coli 0157:H7 can cause illness in a person who has ingested as few as 100 organisms [71. Therefore, at least a portion of that inoculum must be capable of surviving the acidic conditions of the stomach to colonize the intestine (reviewed in Ref. [81). Intimate
• Corresponding author. Tel.: + I 301 295 3419; fax: + I 301 295 3773. E-mail address: [email protected] (A.D. O'Brien).
0882-4010/S - see front maner Published by Elsevier Ltd. doi: IO.l016/j.micpath.2010.0 1.003
Published by Elsevier ltd.
adherence of E. coli 0157:H7 to the intestinal mucosa is considered to require expression of the bacterial outer membrane protein in timin and other factors secreted through the type Ill secretion system (TISS) (reviewed in Ref. [9 1).
The development of HUS is associated with the production of Shiga toxin (Stx) by E. coli 0157:H7 and other Stx-producing E. coli (STEC) [ 10- 121. This toxin is produced by the infecting bacteria in the gut, as evidenced by the presence of Stx in the feces of E. coli 0 157: H7-infected individuals [ 11 -13 1. E. coli 0157:H7 can produce two types ofStxs, Stx1 and/or Stx2, as well as variants of these toxin types. Stxs are ABs toxins that bind to cells through the pentameric B subunits via a glycosphingolipid receptor known as globotriaosylce ramide, or Gb3. Stx is an N-glycosidase that cleaves a purine residue in ri bosomal 28S RNA. This catalytic event leads to inhi bition of protein synthesis in the target cell and, subsequently, cell death by apoptosis (reviewed in Ref. [ 14)). The primary targets for Stx in vivo are small vessel vascular endothelial cells that express Gb3 [ 15- 17 1. such as those within the renal glomerulus [17,18J. It is not known how Stx crosses the intestinal barrier to target small vessel endothelial cells in the lamina propria of the gut {thought to be a primary event in the manifestation of hemorrhagic colitis). nor the mechanis m by which the toxin ente rs the blood stream and trave ls through the circulatory system to the Gb3-rich small vessel endothe lia in the kidney.
Report Documentation Page Form ApprovedOMB No. 0704-0188
Public reporting burden for the collection of information is estimated to average 1 hour per response, including the time for reviewing instructions, searching existing data sources, gathering andmaintaining the data needed, and completing and reviewing the collection of information. Send comments regarding this burden estimate or any other aspect of this collection of information,including suggestions for reducing this burden, to Washington Headquarters Services, Directorate for Information Operations and Reports, 1215 Jefferson Davis Highway, Suite 1204, ArlingtonVA 22202-4302. Respondents should be aware that notwithstanding any other provision of law, no person shall be subject to a penalty for failing to comply with a collection of information if itdoes not display a currently valid OMB control number.
1. REPORT DATE JAN 2010 2. REPORT TYPE
3. DATES COVERED 00-00-2010 to 00-00-2010
4. TITLE AND SUBTITLE Pathogenesis of Escherichia coli 0157:H7 strain 86-24 following oralinfection of BALB/c mice with an intact commensal flora
5a. CONTRACT NUMBER
5b. GRANT NUMBER
5c. PROGRAM ELEMENT NUMBER
6. AUTHOR(S) 5d. PROJECT NUMBER
5e. TASK NUMBER
5f. WORK UNIT NUMBER
7. PERFORMING ORGANIZATION NAME(S) AND ADDRESS(ES) Naval Medical Research Center,Department of Pathology,503 RobertGrant Avenue,Silver Spring,MD,20910
8. PERFORMING ORGANIZATIONREPORT NUMBER
9. SPONSORING/MONITORING AGENCY NAME(S) AND ADDRESS(ES) 10. SPONSOR/MONITOR’S ACRONYM(S)
11. SPONSOR/MONITOR’S REPORT NUMBER(S)
12. DISTRIBUTION/AVAILABILITY STATEMENT Approved for public release; distribution unlimited
13. SUPPLEMENTARY NOTES
14. ABSTRACT Escherichia coli 0 157:H7 is a food-borne pathogen that can cause hemorrhagic colitis and. occasionally.hemolytic uremic syndrome, a sequela of infection that can result in renal failure and death. Here wesought to model the pathogenesis of orally-administered E. coli 0157:H7 in BALB/c mice with an intactintestinal nora. First. we defined the optimal dose that permitted sustained fecal shedding of E. coli0157:H7 over 7 days ( -109 colony forming units). Next. we monitored the load of E. coli 0157:H7 inintestinal sections over time and observed that the cecum was consistently the tissue with the highest E. coli0157: H7 recovery. We then followed the expression of two key E. coli 0 157:H7 virulence factors. theadhesin intimin and Shiga toxin type 2, and detected both proteins early in infection when bacterialburdens were highest. Additionally, we noted that during infection, animals lost weight and - 30% died.Moribund animals also exhibited elevated levels of blood urea nitrogen. and. on necropsy, showed evidenceof renal tubular damage. We conclude that conventional mice inoculated orally with high doses of E. coli 0157:H7 can be used to model both intestinal colonization and subsequent development of certainextraintestinal manifestations of E. coli 0157:H7 disease.
15. SUBJECT TERMS
16. SECURITY CLASSIFICATION OF: 17. LIMITATION OF ABSTRACT Same as
Report (SAR)
18. NUMBEROF PAGES
12
19a. NAME OFRESPONSIBLE PERSON
a. REPORT unclassified
b. ABSTRACT unclassified
c. THIS PAGE unclassified
Standard Form 298 (Rev. 8-98) Prescribed by ANSI Std Z39-18
132 K.L Mohawk et aLI Microbial Pathogenesis 48 (2010) 131-142
Mouse infection models that mirror various aspects of SfEC pathogenesis or disease (such as intestinal colonization, renal impairment, central neiVous system damage, and death) have been developed (reviewed in Ref. [19]). While these animal systems are helpful for assessing features of STEC disease, many require that mice undergo artificial manipulations such as prolonged dietary restriction to promote colonization, mitomycin C injection to facilitate Stx expression, or antibiotic treatment to reduce the normal flora that can inhibit the establishment of an exogenous infection [20-25]. Furthermore, in antibiotic-treated or axenic animal model systems the STEC strain is likely to have a pathogenic advantage as it is no longer competing with the entire normal flora microbiome for resources. On the other hand, in a mouse model in which the normal gut flora is suppressed, the infecting E. coli 0157:H7 strain may not receive molecular signals made by commensal bacteria that lead, through a quorum-sensing regulatory network, to TISS expression by£ coli 0157(26]. Thus, to better reflect the typical gastrointestinal environment to which £ coli 0157:H7 is exposed following ingestion, we sought to develop an oral model of £ coli 0157:H7 infection in mice with an intact commensal flora (ICF).
2. Results
2.1. Dose-response studies
As a first step in the development of a mouse model of E. coli 0157:H7 infection in BALB/c mice with an ICF, we conducted doseresponse experiments to determine whether inoculum size correlated with the percent of animals colonized or the level of colonization over time. For this purpose, groups of 5-10 mice were intragastrically administered approximately 105, 106, 107, 108, or 109 CFU of E. coli 0157:H7 strain 86-24NaiR and the degree of bacterial colonization measured as defined by the number of 86-24NaiR bacteria present per gram [colony forming units (CFU)/g] feces.
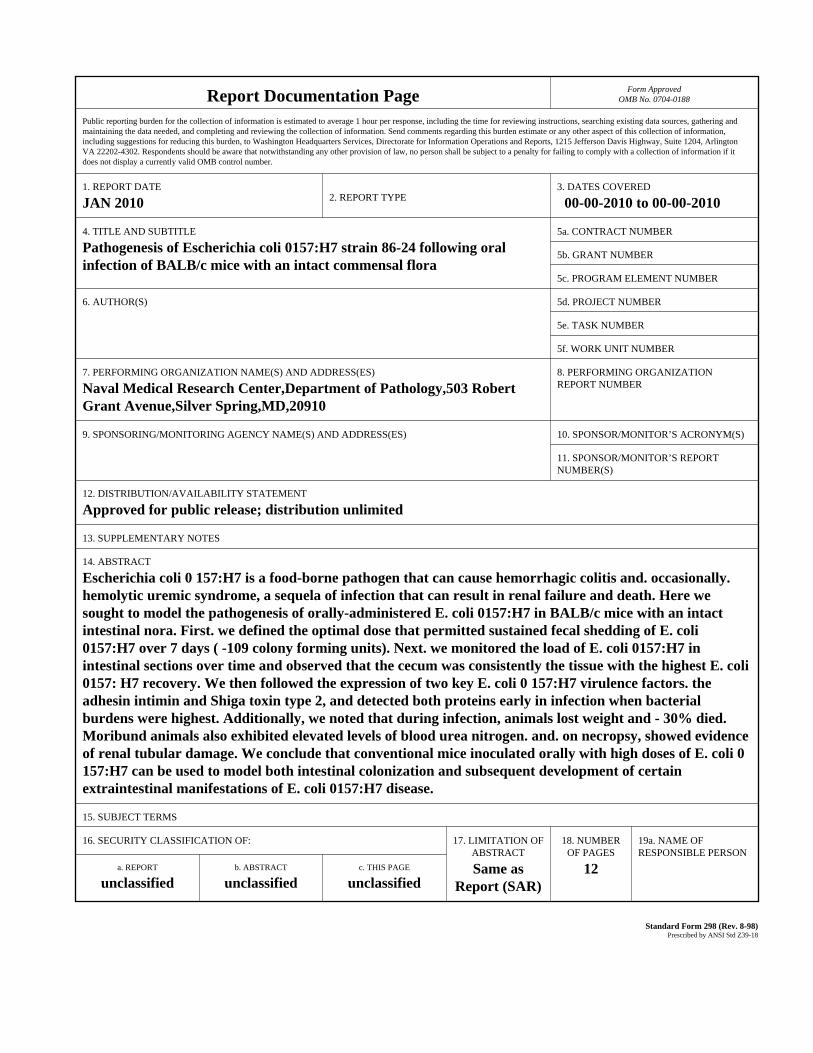
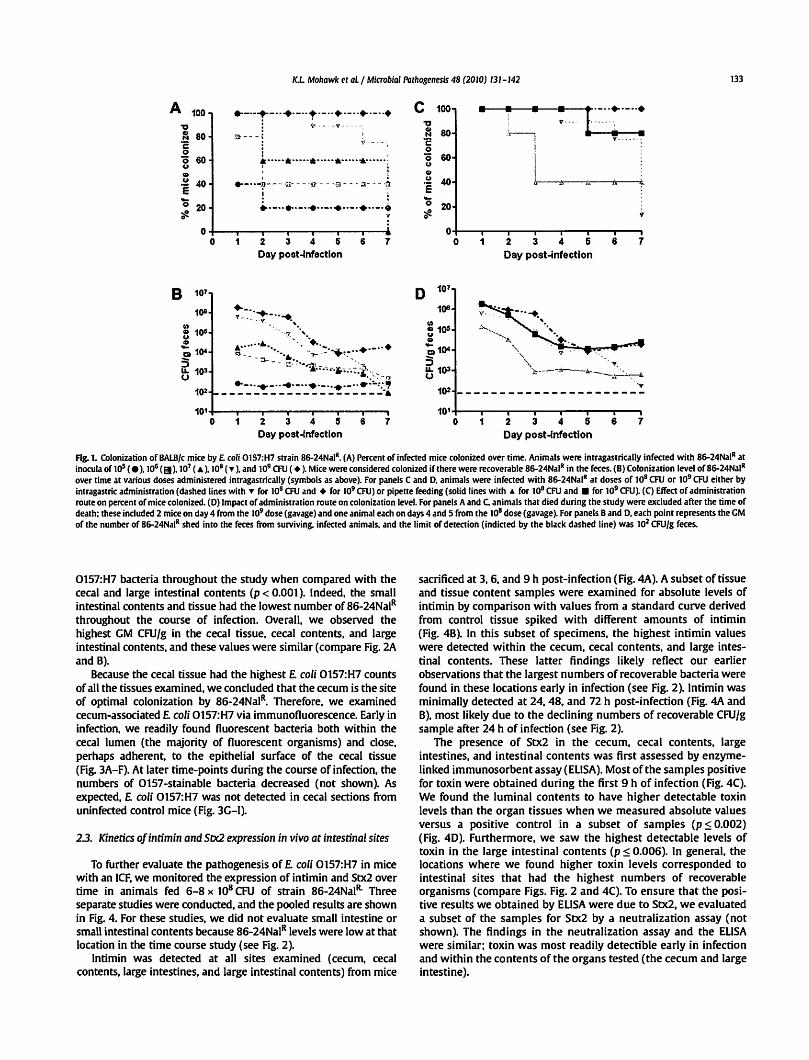
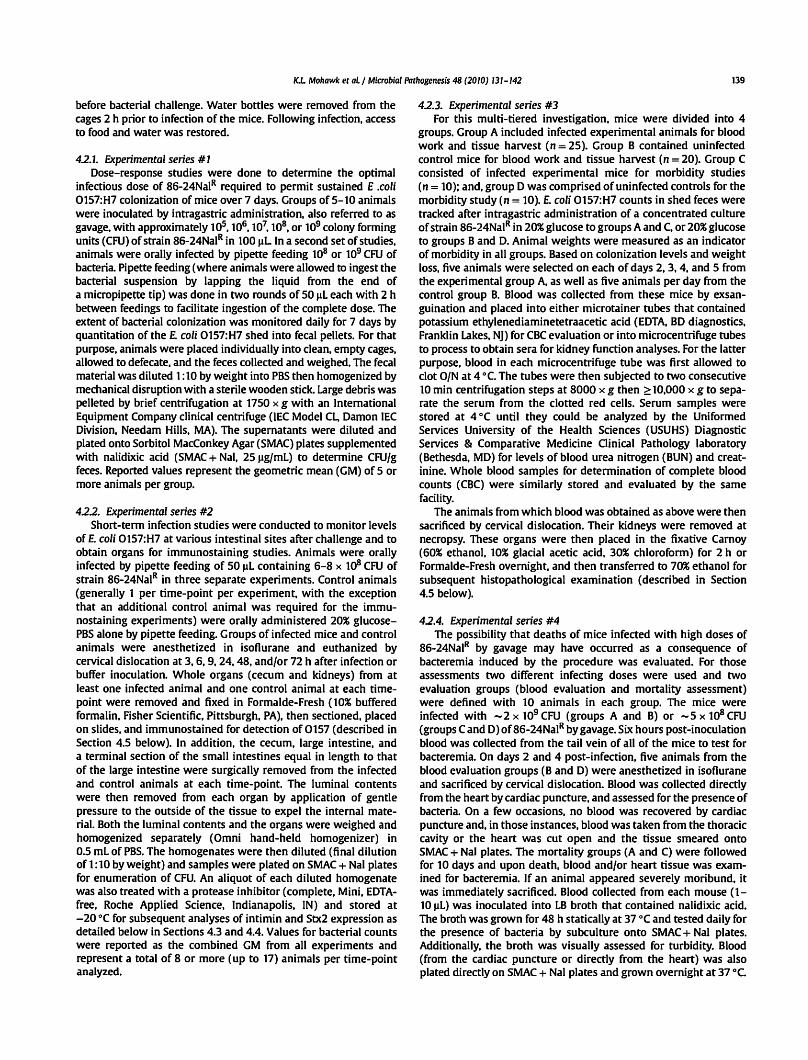
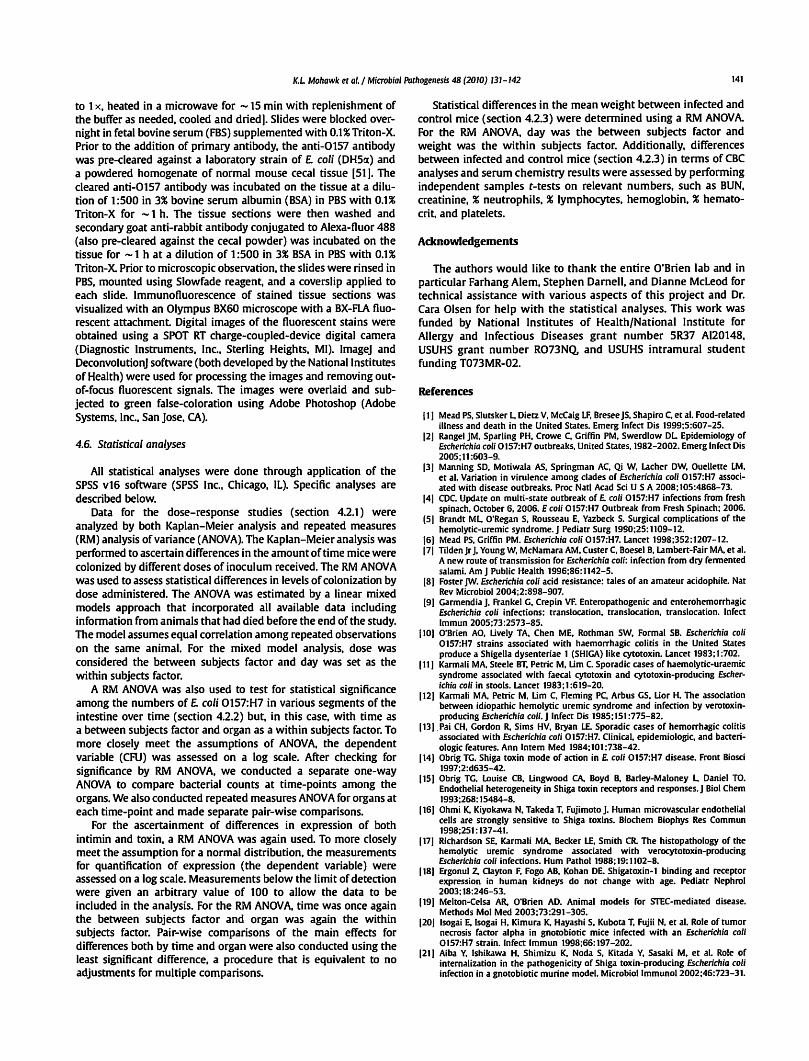
The percent of animals colonized on day 1 following infection with strain 86-24NaiR varied by challenge dose (Fig. 1A). At an inoculum of 105 or 106 CFU, 40% or 80% of the mice, respectively, had detectable bacterial counts within their feces on day 1 postinfection. All animals challenged with 107 CFU or greater shed detectable bacteria on day 1 of infection. The relative proportion of mice that remained colonized after day 1 was also dose-dependent (Fig. 1A). Groups of animals given :s 107 CFU of£ coli 0157:H7 strain 86-24NaiR had fewer infected mice on day 2 than on day 1, with 60% or less of the mice in those groups infected throughout the remainder of the study. Of the animals that received 108 CFU, 7 of 8 mice remained colonized for the first 5 days after infection (2 of the original 10 animals died during the study and, thus, were no longer included in this analysis). At the highest inoculum of 109 CFU, mice were both consistently (% of mice colonized) and persistently (prolonged, high-level colonization) infected for the 7 days that followed challenge (2 of 5 mice, both highly colonized, died on day 4 post-infection). In summary, as the inoculum dose increased there was a statistically significant increase in the percent of mice that were colonized over time (p = 0.005 in a trend analysis).
Next, we assessed the differences in overall levels of colonization among the inocula groups (Fig. 18). We found that as the challenge dose went up, the number of bacteria shed into the feces increased (p = 0.001 ). At a low inoculum ( 105 CFU), animals shed £ coli 0157:H7 with a geometric mean (GM) less than 103 CFU/g feces over the course of the experiment The recoverable bacteria from mice infected with 106 or 107 CFU, while somewhat higher, still remained relatively low (GM at or below 104 CFU/g feces). In comparison, animals that received an inoculum of 108 or 109 CFU
had more recoverable bacteria on the day after infection (GMs of 6.5 x 10⁵ and 1.9 x 10⁶ CFU/g feces, respectively). Mice that received 108 CFU had a statistically higher colonization level than animals challenged with 105 CFU, irrespective of time (p = 0.001 ). At the largest inoculum of 109 CFU, statistically higher levels of colonization were measured compared to doses of 105, 106, or 107 CFU (p :s 0.01 ), again irrespective of time. However, as the overall colonization levels declined during the study these variations by inoculum dose in colonization loads eventually disappeared (except at the highest inoculum when comparing CFU/g feces on day 7 post-infection, Fig. 18).
We next evaluated the impact on colonization of administration of 108 or 109 CFU of strain 86-24NaiR to the mice by intragastric administration versus pipette feeding (orally through a micropipette tip). We obseiVed a more consistent infection after intragastric administration at the highest inoculum of 109 CFU (p = 0.023, Fig. 1 C). When assessing the colonization levels in the various groups (Fig. 1 D), significantly higher colonization levels were achieved at higher inocula (p = 0.008), as was noted previously (Fig. 1 B), regardless of method used to introduce the bacteria. Additionally, as infection progressed, colonization levels generally declined in all groups (p < 0.001 ). When the data were averaged across all days, there was no overall difference between the procedures used to infect the animals at either dose. However, there was an indication that providing the inoculum by gavage resulted in increased levels of colonization on certain days postinfection, and this was most pronounced on day 3 (p = 0.004) (Fig. 10). Nevertheless, the most consistent and persistent colonization levels in mice were achieved with an inoculum of 109 CFU regardless of the route of bacterial challenge used. Therefore, for all subsequent experiments, we orally infected mice either intragastrically by gavage or by pipette feeding with approximately 109 CFU of the microbe. The inoculum method applied was largely dictated by the question under study in a particular experiment.
22. Sites of 86-24NaiR colonization in the mouse intestinal tract
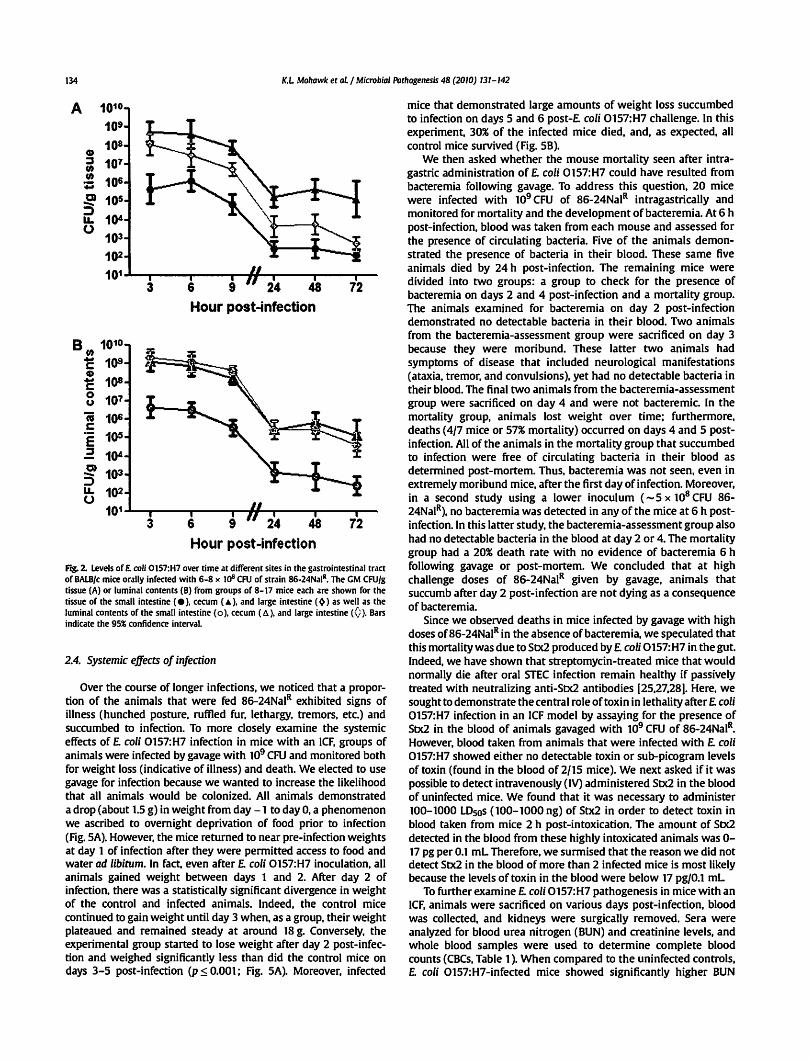
To determine the site of£ coli 0157:H7 colonization within the intestines of the ICF mice after challenge with 86-24NaiR, animals were orally inoculated with about 109 CFU of the bacterium by pipette feeding. We elected to use the pipette feeding method for this study because it is more like the natural route of exposure to the organism, ingestion, than is gavage. At various times following infection, groups of animals (n = 8-17) were sacrificed, and the numbers of 86-24NaiR bacteria associated with the tissues of the small intestine, cecum, and large intestine, as well as in the luminal contents of those intestinal segments were determined.
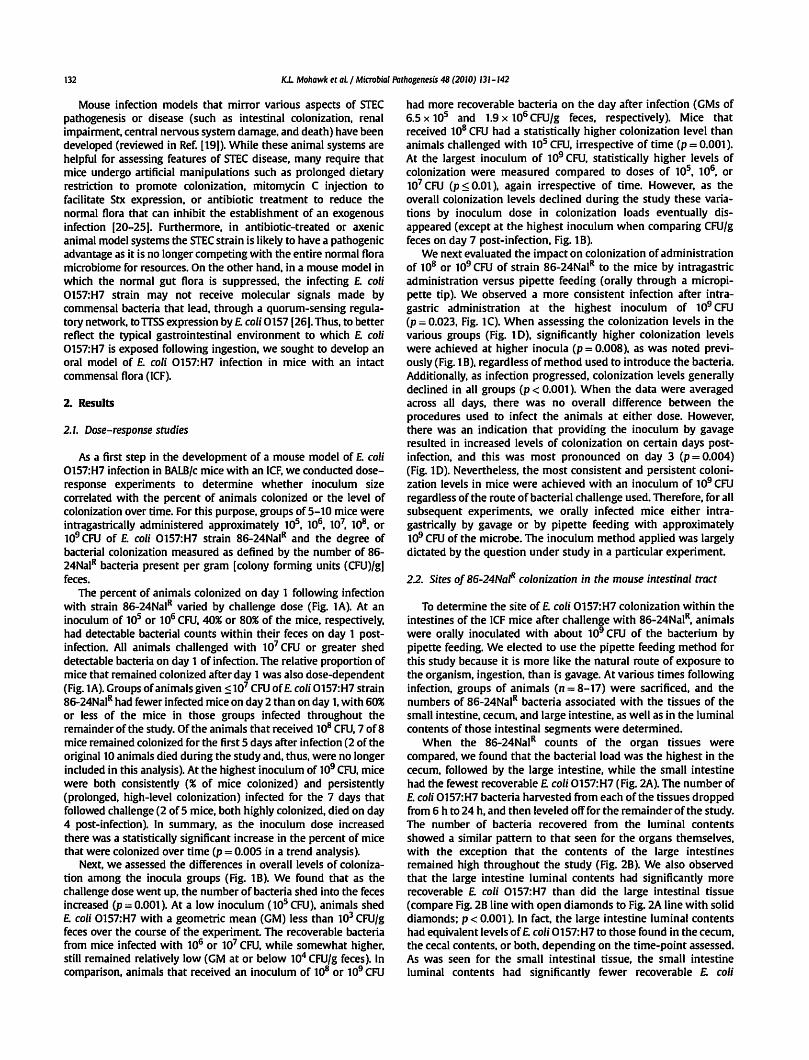
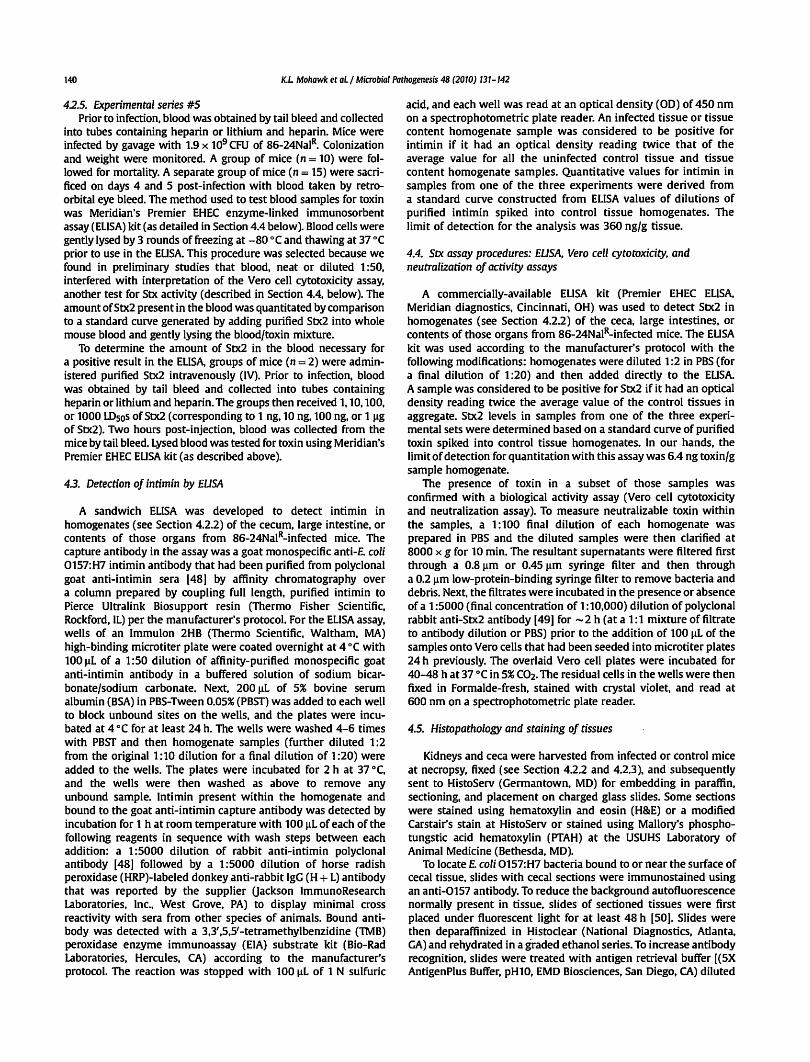
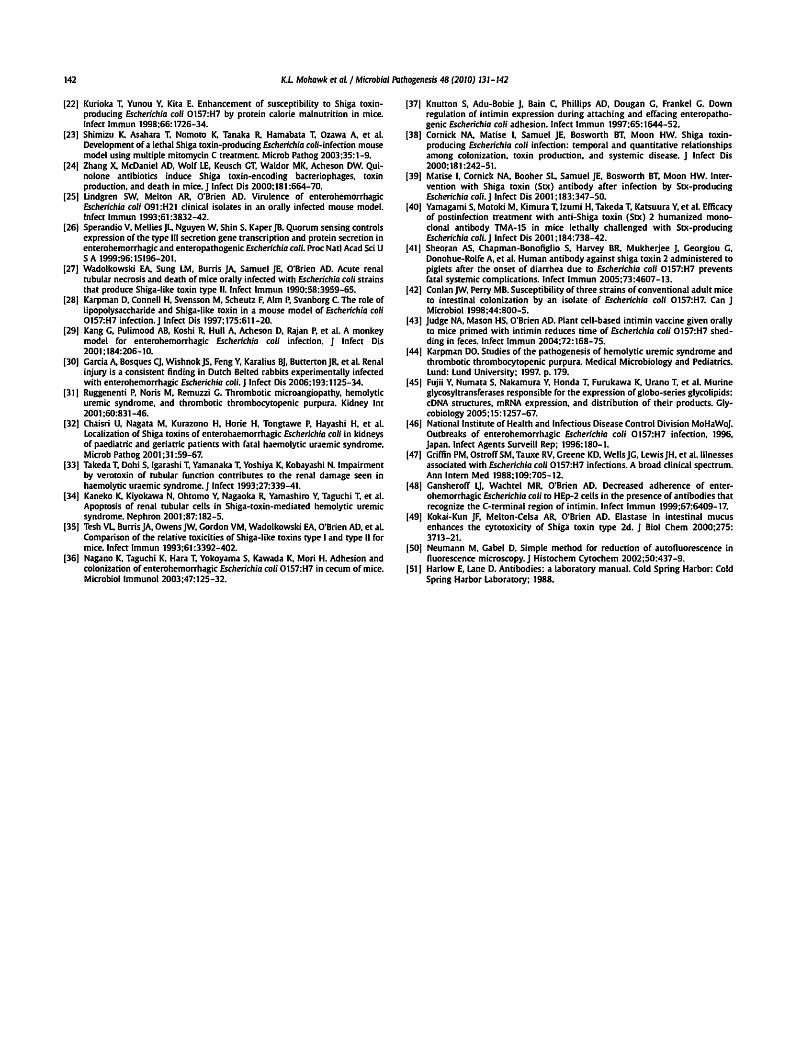
When the 86-24NaiR counts of the organ tissues were compared, we found that the bacterial load was the highest in the cecum, followed by the large intestine, while the small intestine had the fewest recoverable£ coli 0157:H7 (Fig. 2A). The number of E. coli 0157:H7 bacteria haiVested from each of the tissues dropped from 6 h to 24 h, and then leveled off for the remainder of the study. The number of bacteria recovered from the luminal contents showed a similar pattern to that seen for the organs themselves, with the exception that the contents of the large intestines remained high throughout the study (Fig. 28). We also obseiVed that the large intestine luminal contents had significantly more recoverable £ coli 0157:H7 than did the large intestinal tissue (compare Fig. 28 line with open diamonds to Fig. 2A line with solid diamonds: p < 0.001 ). In fact, the large intestine luminal contents had equivalent levels of E. coli 0157:H7 to those found in the cecum, the cecal contents, or both, depending on the time-point assessed. As was seen for the small intestinal tissue, the small intestine luminal contents had significantly fewer recoverable E. coli
K.L Mohawk ec aLI Microbial Pachogenesis 48 (2010) 131-142 133
A 100
"' 0 80 N
c 0 0 60 CJ 0 CJ 40 'E -0 20 ~ 0
0
B 107
1()8
s 106 0
';1Qot
~ 103 0
1()2
0
·-·--+-··•·-··t·-··+·-··•·-··• : .,._ ... "v~
o----~ -i< -···
~···········•···········•······i : !
•-··-~---· -;;;-- --u· -··--a- -·-o:J--- ~
! :
··-··•··-··•··-·•··-·•··-·• ·II
2 3 4 5 6 7 Day post-Infection
101-t--~-....--....--r--r-.......,r---. 0 2 3 4 5 6 7
Day post-Infection
c 100
"' 41 80 N c 0 0 60 CJ 0 CJ 40 'E -0 20 ~ 0
0
D 107
106
~1()5 CJ 0
';104 :; ~1()3
1()2
0
•
1
• • I
l
2 3
• ~·-·
4 5 Day post-infection
Jl
v
6 7
101+--~-~-~-~-~--r-~ 0 2 3 4 5 6 7
Day post-Infection
F"1g. 1. Colonization of BALB/c mice by£ coli 0157:H7 sttain 86-24Nal11• (A) Percent of infected mice colonized over time. Animals were inttagastrically infected with 86-24Nal11 at inocula of UP (e), 106 (EJ),107 (A),108 (T ), and 109 CFU ( • ). Mice were considered colonized if there were recoverable 86-24Nal11 in the feces. {B) Colonization level of86-24Nal11
over time at various doses administered intragastrically {symbols as above). For panels C and D. animals were infected with 86-24Nal11 at doses of 108 CFU or 109 CFU either by intragastric administtation {dashed lines with " for 108 CFU and + for 109 CFU) or pipette feeding {solid lines with "' for 108 CFU and • for 109 CFU~ {C) Effect of administtation route on percent of mice colonized. (D) Impact of administration route on colonization level. For panels A and C. animals that died during the study were excluded after the time of death; these included 2 mice on day 4 from the 109 dose {gavage) and one animal each on days 4 and 5 from the 108 dose {gavage). For panels Band D, each point represents the GM of the number of 86-24Nal11 shed into the feces from surviving, infected animals, and the limit of detection (indicted by the black dashed line) was 102 CFU/g feces.
0157:H7 bacteria throughout the study when compared with the cecal and large intestinal contents (p < 0.001 ). Indeed, the small intestinal contents and tissue had the lowest number of 86-24NaJR throughout the course of infection. Overall, we observed the highest GM CFU/g in the cecal tissue, cecal contents, and large intestinal contents, and these values were similar (compare Fig. 2A and B).
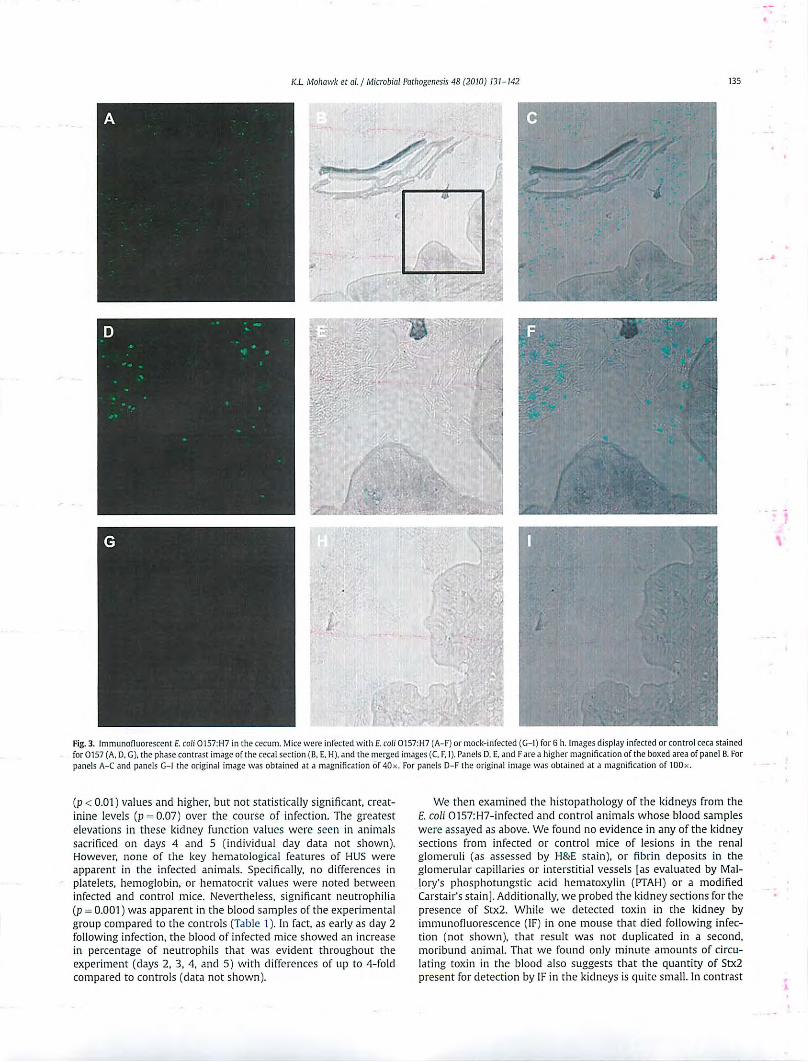
Because the cecal tissue had the highest£ coli 0157:H7 counts of all the tissues examined, we concluded that the cecum is the site of optimal colonization by 86-24NaJR. Therefore, we examined cecum-associated£ coli 0157:H7 via immunofluorescence. Early in infection, we readily found fluorescent bacteria both within the cecal lumen (the majority of fluorescent organisms) and close, perhaps adherent. to the epithelial surface of the cecal tissue (Fig. 3A-F). At later time-points during the course of infection, the numbers of 0157-stainable bacteria decreased (not shown). As expected,£ coli 0157:H7 was not detected in cecal sections from uninfected control mice (Fig. 3G-I).
23. Kinetics ofintimin and Stx2 expression in vivo at intestinal sites
To further evaluate the pathogenesis of£ coli 0157:H7 in mice with an ICF, we monitored the expression of inti min and Stx2 over time in animals fed 6-8 x 10⁸ CFU of strain 86-24NalR. Three separate studies were conducted, and the pooled results are shown in Fig. 4. For these studies, we did not evaluate small intestine or small intestinal contents because 86-24NaiR levels were low at that location in the time course study (see Fig. 2).
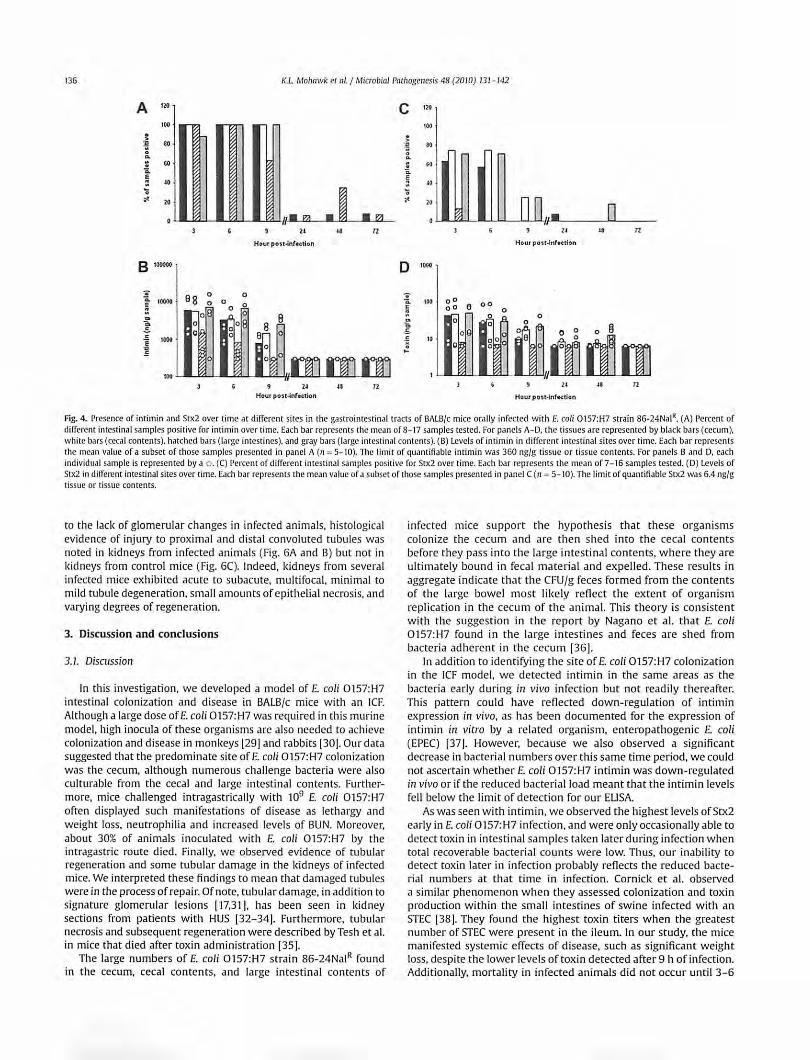
Inti min was detected at all sites examined (cecum, cecal contents, large intestines, and large intestinal contents) from mice
sacrificed at 3, 6, and 9 h post-infection (Fig. 4A). A subset of tissue and tissue content samples were examined for absolute levels of intimin by comparison with values from a standard curve derived from control tissue spiked with different amounts of intimin (Fig. 48). In this subset of specimens, the highest intimin values were detected within the cecum, cecal contents, and large intestinal contents. These latter findings likely reflect our earlier observations that the largest numbers of recoverable bacteria were found in these locations early in infection (see Fig. 2). lntimin was minimally detected at 24, 48, and 72 h post-infection (Fig. 4A and B), most likely due to the declining numbers of recoverable CFU/g sample after 24 h of infection (see Fig. 2).
The presence of Stx2 in the cecum, cecal contents, large intestines, and intestinal contents was first assessed by enzymelinked immunosorbent assay (ELISA). Most of the samples positive for toxin were obtained during the first 9 h of infection (Fig. 4C). We found the luminal contents to have higher detectable toxin levels than the organ tissues when we measured absolute values versus a positive control in a subset of samples (p ~ 0.002) (Fig. 4D). Furthermore, we saw the highest detectable levels of toxin in the large intestinal contents (p ~ 0.006). In general, the locations where we found higher toxin levels corresponded to intestinal sites that had the highest numbers of recoverable organisms (compare Figs. Fig. 2 and 4C). To ensure that the positive results we obtained by ELISA were due to Stx2, we evaluated a subset of the samples for Stx2 by a neutralization assay (not shown). The findings in the neutralization assay and the ELISA were similar: toxin was most readily detectible early in infection and within the contents of the organs tested (the cecum and large intestine).
134 K.L Mohawk ec aL 1 Microbial Pathogenesis 48 (2010) JJJ-142
A 1010
109
~ 108
~ 107 f/) f/)
106 ;:; C) 105 ..... ::»
1()4 LL 0
103
102
101
B 1010 f/) c 1()9 G) c 1()8 8 107
Ci 106 c: E 105
.a 104
0) 103 -::>
LL 1()2 0
101
Hour post-infection
Hour post-infection
Fig. 2. Levels of E. coli 0157:H7 over time at different sites in the gastrointestinal tract of BALB/c mice orally infected with 6-8 x to& CFU of strain 86-24Nal1
• The GM CFU/g tissue (A) or luminal contents (B) from groups of 8-17 mice each are shown for the tissue of the small intestine ( e), cecum ( A ), and large intestine ( ~) as well as the luminal contents of the small intestine ( o ), cecum ( t:. ), and large intestine <0 ). Bars indicate the 95% confidence interval.
2.4. Systemic effects of infection
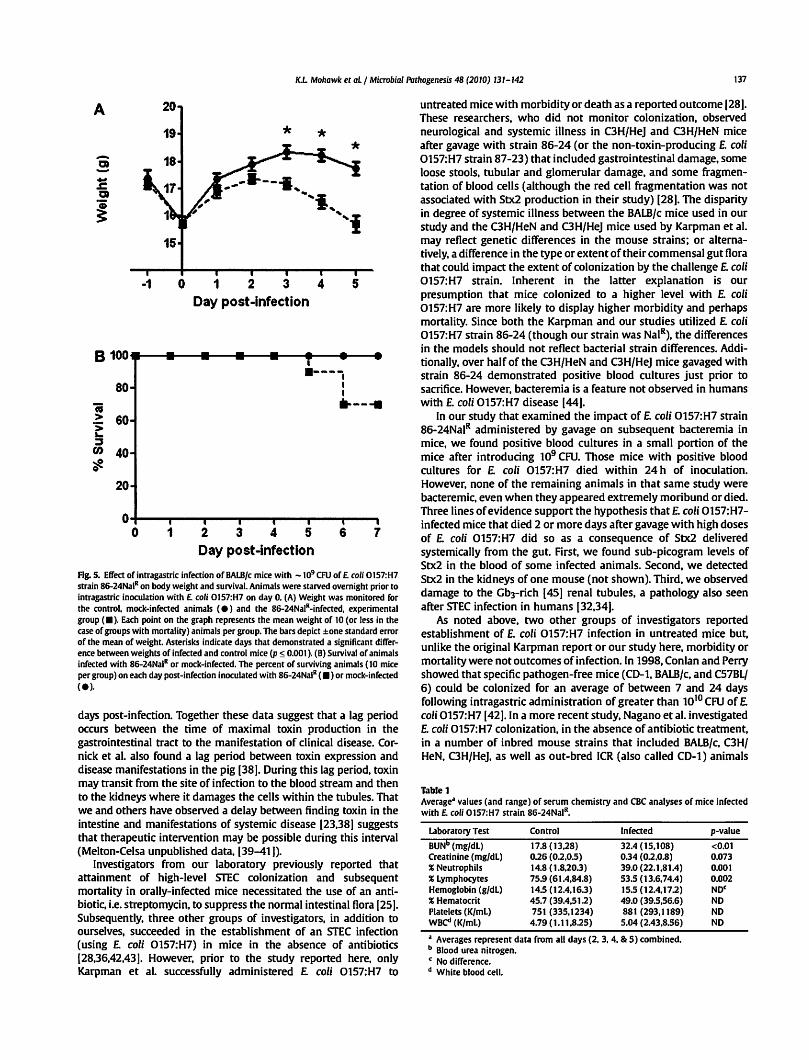
Over the course of longer infections, we noticed that a proportion of the animals that were fed 86-24NalR exhibited signs of illness (hunched posture, ruffled fur. lethargy, tremors, etc.) and succumbed to infection. To more closely examine the systemic effects of E. coli 0157:H7 infection in mice with an ICF, groups of animals were infected by gavage with 109 CFU and monitored both for weight loss (indicative of illness) and death. We elected to use gavage for infection because we wanted to increase the likelihood that all animals would be colonized. All animals demonstrated a drop (about 1.5 g) in weight from day -1 to day 0, a phenomenon we ascribed to overnight deprivation of food prior to infection (Fig. SA). However, the mice returned to near pre-infection weights at day 1 of infection after they were permitted access to food and water ad libitum. In fact, even after E. coli 0157:H7 inoculation, all animals gained weight between days 1 and 2. After day 2 of infection, there was a statistically significant divergence in weight of the control and infected animals. Indeed, the control mice continued to gain weight until day 3 when, as a group, their weight plateaued and remained steady at around 18 g. Conversely, the experimental group started to lose weight after day 2 post-infection and weighed significantly less than did the control mice on days 3-5 post-infection (p:::; 0.001; Fig. SA). Moreover, infected
mice that demonstrated large amounts of weight loss succumbed to infection on days 5 and 6 post-E. coli 0157:H7 challenge. In this experiment, 30% of the infected mice died, and, as expected, all control mice survived (Fig. 58).
We then asked whether the mouse mortality seen after intragastric administration of E. coli 0157:H7 could have resulted from bacteremia following gavage. To address this question, 20 mice were infected with 109 CFU of 86-24NalR intragastrically and monitored for mortality and the development of bacteremia. At 6 h post-infection, blood was taken from each mouse and assessed for the presence of circulating bacteria. Five of the animals demonstrated the presence of bacteria in their blood. These same five animals died by 24 h post-infection. The remaining mice were divided into two groups: a group to check for the presence of bacteremia on days 2 and 4 post-infection and a mortality group. The animals examined for bacteremia on day 2 post-infection demonstrated no detectable bacteria in their blood. Two animals from the bacteremia-assessment group were sacrificed on day 3 because they were moribund. These latter two animals had symptoms of disease that included neurological manifestations (ataxia, tremor, and convulsions), yet had no detectable bacteria in their blood. The final two animals from the bacteremia-assessment group were sacrificed on day 4 and were not bacteremic. In the mortality group, animals lost weight over time; furthermore, deaths (4/7 mice or 57% mortality) occurred on days 4 and 5 postinfection. All of the animals in the mortality group that succumbed to infection were free of circulating bacteria in their blood as determined post-mortem. Thus, bacteremia was not seen, even in extremely moribund mice, after the first day of infection. Moreover, in a second study using a lower inoculum (-5 x 10⁸ CFU 86-24NalR), no bacteremia was detected in any of the mice at 6 h postinfection. In this latter study, the bacteremia-assessment group also had no detectable bacteria in the blood at day 2 or 4. The mortality group had a 20% death rate with no evidence of bacteremia 6 h following gavage or post-mortem. We concluded that at high challenge doses of 86-24NalR given by gavage, animals that succumb after day 2 post-infection are not dying as a consequence of bacteremia.
Since we observed deaths in mice infected by gavage with high doses of86-24NalR in the absence of bacteremia, we speculated that this mortality was due to Stx2 produced by E. coli 0157:H7 in the gut. Indeed, we have shown that streptomycin-treated mice that would normally die after oral STEC infection remain healthy if passively treated with neutralizing anti-Stx2 antibodies [25,27,28). Here, we sought to demonstrate the central role of toxin in lethality after E. coli 0157:H7 infection in an ICF model by assaying for the presence of Stx2 in the blood of animals gavaged with 109 CFU of 86-24NalR. However, blood taken from animals that were infected with E. coli 0157:H7 showed either no detectable toxin or sub-picogram levels of toxin (found in the blood of 2/15 mice). We next asked if it was possible to detect intravenously (IV) administered Stx2 in the blood of uninfected mice. We found that it was necessary to administer 100-1000 LD50s ( 100-1000 ng) of Stx2 in order to detect toxin in blood taken from mice 2 h post-intoxication. The amount of Stx2 detected in the blood from these highly intoxicated animals was 0-17 pg per 0.1 mL Therefore, we surmised that the reason we did not detect Stx2 in the blood of more than 2 infected mice is most likely because the levels of toxin in the blood were below 17 pg/0.1 mL
To further examine£. coli 0157:H7 pathogenesis in mice with an ICF, animals were sacrificed on various days post-infection, blood was collected, and kidneys were surgically removed. Sera were analyzed for blood urea nitrogen (BUN) and creatinine levels, and whole blood samples were used to determine complete blood counts (CBCs, Table 1 ). When compared to the uninfected controls, E. coli 0157:H7-infected mice showed significantly higher BUN
K.L. Mohawk et al.f Microbial Pathogenesis 48 (2010) 131-142 135
Fig. 3. Jmmunonuorescent f . coli 0157:H7 in the cecum. Mice were infected with f. coli 0157:H7 (A-F) or mock-infected (G-1) for 6 h. Images display infected or control ceca stained for 0157 (A. D. G), the phase contrast image of the cecal section (B. E. H), and the merged images (C, F. 1). Panels D, E. and Fare a higher magnification of the boxed area of panel B. For panels A-C and panels G-1 the original image was obtained at a magnification of 40x. For panels D-F the original image was obtained at a magnification of IOOx.
(p < 0.01) values and higher, but not statistically significant, creatinine levels (p = 0.07) over the course of infection. The greatest elevations in these kidney function va lues were seen in animals sacri ficed on days 4 and 5 (individual day data not shown). However, none of the key hematological features of HUS were apparent in the infected animals. Specifically, no differences in platelets, hemoglobin, or hematocrit values were noted between infected and control mice. Nevertheless, significant neutrophilia (p = 0.001) was apparent in the blood samples of the experimenta l group compared to the controls (Table I ). In fact, as early as day 2 following infection, the blood of infected mice showed an increase in percentage of neutrophils that was evident throughout the experiment (days 2, 3, 4, and 5) w ith differences of up to 4-fold compared to controls (data not shown).
We then examined the histopathology of the kidneys from the E. coli 0157:H7-infected and control animals w hose blood samples were assayed as above. We found no evidence in any of the kidney sections from infected or control mice of lesions in the renal glomeruli (as assessed by H&E stain). or fibrin deposits in the glomerular capillaries or interstitial vessels [as evaluated by Mallory's phosphotungstic acid hematoxylin (rTAH) or a modified Carstair's stain]. Additionally, we probed the kidney sections for the presence of Stx2. While we detected toxin in the kidney by immunofluorescence (IF) in one mouse that died following infect ion (not shown), that result was not duplicated in a second, moribund an imal. That we found only minute amounts of circulating toxin in the blood also suggests that the quantity of Stx2 present for detection by IF in the kidneys is quite small. In contrast
\
136 K.L Mohawk rr a/. 1 Microbial f'flc/Jogenesis 48 (20/0) 13l- l42
A IZO c 110
100 100
~
i 80 > 80 i
~ 60 . 'ii.
~ lO
0 ,. zo
; •o .. ~ 10
.I . ~ 20
fl.~ .121 ll 18 12
Hour pon-infectton tiour po~t~nhc-llon
8 100000 D 1000
... ag 0 0 'ii. 10000 0 0 ! 100 oo ~
oo o8
~ 8 8
o O 6 0 .. 0 .. 0
Mtmnim ~ 0 i 0
0 0 e 1000 e 10 o o -;; . 0 0 !
_
0
Atl .. mmm ... 0
100 , " ll rz 24 II 12
Hour post-lnfKrion Hour post.mr~don
Fig. 4. Presence of intimin and Srx2 over time at different sites in the gastrointestinal tracts of BALB/c mice orally infected with E. coli 0 !57:H7 strain 86-24Nal". (A) l' ercent of different intestinal samples positive for intimin over time. Each bar represents the me.m of 8- 17 samples tested. For panels A- D. the tissues are represented by bl,lck bars (cecum), white b,m (cecal contents). h.ltched bars (l.uge intestines). and gray bars (large intestin.11 contents). (B) Levels of inti min in different intestinal sites over time. Each bar represents the mean value of a subset of those samples presented in panel A (n = 5- 10). The limit of quantifia ble intimin was 360 ng/g tissue or tissue contents. For panels B .md D. each individual sample is represented by a o . (C) Percent of different intestinal samples positive for Stx2 over time. Each bar represents the mean of 7- 16 samples tested. (D) Levels of Stx2 in different intestinal sites over time. Each bar represents the mean value of a subset of those samples presented in panel C (n = 5- 10). The limit of quantifiable Stx2 was 6.4 ng/g tissue or tissue contents.
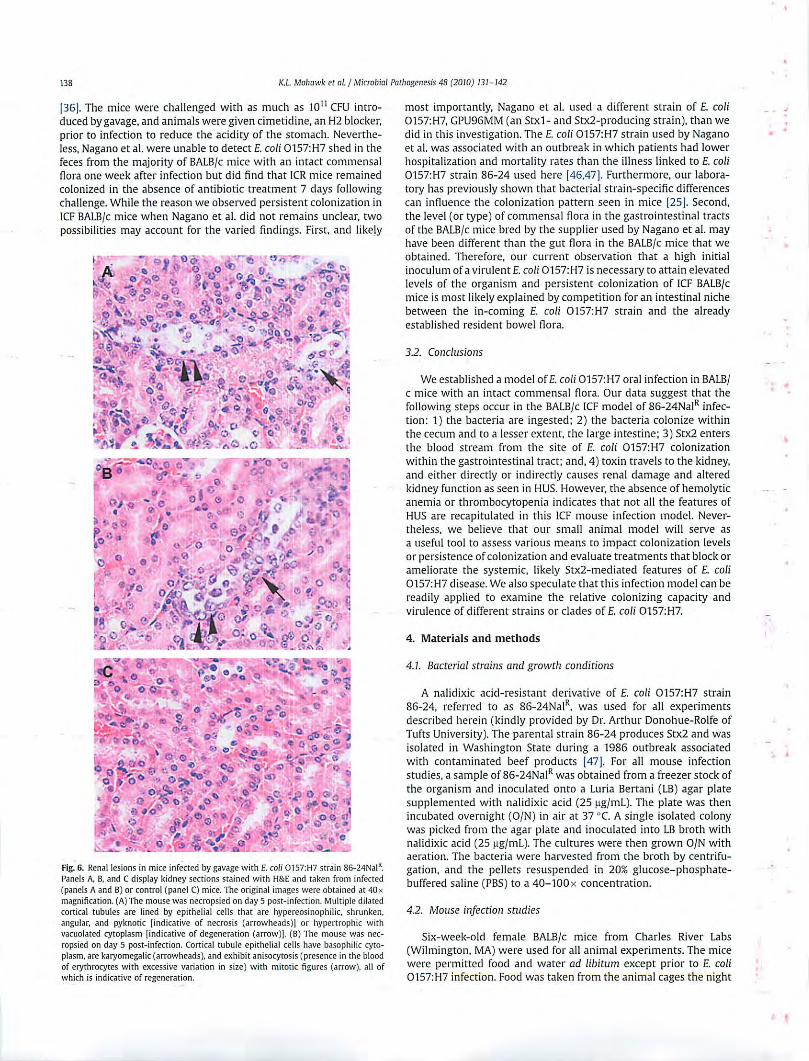
to the lack of glomerular changes in infected animals, histological evidence of injury to proximal and distal convoluted tubules was noted in kidneys from infected animals (Fig. 6A and B) but not in kidneys from control mice (Fig. 6C). Indeed. kidneys from several infected mice exhibited acute to subacute, multifocal, minimal to mild tubule degeneration, small amounts of epithelial necrosis. and varying degrees of regeneration.
3. Discussion and conclusions
3.1. Discussion
In this investigation. we developed a model of E. coli 0157:H7 intestinal colonization and disease in BALB/c mice with an ICF. Although a large dose of E. coli 0157:H7 was required in this murine model, high inocula of these organisms are also needed to achieve colonization and disease in monkeys [29] and rabbits [30]. Our data suggested that the predominate site of E. coli 0157:H7 colonization was the cecum, although numerous challenge bacteria were also culturable from the cecal and large intestinal contents. Furthermore, mice challenged intragastrically with 109 E. coli 0157:H7 often displayed such manifestations of disease as lethargy and weight loss, neutrophilia and increased levels of BUN. Moreover. about 30% of animals inoculated w ith E. coli 0157:H7 by the intragastric route died. Finally. we observed evidence of tubulJr regeneration and some tubular damage in the kidneys of infected mice. We interpreted these findings to mean that damaged tubules were in the process of repa ir. Of note, tubular damage, in addition to signature glomerular lesions [17,3 1]. has been seen in kidney sections from patients with HUS [32-34]. Furthermore, tubular necrosis and subsequent regeneration were described by Tesh et at. in mice that died after toxin administration ]35].
The large numbers of E. coli 0157:H7 strain 86-24NatR found in the cecum, cecal contents. and large intestinal contents of
infected mice support the hypothesis tha t these organisms colon ize the cecum and are then shed in to the cecal contents before they pass into the large intestinal contents, where they are ultimately bound in fecal material and expelled. These results in aggregate indicate that the Cf'U/g feces fo rmed from the contents of the large bowel most li kely reflect the extent of organism replication in the cecum of the animal. This theory is consistent w ith the suggestion in the report by Nagano e t al. that E. coli 0157:H7 found in the large intestines and feces are shed from bacteria ad herent in the cecum [36].
In addition to identifying the site of E. coli 0157:H7 colonization in the ICF model. we detected intimin in the same areas as the bacteria early during in vivo infection but not readily thereafter. This pattern could have reflected down-regulation of intimin expres sion in vivo. as has been documented for the expression of in timin in vitro by a related organism, enteropathogenic E. coli (EPEC) [37 [. However, because we also observed a significant decrease in bacterial numbers over this same time period, we could not ascertain whether E. coli 0157:H7 intimin was down-regulated in vivo or if the reduced bacterial load meant that the intimin levels fell below the limit of detect ion for our ELISA.
As was seen with inti min. we observed the highest levels ofStx2 early in E. coli 0157:H7 infection. and were only occasionally able to detect toxin in intestinal samples taken later during infection when total recoverable bacterial counts were low. Thus, our inability to detect toxin later in infection probably reflects the reduced bacterial numbers at that time in infection. Cornie!< et al. obse!Ved a similar phenomenon when they assessed colonization and toxin production within the small intestines of swine infected with an STEC [38]. They found the highest toxin titers when the greatest number of STEC were present in the ileum. In our study, the mice manifested systemic effects of disease. such as sign ificant weight loss, despite the lower levels of toxin detected after 9 h of infection. Additionally, mortaliry in infected animals did not occur until 3-6
K.L Mohawk ec aLI Microbial Pathogenesis 48 (2DlD) l3l-l42 137
A
* * *
-•--.. •"" ' ....... i, ''i
-1 0 1 2 3 4 5 Day post-Infection
B 100 • ·----1 80 I
I
Ci ·---tl > 60 > ._ ~ 0 40 ~ 0
20
0 0 1 2 3 4 5 6 7
Day post-infection
Ag. 5. Effect of intragastric infection of BALB/c mice with -1~ CFU of£ coli ot57:H7 strain 86-24NaiR on body weight and survival. Animals were starved overnight prior to intragastric inoculation with £ coli ot57:H7 on day 0. (A) Weight was monitored for the control, mock-infected animals (e) and the 86-24NaiR-infected, experimental group <•>· Each point on the graph represents the mean weight of 10 (or less in the case of groups with mortality) animals per group. The bars depict ±one standard error of the mean of weight. Asterisks indicate days that demonstrated a significant difference between weights of infected and control mice (p ~ 0.001 ). (B) Survival of animals infected with 86-24NaiR or mock-infected. The percent of surviving animals ( 10 mice per group) on each day post-infection inoculated with 86-24NaiR ( •) or mock-infected
<•>·
days post-infection. Together these data suggest that a lag period occurs between the time of maximal toxin production in the gastrointestinal tract to the manifestation of clinical disease. Cornick et al. also found a lag period between toxin expression and disease manifestations in the pig (38]. During this lag period, toxin may transit from the site of infection to the blood stream and then to the kidneys where it damages the cells within the tubules. That we and others have observed a delay between finding toxin in the intestine and manifestations of systemic disease (23,38] suggests that therapeutic intervention may be possible during this interval (Melton-Celsa unpublished data, [39-41 ]).
Investigators from our laboratory previously reported that attainment of high-level SfEC colonization and subsequent mortality in orally-infected mice necessitated the use of an antibiotic, i.e. streptomycin, to suppress the normal intestinal flora (25]. Subsequently, three other groups of investigators, in addition to ourselves, succeeded in the establishment of an SfEC infection (using E coli 0157:H7) in mice in the absence of antibiotics (28,36.42.43]. However, prior to the study reported here, only Karpman et al. successfully administered E coli 0157:H7 to
untreated mice with morbidity or death as a reported outcome (28]. These researchers, who did not monitor colonization, observed neurological and systemic illness in C3H/Hej and OH/HeN mice after gavage with strain 86-24 (or the non-toxin-producing E. coli 0157:H7 strain 87-23) that included gastrointestinal damage, some loose stools, tubular and glomerular damage, and some fragmentation of blood cells (although the red cell fragmentation was not associated with Stx2 production in their study) (28]. The disparity in degree of systemic illness between the BALB/c mice used in our study and the OH/HeN and OH/Hej mice used by Karpman et al. may reflect genetic differences in the mouse strains; or alternatively, a difference in the type or extent of their commensal gut flora that could impact the extent of colonization by the challenge E. coli 0157:H7 strain. Inherent in the latter explanation is our presumption that mice colonized to a higher level with E. coli 0157:H7 are more likely to display higher morbidity and perhaps mortality. Since both the Karpman and our studies utilized E coli 0157:H7 strain 86-24 (though our strain was NaiR), the differences in the models should not reflect bacterial strain differences. Additionally, over half of the C3H/HeN and C3H/Hej mice gavaged with strain 86-24 demonstrated positive blood cultures just prior to sacrifice. However, bacteremia is a feature not observed in humans with E. coli 0157:H7 disease (44].
In our study that examined the impact of E. coli 0157:H7 strain 86-24NaiR administered by gavage on subsequent bacteremia in mice, we found positive blood cultures in a small portion of the mice after introducing 109 CFU. Those mice with positive blood cultures for E. coli 0157:H7 died within 24 h of inoculation. However, none of the remaining animals in that same study were bacteremic, even when they appeared extremely moribund or died. Three lines of evidence support the hypothesis that E. coli 0157:H7-infected mice that died 2 or more days after gavage with high doses of E. coli 0157:H7 did so as a consequence of Stx2 delivered systemically from the gut. First, we found sub-picogram levels of Stx2 in the blood of some infected animals. Second, we detected Stx2 in the kidneys of one mouse (not shown). Third, we observed damage to the Gb3-rich (45] renal tubules, a pathology also seen after SfEC infection in humans (32,34].
As noted above, two other groups of investigators reported establishment of E. coli 0157:H7 infection in untreated mice but, unlike the original Karpman report or our study here, morbidity or mortality were not outcomes of infection. In 1998, Conlan and Perry showed that specific pathogen-free mice (CD-1, BALB/c, and C57BL/ 6) could be colonized for an average of between 7 and 24 days following intragastric administration of greater than 1010 CFU of E. coli 0157:H7(42].1n a more recent study, Nagano et al. investigated E. coli 0157:H7 colonization, in the absence of antibiotic treatment, in a number of inbred mouse strains that included BALB/c, OH/ HeN, C3H/Hej, as well as out-bred ICR (also called CD-1) animals
Table 1 Average~ values (and range) of serum chemistry and CBC analyses of mice infected with E. coli ot57:H7 strain 86-24NaiR.
Laboratory Test
BUN6 (mgfdl) Creatinine (mg/dl) % Neutrophils % Lymphocytes Hemoglobin (g/dL) % Hematocrit Platelets (K/ml) WBc<l (K/ml)
Control
17.8 (13.28) 0.26 (0.2,0.5) 14.8 (1.8.203) 75.9 (61.4,84.8) 145 (12.4,163) 45.7 (39.4,51.2) 751 (335,1234) 4.79 ( 1.11,8.25)
Infected
32.4 (15,108) 034 (0.2,0.8) 39.0 (22.1,81.4) 53.5 (13.6,74.4) 15.5 (12.4,17.2) 49.0 (39.5,56.6) 881 (293,1189) 5.04 (2.43,8.56)
a Averages represent data from all days (2, 3, 4, & 5) combined. b Blood urea nitrogen. ' No difference. d White blood cell.
p-value
<0.01 0.073 0.001 0.002 NO' NO NO NO
138 K.L Mohawk et al. I Microbial Pathogenesis 48 (2010) 131-142
[36 [. The mice were challenged with as much as 1011 CFU introduced by gavage, and animals were given cimetidine, an H2 blocker, prior to infection to reduce the acidity of the stomach. Nevertheless, Nagano et al. were unable to detect E. coli 0157:H7 shed in the feces from the majority of BALB/c mice with an intact commensal flora one week after infection but did find that ICR mice remained colonized in the absence of antibiotic treatment 7 days following challenge. While the reason we observed persistent colonization in ICF BALB/c mice when Nagano et al. did not remains unclear. two possibilities may account for the varied findings. First. and likely
Fig. 6. Renal lesions in mice infected by gavage with£. coli 0157:H7 strain 86-24Nal". Panels A. B. and C display kidney sectio ns stained with H&E and taken from infected (panels A and B) or control (panel C) mice. The original images were obtained at 40x magnification. (A) The mouse was necropsied on day 5 post-infection. Multiple dilated cortical tubules a re lined by epithelial cells that are hypereosinophilic, shrunken, .mgular. and pyknotic !indicative of necrosis (arrowheads)! or hypertrophic with vacuolated cytoplasm (indicative of degeneration (arrow)j. (B) The mouse was necropsied on day 5 post-infection. Cortical tubule epithelial cells have b,1sophilic cytoplasm. are karyomegalic (arrowheads), and exhibit anisocytosis (presence in the blood of erythrocytes with excessive variation in size) with mitotic figures (arrow), all of which is indicative of regeneration.
most importantly, Nagano e t al. used a different strain of E. coli 0157:H7, GPU96MM (an Stxl- and Stx2-producing strain), than we did in this investigation. The E. coli 0157:H7 strain used by Nagano et al. was associated with an outbreak in which patients had lower hospitalization and mortality rates than the illness linked to E. coli 0157:H7 strain 86-24 used here [46.47 [. Furthermore, our laboratory has previously shown that bacterial strain-specific differences can influence the colonization pattern seen in mice [25[. Second. the level (or type) of commensal flora in the gastrointestinal tracts of the BALB/c mice bred by the supplier used by Nagano et al. may have been different than the gut flora in the BALB/c mice that we obtained. Therefore, our current observation that a high initial inoculum of a virulent E. coli 0 157:H7 is necessary to attain elevated levels of the organism and persistent colonization of ICF BALB/c mice is most li kely explained by competition for an intestinal niche between the in-coming E. coli 0157:H7 strain and the already established resident bowel flora.
3.2. Conclusions
We established a model of E. coli 0157:H7 oral infection in BALB/ c mice with an intact commensal flora. Our data suggest that the fo llowing steps occur in the BALB/c ICF model of 86-24NaJR infection: 1) the bacteria are ingested; 2 ) the bacteria colonize w ithin the cecum and to a lesser extent. the large intestine; 3) Stx2 enters the blood stream from the site of E. coli 0157:H7 colonization within the gastrointestinal tract; and, 4) toxin travels to the kidney, and either directly or indirectly causes renal damage and altered kidney function as seen in HUS. Howeve r. the absence of hemolytic anemia or thrombocytopenia indicates that not all the features of HUS are recapitulated in this ICF mouse infection model. Nevertheless. we believe that our small animal model will serve as a useful tool to assess various means to impact colonization levels or persistence of colonization and evaluate treatments that block or ameliorate the systemic, likely Stx2-mediated features of E. coli 0 157:H7 disease. We also speculate that this infection model can be readily applied to examine the relative colonizing capacity and virulence of different strains or clades of E. coli 0157:H7.
4. Materials and methods
4.1. Bacterial strains and growth conditions
A nalidixic acid-resistant derivative of E. coli 0157:H7 strain 86-24, referred to as 86-24NalR. was used for all experiments described herein (kindly provided by Dr. Arthur Donahue-Rolfe of Tufts University). The parental strain 86-24 produces Stx2 and was isolated in Washington State during a 1986 outbreak associated with contaminated beef products [47[. For all mouse infection studies, a sample of 86-24NaiR was obtained from a freezer stock of the organism and inoculated onto a Luria Bertani (LB) agar plate supplemented w ith nalidixic acid (25 l!g/mL). The plate was then incubated overnight (0/N) in ai r at 37 oc. A single isolated colony was picked from the agar plate and inoculated into LB broth with nalidixic acid (25 l!g/mL). The cultures were then grown 0 /N with aeration. The bacteria were harvested from the broth by centrifugation, and the pellets resuspended in 20% glucose- phosphatebuffered saline (PBS) to a 40- 100 x concentration.
4.2. Mouse infection studies
Six-week-old female BALB/c mice from Charles River Labs (Wilmington. MA) were used for all animal experiments. The mice were permitted food and water ad libitum except prior to E. coli 0157:H7 infection. Food was taken from the animal cages the night
K.L Mohawk et aLI Microbial Pathogenesis 48 (2010) 131-142 139
before bacterial challenge. Water bottles were removed from the cages 2 h prior to infection of the mice. Following infection, access to food and water was restored.
42.1. Experimental series #1 Dose-response studies were done to determine the optimal
infectious dose of 86-24NaiR required to permit sustained E .coli 0157:H7 colonization of mice over 7 days. Groups of 5-10 animals were inoculated by intragastric administration, also referred to as gavage, with approximately 105,106,107,108, or 109 colony forming units (CFU) of strain 86-24NaiR in 100 J.1L In a second set of studies, animals were orally infected by pipette feeding 108 or 109 CFU of bacteria. Pipette feeding (where animals were allowed to ingest the bacterial suspension by lapping the liquid from the end of a micropipette tip) was done in two rounds of 50 JlL each with 2 h between feedings to facilitate ingestion of the complete dose. The extent of bacterial colonization was monitored daily for 7 days by quantitation of the E. coli 0157:H7 shed into fecal pellets. For that purpose, animals were placed individually into clean, empty cages, allowed to defecate, and the feces collected and weighed. The fecal material was diluted 1 :10 by weight into PBS then homogenized by mechanical disruption with a sterile wooden stick. Large debris was pelleted by brief centrifugation at 1750 x g with an International Equipment Company clinical centrifuge (IEC Model CL. Damon IEC Division, Needam Hills, MA). The supernatants were diluted and plated onto Sorbitol MacConkey Agar (SMAC) plates supplemented with nalidixic acid (SMAC +Nat, 25 Jlg/mL) to determine CFU/g feces. Reported values represent the geometric mean (GM) of 5 or more animals per group.
422. Experimental series #2 Short-term infection studies were conducted to monitor levels
of E. coli 0157:H7 at various intestinal sites after challenge and to obtain organs for immunostaining studies. Animals were orally infected by pipette feeding of 50 J.1L containing 6-8 x 10⁸ CFU of strain 86-24NaiR in three separate experiments. Control animals (generally 1 per time-point per experiment, with the exception that an additional control animal was required for the immunostaining experiments) were orally administered 20% glucosePBS alone by pipette feeding. Groups of infected mice and control animals were anesthetized in isoflurane and euthanized by cervical dislocation at 3, 6, 9, 24, 48, and/or 72 h after infection or buffer inoculation. Whole organs (cecum and kidneys) from at least one infected animal and one control animal at each timepoint were removed and fixed in Formalde-Fresh (10% buffered formalin, Fisher Scientific, Pittsburgh, PA), then sectioned, placed on slides, and immunostained for detection of 0157 (described in Section 4.5 below). In addition, the cecum, large intestine, and a terminal section of the small intestines equal in length to that of the large intestine were surgically removed from the infected and control animals at each time-point. The luminal contents were then removed from each organ by application of gentle pressure to the outside of the tissue to expel the internal material. Both the luminal contents and the organs were weighed and homogenized separately (Omni hand-held homogenizer) in 0.5 mL of PBS. The homogenates were then diluted (final dilution of1:10 by weight) and samples were plated on SMAC+ Nal plates for enumeration of CFU. An aliquot of each diluted homogenate was also treated with a protease inhibitor (complete, Mini, EDTAfree, Roche Applied Science, Indianapolis, IN) and stored at -20 oc for subsequent analyses of inti min and Stx2 expression as detailed below in Sections 4.3 and 4.4. Values for bacterial counts were reported as the combined GM from all experiments and represent a total of 8 or more (up to 17) animals per time-point analyzed.
42.3. Experimental series #3 For this multi-tiered investigation, mice were divided into 4
groups. Group A included infected experimental animals for blood work and tissue harvest (n = 25). Group 8 contained uninfected control mice for blood work and tissue harvest (n = 20). Group C consisted of infected experimental mice for morbidity studies (n = 10); and, group D was comprised ofuninfected controls for the morbidity study (n = 10). E. coli 0157:H7 counts in shed feces were tracked after intragastric administration of a concentrated culture of strain 86-24NaiR in 20% glucose to groups A and C. or 20% glucose to groups 8 and D. Animal weights were measured as an indicator of morbidity in all groups. Based on colonization levels and weight loss, five animals were selected on each of days 2, 3, 4, and 5 from the experimental group A, as well as five animals per day from the control group B. Blood was collected from these mice by exsanguination and placed into either microtainer tubes that contained potassium ethylenediaminetetraacetic acid (EDTA, BD diagnostics, Franklin Lakes, NJ) for CBC evaluation or into microcentrifuge tubes to process to obtain sera for kidney function analyses. For the latter purpose, blood in each microcentrifuge tube was first allowed to clot 0/N at 4 oc. The tubes were then subjected to two consecutive 10 min centrifugation steps at 8000 x g then ~ 10,000 x g to separate the serum from the clotted red cells. Serum samples were stored at 4 oc until they could be analyzed by the Uniformed Services University of the Health Sciences (USUHS) Diagnostic Services & Comparative Medicine Clinical Pathology laboratory (Bethesda, MD) for levels of blood urea nitrogen (BUN) and creatinine. Whole blood samples for determination of complete blood counts (CBC) were similarly stored and evaluated by the same facility.
The animals from which blood was obtained as above were then sacrificed by cervical dislocation. Their kidneys were removed at necropsy. These organs were then placed in the fixative Carney (60% ethanol, 10% glacial acetic acid, 30% chloroform) for 2 h or Formalde-Fresh overnight, and then transferred to 70% ethanol for subsequent histopathological examination (described in Section 4.5 below).
42.4. Experimental series #4 The possibility that deaths of mice infected with high doses of
86-24NaiR by gavage may have occurred as a consequence of bacteremia induced by the procedure was evaluated. For those assessments two different infecting doses were used and two evaluation groups (blood evaluation and mortality assessment) were defined with 10 animals in each group. The mice were infected with -2 x 10⁹ CFU (groups A and B) or -5 x 10⁸ CFU (groups C and D) of 86-24NaiR by gavage. Six hours post-inoculation blood was collected from the tail vein of all of the mice to test for bacteremia. On days 2 and 4 post-infection, five animals from the blood evaluation groups (Band D) were anesthetized in isoflurane and sacrificed by cervical dislocation. Blood was collected directly from the heart by cardiac puncture, and assessed for the presence of bacteria. On a few occasions, no blood was recovered by cardiac puncture and, in those instances, blood was taken from the thoracic cavity or the heart was cut open and the tissue smeared onto SMAC + Nal plates. The mortality groups (A and C) were followed for 10 days and upon death, blood and/or heart tissue was examined for bacteremia. If an animal appeared severely moribund, it was immediately sacrificed. Blood collected from each mouse (1-10 J.1L) was inoculated into LB broth that contained nalidixic acid. The broth was grown for 48 h statically at 37 oc and tested daily for the presence of bacteria by subculture onto SMAC + Nat plates. Additionally, the broth was visually assessed for turbidity. Blood (from the cardiac puncture or directly from the heart) was also plated directly on SMAC + Nal plates and grown overnight at 37 oc.
140 K.L Mohawk et aLI Microbial Pathogenesis 48 (2010) 13J-l42
42.5. Experimental series #5 Prior to infection, blood was obtained by tail bleed and collected
into tubes containing heparin or lithium and heparin. Mice were infected by gavage with 1.9 x 10⁹ CFU of 86-24NalR. Colonization and weight were monitored. A group of mice (n = 10) were followed for mortality. A separate group of mice (n = 15) were sacrificed on days 4 and 5 post-infection with blood taken by retroorbital eye bleed. The method used to test blood samples for toxin was Meridian's Premier EHEC enzyme-linked immunosorbent assay (ELISA) kit (as detailed in Section 4.4 below). Blood cells were gently lysed by 3 rounds of freezing at -80 oc and thawing at 37 oc prior to use in the EUSA. This procedure was selected because we found in preliminary studies that blood, neat or diluted 1 :50, interfered with interpretation of the Vera cell cytotoxicity assay, another test for Stx activity (described in Section 4.4, below). The amount ofStx2 present in the blood was quantitated by comparison to a standard curve generated by adding purified Stx2 into whole mouse blood and gently lysing the blood/toxin mixture.
To determine the amount of Stx2 in the blood necessary for a positive result in the ELISA, groups of mice (n = 2) were administered purified Stx2 intravenously (IV). Prior to infection, blood was obtained by tail bleed and collected into tubes containing heparin or lithium and heparin. The groups then received 1, 10, 100, or 1000 LDsos ofStx2 (corresponding to 1 ng, 10 ng, 100 ng, or 1 Jlg of Stx2). Two hours post-injection, blood was collected from the mice by tail bleed. Lysed blood was tested for toxin using Meridian's Premier EHEC EUSA kit (as described above).
4.3. Detection of intimin by ELISA
A sandwich ELISA was developed to detect intimin in homogenates (see Section 4.2.2) of the cecum, large intestine, or contents of those organs from 86-24NalR-infected mice. The capture antibody in the assay was a goat monospecific anti-£. coli 0157:H7 intimin antibody that had been purified from polyclonal goat anti-intimin sera [48] by affinity chromatography over a column prepared by coupling full length, purified intimin to Pierce Ultralink Biosupport resin (Thermo Fisher Scientific, Rockford, IL) per the manufacturer's protocol. For the ELISA assay, wells of an lmmulon 2HB (Thermo Scientific, Waltham, MA) high-binding microtiter plate were coated overnight at 4 oc with 100 J.1L of a 1:50 dilution of affinity-purified monospecific goat anti-intimin antibody in a buffered solution of sodium bicarbonate/sodium carbonate. Next. 200 Jll of 5% bovine serum albumin (BSA) in PBS-Tween 0.05% (PBST) was added to each well to block unbound sites on the wells, and the plates were incubated at 4 oc for at least 24 h. The wells were washed 4-6 times with PBST and then homogenate samples (further diluted 1:2 from the original 1:10 dilution for a final dilution of 1 :20) were added to the wells. The plates were incubated for 2 h at 37 oc, and the wells were then washed as above to remove any unbound sample. lntimin present within the homogenate and bound to the goat anti-intimin capture antibody was detected by incubation for 1 hat room temperature with 100 J.1L of each of the following reagents in sequence with wash steps between each addition: a 1:5000 dilution of rabbit anti-intimin polyclonal antibody [48] followed by a 1:5000 dilution of horse radish peroxidase (HRP)-labeled donkey anti-rabbit lgG (H + L) antibody that was reported by the supplier Uackson lmmunoResearch Laboratories, Inc., West Grove, PA) to display minimal cross reactivity with sera from other species of animals. Bound antibody was detected with a 3,3',5,5'-tetramethylbenzidine (TMB) peroxidase enzyme immunoassay (EIA) substrate kit (Bio-Rad Laboratories, Hercules, CA) according to the manufacturer's protocol. The reaction was stopped with 100 J.1L of 1 N sulfuric
acid, and each well was read at an optical density (OD) of 450 nm on a spectrophotometric plate reader. An infected tissue or tissue content homogenate sample was considered to be positive for intimin if it had an optical density reading twice that of the average value for all the uninfected control tissue and tissue content homogenate samples. Quantitative values for intimin in samples from one of the three experiments were derived from a standard curve constructed from ELISA values of dilutions of purified intimin spiked into control tissue homogenates. The limit of detection for the analysis was 360 ngfg tissue.
4.4. Stx assay procedures: ELISA, Vera cell cytotoxidty, and neutralization of activity assays
A commercially-available ELISA kit (Premier EHEC ELISA, Meridian diagnostics, Cincinnati, OH) was used to detect Stx2 in homogenates (see Section 4.2.2) of the ceca, large intestines, or contents of those organs from 86-24NalR-infected mice. The EUSA kit was used according to the manufacturer's protocol with the following modifications: homogenates were diluted 1:2 in PBS (for a final dilution of 1 :20) and then added directly to the EUSA. A sample was considered to be positive for Stx2 if it had an optical density reading twice the average value of the control tissues in aggregate. Stx2 levels in samples from one of the three experimental sets were determined based on a standard curve of purified toxin spiked into control tissue homogenates. In our hands, the limit of detection for quantitation with this assay was 6.4 ng toxin/g sample homogenate.
The presence of toxin in a subset of those samples was confirmed with a biological activity assay (Vera cell cytotoxicity and neutralization assay). To measure neutralizable toxin within the samples, a 1:100 final dilution of each homogenate was prepared in PBS and the diluted samples were then clarified at 8000 x g for 10 min. The resultant supernatants were filtered first through a 0.8 Jlm or 0.45 Jlm syringe filter and then through a 0.2 Jlm low-protein-binding syringe filter to remove bacteria and debris. Next, the filtrates were incubated in the presence or absence of a 1:5000 (final concentration of 1: 10,000) dilution of polyclonal rabbit anti-Stx2 antibody [49] for -2 h (at a 1:1 mixture of filtrate to antibody dilution or PBS) prior to the addition of 100 J.1L of the samples onto Vera cells that had been seeded into microtiter plates 24 h previously. The overlaid Vera cell plates were incubated for 40-48 h at 37 oc in 5% C02• The residual cells in the wells were then fixed in Formalde-fresh, stained with crystal violet, and read at 600 nm on a spectrophotometric plate reader.
4.5. Histopathology and staining of tissues
Kidneys and ceca were harvested from infected or control mice at necropsy, fixed (see Section 4.2.2 and 4.2.3), and subsequently sent to HistoServ (Germantown, MD) for embedding in paraffin, sectioning, and placement on charged glass slides. Some sections were stained using hematoxylin and eosin (H&E) or a modified Carstair's stain at HistoServ or stained using Mallory's phosphotungstic acid hematoxylin (PTAH) at the USUHS Laboratory of Animal Medicine (Bethesda, MD).
To locate E. coli 0157:H7 bacteria bound to or near the surface of cecal tissue, slides with cecal sections were immunostained using an anti-0157 antibody. To reduce the background autofluorescence normally present in tissue. slides of sectioned tissues were first placed under fluorescent light for at least 48 h [50). Slides were then deparaffinized in Histoclear (National Diagnostics, Atlanta, GA) and rehydrated in a graded ethanol series. To increase antibody recognition, slides were treated with antigen retrieval buffer [(SX AntigenPlus Buffer, pH10, EMD Biosciences, San Diego, CA) diluted
K.L Mohawk ec aLI Microbial Pathogenesis 48 (20l0) 131-142 141
to 1 x, heated in a microwave for -15 min with replenishment of the buffer as needed, cooled and driedJ. Slides were blocked overnight in fetal bovine serum (FBS) supplemented with 0.1% Triton-X. Prior to the addition of primary antibody, the anti-0157 antibody was pre-cleared against a laboratory strain of E. coli (DH5t:X) and a powdered homogenate of normal mouse cecal tissue [51J. The cleared anti-0157 antibody was incubated on the tissue at a dilution of 1:500 in 3% bovine serum albumin (BSA) in PBS with 0.1% Triton-X for -1 h. The tissue sections were then washed and secondary goat anti-rabbit antibody conjugated to Alexa-fluor 488 (also pre-cleared against the cecal powder) was incubated on the tissue for -1 h at a dilution of 1 :500 in 3% BSA in PBS with 0.1% Triton-X. Prior to microscopic observation, the slides were rinsed in PBS, mounted using Slowfade reagent, and a coverslip applied to each slide. Immunofluorescence of stained tissue sections was visualized with an Olympus BX60 microscope with a BX-FIJ\ fluorescent attachment Digital images of the fluorescent stains were obtained using a SPOT RT charge-coupled-device digital camera (Diagnostic Instruments, Inc., Sterling Heights, Ml). lmagej and Deconvolutionj software (both developed by the National Institutes of Health) were used for processing the images and removing outof-focus fluorescent signals. The images were overlaid and subjected to green false-coloration using Adobe Photoshop (Adobe Systems, Inc., San jose, CA).
4.6. Statistical analyses
All statistical analyses were done through application of the SPSS v16 software (SPSS Inc., Chicago, IL). Specific analyses are described below.
Data for the dose-response studies (section 4.2.1) were analyzed by both Kaplan-Meier analysis and repeated measures (RM) analysis of variance (ANOVA). The Kaplan-Meier analysis was performed to ascertain differences in the amount of time mice were colonized by different doses of inoculum received. The RM ANOVA was used to assess statistical differences in levels of colonization by dose administered. The ANOVA was estimated by a linear mixed models approach that incorporated all available data including information from animals that had died before the end of the study. The model assumes equal correlation among repeated observations on the same animal. For the mixed model analysis, dose was considered the between subjects factor and day was set as the within subjects factor.
ARM ANOVA was also used to test for statistical significance among the numbers of E. coli 0157:H7 in various segments of the intestine over time (section 4.2.2) but, in this case, with time as a between subjects factor and organ as a within subjects factor. To more closely meet the assumptions of ANOVA, the dependent variable (CFU) was assessed on a log scale. After checking for significance by RM ANOVA, we conducted a separate one-way ANOVA to compare bacterial counts at time-points among the organs. We also conducted repeated measures AN OVA for organs at each time-point and made separate pair-wise comparisons.
For the ascertainment of differences in expression of both intimin and toxin, aRM ANOVA was again used. To more closely meet the assumption for a normal distribution, the measurements for quantification of expression (the dependent variable) were assessed on a log scale. Measurements below the limit of detection were given an arbitrary value of 100 to allow the data to be included in the analysis. For the RM ANOV A. time was once again the between subjects factor and organ was again the within subjects factor. Pair-wise comparisons of the main effects for differences both by time and organ were also conducted using the least significant difference, a procedure that is equivalent to no adjustments for multiple comparisons.
Statistical differences in the mean weight between infected and control mice (section 4.2.3) were determined using aRM ANOVA. For the RM ANOVA, day was the between subjects factor and weight was the within subjects factor. Additionally, differences between infected and control mice (section 4.2.3) in terms of CBC analyses and serum chemistry results were assessed by performing independent samples t-tests on relevant numbers, such as BUN, creatinine, % neutrophils, % lymphocytes, hemoglobin, % hematocrit, and platelets.
Acknowledgements
The authors would like to thank the entire O'Brien lab and in particular Farhang Alem, Stephen Darnell, and Dianne Mcleod for technical assistance with various aspects of this project and Dr. Cara Olsen for help with the statistical analyses. This work was funded by National Institutes of Health/National Institute for Allergy and Infectious Diseases grant number 5R37 Al20148, USUHS grant number R073NQ, and USUHS intramural student funding T073MR-02.
References
(1) Mead PS, Slursker L Dierz V, McCaig LF, Bresee JS, Shapiro C. er al. Food-relared illness and dearh in rhe Unired Srares. Emerg Infecr Dis 1999;5:607-25.
(2) Rangel jM, Sparling PH, Crowe C, Griffin PM, Swerdlow DL Epidemiology of Escherichia coli 0157:H7 ourbreaks, Unired Srares, 1982-2002. Emerg lnfecr Dis 2005;11 :603-9.
(3) Manning SO, Moriwala AS, Springman AC, Qi W, Lacher OW, Ouellette LM, er al. Variarion in virulence among clades of Escherichia coli 0157:H7 associared wirh disease ourbreaks. Proc Narl Acad Sci US A 2008;105:4868-73.
(4) CDC. Updare on multi-srare ourbreak of E. coli 0157:H7 infecrions from fresh spinach, Ocrober 6, 2006. E coli 0157:H7 Ourbreak from Fresh Spinach; 2006.
(5) Brandr ML O'Regan S, Rousseau E. Yazbeck S. Surgical complicarions of rhe hemolyric-uremic syndrome. J Pediarr Surg 1990;25: 1109-12.
(6) Mead PS, Griffin PM. Escherichia coli 0157:H7. Lancer 1998;352:1207-12. (7( Tilden jr j, Young W, McNamara AM, Cusrer C, Boesel B, Lambert-Fair MA, er al.
A new roure of rransmission for Escherichia coli: infecrion from dry fennenred salami. Am J Public Healrh 1996;86:1142-5.
(8) Fosrer JW. Escherichia coli acid resisrance: rales of an amareur acidophile. Nar Rev Microbial 2004;2:898-907.
(9) Gannendia J, Frankel G, Crepin VF. Enreroparhogenic and enrerohemorrhagic Escherichia coli infections: rranslocarion, rranslocarion, rranslocarion. Infecr lmmun 2005;73:2573-85.
(10) O'Brien AO, Uvely TA, Chen ME, Rorhman SW, Formal SB. Escherichia coli 0157:H7 srrains associared wirh haemorrhagic colitis in rhe Unired Srares produce a Shigella dysenreriae 1 (SHIGA) like cyroroxin. Lancer 1983; 1:702.
(11) Karmali MA. Sreele BT, Petrie M. Urn C. Sporadic cases of haemolytic-uraemic syndrome associared wirh faecal cyroroxin and cyroroxin-producing Escherichia coli in srools. Lancer 1983; 1 :619-20.
(12) Karmali MA. Petrie M. Urn C, Fleming PC. Arbus GS, Uor H. The association berween idioparhic hemolytic uremic syndrome and infecrion by veroroxinproducing Escherichia coli. J Infecr Dis 1985;151 :775-82.
(13) . Pai CH, Gordon R, Sims HV, Bryan LE. Sporadic cases of hemorrhagic coliris associared wirh Escherichia coli 0157:H7. Clinical, epidemiologic, and bacreriologic fearures. Ann Inrem Med 1984;101 :738-42.
(14) Obrig TG. Shiga roxin mode of action in E. coli 0157:H7 disease. Fronr Biosci 1997;2:d635-42.
(15) Obrig TG, Louise CB, Ungwood CA. Boyd B, Barley-Maloney L Daniel TO. Endorhelial hererogeneiry in Shiga roxin receprors and responses. J Bioi Chern 1993;268: 15484-8.
(16) Ohmi K, Kiyokawa N, Takeda T, Fujimoro j. Human microvascular endorhelial cells are srrongly sensitive ro Shiga roxins. Biochem Biophys Res Commun 1998;251: 137-41.
(17) Richardson SE, Karmali MA. Becker LE. Smirh CR. The hisroparhology of rhe hemolytic uremic syndrome assodared wirh verocyroroxin-producing Escherichia coli infections. Hum Parhol 1988; 19:1102-8.
(18) Ergonul z. Clayton F, Fogo AB, Kohan DE. Shigaroxin-1 binding and recepror expression in human kidneys do nor change wirh age. Pediarr Nephrol 2003; 18:246-53.
(19) Melron-Celsa AR, O'Brien AD. Animal models for STEC-mediared disease. Merhods Mol Med 2003;73:291-305.
(20) lsogai E. Isogai H, Kimura K. Hayashi 5, Kubora T, Fujii N, er al. Role of rumor necrosis facror alpha in gnorobiotic mice infecred wirh an Escherichia coli 0157:H7 srrain. Infecr lmmun 1998;66:197-202.
(21) Aiba Y, Ishikawa H, Shimizu K, Noda S, Kirada Y, Sasaki M, er al. Role of inrernalization in rhe parhogeniciry of Shiga roxin-producing Escherichia coli infection in a gnorobiotic murine model. Microbial Immunol2002;46:723-31.
142 K.L Mohawk ec alI Microbial Pathogenesis 48 (2010) 131-142
[22[ Kurioka T, Yunou Y, Kira E. Enhancemenr of suscepribiliry ro Shiga roxinproducing Escherichia coli Ot57:H7 by prorein calorie malnurririon in mice. lnfecr lmmun 1998;66: 1726-34.
[23[ Shimizu K. Asahara T, Nomoto K. Tanaka R. Hamabara T, Ozawa A, er al. Developmenr of a lerhal Shiga roxin-producing Escherichia coli-infection mouse model using mulriple miromycin C rrearment Microb Parhog 2003;35:1-9.
[24) Zhang X, McDaniel AD, Wolf LE, Keusch GT, Waldor MK, Acheson OW. Quinolone antibiorics induce Shiga roxin-encoding bacreriophages, roxin producrion, and dearh in mice. j lnfecr Dis 2000; 181 :664-70.
[25) Iindgren SW, Melron AR. O'Brien AD. Virulence of enrerohemorrhagic Escherichia coli 091 :H21 clinical isolares in an orally infecred mouse model. lnfecr lmmun 1993;61 :3832-42.
[261 Sperandio V, Mellies jl. Nguyen W, Shin S. Kaper jB. Quorum sensing conrrols expression of rhe rype Ill secretion gene rranscriprion and prorein secrerion in enrerohemorrhagic and enreroparhogenic Escherichia coli. Proc Narl Acad Sci U SA 1999;96:15196-201.
)27) Wadolkowski EA. Sung LM, Burris jA, Samuel jE, O'Brien AD. Acure renal rubular necrosis and dearh of mice orally infecred wirh Escherichia coli srrains rhar produce Shiga-like roxin rype II. lnfecr lmmun 1990;58:3959-65.
[28) Karpman D, Connell H. Svensson M. Scheurz F, Aim P, Svanborg C. The role of lipopolysaccharide and Shiga-like roxin in a mouse model of Escherichia coli 0157:H7 infecrion.j lnfecr Dis 1997;175:611-20.
(29) Kang G, Pulimood AB, Koshi R. Hull A, Acheson D. Rajan P. er al. A monkey model for enrerohemorrhagic Escherichia coli infection. j lnfecr Dis 2001:184:206-10.
(30) Garcia A, Basques CJ, WishnokjS, Feng Y, Karalius Bj, BurrerronjR. er al. Renal injury is a consisrenr finding in Durch Belred rabbirs experimenrally infecred wirh enrerohemorrhagic Escherichia coli. j lnfecr Dis 2006;193:1125-34.
[31) Ruggenenri P, Noris M. Remuzzi G. Thromboric microangioparhy, hemolyric uremic syndrome, and rhromboric rhrombocyropenic purpura. Kidney lnr 2001 ;60:831-46.
[32) Chaisri U, Nagara M, Kurazono H. Horie H. Tongrawe P, Hayashi H. er al. Localization of Shiga roxins of enrerohaemorrhagic Escherichia coli in kidneys of paediarric and geriatric patienrs wirh faral haemolyric uraemic syndrome. Microb Parhog 2001 ;31 :59-67.
[33) Takeda T, Dohi s. Igarashi T, Yamanaka T, Yoshiya K, Kobayashi N. lmpairmenr by veroroxin of rubular function conrribures ro rhe renal damage seen in haemolytic uraemic syndrome. j lnfecr 1993;27:339-41.
[34) Kaneko K. Kiyokawa N, Ohromo Y. Nagaoka R. Yamashiro Y, Taguchi T, er al. Apoprosis of renal rubular cells in Shiga-roxin-mediared hemolyric uremic syndrome. Nephron 2001 ;87:182-5.
(35) Tesh VL. BurrisjA, OwensjW, Gordon VM, Wadolkowski EA, O'Brien AD, er al. Comparison of rhe relarive roxidries of Shiga-like roxins rype I and rype II for mice. lnfecr lmmun 1993;61 :3392-402.
(36) Nagano K, Taguchi K. Hara T. Yokoyama S, Kawada K, Mori H. Adhesion and colonization of enrerohemorrhagic Escherichia coli 0157:H7 in cecum of mice. Microbiollmmunol2003;47:125-32.
[37) Knutton S, Adu-Bobie j, Bain C, Phillips AD, Dougan G, Frankel G. Down regularion of inrimin expression during arraching and effacing enreroparhogenic Escherichia coli adhesion. lnfecr lmmun 1997;65:1644-52.
[38) Cornick NA, Marise I, Samuel jE, Bosworth BT, Moon HW. Shiga roxinproducing Escherichia coli infection: remporal and quanrirative relationships among colonizarion, roxin production, and sysremic disease. j lnfecr Dis 2000; 181 :242-5 I.
[39) Marise I, Cornick NA, Booher SL. Samuel jE, Bosworth BT, Moon HW. lnrervenrion wirh Shiga roxin (Srx) anribody afrer infecrion by Srx-producing Escherichia coli. j lnfecr Dis 2001:183:347-50.
[40) Yamagami s, Moroki M, Kimura T.lzumi H, Takeda T, Karsuura Y. er at. Efficacy of posrinfection ttearmenr wirh anri-Shiga roxin (Srx) 2 humanized monoclonal antibody TMA-15 in mice lerhally challenged wirh Srx-producing Escherichia coli. j lnfecr Dis 2001:184:738-42.
(41) Sheoran AS, Chapman-Bonofiglio S, Harvey BR, Mukherjee j, Georgiou G, Donahue-Rolfe A, er al. Human anribody againsr shiga roxin 2 adminisrered ro piglers afrer rhe onser of diarrhea due ro Escherichia coli ot57:H7 prevenrs faral sysremic complicarions. lnfecr lmmun 2005;73:4607-13.
(42) Conlan JW, Perry MB. Susceptibiliry of rhree sttains of conventional adulr mice ro inrestinal colonizarion by an isolare of Escherichia coli ot57:H7. Can j Microbial 1998;44:800-5.
(43) judge NA, Mason HS, O'Brien AD. Planr cell-based inrimin vaccine given orally ro mice primed wirh intimin reduces rime of Escherichia coli ot57:H7 shedding in feces. lnfecr lmmun 2004;72:168-75.
[44) Karpman DO. Srudies of rhe parhogenesis of hemolytic uremic syndrome and rhromboric rhrombocyropenic purpura. Medical Microbiology and Pediarrics. Lund: Lund Universiry; 1997. p. 179.
(45) Fujii Y, Numara s. Nakamura Y, Honda T, Furukawa K, Urano T, er al. Murine glycosylrransferases responsible for rhe expression of globo-series glycolipids: eDNA srructures, mRNA expression, and disrriburion of rheir producrs. Glycobiology 2005;15:1257-67.
(46) Narionallnsriture of Healrh and lnfecrious Disease Conttol Division MoHaWoj. Ourbreaks of enrerohemorrhagic Escherichia coli 0157:H7 infection, 1996, japan. lnfecr Agenrs Surveill Rep: 1996: 180-t.
(47) Griffin PM, Osrroff SM, Tauxe RV, Greene KD, Wells jG, Lewis jH, er al. Illnesses associared wirh Escherichia coli Ot57:H7 infections. A broad clinical specrrum. Ann lnrem Med 1988;109:705-12.
(48) Gansheroff Lj, Wachrel MR. O'Brien AD. Decreased adherence of enrerohemorrhagic Escherichia coli ro HEp-2 cells in rhe presence of anribodies rhar recognize rhe C-rerminal region of inrimin. lnfecr lmmun 1999;67:6409-17.
[49) Kokai-Kun jF, Melron-Celsa AR. O'Brien AD. Elasrase in inrestinal mucus enhances rhe cyroroxiciry of Shiga roxin rype 2d. j Bioi Chern 2000;275: 3713-21.
[50) Neumann M, Gabel D. Simple merhod for reduction of aurofluorescence in fluorescence microscopy. j Hisrochem Cyrochem 2002;50:437-9.
[51) Harlow E. Lane D. Anribodies: a laborarory manual. Cold Spring Harbor: Cold Spring Harbor Laborarory: 1988.


![RESEARCH Open Access The pathogenesis of low ......New Jersey where a single LP H7 genetic lineage per-sisted from 1994 to 2006 [10,11]. Few studies have directly compared the pathogenesis](https://img.dokumen.tips/doc/110x75/607ce3c438644b166568802a/research-open-access-the-pathogenesis-of-low-new-jersey-where-a-single-lp.jpg)


![Home page []NeogenS Reveal test systems for Salmonella, Listeria spp. and Ecoli 0157:H7 have everything to complete a pathogen screen, including the enrichment medium. Reveal's lateral](https://img.dokumen.tips/doc/110x75/60ebf4fc8d48ae11c6262418/home-page-neogens-reveal-test-systems-for-salmonella-listeria-spp-and-ecoli.jpg)