Embed Size (px)
Citation preview

00
Pasture Water Management for Reduced Phosphorus Loading in the Lake Okeechobee Watershed Final Report
Prepared for:
South Florida Water Management District
By:
Patrick J. Bohlen MacArthur Agro-ecology
Research Center
With contributions from:
Southern DataStream &University of Florida
April 30, 2009

Final Report, SFWMD Contract No. RS040348 | 2 Pasture Water Management for Reduced Phosphorus Loading in the Lake Okeechobee Watershed
TABLE OF CONTENTS List of Figures ................................................................................................................................. 3 List of Tables .................................................................................................................................. 4 Executive Summary ........................................................................................................................ 6 1 Introduction............................................................................................................................. 9
1.1 Project Background and Funding..................................................................................... 9 1.2 Project Objectives .......................................................................................................... 10 1.3 Personnel and Responsibilities....................................................................................... 11
2 Project Design....................................................................................................................... 12 2.1 Experimental Pastures .................................................................................................... 13 2.2 Water Retention Treatments........................................................................................... 17 2.3 Surface Water Sampling................................................................................................. 17 2.4 Quality Assurance Activities.......................................................................................... 19
3 Pasture and Water Management Activities........................................................................... 19 3.1 Pasture Management ...................................................................................................... 19 3.2 Management of Water Control Structures ..................................................................... 19 3.3 Cattle Management and Feed Supplements ................................................................... 20
3.3.1 Herd stocking rates and rotation ............................................................................. 20 3.3.2 Feed and mineral supplements................................................................................ 21
4 Meteorological Conditions.................................................................................................... 24 5 Surface Water........................................................................................................................ 25
5.1 Flow Data ....................................................................................................................... 25 5.2 Nutrient Concentrations ................................................................................................. 28
5.2.1 Ammonia concentrations ........................................................................................ 28 5.2.2 Nitrate/Nitrite concentrations.................................................................................. 28 5.2.3 Total nitrogen concentrations ................................................................................. 28 5.2.4 Total phosphorus concentrations ............................................................................ 28
5.3 Nutrient Loads................................................................................................................ 30 5.3.1 Ammonium loads.................................................................................................... 30 5.3.2 Nitrate/nitrite loads ................................................................................................. 32 5.3.3 Total nitrogen loads ................................................................................................ 34 5.3.4 Total phosphorus loads ........................................................................................... 34
5.4 Manual Grab Samples .................................................................................................... 36 6 Groundwater ......................................................................................................................... 36
6.1 Groundwater Elevation .................................................................................................. 36 6.2 Groundwater Chemistry ................................................................................................. 38
7 Soil Chemistry ...................................................................................................................... 40 8 Forage Quality ...................................................................................................................... 44
8.1 Forage samples—2005................................................................................................... 44 8.2 Forage samples—2006................................................................................................... 48
9 Cattle Data ............................................................................................................................ 48 10 Summary and Recommendations ......................................................................................... 52 11 References............................................................................................................................. 55

Final Report, SFWMD Contract No. RS040348 | 3 Pasture Water Management for Reduced Phosphorus Loading in the Lake Okeechobee Watershed
LIST OF FIGURES Figure 1. Flow chart illustration of project personnel and their primary responsibilities. Figure 2. Location of Buck Island Ranch in the Lake Okeechobee watershed. Figure 3. Aerial image of the experimental pastures showing the location of the flumes,
groundwater wells, weather station and water control structures. Figure 4. Photo of flume structure showing 1) two stilling wells (top center) containing shaft
encoders to monitor water levels in the flume; and 2) an ISCO automatic water sampler (left) that collects samples just upstream of the flume.
Figure 5. Schematic of flashboard riser control structure that installed to hold water at a specified level in the drainage ditches carrying surface runoff from the experimental pastures.
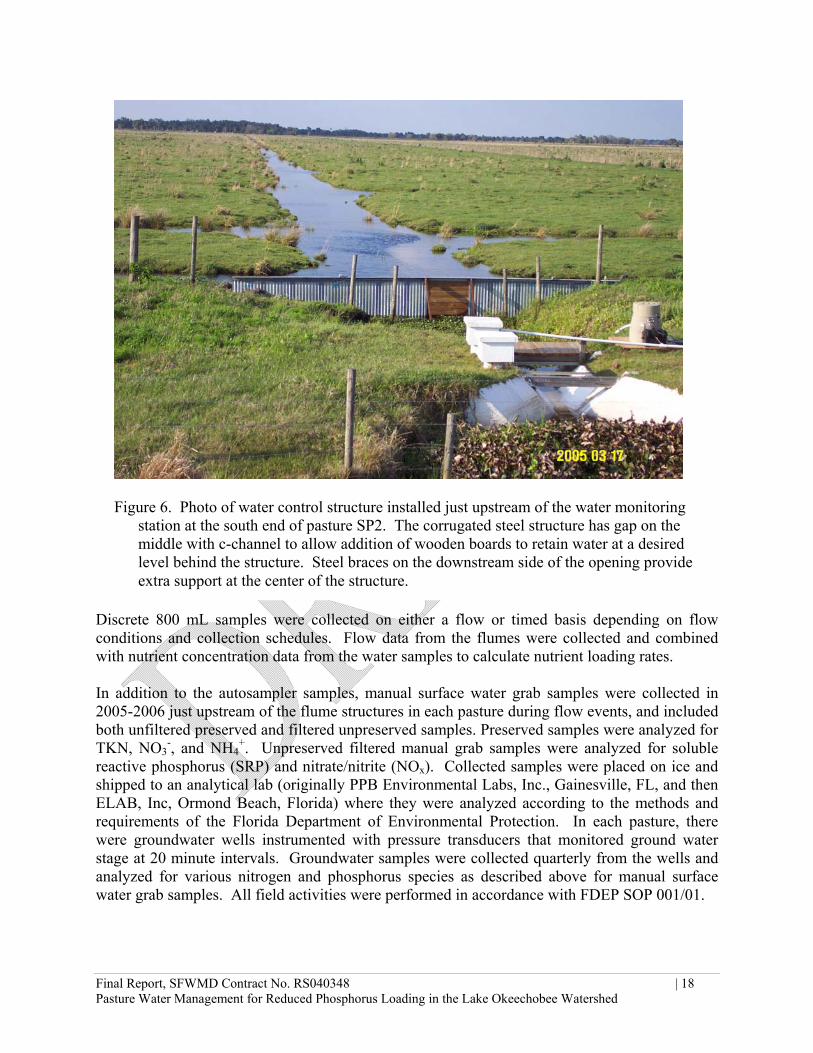
Figure 6. Photo of water control structure installed just upstream of the water monitoring station
at the south end of pasture SP2. Figure 7. Stocking densities in the experimental pastures in 2006. Figure 8. Stocking densities in the experimental pastures in 2007. Figure 9. Stocking densities in the experimental pastures in 2008 through October 31. Figure 10. Total annual rainfall as measured at the manual rain gauge at the MAERC main
weather station. Figure 11. Monthly rainfall at the MAERC main weather station manual rain gauge in 2005-
2008. Figure 12. Average ground water elevation and daily rainfall totals for 2005-2006 (upper panel)
and 2007-2008 (lower panel) in pasture with (SP1-SP4) or without (SP5-SP8) water control structures.
Figure 13. Nitrogen concentrations in groundwater through time in the experimental pastures,
including total N (top panel), nitrate (middle panel), and ammonium (bottom panel). Figure 14. Phosphorus concentrations in groundwater through time in the experimental pastures,
including total P (top panel), and soluble reactive P (bottom panel). Figure 15. Double-acid-extractable P and ion-exchange-resin P in pastures with or without water
retention structures. Figure 16. Soil moisture and pH in pastures with or without water control structures.

Final Report, SFWMD Contract No. RS040348 | 4 Pasture Water Management for Reduced Phosphorus Loading in the Lake Okeechobee Watershed
LIST OF TABLES Table 1. Percent cover of vegetation on the experimental pastures determined in 1995. Table 2. Flumes entrance and exit elevations (NGVD29) and surveyed slopes (ft) in 2006 and
2008. Table 3. Elevation in feet above mean sea level (NGVD29) of water control structures and
flashboards in the project pastures as determined in September 2005 and March 2006. Table 4. Average annual stocking density in the experimental pastures for 2006, 2007, and 2008
(through October 31, 2008). Table 5. Total feed and mineral inputs into the experimental pastures during 2006-2008. Table 6. Average annual values for variables associated with surface runoff characteristics in the
experimental pastures from 2005-2008. Table 7. Average annual values for variables associated with forward flow from the
experimental pastures from 2005-2008. Table 8. Average annual values for variables associated with forward flow from the
experimental pastures from 2005-2008. Table 9. Average annual values for variables associated with net surface runoff from
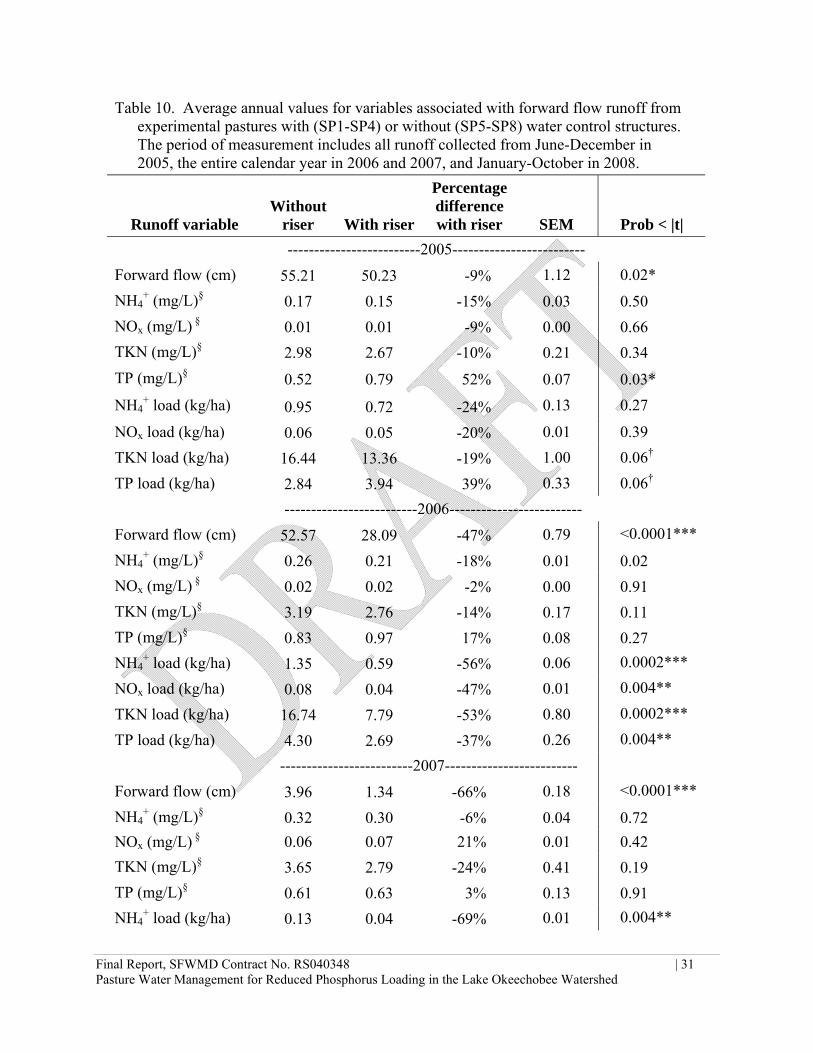
experimental pastures with (SP1-SP4) or without (SP5-SP8) water control structures. Table 10. Average annual values for variables associated with forward flow runoff from
experimental pastures with (SP1-SP4) or without (SP5-SP8) water control structures. Table 11. Average annual values for variables associated with back flow into the experimental
pastures with (SP1-SP4) or without (SP5-SP8) water control structures. Table 12. Average nutrient concentrations in grab samples collected on five different sample
dates during the 2005 rainy season and three days during 2006. Table 13. Average nutrient concentrations in groundwater samples collected in 2005-2008 from
wells in pastures with or without riser structures. Table 14. Bahia grass (Paspalum notatum) forage characteristics on five sampling dates during
the 2005 growing season. Table 15. Mean forage characteristics for forage samples collected on five different
sampling dates in 2005 in pastures SP2-SP7, which had be grazed during previous years and pastures SP1 and SP8, which had not been grazed from 1996-2004.

Final Report, SFWMD Contract No. RS040348 | 5 Pasture Water Management for Reduced Phosphorus Loading in the Lake Okeechobee Watershed
Table 16. Mean forage characteristics for forage samples collected on five different sampling dates in 2005 in pastures with (SP2-SP4) or without (SP5-SP8) water control structures.
Table 17. Bahia grass (Paspalum notatum) forage characteristics on five sampling dates during
the 2006 growing season. Table 18. Mean forage characteristics for forage samples collected on five different sampling
dates in 2006 in pastures with (SP1-SP4) or without (SP5-SP6) water control structures. Table 19. Cattle herd data for herds maintained in the experimental pastures in 2005-2008.
Final Report, SFWMD Contract No. RS040348 | 6 Pasture Water Management for Reduced Phosphorus Loading in the Lake Okeechobee Watershed
EXECUTIVE SUMMARY This report summarizes results from South Florida Water Management District (SFWMD) Contract No. RS040348, “Pasture Water Management for Reduced Phosphorus Loading in the Lake Okeechobee Watershed”. The overall objective of the project was to evaluate the technical feasibility of on-ranch pasture water retention/detention as an approach for controlling phosphorus losses from beef cattle ranches, and assess potential effects on cattle and forage production. The project was executed within the context of a Memorandum of Understanding, (MOU) established in 2004 among Archbold Expeditions, the South Florida Water Management District (SFWMD), the Florida Department of Agriculture and Consumer Services (FDACS), the Florida Department of Environmental Protection (FDEP), the University of Florida, Institute of Food and Agricultural Sciences (UF-IFAS), the United States Department of Agriculture Agricultural Research Service (USDA-ARS), the USDA Natural Resources Conservation Service (USDA-NRCS) and the Florida Cattlemen’s Association (FCA). Financial support for the project was provided by SFWMD and the FDACs. The project design was centered on an array of eight 50-acre pastures that were separated hydrologically by a series of surface drainage ditches and berms. Water control structures were installed in 2004-2005 in four of the eight pastures, each of which was instrumented to measure total water volume and concentration of chemical constituents in surface runoff. The structures were fitted with riser boards to maintain elevated ground water levels and retain water in the main drainage ditches of the pasture with control structures. All runoff from each pasture was routed through a flume for measuring runoff volumes and automated samplers for collecting water samples that were analyzed for various nutrient constituents (NO3
-/NO2- or NOx, NH4
+, TKN and TP). Nutrient concentrations were multiplied by the corresponding runoff volume to calculate nutrient loads. The flumes accommodated both forward flow, which occurred during major runoff periods and back flow which occurred when water levels in the nearby C-41 canal (Harney Pond) exceeded flume elevations. Data were examined for net runoff, forward flow and back flow. The period of measurement started in June 2005 and ended in October 2008. The project also included measurement of soil phosphorus availability, forage quality and cattle production factors. The soil and forage components were completed in 2005 and 2006. Total rainfall at the site was near the regional average of 52 inches per year in 2005 and 2008, was 48 inches in 2006 and only 32 inches in 2007. The period between October 2006 and September 2007 was one of the driest periods in the historic climate record and resulted in only a single flow event in the summer of 2007. The pasture water retention treatment reduced overall surface runoff from the pastures, although the effect varied among years. In the first year of the project (2005), runoff was only reduced by 10%. This result was attributed to major storms that caused large runoff event, and the occurrence of leakages underneath the water control structures early in the rainy season (June) before the structures had been fully stabilized. However, in 2006 and 2008 average runoff from the reduced flow treatment was, respectively, 50% and 48% lower than runoff from pastures with uninterrupted flow. Net runoff was negative in 2007 due to extreme drought conditions in which back flow from the C-41 Canal exceeded total forward flow in runoff events. Groundwater levels were higher in pastures with water retention structures during wet periods, but during dry
Final Report, SFWMD Contract No. RS040348 | 7 Pasture Water Management for Reduced Phosphorus Loading in the Lake Okeechobee Watershed
periods some pastures with uninterrupted flow had higher groundwater levels due to back flow in those pastures, which was blocked by the water control structures in the pastures with reduced flow. Pasture water retention reduced nutrient loads from the pastures, but the effect was stronger and more consistent across years for total Kjeldahl nitrogen (TKN) than total phosphorus (TP). In the first year of the study (2005), the water retention treatment actually increased P loads by 39% (3.94 vs. 2.83 kg ha-1), which was opposite of the expected response. This increase was due to a significant increase in P concentration in runoff from pastures with reduced flow (see below). However in 2006, the pasture water retention treatment reduced TP loads by 37% (2.56 vs. 4.22 kg ha-1), and in 2008 did not significantly affect TP loads (1.58 vs. 1.88 kg ha-1). These effects were stronger when only forward flow events were considered. Overall average annual TKN loads were lower in pastures with reduced flow (6.28 kg ha-1) than in pastures with uninterrupted flow (11.28 kg ha-1), and this pattern held in all years except 2007, when flow was negligible due to drought, and there was no significant difference between treatments. As with TKN, average annual NH4
+ loads were lower in pastures with water retention structures (0.42 kg ha-1) than in pastures with uninterrupted flow (0.83 kg ha-1), and this effect was strongest in 2006 and 2008 when flow differences between the treatments were strongest. Loads of NOx were low relative to other nutrients but were lower in pastures with reduced flow (0.007 kg ha-1) than in pastures with uninterrupted flow (0.10 kg ha-1). The pasture water retention treatment had different effects on concentrations of TP and TKN, which contributed to the different effects of water retention on loads of these two nutrients. Averaged over all four years, the flow-weighted P concentration of forward flow from pastures with reduced flow (0.79 mg L-1) was significantly greater than in pastures with uninterrupted flow (0.64 mg L-1). By contrast, average flow-weighted concentration of TKN in forward flow was significantly lower in pastures with reduced flow (2.77 mg L-1) than in pastures with uninterrupted flow (3.42 mg L-1). Groundwater nutrient concentrations were not significantly affected by the water retention treatment although they did vary through time. The opposite response of TP and TKN concentrations indicated that there were fundamental differences in the biogeochemical processing of these two nutrients in the pastures and pasture runoff. Concentrations of available P in pasture soils, collected monthly during the wet season in 2005 and 2006, were significantly greater in pastures with water control structures than in pastures with uninterrupted flow. These differences were greatest during wet periods when the pasture soils were saturated and the water table near the soil surface, indicating that P was released from the soil under flooded conditions and that more P was released from soil in pastures with reduced flow due to the higher water table conditions and higher soil moisture content. Thus, there appears to be a risk of P release from soil when pasture soils with accumulated P loads are exposed to flooding or high water table conditions. This risk does not appear to apply to N forms because the flow-weighted concentrations of TKN were lower, not higher, in pastures with water retention structures, and inorganic N concentrations were not affected by water retention. In grab samples collected in 2005 and 2006, soluble reactive P accounted for 76.7% of total P, whereas total inorganic N only accounted for only 5.6% of TKN.

Final Report, SFWMD Contract No. RS040348 | 8 Pasture Water Management for Reduced Phosphorus Loading in the Lake Okeechobee Watershed
Forage biomass peaked in September in 2005 and 2006 although total biomass was much lower in 2005 due to higher cattle stocking densities during that year. Forage quality declined from June through November which is typical for Bahia grass pastures in south Florida. The pasture water retention treatment did not affect measure of relative forage quality in 2005, but in 2006 measures of average forage quality, such as total digestible nutrients (TDN), in vitro total digestibility (IVTD) and neutral detergent fiber digestibility were greater in pastures with water control structures. This difference in forage quality may have been affected by cattle stocking density which was significantly greater in pastures with reduced flow than in pastures with uninterrupted flow in 2006. Thus, there was no evidence during the first two years of the experiment that pasture water retention decreased grass production or forage quality. Cattle production did not appear to be affected negatively by pasture water retention during the three annual production cycles examined. There were no obvious consistent differences in cow body condition scores, conception rates, calf weights or calf weight gain rates between pastures with reduced or uninterrupted flow. In 2006 conception rates were 7% lower in herds on reduced flow pastures, and calf weights and daily calf weight gains were also lower than in pastures with uninterrupted flow, but these differences were not observed in other years, so these differences cannot be attributed definitively to pasture water retention. In 2007 and through July 2008 conditions were relatively dry, so it is unlikely that cattle would have been negatively affected by water retention during those production cycles. Consequently, there is insufficient evidence from this study to make conclusions about the effects of pasture water retention on cattle production. Given the limited nature of results on forage quality and cattle production, ranchers are likely to be concerned about potential negative effects of water retention on production and economic returns; therefore any decision to encourage this practice should consider the possibility of negative effects, especially in wet years. Results of this study demonstrate that pasture water retention is an effective method for reducing the volume of surface runoff from cattle pastures and can also effectively reduce nutrient loads, although load reductions were greater for N than for P. Reduction in N loads with reduced flow exceeded the reduction in flow volumes because runoff from pastures with reduced flow had significantly lower concentration of total N. Thus, pasture water retention appears to have the potential to substantially reduce N loads in runoff from cattle pastures. The picture is not as clear for P because results varied among years and there was evidence that pasture water retention increased flow weighted averages of P, most likely due to increased P release from flooded soils. The increased in flow-weighted P concentrations with reduced flow was significant only in the first year of the project, suggesting that initial flooding may cause a P release that will abate over time. However the risk of P release from flooded soils is clear and suggest that pasture water management to reduce P loads will have the best chance of succeeding in situations where significant reductions in flow volume can be achieved. In addition to maximizing reduction in runoff volumes, additional management options that could decrease P loads include capturing the “first flush” of nutrients at the start of the wet season when concentrations tend to be highest, and increasing water retention times within the pasture to maximize the P removal from the water column via biological uptake or P sorption by sediments. Pasture water retention has clear benefits for reducing runoff volumes and N loads, and with careful management may be an effective strategy for reducing P loads from beef cattle pastures in the Lake Okeechobee watershed.

Final Report, SFWMD Contract No. RS040348 | 9Pasture Water Management for Reduced Phosphorus Loading in the Lake Okeechobee Watershed
1 INTRODUCTION Excessive nutrient loads into Lake Okeechobee have contributed to declines in water quality in downstream waterways including Lake Okeechobee and the coastal estuaries that receive pulses of nutrient laden freshwater from the lake. Despite years of regulatory effort to reduce phosphorus loads into the lake no substantial reduction in loading occurred in the past two decades which has contributed to excessive algal blooms, loss of benthic invertebrate biodiversity and spread of undesirable vegetation in the littoral zone of the lake (Zhang et al. 2009). Furthermore, water discharges of nutrient laden water from the lake also influences nutrient loads to the St. Lucie and Caloosahatchee coastal estuaries (Alleman et al. 2009). Thus there is a continuing need to control nutrient runoff from agricultural land in the Okeechobee watershed. Beef cattle ranching is the largest land use in the watershed, and although nutrient loads from cattle pastures are low relative to other land uses on a per acre basis, the large acreage of ranches makes them a significant contributor to overall nutrient loads (Hiscock et al. 2003). In cooperation with the state agriculture and environmental agencies, the Florida Cattlemen’s Association developed water quality BMP guidelines which include practices for water quality improvements, including modifications to fencing, drainage, feed/water location, and fertilization as well as changes in rotational grazing protocols that are expected to reduce phosphorus runoff if implemented (FDACS 2008). Increasing retention/detention of drainage waters within cattle pastures has been suggested as a potentially effective way to reduce nutrient loads. Modeling of improved pastures at Buck Island Ranch with the Watershed Assessment Model (WAM) produced estimates of a 20% reduction in P loads with a detention of 0.25-0.5 inches of runoff (Zhang et al. 2006, SWET 2008b). This level of reduction was associated with an estimated P removal cost of $166 per lb P per year, which is in between the estimated costs of site/crop BMPs ($73 lb P per year) and edge of farm chemical treatment ($155/lb P per year). A four-year project was started in 2005 to provide more quantitative information on the potential of pasture water retention to reduce nutrient loads from beef cattle pastures in the Lake Okeechobee Basin. Water control structures were added to four of eight existing experimental pastures that were instrumented to measure surface runoff and collect water samples automatically. This report summarized the results of the project and provides recommendations based on the findings. 1.1 Project Background and Funding The four-year project summarized in this report was funded in part by South Florida Water Management District (SFWMD) Contract No. RS040348, “Pasture Water Management for Reduced Phosphorus Loading in the Lake Okeechobee Watershed”. The project started in January 2005 and includes project data collected through October 2008. The project was the second in a series of projects designed to test the efficacy of water quality best management practices to reduce nutrient loads from cattle pastures. These projects were executed within the context of a Memorandum of Understanding, (MOU) established in 2004 among Archbold Expeditions, the South Florida Water Management District (SFWMD), the Florida Department of Agriculture and Consumer Services (FDACS), the Florida Department of Environmental

Final Report, SFWMD Contract No. RS040348 | 10Pasture Water Management for Reduced Phosphorus Loading in the Lake Okeechobee Watershed
Protection (FDEP), the University of Florida, Institute of Food and Agricultural Sciences (UF-IFAS), the United States Department of Agriculture Agricultural Research Service (USDA-ARS), the USDA Natural Resources Conservation Service (USDA-NRCS) and the Florida Cattlemen’s Association (FCA). The original MOU (1994– 2004) among the SFWMD, Archbold and UF-IFAS called for a series of best management practices (BMPs) to be examined on experimental pastures. The first project examined the effects of cattle stocking density on nutrient loads in surface runoff from improved and native pastures. That study showed that cattle stocking density had no measureable effect on nutrients in surface runoff, and that elevated P loads in surface runoff from improved pastures was due primarily to past fertilizer use (Capece et al 2007, Zielinski et al. 2007). This result prompted the MOU technical advisory team to design a study to examine the influence of pasture water management on nutrient runoff. The overall objective of the project was to evaluate the technical feasibility of on-ranch retention/detention of water as an approach for controlling phosphorus losses from beef cattle ranches. Financial support for the current project was provided by SFWMD and the FDACS. Funding from SFWMD supported field research staff, installation of water control structures, analysis of water samples, and partial analysis of nutrient load and runoff data. Additional funds were provided by FDACS for the first two years of the project to support analysis of hydrologic and nutrient load data, including hydrologic modeling, as well as analysis of soil chemistry and forage quality in the experimental pastures. 1.2 Project objectives The overall objective of the project was to evaluate the technical feasibility of on-farm retention/detention of water in controlling phosphorus losses from beef cattle ranches and assess potential impacts of this practice on cattle production. Water control structures were installed in the ditches to allow management of water in the pastures during high and low flow periods. The specific project objectives were to:
1. Document the effects of water storage and reduced flow on the quality of water leaving the pastures.
2. Determine nutrient load reductions from the pastures by integrating flow and nutrient
concentration data for surface runoff. 3. Evaluate forage yield and quality, and animal performance as influenced by water
retention treatments. 4. Identify specific water management practices that could be implemented on a watershed-
wide basis. These best management practices (BMPs) would have to be practical from a producer’s point of view and have a potential for significantly reducing phosphorus loads.

Final Report, SFWMD Contract No. RS040348 | 11Pasture Water Management for Reduced Phosphorus Loading in the Lake Okeechobee Watershed
1.3 Personnel and Responsibilities The project personnel and their primary responsibilities are illustrated in Figure 1. More detailed descriptions of the responsibilities of MAERC staff are given below. Dr. Patrick Bohlen (MacArthur Agro-ecology Research Center).
o Responsible for on-site project administration and management including hiring and supervision of project field support staff, coordination with collaborating investigators, and preparation of deliverables. Dr. Bohlen also supervised and participated in data analysis and management and preparation of reports, presentations and a scientific manuscript.
Dr. Ken Campbell, Dr. Greg Kiker, Dr. Chris Martinez (University of Florida Agricultural and
Biological Engineering Dept.) o Oversight and supervision of the analysis of the water flow and chemistry data and
calculation of loads for 2005-2006 data. Evaluated nutrient load and hydrologic datasets using ACRU2000, a hydrologic/water quality model currently in use at UF-IFAS. This part of the project was supported by a separate contact with the Florida Dept. of Agriculture and Consumer Services (FDACS) for 2005-2006. Dr. Campbell retired in 2005 and Dr. Greg Kiker took over management of the project with graduate student and postdoctoral associate, Dr. Chris Martinez.
Dr. John Capece (Southern DataStream)
o Dr. Capece was responsible for supervising analysis of field monitoring data, including calculations of runoff and nutrient loading from 2005-2007. This work was supported through the FDACS contract awarded to Ken Campbell of the UF Dept. of Biological and Agricultural Engineering. The calculation of runoff and loads in the final year of the project (2008) was performed by Dr. Patrick Bohlen at MAERC with his research assistant, Stephanie Little.
Rachel West (Research Assistant, MacArthur Agro-Ecology Research Center)
o Assisted with weekly collection of weather station data, flume/sampler site data, water sample collection, and maintenance of sampling sites and weather stations. Prepared quarterly data reports and deliverables.
Stephanie Little (Research Assistant, MacArthur Agro-Ecology Research Center)
o Stephanie took over Rachel West’s responsibilities July 2008. She continued with the routine monitoring through October 2008, and worked through January 2009 on data analysis and calculation of runoff and nutrient loads for 2008.
PPB Environmental Labs, Inc., Gainesville, FL ELAB, Inc, Ormond Beach, FL (now part of Pace Analytical Services, Inc.)
o Laboratory analysis and laboratory QA/QC for surface and groundwater samples. o FDOH-ELCP NELAC Certification Number E82001

Final Report, SFWMD Contract No. RS040348 | 12Pasture Water Management for Reduced Phosphorus Loading in the Lake Okeechobee Watershed
2 PROJECT DESIGN Water control structures were installed in 2004/5 in four of eight 50-acre pastures instrumented to measure total water volume and concentration of chemical constituents in surface runoff. The structures were fitted with riser boards to maintain elevated ground water levels and retain water in the main drainage ditches of the pastures with control structures. The project was designed to evaluate nutrient loads in surface runoff from the pastures as well as soil phosphorus availability, forage quality and cattle production factors. The soil and forage components were completed in 2005 and 2006, and the surface runoff and nutrient load measurements were made from June 2005 through October 2008.
Odi Villapando, Ph.D.
SFWMD Project Manager 1-800-432-2045 ext. 2936
Michael Wright
SFWMD Data Validation Supervisor
1-800-432-2045
Patrick Bohlen, Ph.D.
MAERC Project Manager
(863) 699-0242
Field Activities/Evaluations Analytical Activities Hydrologic Evaluations (supported FDACS contract, 2005-2006 only)
Steven Hollingsed MAERC Field
Operations Supervisor/QA Officer
(863) 699-0242
ELAB, Inc
FDOH Cert.# E82001
(352) 377-2349
Ken Campbell, P.E. (2005-2006) Greg Kiker (2006)
Chris Martinez (2006)
University of Florida
Rachel West (2005-2008) Stephanie Little (2008-2009)
MAERC Research Assistants
(supported by District contract)
John Capece, P.E. (2005-2006) Southern DataStream
Figure 1. Flow chart illustration of project personnel and their primary responsibilities.

Final Report, SFWMD Contract No. RS040348 | 13Pasture Water Management for Reduced Phosphorus Loading in the Lake Okeechobee Watershed
2.1 Experimental Pastures This study was conducted at the MacArthur Agro-ecology Research Center at Buck Island Ranch, a 4,290-ha cattle ranch owned by the John D. and Catherine T. MacArthur Foundation and leased to Archbold Biological Station. The ranch is located in the Indian Prairie (C-41) watershed sub-basin (Figure 2), and is managed at commercial production levels (~3,000 cows) for research purposes. The project area was included in a previous study funded by the SFWMD that examined the influence of cattle stocking density on nutrient runoff from cattle pastures (Swain et al. 2007, Capece et al. 2007). The experimental pastures were established in a 162-ha area of improved pasture (27º 8.7′ N, 81º 10.6′ W) dominated by Bahia grass (Paspalum notatum Flüggé) (Table 1). From the early 1970s until 1987 this area was fertilized annually with UF-IFAS recommended amounts of nitrogen, phosphorus and potassium (most likely 56 kg N ha-1 as NH4SO4 or NH4NO3, and 34-90 kg of P2O5 and K2O ha-1), from 1987 until 1995 received only N at 56 kg ha-1, applied between March and May, usually annually (Swain et al. 2007). The area was subdivided with fences and berms in 1996-1998 into eight 50-acre paddocks (Figure 3). Pasture elevations ranged from 25.9-27.9 ft (7.9-8.5 m) (NGVD29), sloping gradually to the southeast and draining through a series of ditches into the Harney Pond Canal to the south. The surface runoff from each plot was isolated from adjacent plots by the construction of ditches and berms along their margins. Each pasture had a series of regularly spaced shallow (~45 cm deep) ditches oriented east-west and spaced approximately 45 m apart which drained into larger perimeter ditches that collected runoff from individual pastures and routed it through a trapezoidal flume at the downstream end of each pasture (Figure 4). Final flume elevations ranged from 28.8-25.08 feet AMSL (NGVD29, Table 2). The flumes were equipped with an ISCO 3700 automatic sampler for collection of flow-weighted samples of surface runoff from each pasture (Figure 4). The 1-foot trapezoidal flumes had a peak flow capacity of seven cubic feet per second (cfs). There were stilling wells, floats and digital encoders (Model SE-105S, Enviro-systems, Thousand Oaks, CA) that monitored upstream and downstream water depth, in the throat of the flume, from which flow
Figure 2. Location of Buck Island Ranch in
the Lake Okeechobee watershed.

Final Report, SFWMD Contract No. RS040348 | 14 Pasture Water Management for Reduced Phosphorus Loading in the Lake Okeechobee Watershed
Figure 3. Aerial image of the experimental pastures showing the location of the flumes, groundwater wells, weather station and water control structures.
SP2
SUMMER PASTURES 50 ACRES
SP4SP3SP1 SP5 SP6 SP8SP7
FlumesGroundwater wellsWater control structures

Final Report, SFWMD Contract No. RS040348 | 15 Pasture Water Management for Reduced Phosphorus Loading in the Lake Okeechobee Watershed
Table 1. Percent cover of vegetation on the experimental pastures determined in 1995 (based on data presented in Werner et al. 1998). F and P values from a Nested ANOVA of percent cover for each species among pastures, split for summer versus winter pastures, d.f. = 7. Bold indicates significant differences among pastures SP1-SP8.
Scientific Name Common name SP1 SP2 SP3 SP4 SP5 SP6 SP7 SP8 F P
Paspalum notatum Flüggé bahia grass 87% 76% 88% 93% 84% 87% 63% 78% 0.94 0.482Axonopus furcatus (Flüggé) Hitchc. carpet grass 11% 3% 10% 1% 7% 29% 17% 2.50 0.024Setaria parviflora (Poir.) Kerguélen foxtail 9% 3% 1.68 0.130Cynodon dactylon (L.) Pers. bermuda grass 2% 7% 0.88 0.525Paspalum dilatatum Poir. dallis grass 9% 0.92 0.495Centella asiatica (L.) Urban centella 1% 1% 2% 1% 2% 1.38 0.231Sporobolus indicus (L.)R.Br. smut grass 4% 2% 1% 2.12 0.054Andropogon virginicus (L.) bluestem 2% 1% 2% 1% 0.86 0.544Paspalum urvillei Steud. vasey grass 1% 2% 2% 1.04 0.415Juncus effusus L. soft rush 2% 1% 1% 0.73 0.649Cyperaceae spp. sedges 1% 1% 1% 0.76 0.625Eupatorium capillifolium Lam. dog fennel 2% 1.00 0.440Phyla nodiflora (L.) Greene lippia 1% 1.00 0.440Hydrocotyle umbellata L. pennywort 1% 1.00 0.440Polygonum sp. smartweed <1% 1.00 0.440

Final Report, SFWMD Contract No. RS040348 | 16Pasture Water Management for Reduced Phosphorus Loading in the Lake Okeechobee Watershed
Table 2. Flumes entrance and exit elevations (NGVD29) and surveyed slopes (ft) measured in 2006 and 2008.
Station code Flume
upstream elevation (ft)
Flume downstream elevation (ft)
Flume slope 2006 (ft)
Flume slope 2008 (ft)
SP1 25.02 25.07 -0.05 -0.01 SP2 25.06 25.06 0.00 0.00 SP3 25.08 25.08 0.00 0.00 SP4 24.79 24.76 0.03 0.03 SP5 24.89 24.87 0.02 0.00 SP6 24.87 24.89 -0.02 -0.04 SP7 24.80 24.80 0.00 0.02 SP8 24.88 24.88 0.00 0.00
rates and volumes were determined. Readings from the shaft encoders were recorded by data loggers (CR10X, Campbell Scientific, Logan, UT) which were programmed to pulse automatic water samplers (Model 3700, ISCO, Inc, Lincoln, NE) to collect discrete samples based on flow volume calculations and hydrograph geometry. The low relief of the pastures relative to the changing water levels in the adjacent Harney Pond Canal required that the discharge measurement and sampling system accommodate flow in both directions, including inflow from the canal as well as runoff to the canal from each individual pasture. Flume elevations ranged from 24.80 to 25.08 feet AMSL (NGVD29). There was a 15-ft groundwater well on each plot for monitoring water table depth and groundwater quality. The wells were fitted with pressure transducers attached to a datalogger that recorded groundwater elevation in every 20 minutes. The data were transmitted telemetrically directly to the SFWMD via one of their regional towers. A 0.5 ha resolution soil survey conducted by the USDA-NRCS in June 1997 showed four soil series at the summer pastures sites; 90.7% of the area was Felda fine sand, a sandy or loamy, siliceous, and hyperthermic alfisol. A small portion (1.6% of area) of the Felda soils was overlain by a thin layer (2.5–15 cm) of muck. True muck soils present were Tequesta (8.8%) and Gator (0.4%); the Tequesta depressions had about 20–25 cm of muck with an argillic layer (Bt/clay enriched layer) 50–130 cm below the surface. Bradenton fine sand occurred in very small amounts (0.2%) under cabbage palm hammocks. There was
Figure 4. Photo of flume structure showing 1) two stilling wells (top center) containing shaft encoders to monitor water levels in the flume; and 2) an ISCO automatic water sampler (left) that collects samples just upstream of the flume.

Final Report, SFWMD Contract No. RS040348 | 17Pasture Water Management for Reduced Phosphorus Loading in the Lake Okeechobee Watershed
no significant differences among the summer pastures in terms of major soil series (muck or muck layer versus non-muck soils) (χ2= 13.81, P>0.05). Wetland soils in the summer pastures accounted for 9.2% of the total pasture area, with S1 and S8 having the highest percent cover of wetlands, although the proportion of wetland soils versus non-wetland soils did not differ significantly among pastures S1-S8 (χ2=6.39, P>0.05). It is assumed that any loss of nutrients through subsurface flow was minimal relative to surface runoff because of the presence of the impermeable argillic horizon and because significant surface runoff only occurs when the ground water is near the surface. 2.2 Water Retention Treatments Plots SP1-SP4 and plots SP5-SP8 were blocked separately to simplify engineering design and for a better-balanced design from a demonstration perspective. Two water treatments were evaluated; reduced flow and uninterrupted flow. Reduced flow involved holding water back in the pastures while maintaining a pre-determined minimum depth of surface water in the main drainage ditch during flooded periods using riser board water control structures (Figures 5and 6). The water retention treatment was imposed on plots SP1-SP4 (Block 1) by installing two flashboard riser control structures in the main drainage ditch of each plot, one structure close to the existing flume and another at midway up the ditch (Figure 3). The water level in the ditch was controlled by inserting flashboards in the structures. There were a total of eight structures installed in Plots SP1-SP4, two in each pasture. No structures were installed in plots SP5-SP8 (Block 2), which served as the uninterrupted flow treatment. Cattle were allowed to graze the pastures and the stocking rates in each pasture were recorded throughout the study period, with an effort made to stock them at even rates. In each pasture with water control structures (SP1-SP4), one structure was installed just upstream of the flume at the south end of the pasture and one approximately halfway along the main north-south drainage ditch in each pasture. Elevations of the boards in the structures were measured in 2005 and 2006 and ranged from 26.8-27.31 feet NGVD29 (Table 3). 2.3 Surface Water Sampling Surface runoff leaving each plot was sampled via an ISCO 3100 automatic water sampler and analyzed for total Kjeldahl nitrogen (TKN) nitrate/nitrite (NOx), ammonium (NH4
+), and total phosphorus (TP). Total N was calculated at TKN plus NOx.
Figure 5. Schematic of flashboard riser control structure that was installed to hold water at a specified level in the drainage ditches conveying surface runoff from the experimental pastures.
Final Report, SFWMD Contract No. RS040348 | 18Pasture Water Management for Reduced Phosphorus Loading in the Lake Okeechobee Watershed
Discrete 800 mL samples were collected on either a flow or timed basis depending on flow conditions and collection schedules. Flow data from the flumes were collected and combined with nutrient concentration data from the water samples to calculate nutrient loading rates. In addition to the autosampler samples, manual surface water grab samples were collected in 2005-2006 just upstream of the flume structures in each pasture during flow events, and included both unfiltered preserved and filtered unpreserved samples. Preserved samples were analyzed for TKN, NO3
-, and NH4+. Unpreserved filtered manual grab samples were analyzed for soluble
reactive phosphorus (SRP) and nitrate/nitrite (NOx). Collected samples were placed on ice and shipped to an analytical lab (originally PPB Environmental Labs, Inc., Gainesville, FL, and then ELAB, Inc, Ormond Beach, Florida) where they were analyzed according to the methods and requirements of the Florida Department of Environmental Protection. In each pasture, there were groundwater wells instrumented with pressure transducers that monitored ground water stage at 20 minute intervals. Groundwater samples were collected quarterly from the wells and analyzed for various nitrogen and phosphorus species as described above for manual surface water grab samples. All field activities were performed in accordance with FDEP SOP 001/01.
Figure 6. Photo of water control structure installed just upstream of the water monitoring
station at the south end of pasture SP2. The corrugated steel structure has gap on the middle with c-channel to allow addition of wooden boards to retain water at a desired level behind the structure. Steel braces on the downstream side of the opening provide extra support at the center of the structure.

Final Report, SFWMD Contract No. RS040348 | 19Pasture Water Management for Reduced Phosphorus Loading in the Lake Okeechobee Watershed
2.4 Quality Assurance Activities A Water Quality Monitoring Plan for the project was submitted on December 17, 2004. This manual summarizes the basic project design, outlines the responsibilities of MAERC and SFWMD personnel working on various aspects of the project, and details the types of data being collected, and QA/QC and maintenance procedures for the project. As required in the Water Quality Monitoring Plan, we developed a MAERC Quality Manual in January 2005, detailing our on-site field and laboratory QA/QC procedures. All the procedures outlined in these documents have been followed throughout the project. 3 PASTURE AND WATER MANAGEMENT ACTIVITIES 3.1 Pasture Management Pastures were maintained with rotational grazing management throughout the study period (see below). They were fertilized only once during the study period in April 2005 with liquid nitrogen fertilizer (19-0-0, NPK) at a rate of 50 lbs pounds N per acre (56 kg ha-1). The pastures were mowed once between July 30 and August 17, 2007 to control weeds. There were no other significant pasture management activities during the course of the study. 3.2 Management of Water Control Structures Standard 2″x6″ wooden boards were used to set the level of the water control structures. Elevations of the flashboards were set at approximately 6-8″ below the pasture level adjacent to
Table 3. Elevation in feet above mean sea level (NGVD29) of water control structures and flashboards in the project pastures as determined in September 2005 and March 2006.
Control structure elevation1 Flashboard elevation Pasture North structure South structure North structure South structure September 2005
SP1 28.20 27.30 27.37 26.80 SP2 27.61 28.89 27.11 27.14 SP3 27.35 28.10 27.35 27.14 SP4 28.12 28.02 27.16 27.23 March 2006 SP1 28.12 27.48 27.29 26.94 SP2 27.57 29.10 27.08 27.31 SP3 27.30 28.26 26.26 27.25 SP4 28.12 27.82 27.13 26.99
1Elevation is for the top of the structure at the center of riser opening

Final Report, SFWMD Contract No. RS040348 | 20Pasture Water Management for Reduced Phosphorus Loading in the Lake Okeechobee Watershed
the structures (Table 3). Elevations of structures were determined in September 2005 and again in March 2006. The difference between the two sampling dates in the elevation of the structures (-0.21 – 0.20 ft) was greater for the south structures than the north structures, and was likely due to settling or uplift. The structures were stabilized with concrete bags in late summer of 2005. To prevent seepage through the riser boards, plastic sheets (¼″-thick polyethylene) were placed on the upstream side of the boards on September 6, 2007. These sheets are held in place by ¾″ neoprene tubing pressing into the C channel behind the boards to form a water tight seal. This plastic plate acted to prevent seepage around or between the boards. 3.3 Cattle Management and Feed Supplements 3.3.1 Herd stocking rates and rotation Cattle were managed to maintain approximately even stocking densities across all pastures (Figures 7-9), although the stocking rates in the pastures with reduced flow averaged 24 percent greater than the stocking rates in pastures with uninterrupted flow control (Table 4). It was not possible to maintain the same number of animals on the pastures throughout the year or between treatment due to operational restraints, but the ranch manager made an effort to maintain similar stocking rates over time. Herds were rotated among pastures and the animals rotated among pasture SP1-SP4 and SP5-SP8 were kept apart and treated as two separate herds. Herd veterinary care, including annual vaccines and deworming were performed as part of routine
Table 4. Average annual stocking density in the experimental pastures for 2006, 2007, and 2008 (through October 31, 2008). Average annual values followed by a different lowercase superscript letter are significantly different at the α = 0.05 level. Average stocking rates over the whole period were significantly greater in the pastures with riser structures than in pastures without structures as indicated by differences in uppercase superscripts (P=0.0002).
Flow Average annual stocking rate (AU*/ha) Pasture ID Treatment 2006 2007 2008 2006-2008
SP1 Reduced 0.89 1.09 1.46 1.06 SP2 Reduced 1.37 1.09 1.25 1.17 SP3 Reduced 1.59 1.05 1.26 1.23 SP4 Reduced 1.24 0.99 1.28 1.10 Avg. Reduced 1.27a 1.06ab 1.31a 1.14A SP5 Uninterrupted 0.74 1.52 0.56 0.91 SP6 Uninterrupted 0.95 1.16 0.96 0.97 SP7 Uninterrupted 1.00 1.26 0.55 0.91 SP8 Uninterrupted 0.74 1.22 0.94 0.91 Avg. Uninterrupted 0.86b 1.29a 0.75b 0.92B *AU, animal unit; 1AU=1 cow-calf pair.

Final Report, SFWMD Contract No. RS040348 | 21Pasture Water Management for Reduced Phosphorus Loading in the Lake Okeechobee Watershed
herd management at Buck Island Ranch. Data collected on the cow herds in the pastures included: herd size, stocking days, body condition of cows, death loss, stocking with bulls, conception rate, calf number and calf weight and weight gain rates. 3.3.2 Feed and mineral supplements Feed and mineral supplements were provided to the herds to meet herd mineral and energy requirements (Table 5). Molasses-based feeds were added in the winter grazing cycle (November-March) as an energy supplement during the dry season when pasture productivity was inadequate to meet the herds energy demands. Molasses was provided in both liquid and block form. Mineral was provided as a salt-based trace mineral mix, primarily P.D.Q. and P.D.Q.-7 Pasture Supplement (Lakeland Animal Nutrition, Lakeland, FL). Information on the total amount of each type of molasses and mineral input and the mineral composition of each are recorded in the Buck Island Ranch PastureStar electronic database, archived at the MacArthur Agro-ecology Research Center.
Table 5. Total feed and mineral inputs into the experimental pastures during 2006-2008.
Average Annual Amount Added Per Pasture
Year Treatment Molasses Molasses Block Mineral
2006 Uninterrupted 1,400 NA 200
Riser 3,280 NA 637
2007 Uninterrupted 125 3,687 825
Riser 1,695 1,625 662
2008 Uninterrupted 125 1,375 475
Riser 292 1,250 525
Total Uninterrupted 1,650 5,062 1,500
Riser 5,267 2,875 1,824

Final Report, SFWMD Contract No. RS040348 | 22 Pasture Water Management for Reduced Phosphorus Loading in the Lake Okeechobee Watershed
Figure 7. Stocking densities in the experimental pastures in 2006. Black shaded areas indicate periods when pastures were stocked, and the number indicates the number of cattle in each pasture during those stocked periods.
JAN FEB MAR APR MAY JUN JUL AUG SEP OCT NOV DEC
SP1 19 40
SP2 40 40 17 40
SP3 40 40 40 40
SP4 40 40 16 40
SP5 40 40
SP6 40 32 40
SP7 40 40 40
SP8 40 40
Figure 8. Stocking densities in the experimental pastures in 2007. Black shaded areas indicate periods when pastures were stocked and the
number indicates the number of cattle in each pasture during those stocked periods. JAN FEB MAR APR MAY JUN JUL AUG SEP OCT NOV DEC
SP1 40 40 31
SP2 40 34 35 30
SP3 40 56 36 30
SP4 40 36 30
SP5 58 35 36 31
SP6 22 35 36 21 30
SP7 40 35 38 10 30
SP8 29 42 35 36 30

Final Report, SFWMD Contract No. RS040348 | 23 Pasture Water Management for Reduced Phosphorus Loading in the Lake Okeechobee Watershed
Figure 9. Stocking densities in the experimental pastures in 2008 through October 31. Black shaded areas indicate periods when pastures were stocked and the number indicates the number of cattle in each pasture during those stocked periods.
JAN FEB MAR APR MAY JUN JUL AUG SEP OCT NOV DEC
SP1 31 35 96 77
SP2 30 64 77 77
SP3 30 77
SP4 30 77 77
SP5 31 65
SP6 30 65 58
SP7 30 65
SP8 31 65 54

Final Report, SFWMD Contract No. RS040348 | 24 Pasture Water Management for Reduced Phosphorus Loading in the Lake Okeechobee Watershed
4 METEOROLOGICAL CONDITIONS Total annual rainfall and distribution varied among years, and was near the long term average for the region (~52 in) in 2005 and 2008, but was below average in 2006 and 2007 (Figure 10). The drought period during 2006-2007 was one of the most severe droughts in the period of record for south Florida. Total rainfall for August through September in 2007 was especially low, leading to extremely dry conditions during a period that would normally be associated with flooding and surface runoff (Figure 11). The fall of 2007 was the first year on record that the small depressional wetlands at Buck Island Ranch never became inundated, even during the normally wet fall season. The rainfall in August through September in 2005 was also relatively low but this low rainfall was preceded by high rainfall in June and followed by heavy rains in October, both of which were associated with tropical storms that contributed to high runoff events. Rainfall in 2006 and 2008 was more evenly distributed over the wet season months of June through September (Figure 11).
Figure 10. Total annual rainfall as measured at the manual rain gage at the
MAERC main weather station.

Final Report, SFWMD Contract No. RS040348 | 25 Pasture Water Management for Reduced Phosphorus Loading in the Lake Okeechobee Watershed
5 SURFACE WATER The low elevation of the pastures and their proximity to the C-41 (Harney Pond) Canal, a major managed regional water way, resulted in situations where water could back flow into the pastures, depending on the managed elevation of the canal relative to water levels in the pastures. Surface runoff generally occurred only during wet periods when ground water elevations and rainfall amounts were high, but back flow events could occur during dry periods whenever the water elevation in the C-41 canal was raised as part of regional water management regimes. Thus, total net runoff from the pastures could be positive or negative, and back flow and forward flow events could be separated in time. Thus the flow data for the pastures was analyzed not only as total net flow but also separately for forward flow and back flow events. 5.1 Flow Data Total net runoff (forward minus backward flow) from the pastures was greatest in 2005, did not differ significantly between 2006 and 2008 and was negative in 2007 due to drought conditions and lack of forward flow events (Table 6). Annual trends in total forward flow mirrored trends in total net runoff (Table 7), but total back flow into the pastures did not differ among years (Table 8) indicating that back flow was related less to rainfall conditions than on the control of downstream water levels in the C-41 Canal.
0.00
2.00
4.00
6.00
8.00
10.00
12.00
14.00M
onth
ly ra
infa
ll (in
ches
)2005
2006
2007
2008
Figure 11. Monthly rainfall at the MAERC main weather station manual rain gauge in
2005-2008.

Final Report, SFWMD Contract No. RS040348 | 26 Pasture Water Management for Reduced Phosphorus Loading in the Lake Okeechobee Watershed
Table 6. Average annual values of characteristics of net surface runoff in the
experimental pastures from 2005-2008. The period of measurement includes all runoff collected from June-December in 2005, the entire calendar year in 2006 and 2007, and January-October in 2008. Values within a row followed by a different letter are significantly different at 0.05 α level.
Runoff variable 2005 2006 2007 2008 SEM* Total net runoff (cm) 52.63a 36.35b -3.01c 27.67b 2.69
NH4 (mg/L) 0.15c 0.24b 0.31a 0.30a 0.01 NOx (mg/L) 0.01a 0.02a 0.12b 0.12b 0.01 TKN (mg/L) 3.04 2.91 3.13 3.26 0.15
TP (mg/L) 0.59 0.75 0.62 0.60 0.06
NH4 load (kg/ha) 0.83a 0.91a -0.06b 0.84a 0.09
NOx load (kg/ha) 0.05b 0.06b -0.09c 0.20a 0.03 TKN load (kg/ha) 14.87a 11.49b -0.61c 9.36b 0.71 TP load (kg/ha) 3.39a 3.39a -0.11c 1.72b 0.19
*SEM=standard error of the means for the effect of year in the ANOVA. Table 7. Average annual values for variables associated with forward flow from the
experimental pastures from 2005-2008. The period of measurement includes all runoff collected from June-December in 2005, the entire calendar year in 2006 and 2007 and January-October in 2007. Values within a row followed by a different letter are significantly different at 0.05 α level.
Runoff variable 2005 2006 2007 2008 SEM* Forward flow (cm) 52.72a 40.33b 2.65c 32.66b 2.30 NH4 (mg/L)§ 0.16c 0.23b 0.31a 0.30ab 0.02 NOx (mg/L)§ 0.01b 0.01b 0.07a 0.07a 0.004 TKN (mg/L)§ 2.83 2.97 3.22 3.35 0.22 TP (mg/L)§ 0.65b 0.89a 0.62b 0.70ab 0.07 NH4 load (kg/ha) 0.84a 0.97a 0.08b 0.99a 0.07 NOx load (kg/ha) 0.05b 0.06b 0.02b 0.23a 0.02 TKN load (kg/ha) 14.90a 12.27b 0.90c 10.94b 0.63 TP load (kg/ha) 3.39a 3.49a 0.16c 2.05b 0.19 §Values are flow-weighted concentrations. *SEM=standard error of the means for the effect of year in the ANOVA.
Final Report, SFWMD Contract No. RS040348 | 27 Pasture Water Management for Reduced Phosphorus Loading in the Lake Okeechobee Watershed
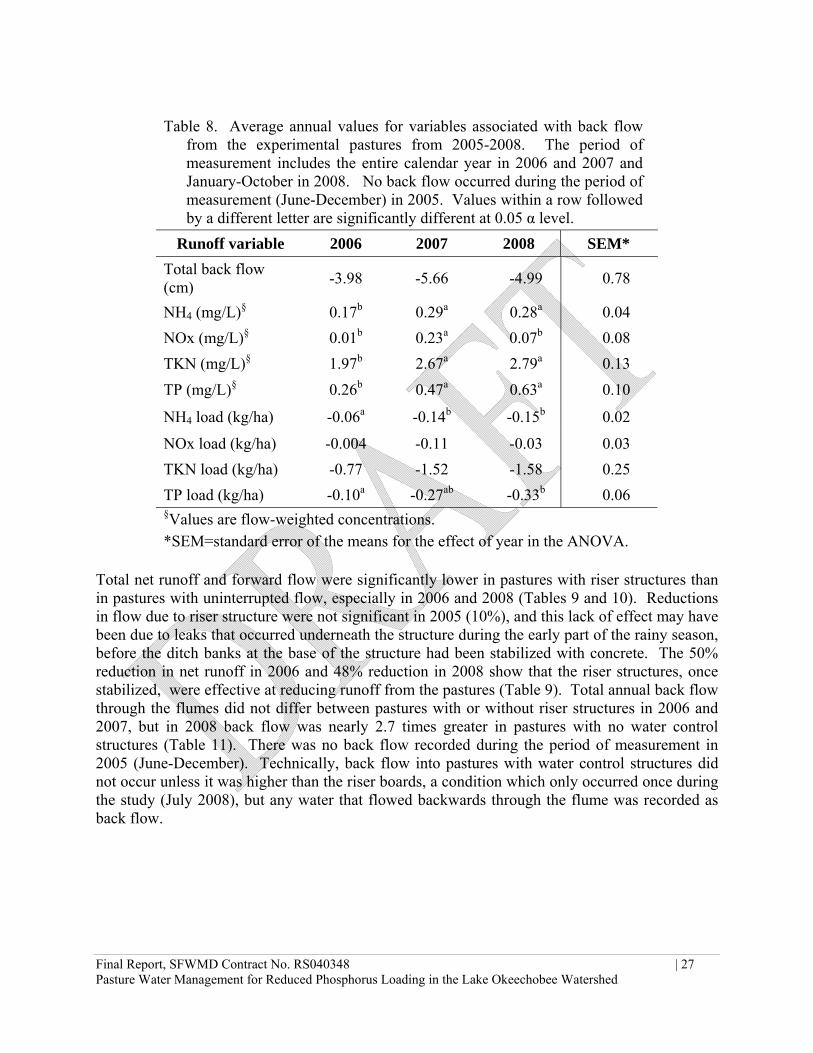
Table 8. Average annual values for variables associated with back flow
from the experimental pastures from 2005-2008. The period of measurement includes the entire calendar year in 2006 and 2007 and January-October in 2008. No back flow occurred during the period of measurement (June-December) in 2005. Values within a row followed by a different letter are significantly different at 0.05 α level.
Runoff variable 2006 2007 2008 SEM* Total back flow (cm) -3.98 -5.66 -4.99 0.78
NH4 (mg/L)§ 0.17b 0.29a 0.28a 0.04 NOx (mg/L)§ 0.01b 0.23a 0.07b 0.08 TKN (mg/L)§ 1.97b 2.67a 2.79a 0.13 TP (mg/L)§ 0.26b 0.47a 0.63a 0.10
NH4 load (kg/ha) -0.06a -0.14b -0.15b 0.02
NOx load (kg/ha) -0.004 -0.11 -0.03 0.03 TKN load (kg/ha) -0.77 -1.52 -1.58 0.25 TP load (kg/ha) -0.10a -0.27ab -0.33b 0.06 §Values are flow-weighted concentrations. *SEM=standard error of the means for the effect of year in the ANOVA.
Total net runoff and forward flow were significantly lower in pastures with riser structures than in pastures with uninterrupted flow, especially in 2006 and 2008 (Tables 9 and 10). Reductions in flow due to riser structure were not significant in 2005 (10%), and this lack of effect may have been due to leaks that occurred underneath the structure during the early part of the rainy season, before the ditch banks at the base of the structure had been stabilized with concrete. The 50% reduction in net runoff in 2006 and 48% reduction in 2008 show that the riser structures, once stabilized, were effective at reducing runoff from the pastures (Table 9). Total annual back flow through the flumes did not differ between pastures with or without riser structures in 2006 and 2007, but in 2008 back flow was nearly 2.7 times greater in pastures with no water control structures (Table 11). There was no back flow recorded during the period of measurement in 2005 (June-December). Technically, back flow into pastures with water control structures did not occur unless it was higher than the riser boards, a condition which only occurred once during the study (July 2008), but any water that flowed backwards through the flume was recorded as back flow.

Final Report, SFWMD Contract No. RS040348 | 28 Pasture Water Management for Reduced Phosphorus Loading in the Lake Okeechobee Watershed
5.2 Nutrient Concentrations 5.2.1 Ammonia concentrations Average annual NH4
+ concentrations ranged from 0.15 to 0.31 mg/L and were significantly greater in 2007-2008 than in 2005-2006 (Table 6). Annual trends in flow-weighted NH4
+ concentrations in forward flow and back flow were similar to trends for net runoff (Tables 6-8) and there were no significant differences in NH4
+ concentrations between forward flow and back flow. The water retention treatment did not have a significant effect on NH4
+ concentrations in any year for total runoff, forward flow or back flow, except in 2008 when the average flow-weighted NH4
+ concentration in back flow was greater in pastures without riser structures (Tables 9-11). 5.2.2 Nitrate/Nitrite concentrations Overall NOx concentrations were low relative to ammonium and other nutrients. The total average annual concentration of NOx was 0.068 mg L-1, which is significantly lower than the average NH4
+ concentration of 0.25 mg L-1. Annual NOx concentrations were greater in 2007-2008 than in 2005-2006 (Table 6). Annual flow-weighted NOx concentrations in forward flow were lower than average concentrations for net runoff but showed similar trends among years (Table 7). Flow weighted NOx concentrations of back flow were significantly higher in 2007, than in 2006 and 2008 (Table 8). The water retention treatment had no effects on average or flow-weighted NOx concentrations in total net runoff, forward flow or back flow in any year (Tables 9-11). 5.2.3 Total nitrogen concentrations Average annual TKN concentrations did not differ among years in total net runoff or forward flow, and the average annual concentration was 3.08 mg L-1 (Tables 6 and 7). The annual flow-weighted TKN concentration in back flow was greater in 2007-2008 than in 2006 (Table 8). Averaged over all four years, the average TKN concentration in net runoff was significantly greater in pastures with uninterrupted flow than in pastures with reduced flow (P=0.008). Flow-weighted TKN concentrations in forward flow were also greater in pastures with uninterrupted flow (3.42 mg L-1) than in pastures with reduced flow (2.77 mg L-1) (P=0.006, SEM=0.15). The flow-weighted TKN concentrations in back flow also were greater in pastures with uninterrupted flow (2.83 mg L-1) than in pastures with the water retention treatment (2.12 mg L-1) (P=0.0002, SEM=0.11), except in 2006 when there was no significant difference between treatments (Table 11). 5.2.4 Total phosphorus concentrations Total P concentration in net runoff did not differ among years (Table 6), but flow-weighted concentrations in forward flow were greater in 2006 than in 2005 and 2007, with intermediate

Final Report, SFWMD Contract No. RS040348 | 29 Pasture Water Management for Reduced Phosphorus Loading in the Lake Okeechobee Watershed
Table 9. Average annual values for variables associated with net surface runoff from experimental pastures with (SP1-SP4) or without (SP5-SP8) water control structures. The period of measurement includes all runoff collected from June-December in 2005, the entire calendar year in 2006 and 2007, and January-October in 2008.
Runoff variable Without
riser With riser
Percentage difference with riser SEM
Prob < |t| -------------------------2005------------------------- Total net runoff (cm) 55.03 50.23 -9% 1.12 0.03* NH4
+ (mg/L) 0.16 0.14 -14% 0.01 0.30 NOx (mg/L) 0.01 0.01 4% 0.00 0.80 TKN (mg/L) 3.13 2.96 -5% 0.24 0.64
TP (mg/L) 0.50 0.69 37% 0.07 0.11
NH4+ load (kg/ha) 0.95 0.72 -24% 0.13 0.27
NOx load (kg/ha) 0.06 0.05 -20% 0.01 0.40 TKN load (kg/ha) 16.38 13.36 -18% 0.98 0.07† TP load (kg/ha) 2.83 3.94 39% 0.34 0.06† -------------------------2006------------------------- Total net runoff (cm) 48.43 24.27 -50% 1.63 <0.0001***
NH4+ (mg/L) 0.25 0.23 -5% 0.00 0.41
NOx (mg/L) 0.02 0.02 1% 0.00 0.91
TKN (mg/L) 3.03 2.79 -8% 0.11 0.16
TP (mg/L) 0.71 0.80 12% 0.08 0.50
NH4+ load (kg/ha) 1.29 0.53 -59% 0.07 0.0002***
NOx load (kg/ha) 0.07 0.04 -49% 0.00 0.002**
TKN load (kg/ha) 15.98 7.00 -56% 0.79 0.0002***
TP load (kg/ha) 4.22 2.56 -39% 0.26 0.004**
-------------------------2007-------------------------
Total net runoff (cm) -2.25 -3.77 68% 1.44 0.48
NH4+ (mg/L) 0.33 0.29 -12% 0.02 0.20
NOx (mg/L) 0.08 0.16 92% 0.03 0.13
TKN (mg/L) 3.42 2.84 -17% 0.22 0.12
TP (mg/L) 0.61 0.64 5% 0.10 0.85
NH4+ load (kg/ha) -0.03 -0.08 146% 0.02 0.16

Final Report, SFWMD Contract No. RS040348 | 30 Pasture Water Management for Reduced Phosphorus Loading in the Lake Okeechobee Watershed
NOx load (kg/ha) 0.00 -0.18 -4,197% 0.08 0.16
TKN load (kg/ha) -0.53 -0.69 30% 0.31 0.73
TP load (kg/ha) -0.08 -0.15 77% 0.07 0.56
-------------------------2008-------------------------
Total net runoff (cm) 36.45 18.90 -48% 7.21 0.14
NH4+ (mg/L) 0.33 0.28 -13% 0.02 0.12
NOx (mg/L) 3.66 2.85 -22% 0.03 0.12
TKN (mg/L) 0.08 0.16 95% 0.27 0.08†
TP (mg/L) 0.58 0.62 7% 0.09 0.77
NH4+ load (kg/ha) 1.16 0.52 -55% 0.20 0.07†
NOx load (kg/ha) 0.27 0.12 -55% 0.06 0.11
TKN load (kg/ha) 13.27 5.45 -59% 1.55 0.01*
TP load (kg/ha) 1.88 1.58 -16% 0.31 0.51 †0.10≥P>0.05; *0.05≥P>0.01; **0.01≥P>0.001; ***P≤0.001
values in 2008 (Table 7). Flow-weighted TP concentrations in back flow (0.46 mg L-1) were significantly lower than in forward flow (0.72 mg L-1), and were higher in 2007 and 2008 than in 2006 (Table 8). The reduced flow treatment did not have a significant effect on overall TP concentrations, but flow-weighted TP concentrations in forward flow were significantly greater in pastures with reduced flow (0.79 mg L-1) than in pastures with uninterrupted flow (0.64 mg L-1) (P=0.05, SEM=0.05). Average flow-weighted concentrations in back flow were nearly the same in pastures with reduced flow (0.45 mg L-1) as in pastures with uninterrupted flow (0.46 mg L-1). 5.3 Nutrient Loads 5.3.1 Ammonium loads Average annual NH4
+ loads in total net runoff and forward flow were significantly lower in 2007 than in the other years, due to the low rainfall and runoff in 2007, but did not differ significantly among the other years (Tables 6 and 7). Ammonium loads in back flow were significantly greater in 2007 and 2008 than in 2006, again due primarily to differences in the total amount of back flow among years (Table 8). The water retention treatment significantly decreased overall NH4
+ loads (0.83 vs. 0.42 kg NH4+-
N ha-1, respectively in pastures without vs. with riser structures, P<0.0001). The effect was greatest in 2005 and 2008 (Table 9). There was no significant effect of the water retention treatment on NH4
+ loads in 2005, when runoff differences between pastures with or without riser
Final Report, SFWMD Contract No. RS040348 | 31 Pasture Water Management for Reduced Phosphorus Loading in the Lake Okeechobee Watershed
Table 10. Average annual values for variables associated with forward flow runoff from experimental pastures with (SP1-SP4) or without (SP5-SP8) water control structures. The period of measurement includes all runoff collected from June-December in 2005, the entire calendar year in 2006 and 2007, and January-October in 2008.
Runoff variable Without
riser With riser
Percentage difference with riser SEM
Prob < |t| -------------------------2005------------------------- Forward flow (cm) 55.21 50.23 -9% 1.12 0.02* NH4
+ (mg/L)§ 0.17 0.15 -15% 0.03 0.50 NOx (mg/L) § 0.01 0.01 -9% 0.00 0.66 TKN (mg/L)§ 2.98 2.67 -10% 0.21 0.34 TP (mg/L)§ 0.52 0.79 52% 0.07 0.03* NH4
+ load (kg/ha) 0.95 0.72 -24% 0.13 0.27
NOx load (kg/ha) 0.06 0.05 -20% 0.01 0.39 TKN load (kg/ha) 16.44 13.36 -19% 1.00 0.06† TP load (kg/ha) 2.84 3.94 39% 0.33 0.06† -------------------------2006------------------------- Forward flow (cm) 52.57 28.09 -47% 0.79 <0.0001***
NH4+ (mg/L)§ 0.26 0.21 -18% 0.01 0.02
NOx (mg/L) § 0.02 0.02 -2% 0.00 0.91 TKN (mg/L)§ 3.19 2.76 -14% 0.17 0.11 TP (mg/L)§ 0.83 0.97 17% 0.08 0.27 NH4
+ load (kg/ha) 1.35 0.59 -56% 0.06 0.0002***
NOx load (kg/ha) 0.08 0.04 -47% 0.01 0.004**
TKN load (kg/ha) 16.74 7.79 -53% 0.80 0.0002***
TP load (kg/ha) 4.30 2.69 -37% 0.26 0.004**
-------------------------2007-------------------------
Forward flow (cm) 3.96 1.34 -66% 0.18 <0.0001***
NH4+ (mg/L)§ 0.32 0.30 -6% 0.04 0.72
NOx (mg/L) § 0.06 0.07 21% 0.01 0.42 TKN (mg/L)§ 3.65 2.79 -24% 0.41 0.19 TP (mg/L)§ 0.61 0.63 3% 0.13 0.91 NH4
+ load (kg/ha) 0.13 0.04 -69% 0.01 0.004**

Final Report, SFWMD Contract No. RS040348 | 32 Pasture Water Management for Reduced Phosphorus Loading in the Lake Okeechobee Watershed
NOx load (kg/ha) 0.02 0.01 -57% 0.00 0.02*
TKN load (kg/ha) 1.45 0.36 -75% 0.15 0.002**
TP load (kg/ha) 0.24 0.08 -67% 0.04 0.04*
-------------------------2008-------------------------
Forward flow (cm) 43.72 21.60 -51% 6.25 0.05*
NH4+ (mg/L)§ 0.32 0.28 -14% 0.02 0.22
NOx (mg/L) § 0.07 0.07 -3% 0.01 0.87 TKN (mg/L)§ 3.86 2.84 -26% 0.36 0.10 TP (mg/L)§ 0.61 0.79 30% 0.12 0.31 NH4
+ load (kg/ha) 1.39 0.59 -57% 0.17 0.01*
NOx load (kg/ha) 0.32 0.15 -54% 0.05 0.05†
TKN load (kg/ha) 15.83 6.05 -62% 1.28 0.002**
TP load (kg/ha) 1.58 1.88 -27% 0.32 0.20 § Values are flow-weighted average concentrations. †0.10≥P>0.05; *0.05≥P>0.01; **0.01≥P>0.001; ***P≤0.001
structures were not large, and in 2007, when there was a lack of net runoff due to drought conditions; there was actually a net inflow of NH4
+ into the pastures that year. Ammonium loads in forward flow were significantly lower in pastures with reduced flow than in pastures with uninterrupted flow in all years except 2005 (Table 10). Ammonium loads in back flow were not affected by the water retention treatment in 2006 or 2007, but in 2008 the lower back flow into pastures with water retention structures was associated with lower NH4
+ loads in back flow to those pastures (Table 11). 5.3.2 Nitrate/nitrite loads Overall NOx loads were low relative to loads of other nutrients due to low NOx concentrations (Tables 6-11). The NOx loads in total runoff were significantly higher in 2008 than in other years and were significantly lower in 2007 than in other years (Table 6). The NOx loads in forward flow were also significantly higher in 2008 but did not differ among the other years, and NOx loads in back flow did not differ among years (Tables 7 and 8). Overall annual loads of NOx in net surface runoff were significantly lower in pastures with reduced flow (0.007 kg ha-1) than in pastures with uninterrupted flow (0.10 kg ha-1, P=0.01, SEM=0.02), although significant trends were not as apparent in individual years (Table 9). Annual trends were stronger for NOx loads in forward flow which also were lower in pastures with reduced flow (0.06 kg ha-1) than in pastures with uninterrupted flow (0.12 kg ha-1, P=0.003, SEM=0.01) (Table 10). The NOx loads in back flow were not affected by the water retention treatment (P=0.22, Table 11).

Final Report, SFWMD Contract No. RS040348 | 33 Pasture Water Management for Reduced Phosphorus Loading in the Lake Okeechobee Watershed
Table 11. Average annual values for variables associated with back flow into the
experimental pastures with (SP1-SP4) or without (SP5-SP8) water control structures. The period of measurement includes the entire calendar year in 2006 and 2007, and January-October in 2008. There was no back flow recorded in 2005 during the period of measurement (June-December).
Runoff variable Without
riser With riser
Percentage difference with riser SEM
Prob < |t| -------------------------2006------------------------- Back flow (cm) -4.14 -3.82 -8% 0.66 0.74 NH4
+ (mg/L)§ 0.18 0.16 -8% 0.03 0.75 NOx (mg/L) § 0.01 0.01 -13% 0.00 0.64 TKN (mg/L)§ 1.87 2.07 11% 0.12 0.26 TP (mg/L)§ 0.21 0.32 55% 0.07 0.27 NH4
+ load (kg/ha) -0.06 -0.06 -6% 0.01 0.71 NOx load (kg/ha) -0.01 0.00 -22% 0.00 0.53 TKN load (kg/ha) -0.76 -0.80 5% 0.12 0.82 TP load (kg/ha) -0.08 -0.13 57% 0.03 0.35 -------------------------2007-------------------------
Back flow (cm) -6.21 -5.11 -18% 1.45 0.61 NH4
+ (mg/L)§ 0.33 0.24 -27% 0.08 0.46 NOx (mg/L) § 0.03 0.43 1478% 0.20 0.21 TKN (mg/L)§ 3.25 2.09 -36% 0.18 0.00 TP (mg/L)§ 0.53 0.41 -23% 0.08 0.31 NH4
+ load (kg/ha) -0.16 -0.12 -25% 0.02 0.22 NOx load (kg/ha) -0.02 -0.19 +8% 0.08 0.20 TKN load (kg/ha) -1.98 -1.05 -47% 0.42 0.17 TP load (kg/ha) -0.32 -0.23 -30% 0.09 0.48 -------------------------2008-------------------------
Back flow (cm) -7.27 -2.70 -63% 7.21 0.02* NH4
+ (mg/L)§ 0.32 0.25 -22% 0.03 0.14 NOx (mg/L) § 0.06 0.08 28% 0.01 0.35 TKN (mg/L)§ 3.38 2.21 -35% 0.24 0.01

Final Report, SFWMD Contract No. RS040348 | 34 Pasture Water Management for Reduced Phosphorus Loading in the Lake Okeechobee Watershed
TP (mg/L)§ 0.65 0.63 -3% 0.23 0.94 NH4
+ load (kg/ha) -0.23 -0.07 -70% 0.04 0.03* NOx load (kg/ha) -0.04 -0.02 -48% 0.01 0.14 TKN load (kg/ha) -2.55 -0.60 -76% 0.43 0.02* TP load (kg/ha) -0.50 -0.16 -69% 0.11 0.07† § values are flow-weighted average concentrations †0.10≥P>0.05; *0.05≥P>0.01; **0.01≥P>0.001; ***P≤0.001
5.3.3 Total nitrogen loads Total annual TKN loads in surface runoff varied among years due mainly to differences in total net runoff, and ranged from -0.61 to 14.87 kg ha-1 (Table 6). The TKN loads in net surface runoff were greatest in 2005, intermediate in 2006 and 2008, and were negative in 2007. The annual patterns in TKN loads of forward flow were similar to the pattern of total net runoff, and TKN loads in back flow did not vary significantly among years (Tables 7 and 8). The TKN loads in surface runoff were significantly affected by year (P<0.0001) and water retention treatment (P<0.0001) and there was a significant interaction between year and treatment (P=0.0006). Overall annual TKN loads were 11.28 kg ha-1 in pastures with uninterrupted flow and 6.28 kg ha-1 in pastures with reduced flow (SEM=0.51). This pattern held in all years except the drought year, 2007, when loads were not different between treatments (Table 9). The effects of year and treatment on TKN loads in forward flow were similar to the effects on net surface runoff and were highly significant (P<0.0001) for year, treatment and their interaction (Table 10). The average annual TKN load for forward flow was 12.63 kg ha-1 in pastures with uninterrupted flow and 6.89 kg ha-1 in pastures with reduced flow (SEM=0.44). The pasture water retention treatment did not affect annual TKN loads in back flow in 2006 and 2007, but in 2008 TKN loads in back flow were greater in pastures with uninterrupted flow than in pastures with reduced flow (Table 11). 5.3.4 Total phosphorus loads Annual TP loads in surface runoff were significantly higher in 2005 and 2006 (3.39 kg ha-1 in both years) than in 2008 (1.72 kg ha-1) or 2007, when loads were negative (-0.11 kg ha-1) due to back flow exceeding forward flow in that year (Table 6). The annual TP loads in forward flow were similar but slightly higher than loads in net surface runoff (Table 7). In back flow the annual TP loads were greatest in 2008 and lowest in 2007 (Table 8). The water retention treatment had variable effects on TP loads in different years. In 2007 TP loads in net surface runoff were 39% higher (P=0.06) in pastures with reduced flow than in pastures with uninterrupted flow, but in 2006 TP loads were 39% lower in pastures with reduced flow, and in 2008 were 16% lower, but not significantly so, in pastures with reduced flow (Table 9). For TP loads in forward flow, the overall effect of the water retention treatment was

Final Report, SFWMD Contract No. RS040348 | 35 Pasture Water Management for Reduced Phosphorus Loading in the Lake Okeechobee Watershed
marginally significant (P=0.09), with lower overall TP loads in pastures with water control structures (2.43 kg ha-1) than in pastures with uninterrupted flow (2.11 kg ha-1). Annual TP loads in back flow trended (P=0.08) towards being higher in pastures with uninterrupted flow (-0.30 kg ha-1) than in pastures with riser structures (-0.17 kg ha-1) and this trend was strongest in 2008 when TP loads in back flow were greatest (Tables 8 and 11).
Table 12. Average nutrient concentrations in grab samples collected on five different sample dates during the 2005 rainy season and three days during 2006. Nutrient concentrations did not differ significantly between pasture with or without riser structure for any given parameter (P>0.10) for either year.
Nutrient concentration in grab samples (mg L-1)
Pasture NH4 NO3 NOx TKN SRP1 TP
2005 SP1 0.12 0.01 0.02 4.43 0.59 0.78 SP2 0.07 0.00 0.02 2.90 0.45 0.67 SP3 0.16 0.02 0.03 4.00 0.57 0.83 SP4 0.18 0.02 0.02 2.90 0.74 0.89
Avg Riser 0.13 0.01 0.02 3.56 0.59 0.79
SP5 0.13 0.00 0.02 3.60 0.93 1.01 SP6 0.11 0.01 0.02 3.09 0.62 0.76 SP7 0.11 0.01 0.02 3.07 0.64 0.79 SP8 0.23 0.04 0.03 3.62 0.62 0.77
Avg No Riser 0.14 0.02 0.02 3.35 0.70 0.83
2006 SP1 0.18 0.03 0.01 4.53 0.63 0.87 SP2 0.12 0.01 0.01 2.72 0.64 1.04 SP3 0.19 0.03 0.01 3.39 0.64 0.94 SP4 0.27 0.04 0.01 2.80 1.00 1.25
Avg Riser 0.19 0.03 0.01 3.36 0.73 1.03
SP5 0.16 0.01 0.01 3.56 1.05 1.31 SP6 0.16 0.02 0.01 3.36 0.79 0.98 SP7 0.17 0.02 0.01 3.87 0.75 1.08 SP8 0.30 0.06 0.01 2.82 0.76 0.98
Avg No Riser 0.20 0.03 0.01 3.41 0.84 1.09

Final Report, SFWMD Contract No. RS040348 | 36 Pasture Water Management for Reduced Phosphorus Loading in the Lake Okeechobee Watershed
5.4 Manual grab samples Grab samples were collected during five different flow events in 2005 (June 6, August 8, October 12 and 31, 2005 and February 6, 2006) and three different flow events in 2006 (February 6, August 22, September 13). Average nutrient concentrations for the different treatments were compared with a one-way ANOVA and all values with repeated-measures ANOVA. The pasture water management treatment did not significantly affect nutrient concentrations in grab samples in either year (Table 12). 6 GROUNDWATER 6.1 Groundwater Elevation Groundwater elevation was monitored by shallow wells installed at near the center of each pasture. The wells consisted of 2-inch PVC well casing installed to a depth of 15 feet. The upper 5 feet of each well was unscreened and the lower 10 feet was screened. Each well was fitted with a pressure transducer and data logger that recorded groundwater stage every 20 minutes. The groundwater stage data were transmitted via radio telemetry directly to the SFWMD tower, and SFWMD staff performed standard QA/QC procedures on the data. MAERC staff calibrated the wells quarterly.
Groundwater elevation varied seasonally and was affected significantly by the water retention structures. The relatively higher groundwater levels in 2005 than in 2006 reflect the overall wetter conditions in 2005 (Figure 12). Throughout most of 2005 the ground water levels remained higher in pastures with water retention structures than in pastures without structures. This pattern remained through June of 2006, when groundwater elevation reached its lowest level due to the drought. In July, back flow events into the pasture occurred when water levels in the Harney Pond canal were increased. During this period groundwater levels were actually higher in pastures without water control structures, because the water control structures reduced back flow into pastures with structures. The period of heavy rain in late summer of 2006 caused groundwater elevation to remain close to the soil surface across all pastures, with little difference between pastures with or without structure. As the pastures started to dry down in late September early October, groundwater elevation remained higher in pastures with water control structures. The groundwater elevation data show that water control structures held water back in the pastures during wet periods and prevented back flow from entering the pastures. The nutrient load and runoff calculations take both of these effects into account. Groundwater levels were low in late 2007 and early 2008 due to extreme drought conditions. The first year of the project (2005) was a high rainfall year (56.7 inches) in which groundwater levels reached the surface multiple times during the year. By contrast, rainfall amounts were lower in 2006 (46.98 inches) and even lower in 2007 (33.44 inches). Groundwater levels were low during much of this period due to drought but came near the surface due to rains in late March 2008, and then again in late

Final Report, SFWMD Contract No. RS040348 | 37 Pasture Water Management for Reduced Phosphorus Loading in the Lake Okeechobee Watershed
Figure 12. Average ground water elevation and daily rainfall totals for 2005-2006 (upper panel) and 2007-2008 (lower panel) in pasture with (SP1-SP4) or without (SP5-SP8) water control structures.
Month (2005-2006)J F M A M J J A S O N D J F M A M J J A S O N D J
Gro
und
wat
er e
leva
tion
(ft a
msl
)
21
22
23
24
25
26
27
28
29
Dai
ly ra
infa
ll (in
ches
)
0
2
4
6
8
10
12With water control structuresWithout water control structuresAverage ground elevation at wellsRain (in)
Month (2007-2008)J F M A M J J A S O N D J F M A M J J A S O N D J
Gro
und
wat
er e
leva
tion
(ft a
msl
)
21
22
23
24
25
26
27
28
29
Dai
ly ra
infa
ll (in
ches
)
0
2
4
6
8
10
12With water control structuresWithout water control structuresAverage ground elevation at wellsRain (in)

Final Report, SFWMD Contract No. RS040348 | 38 Pasture Water Management for Reduced Phosphorus Loading in the Lake Okeechobee Watershed
July onwards, once summer rains started. During the drier periods, including most of 2007, groundwater levels were higher in pastures without water control structures than in pastures with water control structures, mainly because during these drier periods water exchanges were dominated by back flow into the pastures from the Harney Pond Canal. This back flow was unimpeded in pastures without riser board structures (SP5-SP6) but was blocked by the riser boards in pastures with water control structures (SP1-SP4). Once the soils became saturated with summer rains starting in late July and early August of 2008, groundwater levels remained higher in pastures with water control structures through the end of 2008. 6.2 Groundwater Chemistry Groundwater samples were collected quarterly and were analyzed for different forms of dissolved N and P. There were significant differences between different sampling dates for NH4
+, TKN and NO3- but there was no consistent trend of increase or decrease through time for
any of these nitrogen forms (Figure 13). Nitrate was low for all sampling dates except for a spike that occurred in Quarter 1, 2008, possibly because the low groundwater conditions created more aerobic conditions and higher nitrification in lower soil layers. Groundwater TKN concentrations tended to be greater in pastures with no riser structures, but that pattern was not consistent throughout the study period. Although the average values for both TP and SRP in ground water appeared higher in the pastures with riser structures throughout the study period, these differences were not significant due to high variability (Figure 14, Table 13). As discussed in previous reports, groundwater wells in SP3 and SP4 have had consistently higher P levels than all other pastures as far back as 2001-2002, several years before the water retention treatment was applied; thus this pattern appears to be unrelated to the water retention treatment. The reason for the high groundwater P levels in these pastures is unknown, and historically has not
Table 13. Average nutrient concentrations in groundwater samples collected in 2005-2008 from wells in pastures with or without riser structures. Values are means ± 1 SD (N=13). P values are from a repeated-measures ANOVA performed for the main effects of the water retention treatment (R) and time (T) and their interaction.
P
Analyte No riser (mg L-1)
Riser (mg L-1) Riser Time RxT
NH4+ 0.76 ± 0.26 0.93 ± 0.36 0.39 0.00*** 0.90
NO3- 0.10 ± 0.26 0.05 ± 0.09 0.13 0.00*** 0.00***
NO2 0.02 ± 0.03 0.02 ± 0.03 0.65 0.00*** 0.34 TKN 3.76 ± 0.52 3.23 ± 0.93 0.09* 0.02** 0.00*** SRP 0.18 ± 0.10 0.66 ± 0.17 0.27 0.61 0.97 TP 0.29 ± 0.13 0.85 ± 0.24 0.34 0.14 0.87
*P ≤ 0.05; **P ≤ 0.01; P ≤ 0.001.

Final Report, SFWMD Contract No. RS040348 | 39 Pasture Water Management for Reduced Phosphorus Loading in the Lake Okeechobee Watershed
Figure 13. Nitrogen concentrations in groundwater through time in the experimental pastures, including total N (top panel), nitrate (middle panel), and ammonium (bottom panel). Values are means of four samples on each sample date.

Final Report, SFWMD Contract No. RS040348 | 40 Pasture Water Management for Reduced Phosphorus Loading in the Lake Okeechobee Watershed
been reflected in higher P concentrations in runoff from SP3 and SP4 relative to other pastures. There were no consistent temporal trends in groundwater P concentration (Figure 14). 7 SOIL CHEMISTRY Forage quality and soil phosphorus were measured in the first two years of the project (2004 and 2005) with funding support from the Florida Department of Agriculture and Consumer Services,
Figure 14. Phosphorus concentrations in groundwater through time in the experimental pastures, including total P (top panel), and soluble reactive P (bottom panel). Values represent means of four samples.

Final Report, SFWMD Contract No. RS040348 | 41 Pasture Water Management for Reduced Phosphorus Loading in the Lake Okeechobee Watershed
but these components were not included in the final two years of the project (2007 and 2008); consequently, forage quality data are available only for 2005-2006. Soil phosphorus in the pastures was analyzed monthly from June-October at the same locations where the forage samples were collected as described below. Two different methods were used to assess soil P. The double-acid extraction procedure was performed on samples collected adjacent to the forage sampling locations. Four soil cores, collected with a 2-cm diameter soil probe to a depth of 15 cm, were combined into a single sample from each location, for a total of three soil samples per sampling plot and nine total samples per pasture on each sampling date. Samples were returned to the lab, sieved through 2 mm sieve and extracted with a standard double-acid extraction solution (Mehlich-I). The resulting extracts were analyzed for double-acid-extractable P (DAP) using the ascorbic-acid, molybdate-blue method. Available soil P was also assessed using ion-exchange resin strips in the field. One 2x5-cm anion exchange resin strip was inserted vertically about 5 cm beneath the soil surface adjacent to each forage sampling quadrat. The resin strips were left in the field for 1 week after which they were collected, washed with deionized water, and extracted with a 1.0 M NaCl solution. Extracts were analyzed for P as described above.
In 2005, concentrations of DAP were significantly greater in pastures with water retention structures than in pastures without water retention structures (Figure 15). The differences among treatments were greatest in June, September and October when DAP concentrations were nearly two-fold greater in the pastures with the water retention treatment. Concentrations of ion-exchange resin P (IER-P) were much more variable seasonally than were DAP concentrations, because adequate soil moisture is required for P to diffuse to the membrane surface. The amount of P collected on the membrane surface was much greater in the two wettest months, August and September, and were low in the other three months when soil moisture levels were lower (Figure 16). Pastures with water control structures had significantly higher moisture content than pastures without water control structures in August, September, October, and resin-P levels were nearly two-fold greater in pastures with water retention structure in August. Although soil moisture was relatively high in October when the strips were placed in the field, it is likely that the soils dried out considerably during the incubation period, which may explain why resin-P levels were low for that sampling. Resin-P was greater in pastures without water control structures in October, which is puzzling given the higher DAP levels at the time; but overall resin-P levels were low in October so it is unlikely that this difference in resin-P is at all significant from an environmental standpoint.
Similar differences in soil P between pasture water retention treatments were observed in 2006 as in 2005 (Figure 15). These results indicate that available soil P increases significantly when groundwater levels are increased and soil moisture maintained at higher levels. In contrast to 2005, the higher levels of available soil P in pastures with water control structures in 2006 were not reflected in significantly higher levels of dissolved P in surface runoff. This lack of consistency in the relationship between available soil P and P in runoff may have to do with differences in hydrologic conditions, timing of flooding, retention time, or other unknown factors. Taken together with the modeling results from Ken Campbell, which sometimes shows

Final Report, SFWMD Contract No. RS040348 | 42 Pasture Water Management for Reduced Phosphorus Loading in the Lake Okeechobee Watershed
large underestimates of P loads from the pastures, these results highlight the need for a better understanding of P release and movement from soils into surface runoff. Soil pH fluctuated seasonally but was not significantly affected by the water retention treatment. Typically, soil pH is related inversely, to redox conditions and thus pH would have been expected to be lower in the latter part of the wet season when conditions were wetter. In fact,
Figure 15. Double-acid-extractable P (top panels) and ion-exchange-resin P (bottom panels) in 2005 and 2006 pastures with or without water retention structures. Asterisksindicate significant differences between treatments for each sampling date (*P<0.05, **P<0.01).
Month 2006
June July Aug Sept Oct
Month 2005
June July Aug Sept Oct
Ion-
exch
ange
-res
in P
(μg
P cm
-2)
0
2
4
6
8
10
12
14
No water retentionWater retention
Dou
ble-
acid
-ext
ract
able
P (μ
g g-1
)
0
2
4
6
8
10
12
14
16
*
**
**
**
**
*
*
*
**
*

Final Report, SFWMD Contract No. RS040348 | 43 Pasture Water Management for Reduced Phosphorus Loading in the Lake Okeechobee Watershed
soil pH was lower August-September than it was in June and July in 2006 (Figure 16). In 2005, soil pH averaged 0.25 pH units higher in pastures with water control structures, and this pattern seemed to be related to the wetter conditions in those pastures. It is possible that redox conditions were not as low in 2006 as in 2005 due to the shorter period of high water table conditions (Figure 12). Although we did not directly measure redox potential of the soil, the
Figure 16. Soil moisture and pH in pastures with or without water control structures. Asterisks indicate significant differences between treatments for each sampling date (*P<0.05, **P<0.01).
Month 2006
June July Aug Sept Oct
No water retentionWater retention
Month 2005
June July Aug Sept Oct
Soil
pH
4.0
4.2
4.4
4.6
4.8
5.0
Soi
l Moi
stur
e (%
)
0
10
20
30
40
***
**** *** ***
**
*
*
*
Final Report, SFWMD Contract No. RS040348 | 44 Pasture Water Management for Reduced Phosphorus Loading in the Lake Okeechobee Watershed
higher pH values indicate lower redox conditions due to the inverse relationship between redox and pH within a given soil. 8 FORAGE QUALITY Forage quality samples were collected in the first two years of the project (2005 and 2006) but funds were not available to support the forage quality work in the final two years of the project (2007-2008). 8.1 Forage Samples—2005 Forage samples were collected five times in 2005 from mid-June through early November. The last monthly samples for the year were collected in October 2005. Forage samples were collected using a stratified sampling design that divided the pastures into three equally sized blocks, running north to south, and randomly selecting a sampling plot within each block. The sampling plots ranged from 0.8 to 0.9 ha and consisted of the area between two consecutive lateral east-west ditches, which are distributed regularly at approximately 150 intervals across the pastures. On each sampling date, three forage samples were collected from each plot and combined into a single sample, resulting in three total samples from each pasture. The forage samples were returned to the lab, oven-dried at 60°C, and ground with a Wiley mill through a 1 mm mesh. Samples were shipped to Dairy One forage analysis lab in Ithaca, New York and analyzed for standard forage quality and mineral analysis as well as in vitro digestibility (IVTD), which is an enzymatic measure of digestibility. Forage biomass in pastures peaked in September and measures of forage quality tended to decline from June through early November (Table 14). Relative forage quality and measures of digestibility (IVTD and NDFD, non detergent fiber digestibility) were all highest in June and lowest in September and November. Individual forage nutrients also varied throughout the growing season, but the pattern differed for specific nutrients. Forage P and K declined during the growing season but Ca and Mg increased (Table 14). Adjusted crude protein, which related to forage N content, was highest in June 2005 but did not differ among other sampling dates. Forage quality in pastures SP1 and SP8 differed significantly from forage in pastures SP2-SP7 in 2005, most likely due to difference in previous grazing history from 1998-2004 (Table 15). Pastures SP1 and SP8 were not stocked with cattle from 1998-2004, as they served as ungrazed controls in the previous study, which examined the effects of cattle stocking rate on nutrient runoff and other factors (Swain et al. 2007). Many forage characteristics including average adjusted crude protein, and concentration of P and most forage micronutrients were greater in pastures SP1 and SP8 than in the other pastures (Table 15). Thus, we excluded the data from SP1 and SP8 when analyzing the effect of the pasture water retention treatment on forage quality. The pasture water retention treatment had a significant effect on a limited set of forage characteristics in 2005. Overall measures of forage quality, such as in vitro digestibility and relative forage value did not differ between pastures in the different water management

Final Report, SFWMD Contract No. RS040348 | 45 Pasture Water Management for Reduced Phosphorus Loading in the Lake Okeechobee Watershed
treatments. However, the concentration of several forage micronutrients, including Mg, Na, Zn, Cu and Mn was lower in pastures with water control structures (Table 16). The forage acid detergent fiber content was slightly greater in pastures with water control structures.
Table 14. Bahia grass (Paspalum notatum) forage characteristics on five sampling dates during the 2005 growing season. Each value represents a mean of 24 samples and values within a row followed by different superscript letters are significantly different (Tukey’s HSD test, α=0.05).
Sampling Date Forage characteristic June July Aug. Sept. Nov. 4 Biomass (Mg/ha) 8.35c 12.34b 14.77ab 17.62a 12.02b Moisture (%) 11.31c 11.59bc 11.96b 12.05bc 13.53a Dry Matter (%) 88.70a 88.42ab 88.04b 87.96b 86.48c Adjusted Crude Protein (%) 10.01a 7.53b 6.94b 6.79b 7.54b Acid Detergent Fiber (%) 37.35d 40.44c 44.14b 47.55a 47.84a Neutral Detergent Fiber (%) 71.96d 75.35c 76.25bc 79.07a 77.25b TDN† (%) 57.42a 45.96c 53.04b 51.96b 52.58b IVTD† 48hr (% of DM) 67.25a 50.67c 55.71b 46.08d 45.67d NDFD† 48hr (% of NDF) 54.46a 34.71c 41.79b 31.83cd 29.63d Relative Forage Quality 106.38a 63.96b 71.67b 54.33c 54.21c P (%) 0.19a 0.16b 0.15bc 0.14bc 0.14c Ca (%) 0.30c 0.30c 0.38b 0.45a 0.43a Mg (%) 0.24c 0.29bc 0.33ab 0.37a 0.30b K (%) 1.34a 1.13b 0.97b 0.77c 0.76c Na (%) 0.02 0.02 0.03 0.02 0.04 Fe (ppm) 87.71b 82.46b 75.58b 86.13b 205.21a Zn (ppm) 20.42a 15.50bc 15.50bc 14.25c 19.67ab Cu (ppm) 3.79a 2.83bc 2.79bc 2.75c 3.54ab Mn (ppm) 44.17b 41.83b 55.13ab 65.67a 71.04a Mb (ppm) -0.18 -0.04 0.08 0.22 -0.22 †TDN=total digestible nutrients; IVTD=in vitro total digestibility, 48-hour incubation; NDFD=neutral detergent fiber digestibility, 48-hour incubation.

Final Report, SFWMD Contract No. RS040348 | 46 Pasture Water Management for Reduced Phosphorus Loading in the Lake Okeechobee Watershed
Table 15. Mean forage characteristics for forage samples collected on five different sampling dates in 2005 in pastures SP2-SP7, which had been grazed during previous years and pastures SP1 and SP8, which had not been grazed from 1996-2004.
Grazing History (1998-2004)
Forage Characteristic Grazed Ungrazed P Biomass (Mg/ha) 13.14 12.65 0.72 Moisture (%) 12.04 12.22 0.22 Dry Matter (%) 87.96 87.80 0.26 Adjusted Crude Protein (%) 7.55 8.38 <0.0001*** Acid Detergent Fiber (%) 42.91 45.11 0.05* Neutral Detergent Fiber (%) 76.29 75.01 0.01** TDN (%) 52.45 51.40 0.92 IVTD 48hr (% of DM) 53.68 51.23 0.34 NDFD 48hr (% of NDF) 39.55 35.27 0.09* Relative Forage Quality 71.44 66.10 0.57 P (%) 0.14 0.17 0.002*** Ca (%) 0.36 0.40 0.04** Mg (%) 0.29 0.33 0.07* K (%) 0.96 1.08 0.10 Na (%) 0.02 0.04 0.008*** Fe (ppm) 94.42 146.4 <0.0001*** Zn (ppm) 15.39 22.10 <0.0001*** Cu (ppm) 2.8 4.2 <0.0001***
Mn (ppm) 48.80 75.87 <0.0001***
Mb (ppm) -0.06 0.08 0.15 †TDN=total digestible nutrients; IVTD=in vitro total digestibility, 48-hour incubation; NDFD=neutral detergent fiber digestibility, 48-hour incubation. * = 0.05 < P ≤ 0.10, ** = 0.01 < P ≤ 0.05, *** = P<0.01

Final Report, SFWMD Contract No. RS040348 | 47 Pasture Water Management for Reduced Phosphorus Loading in the Lake Okeechobee Watershed
Table 16. Mean forage characteristics for forage samples collected on five different sampling dates in 2005 in pastures with (SP2-SP4) or without (SP5-SP8) water control structures. Pastures SP1 and SP8 were excluded from this analysis because their previous grazing history (1998-2004) influenced their forage quality measures.
Water Management Treatment
Forage Characteristic
Water control structure
No water control
structure P Biomass (Mg/ha) 12.96 13.33 0.61 Moisture (%) 12.12 12.03 0.41 Dry Matter (%) 87.88 89.97 0.39 Adjusted Crude Protein (%) 7.59 7.56 0.88 Acid Detergent Fiber (%) 43.63 42.95 0.09* Neutral Detergent Fiber (%) 76.37 76.28 0.81 TDN (%) 52.40 52.20 0.61 IVTD 48hr (% of DM) 53.69 53.69 0.28 NDFD 48hr (% of NDF) 39.58 38.15 0.24 Relative Forage Quality 70.56 68.87 0.73 P (%) 0.15 0.15 0.83 Ca (%) 0.37 0.36 0.69 Mg (%) 0.29 0.31 0.02** K (%) 1.00 0.95 0.21 Na (%) 0.03 0.02 0.05** Fe (ppm) 95.07 104.88 0.38 Zn (ppm) 14.51 17.02 0.0001*** Cu (ppm) 2.67 3.23 0.0004***
Mn (ppm) 44.07 61.90 0.0004***
Mb (ppm) 0.01 -0.06 0.37 †TDN=total digestible nutrients; IVTD=in vitro total digestibility, 48-hour incubation; NDFD=neutral detergent fiber digestibility, 48-hour incubation. * = 0.05 < P ≤ 0.10, ** = 0.01 < P ≤ 0.05, *** = P<0.01

Final Report, SFWMD Contract No. RS040348 | 48 Pasture Water Management for Reduced Phosphorus Loading in the Lake Okeechobee Watershed
8.2 Forage Samples—2006 Forage samples were collected monthly during June-October in 2006, using a stratified random sampling procedure as in 2005 and were processed as described above. Forage biomass in 2006 increased from June to a peak in September followed by a slight decrease in October. Measures of forage quality, such as adjusted crude protein, total digestible nutrients (TDN) and in-vitro digestibility, tended to decline from June through October, which is typical for south Florida pastures (Table 17). Individual forage nutrients also varied throughout the growing season, but the pattern differed for specific nutrients. Forage P and Ca and the micronutrients Ca, Zn, Cu, and Mn declined during the growing season; whereas K tended to increase. Relative forage quality was slightly higher in the pastures with water retention structures than in pastures without water retention structures (Table 18, P=0.07). Other measures of forage quality, such as TDN and in-vitro digestibility provided further evidence that forage quality was higher in pastures with water control structure than in pastures without structures. These differences in forage quality should be interpreted cautiously because of the different average stocking densities maintained on pastures in the different water retention treatments, but there is no indication that the water retention treatment caused a decline in forage quality. 9 CATTLE DATA The cattle production data for the experimental pastures do not indicate that there were any significant differences in, conception rates, calf production or cow body conditions during the three production cycles examined (2006-2008, Table 19). Average herd size, including the number of cows with calves were similar among the two blocks of pastures, although differences in days stocked contributed to differences in the average stocking density in the pastures (Table 4). Cow body condition score, based on a 1-9 scale was the same for the two blocks of pastures, except in 2006, when the average score was 0.5 points lower for cows stocked in the pastures with water retention; this small difference is unlikely to reflect significant differences in cow condition. Conception rate ranged from 81-87% and was similar the two different herds, although in 2006 the conception rate for cows maintained on the pastures with the water retention treatment was lower than for cows maintained on pastures with uninterrupted flow (Table 19). Calf weights generally were similar among herds but varied among years and water retention treatments. Some of this difference could have been due to age differences among calves at weighing; exact calf ages at weighing are not known. The annual daily gains of calves between the two weighing periods in each year were similar for the two herds. In summary, the cattle data do not indicate that the water retention treatment had any consistent significant effects on cow or calf performance. However, the lower conception rates, slightly lower average cow condition and lower calf weights and weight gains in the 2006 in pastures with water retention structures indicate that the cattle may have been affected in that year. The 2006 herd would have been conceived and calved in 2005 which was an extremely wet year and it is possible that the extra wet conditions due to the water retention had a negative effect on the cows that year. However, the lack of an effect of water retention on cattle performance in the

Final Report, SFWMD Contract No. RS040348 | 49 Pasture Water Management for Reduced Phosphorus Loading in the Lake Okeechobee Watershed
Table 17. Bahia grass (Paspalum notatum) forage characteristics on five sampling dates during the 2006 growing season. Each value represents a mean of 24 samples and values within a row followed by different superscript letters are significantly different (Tukey’s HSD test, α=0.05).
Sampling Date Forage characteristic June July Aug. Sept. Oct.
Biomass (Mg/ha) 1.88d 4.03c 6.00b 9.21a 7.95a
Moisture (%) 8.93c 9.51b 11.61a 9.87b 11.32a
Adjusted Crude Protein (%) 11.24a 10.81a 9.24b 8.36b 8.00b
Acid Detergent Fiber (%) 39.83b 40.48b 42.70a 40.00b 41.40ab
Neutral Detergent Fiber (%) 69.62b 71.48b 72.36b 75.39a 76.48a
TDN† (%) 58.96a 58.13a 57.33a 54.21b 52.83b
IVTD† 48hr (% of DM) 67.50 66.54 65.25 59.58 54.75
NDFD† 48hr (% of NDF) 53.08 53.08 52.00 46.54 40.92
Relative Forage Quality 107.42 103.96 96.04 86.46 75.83
P (%) 0.20b 0.24a 0.22ab 0.16c 0.14c
Ca (%) 0.50a 0.44ab 0.43ab 0.33b 0.40ab
Mg (%) 0.31bc 0.37ab 0.37a 0.24d 0.27cd
K (%) 0.84b 0.96b 0.91b 1.39a 1.32a
Na (%) 0.04 0.07 0.05 0.03 0.04
Fe (ppm) 164.75 155.75 121.88 227.50 191.29
Zn (ppm) 23.13a 24.04a 20.17a 13.63b 12.04b
Cu (ppm) 7.79a 6.71a 4.46b 3.04c 2.63c
Mn (ppm) 64.33a 53.79ab 45.29bc 37.83c 39.33bc
Mb (ppm) -0.71c -0.59bc 0.10a -0.18ab 0.01a †TDN=total digestible nutrients; IVTD=in vitro total digestibility, 48-hour incubation; NDFD=neutral detergent fiber digestibility, 48-hour incubation.

Final Report, SFWMD Contract No. RS040348 | 50 Pasture Water Management for Reduced Phosphorus Loading in the Lake Okeechobee Watershed
Table 18. Mean forage characteristics for forage samples collected on five different sampling dates in 2006 in pastures with (SP1-SP4) or without (SP5-SP6) water control structures.
Water Management Treatment
Forage Characteristic
No water control
structure
With water control
structure P Biomass (Mg/ha) 6.01 5.62 0.34 Moisture (%) 10.44 10.06 0.000*** Adjusted Crude Protein (%) 9.74 9.32 0.15 Acid Detergent Fiber (%) 40.86 40.90 0.04* Neutral Detergent Fiber (%) 73.74 72.39 0.04* TDN (%) 55.72 56.87 0.02* IVTD 48hr (% of DM) 61.33 64.12 0.001** NDFD 48hr (% of NDF) 47.70 50.55 0.005** Relative Forage Quality 92.02 95.87 0.07 P (%) 0.19 0.20 0.03* Ca (%) 0.44 0.40 0.19 Mg (%) 0.31 0.31 0.99 K (%) 1.08 1.09 0.86 Na (%) 0.06 0.03 0.21 Fe (ppm) 158.30 186.17 0.25 Zn (ppm) 18.53 18.67 0.90 Cu (ppm) 4.80 5.05 0.33 Mn (ppm) 50.52 45.72 0.16 Mb (ppm) -0.28 -0.27 0.90 †TDN=total digestible nutrients; IVTD=in vitro total digestibility, 48-hour incubation; NDFD=neutral detergent fiber digestibility, 48-hour incubation. * = 0.05 < P ≤ 0.10, ** = 0.01 < P ≤ 0.05, *** = P<0.01

Final Report, SFWMD Contract No. RS040348 | 51 Pasture Water Management for Reduced Phosphorus Loading in the Lake Okeechobee Watershed
2007 and 2008 herds, which were raised during drier conditions, do now allow definitive conclusion to be made about the potential effects of water retention on cattle production. Florida climate and rainfall conditions are variable from year to year, so any negative effects of water retention, if any, would be most likely to occur in wetter than normal years.
Table 19. Cattle herd data for herds maintained in the experimental pastures in 2005-2008. No calf data is presented for 2005 because cows stocked that year were dry cows that were not in an annual production cycle. Cattle were maintained on the pastures in full annual production cycles starting in fall 2005 (2006 herds), fall 2006 (2007 herds), and fall 2007 (2008 herds).
Pastures Cattle variables 2005 2006 2007 2008 Average herd size 180 124 128 188 Total days 292 962 924 1111 Cows w/calf NA 150 138 118 Body cond. score NA 4 5 5 Cow weight NA 1030 963 890 Deaths during year NA 0 1 0 Bulls 8/180 days 8 4 4 Conception rate NA 80% 86% 81% Average age NA 7 7 8 Calf weight 1st work NA 250 193 239 Calf weight 2nd work NA 346 460 436
SP1-SP4 Water Retention Treatment
Wt gain/day NA 1.8 1.7 2.2 SP5-SP8 Average herd size 184 160 136 180
Total days 247 547 1132 761 Cows w/calf 0 141 139 113 Body cond. score NA 4.5 5 5 Cow weight NA 963 954 890 Deaths during year NA 0 3 0 Bulls 8/180 days 8 4 4 Conception rate NA 87% 86% 81% Average age NA 8 8 8 Calf weight 1st work NA 293 207 215 Calf weight 2nd work NA 410 433 387
Uninterrupted flow
Wt gain/day NA 2.1 1.4 2.2

Final Report, SFWMD Contract No. RS040348 | 52 Pasture Water Management for Reduced Phosphorus Loading in the Lake Okeechobee Watershed
10 SUMMARY AND RECOMMENDATIONS The results of this four-year project demonstrate the potential for pasture water retention to significantly reduce runoff volume and nutrient loads from cattle pastures in the Okeechobee Basin. However, the potential to reduce phosphorus loads appear to be offset to some degree by the risk of increased P release from soils and higher P concentration in runoff associated with the wetter conditions created by water retention. The significant reduction of P loads in 2006, which was a year of normal rainfall, clearly show that pasture water retention can significantly reduce P loads under certain conditions. If the first year of the project (2005) and the extreme drought year are discounted as being anomalous, the average reduction in P loads due to water retention in the remaining two years (2006 and 2008) was 27%, which is close to the 17% reduction predicted by modeling (Watershed Assessment Model, WAM) the effect of detaining 0.25 inches of runoff on 1,713-ha (4,230-acre) area of improved pastures at Buck Island Ranch (Zhang et al. 2006). The patterns of nutrient load reduction were even greater for N than for P. Pasture water retention reduced annual average TKN by 44% and in 2008 reduced TKN loads by 59%. Such large reductions were due to the combined effects of lower runoff and lower TKN concentrations in runoff in pastures with reduced flow compared to pastures with uninterrupted flow. Significant reduction in loads of inorganic N show that pasture water management has a great potential for providing effective and consistent reductions in N loads. Although the main focus in the Lake Okeechobee watershed has been on reducing P loads, due to the deleterious effects of P on freshwater systems in the region, N loads are also a concern, especially due to their effects on estuarine ecosystems downstream of Lake Okeechobee (Alleman et al. 2009). One of the surprising results from this project was the opposite effect of pasture water retention on concentrations of TP and TKN. Averaged over all four years, the flow-weighted P concentration of forward flow from pastures with reduced flow was significantly greater than in pastures with uninterrupted flow; whereas average flow-weighted concentration of TKN in forward flow was significantly lower in pastures with reduced flow. This opposite response of TP and TKN concentration indicated that there were fundamental differences in the biogeochemical responses of these two nutrients to water retention. Results from the soil analysis indicate that P was released from soil in pastures with reduced flow due to the higher water table conditions and higher soil moisture content. Flooded conditions can contribute to P release from soils due to the inverse relationship between P release and soil redox conditions (Moore et al. 1998, Fisher and Reddy, 2001). Iron-related P release is considered to be a consequence of the reduction of Fe+3 to the more soluble Fe+2, which has been shown to increase SRP concentrations (Patrick and Khalid 1974, Reddy et al. 1999,). Although we did not measure Fe content or redox in the pastures the higher soil moisture and groundwater elevations in pastures with water control structures would be expected to cause lower redox conditions in the soil. Other data from wetlands and improved pastures at Buck Island Ranch showed that Fe/Al-P accounted for about 12% of total P in the upper 8 cm of mineral soil, and that Al concentrations (355.8 mg/kg) were much greater than Fe concentrations (13.2 mg/kg) (Hill, 2003). By contrast, organic P in these pasture and wetland soils accounted for 61% of total

Final Report, SFWMD Contract No. RS040348 | 53 Pasture Water Management for Reduced Phosphorus Loading in the Lake Okeechobee Watershed
P, indicating that mineralization or release of organically-bound P may have been the most likely source of inorganic P released during flooding. Hydrolytic cleavage of particulate organic matter is believed to be an important process for P release from peaty soils (Turner et al. 2003). Another source of P release may have been the dead material and detritus of Bahia grass and other pasture and wetland plants in the pastures. Tweel and Bohlen (2007) showed that the presence of plants and plant detritus in soil cores collected from wetland in improved pastures on Buck Island Ranch had large increases in P release compared to cores with bare soil. In addition to redox conditions, biotic factors, such as changes in microbial activity, and release from cell lysis, can affect P release during inundation and may have been important in our study (Wright et al., 2001). The risk of P release from increased water retention on improved pastures suggests that measures must be taken to insure that any potential release does not offset reduction in P loads associated with reduced runoff. Pastures in the Okeechobee Basin contains significant quantities of “legacy” P that has accumulated primarily due to historic fertilizer inputs (SWET 2008a), suggesting that the risk of P release would apply to many pastures, particularly those on poorly drained flatwoods soils. Reductions in P loads will have the best chance of succeeding in situations where significant reductions in runoff volume can be achieved. In addition to maximizing reduction in runoff volumes, additional management options that could decrease P loads include capturing the “first flush” of nutrients at the start of the wet season when concentrations tend to be highest, and increasing water retention times within the pasture to maximize the P removal from the water column via biological uptake or P sorption by sediments. The risk of increased nutrient release due to flooded conditions does not appear to apply to N because the flow-weighted concentrations of TKN were lower, not higher, in pastures with water retention structures, and inorganic N concentrations were not affected by water retention. In contrast to P for which soluble reactive P accounted for 76.7% of total P, total inorganic N only accounted for only 5.6% of TKN. Thus N loads were dominated by dissolved organic N (DON). It is possible that greater flow volumes in pastures with uninterrupted flow caused a greater flush of dissolved organic and particulate N, whereas the greater water retention times in the pastures with reduced flow allow time for these forms of N to be taken up by biological process, settling or adsorption to surfaces. There was no indication that the pasture water retention treatment caused significant declines in forage quality in the two wet years during which forage measurements were taken (2005-2006). Bahia grass does not tolerate prolonged flooding but the pasture water levels were managed to prevent excessive surface flooding, and although ponding of water occurred in low areas for brief periods of time the pastures were not permitted to flood. Given the inter-annual variability in rainfall and the variability in distribution of rainfall within years, pasture water retention is not likely to create prolonged flooded conditions, provided the drainage waters are managed at an appropriate elevation to maintain the pastures in good condition. In 2006 measures of average forage quality, such as total digestible nutrients (TDN), in vitro total digestibility (IVTD) and neutral detergent fiber digestibility were actually greater in pastures with water control structures, which may have been affected by cattle stocking density which was significantly greater in pastures with reduced flow than in pastures with uninterrupted flow in 2006. Other

Final Report, SFWMD Contract No. RS040348 | 54 Pasture Water Management for Reduced Phosphorus Loading in the Lake Okeechobee Watershed
than those minor differences there was no indication that pasture water retention decreased grass production or forage quality. Cattle production data did not indicate any consistent negative impact of water retention on cattle production in the three annual production cycles examined. There were no obvious consistent differences in cow body condition scores, conception rates, calf weights and weight gain rate between pastures with reduced flow or uninterrupted flow. In 2006 conception rates were 7% lower in herds on reduced flow pastures, and calf weights and daily calf weight gains were also lower than in pastures with uninterrupted flow, but these differences were not observed in other years, and it cannot be determined whether the differences were statistically significant. The 2007 and 2008 herds were exposed to relatively dry conditions when pasture water retention would not be expected to have any significant effects on production. Consequently, there is insufficient evidence from this study to make any conclusive statements about whether pasture water retention would have negative effects on production during wet years. Given the limited nature of results on forage quality and cattle production, ranchers are likely to be concerned about potential negative effects of water retention on production and economic returns; therefore any decision to encourage this practice should consider the potential negative effects on cattle and cattle production.
Final Report, SFWMD Contract No. RS040348 | 55 Pasture Water Management for Reduced Phosphorus Loading in the Lake Okeechobee Watershed
11 REFERENCES Alleman, R., M-L Change, and P Doering (eds). 2009. Management and restoration of coastal
ecosystems. Chapter 12 in 2009 South Florida Environment Report, South Florida Water Management District, West Palm Beach, FL. 166 pp.
Bohlen, P. J and S. M. Gathumbi. 2007. Nitrogen cycling in seasonal wetlands in subtropical
cattle pastures. Soil Science Society of America Journal 71: 1058-1065. Capece, J. C., K. L. Campbell, P. J. Bohlen, D. A. Graetz and K. M. Portier. 2007. Soil
phosphorus, cattle stocking rates, and water quality in subtropical pastures in Florida. Rangeland Ecology and Management 60: 19-30.
FDACS. 2008. Water quality best management practices for Florida cow-calf operation: 2008
edition. Publication # P-01280, Florida Department of Agriculture and Consumer Services, Office of Agricultural Water Policy, Tallahassee, FL. 94 pp. (http://www.floridaagwaterpolicy.com/PDF/Bmps/Bmp_FloridaCowCalf2008.pdf)
Fisher, M.M. and K.R. Reddy, 2001. Phosphorus flux from wetland soils affected by long-term
nutrient loading. Journal of Environmental Quality 30: 261-271. Hiscock, J.G., C.S. Thourot, and J. Zhang. 2003. Phosphorus budget analysis relating to land use
for the northern Lake Okeechobee watershed, Florida. Environmental Engineering 21:63-74. Moore Jr., P.A., K.R. Reddy and M.M. Fisher, 1998. Phosphorus flux between sediment and
overlying water in Lake Okeechobee, Florida: spatial and temporal variations. Journal of Environmental Quality 27: 1428-1429.
Reddy, K.R., J.R. White, A.L. Wright and T. Chua, 1999. Influence of phosphorus loading on
microbial processes in the soil and water column of wetlands. In: K.R. Reddy, G.A.O’Connor, and C.L. Schelske (Eds), Phosphorus Biogeochemistry of Subtropical Ecosystems, CRC Press, Boca Raton, FL, pp. 249-274.
Swain, H. M. 1998. Archbold Biological Station and the MacArthur Agro-ecology Research
Center. Bulletin of the Ecological Society of America 79:114-120. Swain, H. M., P. J. Bohlen, K. L. Campbell, L. O. Lollis and A. D. Steinman. 2007. Integrated
ecological and economic analysis of ranch management systems; an example from south central Florida. Rangeland Ecology and Management 60: 1-11.
SWET (Soil and Water Engineering & Technology, Inc.) 2008a. Technical assistance in review
and analysis of existing data for evaluation of legacy phosphorus in the Lake Okeechobee watershed: Task 2 – Evaluation of existing information. Final report to the South Florida Water Management District, West Palm Beach, FL. 54 pp.
Final Report, SFWMD Contract No. RS040348 | 56 Pasture Water Management for Reduced Phosphorus Loading in the Lake Okeechobee Watershed
SWET (Soil and Water Engineering & Technology, Inc.) 2008b. Technical assistance in review and analysis of existing data for evaluation of legacy phosphorus in the Lake Okeechobee watershed: Task 3 – Legacy phosphorus abatement plan. Final report to the South Florida Water Management District, West Palm Beach, FL. 30 pp.
Turner, B.L., J.A. Chudek, B.A. Whitton and R. Baxter. 2003. Phosphorus composition of
upland soils polluted by long-term atmospheric nitrogen deposition. Biogeochemistry 65:259-274.
Werner, P. A., G. W. Tanner, J. J. Mullahey, and S. P. Chrisman. 1998. Biological Monitoring
for the Buck Island Agro-ecology Study: pre-experimental treatment phase. Final Report (revised) for Contract No. C-6649, South Florida Water Management District. West Palm Beach, FL.
Zielinski, R. A., W. R. Orem, K. P. Simmons and P. J. Bohlen. 2006. Fertilizer-derived uranium
and sulfur in rangeland soil and runoff; a case study in central Florida. Water, Air, & Soil Pollution 176: 163-183.
Zhang, J., J. G. Hiscock, A. B Bottcher, B. M Jacobson, and P. J. Bohlen. 2006. Modeling
phosphorus load reductions of agricultural water management practices on a beef cattle ranch. ASABE Paper No. 062010, American Society of Agricultural and Biological Engineers, St. Joseph, MI.
Zhang, J, R. T. James and P. McCormick et al. 2009. Lake Okeechobee Protection Program—
state of the Lake and watershed. Chapter 10 in 2009 South Florida Environment Report, South Florida Water Management District, West Palm Beach, FL.