Embed Size (px)
Citation preview

PASSWORD BEHAVIOUR A Study in Cultrual and Gender Differences
Bachelor Degree Project in Information
Technology IT604G
Basic level – 22.5HP Spring term 2017
Rasmus Gärdekrans – a14rasga Supervisor: Joakim Kävrestad
Examiner: Thomas Fischer

Abstract - English
The most common authentication method used today is the combination of a
username and a password. The trend seems to be that users get more and more
passwords with the increase of internet services that are available. One major
problem in computer security is that users sometimes tend to have bad password
habits. For instance, they might create short and simple passwords or reuse
passwords for multiple accounts.
This final year project aims to investigate what the differences are in password
behaviour when it comes to gender and culture. The goal is to investigate user habits
when it comes to password reuse, native language usage in password creation,
attitudes towards password policies, the use of meaningful words, and the length and
complexity of passwords. To gather data, a quantitative survey was created and
distributed to three universities in Sweden, Norway and India. Through statistical
analysis this study accurately presents what the password behaviour looks like
amongst the participants. The results indicate that there are some differences. For
instance, male students in Norway had longer passwords than the rest of the
participants and students in Sweden reported that changing password did not make
them feel more secure online. Differences could also be observed in the use of native
language in passwords. In Norway, it was more common to use native language in
passwords compared to the other countries.
There were some results that showed no difference; one of those were in the case of
password reuse. Furthermore, no difference could be observed when it came to the
use of passphrases amongst the participants or the level of annoyance the
participants felt when forced to change passwords. Other studies within similar areas
have shown that differences exist between culture and gender when it comes to
password behaviour, general computer security knowledge and the use of mobile
lock-screens.
Comparing the result of this study to previous studies which are similar to this one,
further indicate that differences exists between culture and gender in regard to
password behaviour. Sawaya et al (2017) note that culture can have a huge impact on
user behaviour when it comes to computer security and that this is something that
needs to be taken into consideration and be studied further.
Future work could be to further investigate why these differences exists or look at
other factors such as age to see how big of a role they play in user password
behaviour. It would also be possible to extend the research to other areas within
computer security such as general knowledge about different types of attacks or
attitudes towards privacy online.

Abstract – Svenska
Den vanligaste autentiserings metoden som används idag är en kombination av
användarnamn och lösenord. Trenden tyder på att användare får fler och fler
lösenord genom att antalet tillgängliga tjänster online ökar. Ett stort problem inom
IT-säkerhet är att användare ibland har dåliga lösenordsvanor. Till exempel, skapar
de ibland korta och simpla lösenord eller återanvänder lösenord till många konton.
Det här examensarbetet har som avsikt att undersöka vilka skillnader som finns i
lösenordsbeteende mellan kön och kultur. Målet är att undersöka användares vanor
när det kommer till återanvändning av lösenord, modersmål i lösenord, attityder till
lösenords policy, användning av meningsfulla ord och fraser samt längd och
komplexitet av lösenord. För datainsamling skapades en kvantitativ enkät och
delades ut till tre universitet i Sverige, Norge och Indien. Studien reflekterar hur
lösenordsvanor ser ut hos deltagarna.
Resultatet visar på att det finns vissa skillnader. Till exempel så hade de manliga
studenterna i Norge längre lösenord än resten av deltagarna och studenterna i
Sverige rapporterade att byta lösenord inte fick dom att känna sig tryggare online i
samma utsträckning som de andra deltagarna.
Det fanns även vissa resultat som inte visade några skillnader som till exempel
återanvändning av lösenord. Det gick inte heller att observera några skillnader i
användning av lösenordsfraser eller hur irriterande användarna upplevde att det är
att tvingas byta lösenord. Ytterligare skillnader som observerades var att deltagarna
från Norge använde modersmål i större utsträckning än de andra deltagarna i
studien. Tidigare studier inom liknande områden har visat att det finns skillnader
mellan både kultur och kön när det kommer till lösenordsbeteenden, generell
kunskap inom IT-säkerhet och användningen av låsskärmar på mobiltelefoner.
Genom att jämföra resultaten från den här studien med andra liknande studier kan
man se att det finns skillnader mellan kön och kultur när det kommer till
lösenordsvanor. Sawaya, et al. (2017) noterade i sin studie att kultur har en stor
påverkar när det kommer till användares vanor inom IT-säkerhet och att det är något
som måste bejakas och ytterligare studeras.
Framtida arbete skulle kunna innebära att man undersöker varför dessa skillnader
finns eller att man tittar på andra faktorer som till exempel ålder för att se hur stor
roll det spelar in i lösenordsbeteenden. Man kan även undersöka andra områden som
till exempel generell kunskap inom IT-säkerhet eller attityder kring privatliv online.

Summary – Svenska
Den här studien ämnar att undersöka vilka skillnader som finns hos användare från
olika kulturer och olika kön när det kommer till lösenordsvanor. Begreppet
lösenordsvanor innefattar bland annat vilka strategier användare använder sig av när
det skapar lösenord och hur dom hanterar sina lösenord efter att de har skapat dem.
Exempel på vanliga vanor som användare har är till exempel att de ofta delar med sig
av lösenord, skriver ner lösenord eller att de skapar korta lösenord, vilket resulterar i
lösenord som är lätta att gissa, med motivationen att de är enklare att komma ihåg.
Motivationen bakom studien är att lösenord i dagsläget är den vanligaste
förekommande metoden som används för olika system och applikationer där
användare behöver logga in. Trenden tyder även på att användandet av lösenord som
inloggningsmetod kommer öka inom den närmaste åren då mängden av tjänster som
numera finns att tillgå via internet som till exempel Facebook och Twitter ökar.
Genom att känna till användares vanor och attityder kring lösenordsvanor kan man
enklare sätta upp och förbättra säkerhetsåtgärder. Om till exempel personer i Norge
är med belägna att använda modersmål i sina lösenord eller att män oftare använder
familjemedlemmars namn i sina lösenord, är det information som är viktigt för en
systemadministratör, vars jobb det är att se till att systemen säkra. Den här typen av
information skulle kunna leda till förbättrade lösenords policys som i sin tur leder till
säkrare lösenord eller mer uppmärksamhet mot vissa grupper som kan ses som mer
utsatta mot till exempel identitetsstöld genom att deras lösenordsvanor är dåliga.
Tidigare studier inom det här området visar på att det finns skillnader mellan kön
och kulturer när det kommer till IT-säkerhet. I en studie som genomfördes av Petrie
och Merdenyan (2016) observerade de att kvinnor från England till exempel hade
längre lösenord än de andra deltagarna i studien. De observerade även att män oftare
glömmer bort sina lösenord men att kvinnor i större utsträckning delar med sig av
sina lösenord. En annan studie inom ett närliggande område undersökte användares
vanor kring låsskärmar på mobiltelefoner och upptäckte att kulturella aspekter
spelade roll (Harbach, et al. 2016). Till exempel såg de att användare från Amerika
använde låsskärmar i mindre utsträckning än deltagare från de andra länderna. De
observerade även att deltagarna från Japan tenderade att värdera den data som
lagras på deras egna mobiltelefon högre än vad de andra deltagarna värderade sin
egen data (Harbach, et al. 2016).
Genom att en enkätundersökning skickades ut via mail har studenter från tre olika
universitet deltagit i det här examensarbetet. Två av universiteten ligger i Europa, ett
ligger i Sverige och den andra i Norge. Det tredje universitet ligger i Indien. Genom
att studera dessa universitet kan man se skillnader och likheter mellan länder som
ligger både geografiskt nära och långt bort. Sammanlagt analyserades resultatet av
189 stycken deltagare.

Några av de resultaten som analyserats visar på att det finns skillnader och likheter
mellan studenterna från de olika länderna men även mellan könen. Några av de
skillnader som kunde observeras var till exempel att männen i studien hade längre
längsta lösenord än de kvinnliga deltagarna. Det gick även att påvisa att det fanns
skillnader i vilken utsträckning deltagarna använde sig av modersmål i sina lösenord,
där det visade sig vara vanligare i Norge än de andra länderna. I studien framkom det
också att kvinnor i större utsträckning delar med sig av sina lösenord än män och att
familjemedlemmar är vanligast att dela med sig av lösenord till. Resultaten visar även
att deltagarna i Sverige uppfattar byte av lösenord som något som bidrar till att de
känner sig säkrare online jämfört med övriga deltagare i studien.
De områden där det inte gick att observera några skillnader var till exempel i
återanvändning av lösenord, alltså att man använder samma lösenord igen för flera
konton. Det gick heller inte att observera några skillnader i hur irriterande användare
upplever det är att tvingas byta lösenord. Vidare fanns det ingen skillnad att
observera beträffande användandet av lösenordsfraser. Lösenordsfraser är längre
lösenord med grammatisk struktur för att det skall vara lättare att komma ihåg men
även säkrare för att det innehåller fler tecken.
Genom att jämföra resultatet av den här studien med andra studier kan man dra
slutsatsen att det finns skillnader mellan både kulturer och kön när det kommer till
lösenordsvanor. Det här är ett relativt nytt och outforskat område, det finns även
studier som menar på att det här är något som forskare behöver lägga mer fokus på
för att kunna förbättra säkerheten för användare (Sawaya et al. 2017).

Summary – English
This study aims to investigate what differences exist in regard to password behaviour
between both culture and gender. The term password behaviour includes, among
other things, various strategies that users implement when they create passwords and
how they manage passwords after they have been created. Examples of common
behaviour amongst users are for instance that they tend to share their passwords,
write down their passwords, or create short passwords, which makes the passwords
easier to guess, but also easier to remember.
The motivation behind this study is that the use of password is the most common
method implemented for various systems and applications when it comes to user log
ins. The trend suggests that the usage of passwords will increase within the next years
due to continued increase in the amount of services such as Facebook and Twitter
that are available online.
Knowing user habits and attitudes towards password behaviour makes it easier to
setup and improve security measures. For example, if people in Norway were shown
to be more likely to use native language in their passwords or if men used family
members names in password to a larger extend than women, this information would
be useful for a system administrator whose job it is to keep systems safe. This type of
information could lead to improved password policies and thus more secure
passwords. It could also help to identify groups that are more prone to being exposed
to various threats such as identity theft due to bad password habits.
Previous studies suggest that there are differences between both gender and culture
within computer security. Petrie and Merdenyan (2016) observed that women in
England had longer passwords compared to the other participants in their study.
They also observed that men were more prone to forgetting passwords and that
women share their passwords to a larger extent than their male counterparts.
Another study aimed at investigating differences in mobile phone lock-screen usage
observed differences between participants from different countries (Harbach, et al.
2016). For example, they observed that the users in America were less likely to use
lock-screens compared to the other participants in the study. They also concluded
that the Japanse users values their data stored on their smartphones as sensitive to a
greater extent than the other participants valued their own data (Harbach, et al.
2016).
An online questionnaire was distributed through email to students in three different
countries. Two of the participating universities are located in Europe, one in Sweden
and one in Norway. The third university is located in India. By studying the
participants from these universities it was possible to observe differences and
similarities both in universities that are both closer to each other geographically and

by culture as well as a university that is far away. In total the results of 189
participants was analyzed.
The results show that there are some differences and some similarities between
participants. Some of the differences observed show that men had on average longer
passwords than the female participants. Another difference concluded in the result
was that the participants in Norway used native language in their passwords to larger
extend than the other participants in the study. Furthermore, the results also showed
that women are more likely than men to share passwords and that family members
were the most common persons to share passwords with. Additional findings showed
a difference in attitude when changing password and that the Swedish participants
reported feeling more secure after having changed password compared to the other
participants.
There were some areas where no difference could be observed. For example, no
differences could be seen in regard to password re-use, which is when a password is
re-used for several accounts. Furthermore, no difference could be seen in the
annoyance the participants reported feeling after having been forced to change
password. Another case where no differences could be observed pertained to the use
of passphrases. Passphrase are longer passwords with a grammatical structure which
makes them easier to remember but aslo harder to crack.
Comparing the results of this study to other similar studies makes it clear that both
gender and culture have an impact on password behaviour. This is a relatively new
research area but there are studies that note that cultural and gender aspects need to
be taken into consideration when conducting research within computer security in
order to be able to improve security for users (Sawaya, et al. 2017).

Index
1 Introduction ....................................................................................................................... 1
2 Background....................................................................................................................... 2
2.1 Passwords.................................................................................................................. 2
2.2 Passphrase ................................................................................................................ 2
2.3 Mnemonic-based passwords .................................................................................. 2
2.4 Reuse of passwords ................................................................................................. 3
2.5 Password policies ..................................................................................................... 4
2.6 Keyloggers ................................................................................................................. 4
2.7 Related work .............................................................................................................. 5
3 Problem formulation ........................................................................................................ 7
3.1 Motivation ................................................................................................................... 7
3.2 Objectives .................................................................................................................. 9
3.3 Expected results........................................................................................................ 9
3.4 Demarcation ............................................................................................................ 10
4 Methodology ................................................................................................................... 11
4.1 Methodology Overview .......................................................................................... 11
4.2 Survey methodology............................................................................................... 11
4.2.1 Standardization ................................................................................... 11
4.2.2 Open-ended / closed-ended questions ........................................... 12
4.2.3 Wording of questions ......................................................................... 13
4.2.4 Likert Scale .......................................................................................... 13
4.3 Sample size ............................................................................................................. 14
4.4 Instrumentation........................................................................................................ 15
4.5 Ethics ........................................................................................................................ 15
4.6 Validity Threats........................................................................................................ 16
4.7 Methodology preview ............................................................................................. 18
4.8 Analysis of results ................................................................................................... 19
5 Results............................................................................................................................. 20
5.1 Participants .............................................................................................................. 20
5.2 Password reuse behaviour.................................................................................... 21
5.2.1 Summary of research question 1. .................................................... 24
5.3 Length and complexity of passwords .................................................................. 24

5.3.1 Summary of research question 2 ..................................................... 27
5.4 Native language used in passwords .................................................................... 28
5.4.1 Summary of research question 3 ..................................................... 29
5.5 Meaningful words and passphrases .................................................................... 29
5.5.1 Summary of research question 4 ..................................................... 31
5.6 Attitude towards password policies...................................................................... 32
5.6.1 Summary of research question 5 ..................................................... 37
6 Discussion....................................................................................................................... 39
6.1 Handling of validity threat ...................................................................................... 39
6.2 Construction of questionnaire ............................................................................... 40
6.3 Reflections on general changes and improvements ......................................... 40
7 Conclusion ...................................................................................................................... 42
8 Future work..................................................................................................................... 44
9 Time plan ........................................................................................................................ 45
References ............................................................................................................................. 47

Special thanks to:
Kirsi Helkala and Per Backlund for helping me with the distribution of
the surveys in Norway and India.

1
1 Introduction When it comes to information security, confidentially is an important aspect. In the
context of computer security, confidentiality usually means a way of protecting
information from getting in the wrong hands. The most common method of
implementation when it comes to confidentially is through authentication via a
combination of a user ID and a password (Petrie and Merdenyan, 2016).
It is generally known that the average user does not always display proper password
behaviour when it comes to things such as creating a strong password, keeping the
password safe, and not re-using passwords. This is due to human nature.
Remembering what is often several long and complex passwords containing numbers
and symbols with no attachment to us is difficult. Hence, users tend to implement
various coping mechanisms such as creating simple passwords or writing them down.
But do all users have the same bad habits when it comes to password creation and
management? A recent study has shown that users in some cases tend to have
different password habits depending on culture and gender (Petrie and Merdenyan,
2016).
Password polices are meant to aid users in their creation of passwords and guide
them in displaying proper password behaviour and not do things such as sharing a
password with a coworker. However, password policies can often create tension and
frustration for users, resulting in users implementing certain strategies in order to
circumvent password policies. One way to minimize the frustration often felt towards
password polices is to educate users about security and threats as this might help
them in their attitude and motivation to comply with the password policy by giving
them a better understanding of the necessity of password policies (Ingelsant and
Sasse, 1999).
It is the goal of this final year project to further explore the notion that users might
have different password habits depending on culture and gender. The few studies
found on this topic had the focus on what the authors called western culture
compared to a non-western culture. Western culture, according to the authors, often
meaning the culture of America and Northern Europe. This study aims to do the same
but also compare two countries in Europe to each other to investigate if any
differences are present. The study will be a quantitative online survey with students
as the target group.
The contribution of this study is a better understanding of users and their password
behaviour. Such information could be useful for system administrators to tune their
defenses against hackers, improve password policies or to detect groups that are
more vulnerable to password attacks because of bad password habits. Furthermore,
Petrie and Merenyan (2016) conclude in their study, which this study is inspired by,

2
that their research might help with the education of users when it comes to security
and threats.
2 Background This section of the report aims to provide the reader with information and an
understanding of the problem this study is going to address.
2.1 Passwords
Passwords should ideally be hard to guess but easy to remember. Unfortunately,
these two factors do not always go hand in hand and users tend to create passwords
that comply with the latter. Passwords need to be resistant against several types of
attacks, the most common being brute force attacks and dictionary attacks. A
dictionary attack is an attack where the attacker has a database containing large
number of passwords and possible combinations of passwords. The attacker then
uses the database to guess the user’s password by trying the passwords in the
database. In a brute force attack the attacker tries all possible combinations of
characters and symbols (Mujeye and Levy, 2013).
Users tend to choose short passwords which are simple and thus easy to remember
rendering them susceptible to the previously mentioned attacks. According to,
Florêncio and Herley (2007), the majority of the users in their study used only lower
case letters in their passwords. Users tend to use numbers and uppercase letters in
predictable ways such as adding a number at the end of a password (Shay et al.,
2016).
Other common mistakes in password creation is the use of personal information such
as birthdays, family names, and other similar things like favorite music. These are all
factors that make it easier for an attacker to guess the user’s password (Taneski,
Hericko and Brumen, 2014).
2.2 Passphrase
Passphrase is an alternative to a regular password. A passphrase is basically a
password but longer, usually containing meaningful words in a grammatically correct
sequence for example “ILikeToGoToConcerts”. Passphrase are designed to be easier
to remember due to the structure of meaningful words but also harder to guess since
they are typically longer than average passwords (Taneski et al., 2014).
2.3 Mnemonic-based passwords
Another approach to passwords are so called mnemonic-based passwords which can
be best described as a method for creating seemingly complex passwords. One
common way is to take a passphrase and use the first letter from each word to form a
password. The previous passphrase would be something like: IL2gtoC!. Mnemonic-
based passwords are almost as strong as randomly generated passwords but are
normally easier to remember (Taneski et al., 2014).

3
2.4 Reuse of passwords
In recent years, the amount of password-protected accounts that the average user
possesses has increased and continues to do so. This is largely due to an increase in
online services available such as Facebook and Twitter. Nowadays most schools and
work places also have several logins that require both username and password as the
primary authentication method. According to a study made by Florêncio and Herley
(2007) an average user has 25 password-protected accounts and types 8 passwords
each day. It is easy to see why this could become a problem for a user. With so many
passwords it can get hard to remember the passwords and also being able to
remember which password goes together with which account (Florêncio and Herley,
2007). According to Adams and Sasse (1999) a user can be expected to remember
four to five passwords effectively without having to write them down.
A common problem with trying to remember too many passwords is that users might
write down the password to make it easier to remember. Adams and Sasse (1999)
found that being forced to change passwords was a large contributor to users writing
down their passwords. Another common problem is the reuse of passwords. A large-
scale study on leaked passwords showed that between 43-51% of all users reused
passwords for multiple accounts (Das, Bonneau, Ceasar, Borisov and Wang, 2014).
Password reuse can lead to the so-called domino effect (Ives, Walsh and Schneider,
2004). The domino effect can be described as an effect that occurs when a user reuses
a password across several different accounts which then can lead to a hacker getting
access to multiple accounts instead of just one because of the similarity between the
passwords (Ives, Walsh and Schneider, 2004).
In reality it is often hard to reuse the exact same password for two or more different
sites since websites tend to have different password polices. Some sites might require
at least one uppercase letter and a number while another site might require special
characters. However, users tend to work around this by using the same core-
password but adding for instance a “1” or a “#” to the end of the password or
changing a lowercase letter to an uppercase letter to match the website password
policy (Das et al., 2014).
One study conducted by Stobert and Biddle (2014) found that 96% of the participants
reused passwords and that the users reported using different passwords for different
services, e.g. one password for all social media, one password for all school related
logins etc. The users also reported using parts of their username in the password as a
reminder for which password goes together with which account (Stobert and Biddle,
2014).
One way to and help users when it comes to password reuse is by using password
managers (Fukumitsu et. al, 2016). The way password managers work is that they
make use of a master password or in some cases a security token which in turn is
used to protect the other passwords and login information that the user possess

4
(Fukumitsu et. al, 2016). Password managers comes in many shapes and sizes,
sometimes as an application and in many other cases as a feature in a web browser.
The password manager eliminates the need to have to memorize all different
passwords for all different accounts by storing them in an encrypted database
(Fukumitsu, et al. 2016). This makes it easier for users to create strong and diverse
passwords for each logon. However, a strong master password is still required for the
password manager login to be considered safe as it is a potential target for an attacker
(Fukumitsu, et al. 2016).
2.5 Password policies
Forcing users to create long and complex passwords can be seen as cumbersome for
the user, especially when combined with frequent password changes. In cases where
changing the password is mandatory but the user is allowed to reuse their old
password as long as they add something new to it for example “Cheesecake” and
“Cheesecake!”, users tend to do so (Inglesant and Sasse, 2010). However, policies
that do not allow for this and thus forcing the user to come up with an entirely new
password often create frustration for the user and in many cases, results in the user
writing down the new password as a way of learning it (Inglesant and Sasse, 2010).
Another key in getting users to display better password behaviour is getting users to
comply with a password policy. A policy that no one follows is a useless policy.
Complying with a password policy or other security technologies can to an extent be
attributed towards the users own attitude regarding the policy. One way to improve
user attitude toward password policies is by making sure that users are well informed
and understands the severity of the threat that they are facing. If users understand
the threat and feel that he or she can do something about it and that their efforts are
useful they are more inclined to comply with the password policy (Inglesant and
Sasse, 1999).
2.6 Keyloggers
There are many techniques provided to users to aid them in their password behaviour
and in creating stronger passwords. However, keyloggers can compromise even the
strongest password. A keylogger can be either hardware or software-based and can be
installed on a host, usually by a malicious user, that can monitor the system and
record every keystroke input from the keyboard (Howard and Hu, 2012). The goal is
to log and send the keystroke input to identify sensitive information such as
passwords. Hence, if a malicious keylogger has infected the host system, even the
longest and most of complex password will still be registered and sent to the attacker.
Software-based keyloggers are in general hard to detect and cannot usually be
detected by traditional means. One of the reasons for this is that the keyloggers
application process is usually hidden in memory and is not displayed as a process in
Task Manager or when listing processes in Linux using the ps command (Howard
and Hu, 2012).

5
2.7 Related work
A study with the focus on investigating differences between advanced computer users
in Bangladesh and America used an online survey as their method for gathering data.
The survey contained close-ended questions and some Likert Scale type items with 5
options ranging from “1=never” to “5=always” (Haque et al. 2013).
Some of their findings include that users in Bangladesh tend to have fewer password
protected accounts than users in America. Even though the participants in
Bangladesh were shown to have fewer passwords, the rate at which they reuse
passwords were fairly equal to that of an average participant from America, with 70%
of the users from Bangladesh reported having at least once reused passwords for
different accounts (Haque et al., 2013). Furthermore, they also found that users in
Bangladesh did not only write down their passwords more frequently than
participants form America, but also that they are less likely to share their passwords.
(Haque et al., 2013).
When comparing the use of meaningful words, they concluded that users in US were
more likely to use personally meaningful words and meaningful numbers than the
users in Bangladesh. Of all the participants from Bangladesh only 22% reported using
personally meaningful words were as a similar study in the US showed that 55% of
the participants used personally meaningful words in their passwords (Haque et al.,
2013).
Another study conducted through an online survey with the aim of investigating
gender and culture differences on users in China, Turkey, and UK showed that there
were some differences between both culture and gender amongst the subjects. The
survey featured Likert Scale questions and primarily used a two-way independent
measure analysis of variance (ANOVA) for analyzing the data (Petrie and Merdenyan,
2016).
The study found, for instance, that women tend to share their passwords more often
than men. When asked about who they share their passwords with 67% reported that
they shared their passwords with family members (Petrie and Merdenyan, 2016).
The results also showed that men were more likely to forget their passwords.
Furthermore, women in the UK had on average longer passwords compared to both
men and women in China and Turkey. The study also showed that women in the UK
had on average longer shortest passwords than men, but in China and Turkey the
results were reversed (Petrie and Merdenyan, 2016). The research also found that it
is more common to have passwords containing family members names in China than
in Turkey and the UK (Petrie and Merdenyan, 2016).
One of the challenges Petrie and Merdenyan (2016) faced were the distribution of
gender in the participants. They note that it is difficult to get a 1:1 ratio between
males and females when conducting online surveys. Furthermore, they also note that

6
previous studies in password behaviour often fail to present the ratio between the
genders when presenting how many partook in a study.
A study in Australia done in 2006 were the participants included students at three
different campuses also showed differences in password behaviour between men and
females (Bryant and Campbell, 2006). Although this was not the primary objective of
the study, some of the results showed that factors such as age and gender can play a
role in password creation and password behaviour. For instance, they found that
females were more likely to have simple passwords that contain meaningful phrases.
However, females were also less likely to reuse their passwords compared to men
(Bryant and Campbell, 2006).
The researchers conclude that both men and women have poor password behaviour,
but each in different areas. They also concluded that these differences do not
necessarily mean that one gender is worse at password creation or management than
the other, but rather that they are both equally bad when it comes to password
behaviour (Bryant and Campbell, 2006).
Sawaya et al. (2017) note in their research the importance of understanding users’
attitudes in regard to computer security in order to be able to devise human-centered
defenses. In their research, they also postulate that cultural differences might play a
huge role in attitude towards computer security and that this is under-studied within
the computer security research field. Through a large-scale study, spanning seven
countries, Sawaya et al. (2017) were able to conclude that culture has an impact on
user behaviour when it comes to general computer security. Sawaya et al. (2017)
observed that participants from Japan scored considerably lower compared to the
other countries when it came to users exhibiting secure behaviour. America, Emirati
and China scored higher than most of the other participants, except for France which
scored the highest.
The researchers also noted that most of the work done within this research field is
conducted in what the researchers refer to as “western” countries and that those
results only represents a small fraction of internet users and do not necessarily do a
very good job when it comes to generalizing user behaviour in regard to computer
security (Sawaya et al. 2017).
Differences in gender and culture can be seen in other areas as well. In a study aimed
at investigating user behaviour in regard to lock-screen usage in mobile devices
Harbach et al. (2016) observed significant differences. They found that non-U.S
countries, within their sample, were between 31% and 76% more likely to use a secure
lock-screen compared to the American participants. The researchers also note that
males were 38% more likely to use secure lock-screens (Harbach, et al. 2016). The
participants also gave different reasons for having a lock-screen with Netherlands
being 40% less likely to mention specific scenarios as motivation for having a lock-
screen whereas the participants in Italy and Japan were 77% and 91% more likely to

7
mention specific scenarios such as someone making unwanted calls or misusing
social accounts (Harbach, et al. 2016). Additional findings include that the Japanese
participants considered their data on their smartphones to be much more sensitive
compared to the other participants and that age also has an impact on lock-screen
usage with older people being less likely to use lock-screens (Harbach, et al. 2016).
3 Problem formulation The aim of this final year project is to investigate what the differences are when it
comes to password behaviour between cultures and gender amongst students.
The study will focus on three universities in total. Two of these universities are
located in Europe, with one of the universities being located in Sweden and the other
in Norway. The third university is located in India.
In order to provide an answer to this problem, five research questions will be
examined. The goal is that these research questions will provide accurate data that
reflect reality in a meaningful way in order to see if there are any differences in
password creation and behaviour. The research questions are listed down below.
1. What are the differences between culture and gender when it comes to password
reuse behaviour?
2. What are the differences between culture and gender when it comes to the length
and complexity of passwords?
3. What are the differences between culture and gender when it comes to the use of
native language used in passwords?
4. What are the differences between culture and gender in the use of meaningful
words or phrases in passwords / passphrases?
5. What are the differences between culture and gender in the attitude towards
password policies?
3.1 Motivation
Even though there have been technological advancements when it comes to
authentication schemes, username and password still remain the most common way
of authentication. In this authentication scheme the user is usually considered the
weakest link.
Users tend to create weak and simple passwords unless they are forced to do
otherwise. Furthermore, users often forget their passwords and implement various
coping strategies such as writing down passwords or reusing passwords across
multiple accounts to avoid having to remember too many passwords (Inglesant and
Sasse, 2010).

8
But do all users display the same poor password behaviour? A recent study found that
women in the UK are more likely to write down their passwords than both women
and men in China and Turkey. The same study also found that women are more likely
to share their passwords with coworkers, that men tend to forget their passwords
more often and that in China it is more common to use family members names in
passwords. (Petrie and Merdenyan, 2016).
One of the most important duties carried out by a system administrator is making
sure that the system is secure from attacks. One of the many way of doing so is by
auditing the passwords of the users within the system (Pinkas and Sander, 2002)
This is typically done with known software used by hackers such as John the ripper
which provides the system administrator with the option of performing a dictionary
attack (John the ripper password cracker, 2016). The data presented in this study
could be used by system administrators to improve the passwords of their users by
adjusting and tweaking their dictionary databases used when auditing passwords.
The most common way of aiding a user in password management and improve their
password behaviour is with a password policy. Auditing the user’s passwords is a way
for the system administrator to check that the users comply with the implemented
password policy.
As previously explained in the background section of the report there are several ways
password policies can create frustration for users, for example forcing the user to
change password frequently (Adams and Sasse, 1999). A user’s motivation to comply
with a password policy is recued if the user does not understand why the password
regulations are implemented in a certain way. Educating users about security and
possible threats is one way of increasing the compliancy rate when it comes to
password polices. (Adams and Sasse, 1999). Petrie and Merdenyan (2016) research in
cultural and gender differences notes that their research could help improve
education about password security by better understanding the differences in
password creation and management between culture and gender.
Sawaya et al. (2017) argue that culture does impact user behaviour in general and
that this is carried over to user behaviour when it comes to computer security. The
researchers also note that this is under-studied within the computer security research
field and that this needs to be addressed to be able to make better improvements for
users when it comes to computer security.
The results of this final year project can be used to improve password policies by
providing a better understanding of users general behaviour when it comes to
password creation and management. Understanding users’ behaviour could for
instance also lead to improvements in application making, if for example, it was
possible to determine that a certain target group were more susceptible to various
threats due to poor password behavior.

9
By shedding light on the differences between both gender and culture when it comes
to password behavior, this study also contributes to the research field by further
showing that differences exist and that this needs to be researched more to get a
better understanding of what differences exists and to what extend various factors
such as gender and culture has on user behaviour within the area of computer
security.
3.2 Objectives This part of the report presents the objectives of the report. The objectives are
presented in chronological order and are deemed necessary in order to succeed with
this research project.
1. Background research. The first step is to conduct background research on
related topics in order to get a better understanding about the subject at hand in
order to identify key aspects regarding password . This will be continuous throughout
the final year project. The background research will also be the foundation for the
methodology used in this research, both to identify key aspects when it comes to
quantitative methodology and also to identify models used for creating
questionnaires.
2. Creating online questionnaire. The second part of the research is to create an
online questionnaire. The primary source of data in this report will come from the
online questioners. It is therefore of uttermost importance that validity threats are
also identified and handled at this point of the research.
3. Testing of questionnaire.
During a one week period, the survey will be tested in order to find mistakes that
might otherwise be overlooked or not obvious to the creator of the questionnaire,
before it is distributed to the participants.
4. Collecting data. Getting in contact with the universities that volunteer to partake
in the study in order to provide them with the survey, so that the survey can get
distributed.
5. Analyze. This part of the study focuses on analyze and compile the data gathered
through the online survey in a way that complies with the chosen method for the
study in order to present it.
3.3 Expected results
The results expected from this study are that there are going to be some differences in
password behaviour between cultures and gender as the few previous studies on
subject have already indicated. However, trying to predict the outcome of a study of
this nature is very difficult due to there being so many variables when it comes to
culture and gender. However, these variables are not a hindrance for the study since
the aim is to explore whether or not there exist any differences at all and not to

10
explain why. The postulated hypothesis will therefore be based on the few previous
studies as well as personal observations.
1. What are the differences in password reuse behaviour?
There is no reason to assume that students today do not have the same access when it
comes to online services and thus most students are likely to have a great many
password protected accounts which leads to similarities in password reuse behaviour,
which have been observed in related works.
2. What are the differences in the length and complexity of passwords?
The expected results are that women are more likely to have longer and more
complex passwords as is noted in the research by Petrie and Merdenyan (2016).
3. What are the differences when it comes to the use of native language used in
passwords? The expected results are that countries in Europe are more likely to use
English words instead of native language words. In Europe, the education of the
English language is quite good. Furthermore, there’s also a large influence of
American and British pop culture.
4. What are the differences in the use of meaningful words or phrases in passwords
/ passphrases? The expected result is that the European countries are more likely to
use meaningful words or phrases in form of famous lyrics or movie quotes etc. This is
based on the influence of American and British pop culture in Europe.
5. What are the differences between culture and gender in the attitude towards
password policies? The expected result is that students from all three universities
will to some extend find password policies tedious but ultimately see the value in
them.
3.4 Demarcation
The study will be limited to three universities one in Sweden, one in Norway and one
in India. The study has the emphasis on gender and culture and will therefore not
look for instance at age as a factor as it would be very hard to control in a study of this
nature which is a best effort when it comes to reaching out to participants.
The study is limited to passwords and will therefore not look at user behaviour when
it comes to other authentication mechanisms such as two factor authentication or
PIN numbers. Only students will take part in the study.
Furthermore, the study is aimed at providing information that is relev ant to people
working with computer security such as system administrators. For example, what
are common tendencies in password creation for Swedish people. The study will not
however try to explain why these cultural differences might exist as it is deemed
beyond the scope of the network and system administration program.

11
4 Methodology This part of the report will cover the method used to create the questionnaire, how
the questions were constructed, sample size, ethics and the instrumentation used.
Validity threats will also be discussed in this section, for a full list of identified validity
threats that are applicable to this study, see Appendix A.
4.1 Methodology Overview
For any research to be able to present good and relevant data, it is important to have
an outlined method of how the data is going to be gathered and analyzed. There are
two main approaches to this, a quantitative method or a qualitative method.
Choosing between quantitative and qualitative is dependent on what the aim of the
study is and what types of questions the research is meant to answer.
A quantitative method is well suited when comparing differences that can be analyzed
and presented through statistical analysis. The quantitative method is suited for
“how” questions such as “how many passwords do you have?” where as a qualitative
method is well suited for “why” questions such as “why do you have so many
passwords?” (Wohlin et al., 2012).
Once the type of data that is going to be collected has been decided it is important to
figure out how to go about gathering the data. This can for instance be done through
interviews or questionnaires. Wohlin (2012) explains that a survey can be used as a
mean of collecting information about people in regard to their attitudes and
behaviour. One of the most common tools for data gathering in surveys are
questionnaires (Wholin, 2012).
The previous mentioned explanation of a survey through a questionnaire fits well
with the problem formulation of this study, namely, to explore whether there are any
differences in password behaviour when it comes to culture and gender. The
methodology chosen and implemented in the study will be quantitative rather than
qualitative since it aims to provide insight if there are any differences rather than
explaining why these differences might exist. Furthermore, a quantitative approach
allows for quantifying the results through descriptive statistics to be presented in the
results (Wohlin et al., 2012). The questionnaire itself will be conducted online due to
the nature of the study spanning several countries.
4.2 Survey methodology There are many aspects to take into consideration when creating a questionnaire.
These aspects will be discussed and outlined in next part of the report.
4.2.1 Standardization
Torst and Hultåker (2016) identifies standardization as an important factor when it
comes to conducting surveys through questionnaires. Standardization is simply a way
of constructing the questions so that they are interpreted the same way by all

12
participants (Torst and Hultåker, 2016). High standardization means that everyone
that reads a question reads and understand that question the same way. This is
important for the result of the survey since a low standardization means that the
participants to a varying degree might have interpreted the question in different ways
which makes the end result hard to compare (Torst and Hultåker, 2016). This aspect
is of huge importance and must be tested before the survey is sent out since it is
online based and the researcher can’t be present to clarify potential
misunderstandings.
4.2.2 Open-ended / closed-ended questions
Open-ended questions are questions with no reply alternatives. In such case, the user
cannot choose an answer and must instead write down the answer themselves (Torst
and Hultåker, 2016) A close-ended question is a question where the participants are
given reply alternatives.
Torst and Hultåker (2016) noted some problems when it comes to using open-ended
questions in a questionnaire. One of the problem usually related to open-ended
questionnaires is that it is more time consuming for the researcher to go through the
answers to compare the results. Factors contributing to this are, for example, that
some people write long detailed answers and others just write buzzwords that might
have to be interpreted by the researcher themselves. Open-ended questions can make
it harder for the participants to understand and make them unsure of what to answer.
The use of reply alternatives can thus make it easier to interpret and understand the
question. Furthermore, some participants might not be comfortable with writing
answers since they think that they are bad at spelling or something of that nature
(Torst and Hultåker, 2016). Another potential problem with open-ended questions is
that people simply might not want to spend time writing answers to questions that
they are not particularity interested in and thus might opt out of answering some of
those questions (Torst and Hultåker, 2016).
Close-ended questions are questions that have reply alternatives. However there
exists some problems with these types of questions as well. One problem with close-
ended questions is that it is hard to make sure that the whole range of possible
answers are included as reply alternatives (Torst and Hultåker, 2016). This problem
is easily demonstrated with a hypothetical question such as “How many times a day
do you enter your password credentials?”. If the reply alternatives are 1 -3, 4-5 and 6-7
a user whom enter their passwords credentials 3-4 times will have a hard time
answering this close-ended question. It is quite common that reply alternatives
include a “other” option for those instances where the participant does not feel that
any of the reply alternatives are correct for them (Torst and Hultåker, 2016).
This study’s primary goal is to explore whether there exist any differences in
password behaviour when it comes to culture and gender. Therefore, a close-ended

13
approach will be implemented in the construction of the questionnaire to get results
that are more easily compared to each other and to avoid having to interpret users
answers as much as possible. However, some questions will be in the form of open-
ended such as “How long is your longest password” due the answer to this question
requiring very little interpretation since it will be in the form of a number.
4.2.3 Wording of questions
When conducing a survey through a questionnaire it is important to carefully design
the questions. The reasons for this is to make it easier for the participants to
understand the questions which will likely increase the number of respondents to the
questionnaire but also to avoid skewed answers and to mitigate validity threats.
Robson (2011) notes some key factors to keep in mind while constructing the
questions such as keeping the language simple and the questions short. The
researcher should also avoid leading questions such as “Do you think apples are
better…” as such questions can potentially influence the answer (Robson, 2011).
Furthermore, the researcher should seek to avoid negations in questions as these can
create confusion and make it unnecessarily hard for the participants to understand
the question. It is also important to make sure that the question is not asking two
different things at once, a so called double-barreled question. (Robson, 2011). An
example of a double-barreled question is “Is your password long and complex?”. The
problem here is obvious as the participant might have a long password but it might
not be complex or vice versa.
When constructing a questionnaire, it is important not to have too many questions
that take too much time for the participant to complete. Such a questionnaire could
have a negative outcome for the results of the collected data and result in participants
choosing not to finish the survey (Wohlin et al., 2012). In addition to this Torst and
Hultåker (2016) notes that a good practice to implement at the start the survey is to
have one or two warmup questions to get the participants more involved in the
questionnaire.
4.2.4 Likert Scale
When conducting a survey through a questionnaire with the intention of investigating
the participants attitude around a certain topic a Likert scale can be used.
In a Likert scale the reply alternatives are usually presented as a simple horizontal
scale. The Likert scale is a tool used to investigate participants attitudes by displaying
reply alternatives that covers both extremes of an answer. An example would be
“How satisfied are you with the current implementation of system X?” with reply
alternatives ranging from “Strongly disagree” to “Strongly agree” with options in
between. Some variations of Likert scales exist where the user is given a neutral
reply-alternative (Betram, 2009).

14
The benefits of using a Likert scale is that you can measure differences in attitudes
something that is very hard to do with yes/no questions and it makes it easier to
interpret the answers compared to open ended questions where the researcher have
to interpret the answers themselves.
Figure 1. Question 9 from the questionnaire.
When using a Likert scale in a questionnaire, it is important not to give the
participants too few reply alternatives as this in and of itself can result in inadequate
data and create frustration for the user when trying to answer the question.
However, the questionnaire should not contain too many reply alternatives either as
this might be confusing to the user by making it difficult for the user to understand
the difference between two reply alternatives. The recommended number of reply
alternatives within a Likert scale should be kept to a minimum of 3 and a maximum
of 9 alternatives. Furthermore, there should be an odd number of questions giving
the user a chance to take an alternative position (Cox, 1980). This will be used in case
some of the participants are not too familiar with password polices and thus reducing
the risk of skewing the results when it comes to attitudes towards password policies.
The strength of using a Likert scale is that it is relatively easy to understand and
therefore also easy for the participants to complete. Exploring differences in attitude
towards password polices is one the objectives of the study and thus making Likert
scale a good method to implement for those questions. Likert scale will however be
used for other questions as well.
4.3 Sample size Using a quantitative-based method for gathering data allows for possibility of
reaching a large population. For this study however, the sample size will be limited to
the students of the three universities. Limiting the study to three universities is due to
the time restrictions of the final year project to make sure there is enough time to
thoroughly analyze all the data. The study will use a non-probability sampling
method which is common in small-scale surveys and is often used when the survey is
conducted at schools or workplaces (Robson, 2011). However, using a non-probability

15
sampling method does not allow for generalization of the results beyond the sample,
which is in this case students at a certain university.
To be able to draw accurate conclusions based on the data gathered from the survey
Robson (2011) explains that a larger sample size is more desirable than a smaller
sample size. The goal is to get as many participants as possible to answer the
questionnaire to be able to draw more reliable conclusions from the results. A larger
sample size also helps to prevent accidental sampling which in this study could be for
example be if the study only ended up including male participants (Robson, 2011).
In Norway and in India the questionnaire was distributed via the supervisor ’s
contacts through e-mail to the students. In Norway, the survey was sent out to 152
students. However, some of the students that received the mail had already graduated
and were thus not likely to read the e-mail. How many was asked to participate in the
survey in India is unknown. In Sweden, the data was gathered by having students
voluntarily come up and fill in the survey on campus.
For the sake of complete transparency, it should be noted that the survey was also
sent to a university in China and a university in France. This was done because it was
predicted that the participation for the study might be low since it was completely
voluntary to participate. This turned out to be true and the participation in both
France and China turned out to be very low. However, the original goal was to have
three universities partake in the study, which ended up being the universities in
Sweden, Norway and India.
4.4 Instrumentation
Google Forms and SurveyGizmo were used to conduct the survey. Google Forms was
used for all universities except China since it is not allowed there. This was discovered
after all surveys was sent out which resulted in an identical survey had to be created
in SurveyGizmo.
The primary choice was to use Google Forms since it is a free service with no trial
period which makes it ideal for a longer study. Furthermore, Google Forms comes
with an easy to use interface which is also easy and intuitive for the participants to
use. Google Forms and SurveyGizmo allow for overviews of the responses and the
ability to export the results to Excel and for the analysis of the results.
4.5 Ethics
When conducting scientific research that involves humans there are several
important ethical aspects to take into consideration. First and foremost, the
participants in this study must give informed consent that they are willing to
participate in the study. The participants should only give the consent to participate
in the study after they have understood all the relevant information regarding the
study (Wohlin et al., 2012). In this survey, the participants were informed that the

16
questionnaire was part of a final year project conducted at a university in Sweden
with the purpose of the study clearly stated at the beginning of the questionnaire.
It is also important that the participants are informed and understand that the
participation in the study is voluntary and that there are no penalties for the
participant if he or she decided not to finish the survey (Wohlin et al., 2012).
The participants taking part in this study will also be informed about anonymity.
There will be no personal data gathered or used in the study apart from which
country they study in, their gender and what program they study. The contact
information of the author of the survey will also be available if the participants would
like to ask any questions.
There are ethical issues to be concerned with when conducting research regarding
passwords. For instance, conducting research on leaked databases might have
provided better answers to the research questions postulated in this study. Egelman
et al. (2012) notes in their article that conducting research on passwords is very
important in order to provide better understanding and security for users by
improving password policies. However, it is not uncommon that research on
passwords is made using datasets which have been leaked by illegal means. The
problem is that stolen data is made publicly available, without the consent of the
owners of the data, or individuals that might potentially be exposed or harmed in
anyway by making said data publicly available (Egelman et al. 2012).
For instance, it could be possible to trace passwords to individual users with the
combined knowledge of which site or service the password was leaked from and the
fact that passwords might contain personal information such as birthdays or
addresses (Egelman et al. 2012). However, using stolen or leaked passwords might
provide a better picture of users’ password behaviour than passwords gathered by
other means (Egelman et al. 2012). The findings in the article show varying answers
to the topic of using stolen data to conduct research. Some of the participants in the
panel say that it would be hard to justify such research as ethical and some say that
they think that it should be tolerable to use such data in research, as long as it is
possible ensure that any individuals do not get harmed or that individuals give their
consent (Egelman et al. 2012).
In order for this study to be seen as ethical, it is of importance that the users in this
study are not asked questions that compromise their password integrity and that it is
not possible to track individuals that partook in the study.
4.6 Validity Threats The validity of a study can be explained as how trustworthy the results presented in a
study are (Wohlin et al., 2012). To achieve high validity, it is important to identify
possible validity threats in the planning phase of the study so that they can be
handled in a correct manner (Wohlin et al., 2012). In this final year project, examples

17
of threats to the validity of the results include that the participants do not understand
the questions, that the questions are phrased in a biased way or that the study has low
statistical power. There are different classifications for validity threats and in this
section of the report conclusion, internal, construct, reliability and external validity
will be presented. A full list of validity threats that were identified and deemed
applicable to this study can be found in Appendix A.
There is always a trade-off when handling validity threats. For example, using
students at a university might give the researcher access to a larger group of
participants and thus reduce threats such as low statistical power and reduce
heterogeneity. This will result in high validity when it comes to conclusion validity
but it might affect for instance external validity since you can’t generalize the results
beyond students (Wohlin et al., 2012).
Construct validity is a way of assuring that the study actually measures what the
study is meant to measure (Wohlin et al., 2012). In this case it is important that the
questionnaire actually reflects the aim of the study and that it does so with a high
standardization so that the participants understand the questions in the way that they
are meant to be understood. It is therefore very important that the survey is tested
before it is handed out to the participants.
Wohlin (2012) notes that there are social threats to the construct validity such as
experimenter expectancies. Experimenter expectancies refers to when a researcher is
biased towards the results and this might unconsciously impact the results in the
form of designing questions that are part of the questionnaire. One way of mitigating
this is by having other people look at the questions beforehand (Wohlin et al., 2012).
Internal validity refers to factors that can impact the research without the
researcher’s knowledge and thus having an impact on the conclusions drawn from the
research (Wohlin et al., 2012). For example, the language used in the survey could
impact the study. If the different universities got surveys in different languages this
could potentially influence the results. To mitigate this the survey will only be
available in English. Another threat to the internal validity of the study is maturation.
Maturation is when the participants behaves in different ways as time passes during a
test. This can be for instance be due to the participants being bored during a survey
or that they learn something during the survey that could influence the later
questions in the questionnaire (Wohlin et al., 2012). To keep this threat to a
minimum the questionnaire consists of easy questions and is kept relatively short.
External validity refers to which degree the results of the report can be generalized
and to who the results might be interesting to. For instance, researchers conducting
research within a similar field or topic (Wohlin et al., 2012). One threat to external
validity is interaction of selection and treatment which means the wrong participants

18
for the study. To avoid this threat it is important that only students partake in the
survey and not teachers.
Conclusion validity is sometimes called statistical conclusion validity and relates to
the conclusions drawn from the results. For instance, the researcher might conclude
that there is a relationship when in fact there is none or vice versa. Threats related to
this is for example fishing and error rate which is when the researcher is looking for a
specific outcome (Wohlin et al., 2012). One way of dealing with this type of validity
threat is to be transparent with the results gathered from the survey . Another threat
to the conclusion validity of this study is low statistical power. Statistical power can
be understood as the tests ability to actually show correct pattern in data (Wohlin et
al., 2012). If the power of the test is low there is a chance that the conclusions drawn
from the data are wrong. One way to mitigate this is to have a large sample size of
participants in the study.
Reliability refers to transparency of the research. A high reliability means that
another researcher can conduct the same study in the same way and get similar
results (Wohlin et al., 2012). It is therefore important to account for the method used
and implemented in this final year project.
4.7 Methodology preview This study used both Google Forms and SurveyGizmo in the creation and distribution
of the questionnaires due to the nature of this final year project spanning several
countries. The survey was distributed through the help of the supervisor’s contacts
and is as such a best effort in trying to get as many participants as possible.
The questionnaire was tested during a trial week to reduce mistakes that might
otherwise have been overlooked. The questionnaire is in English and identical for all
universities to minimize the threat of reliability of treatment implementation. The
language is kept simple throughout the questionnaire and concepts that might not be
generally known such as “passphrase” are explained to keep the threat of
confounding constructs and levels of constructs to a minimum.
The questionnaire can be found in appendix B. Questions 3-4 and 7 relate to the
objective of the length and complexity of user’s passwords. Questions 8 and 10 are
aimed at answering the objective that refers to users use of passphrases and
meaningful words. Questions 14-15 relates password reuse behaviour and question 9
is aimed at answering the research question about differences in the use of native
language in passwords.
Questions 5, 6, 11-13 and 16-20 relate to the attitude and behaviour towards password
policies and are therefore mostly in the form of Likert scale type items. All
questionnaires are presented to students to address the threat of interaction of

19
selection treatment which refers to using the right population in order to be able to
generalize the results.
Questions 1-2 are warmup questions, the results of these questions can be found in
Appendix C.
At the beginning of the questionnaire it states what the survey is about in order to
minimize the threat of hypothesis guessing. The threat of evaluation apprehension,
people trying to look better when being evaluated, is minimized by clearly stating at
the start of the questionnaire that all participants will remain anonymous and that
there will be no way to trace the answers to anyone individually.
4.8 Analysis of results This section of the report aims to provide the reader with the method used when
analyzing the data. After the data has been gathered it is crucial to have a systematic
approach for how the data should be analyzed to be able to interpret the data in a
correct way (Robson, 2011).
For the all data gathered central tendencies will be calculated. Part of central
tendencies is the mean which is the average calculated from the given data (Robson,
2011). Furthermore, standard deviation will also have to be calculated for all
questions where the mean is calculated. Standard deviation is used to show how
spread out the data is compared to the mean (Robson, 2011).
Petrie and Merenyan (2016) are transparent in their method for analyzing data
gathered from their surveys. They used a two-way ANOVA (Analysis of variance) to
investigate whether or not any differences are present when comparing the means
within the different groups. ANOVA is a model used in statistics that show whether or
not the difference between two or more group means are statistical significant or not
(Robson, 2011).
A one-way ANOVA is used when only one factor or variable is being checked. For
instance, when comparing the means of a certain result between men and women
within a country. In the previously mentioned case the only variable measured is the
gender. However, when two factors are investigated, as is the case in this study, a
two-way ANOVA should be used. Using two-way ANOVAs in this study aims to
investigate if the differences seen in the results are due to gender, culture or both. All
two-way ANOVAs in this study will be setup as Gender*Country to investigate if any
statistical significance can be established when comparing the means.
The Alpha value (α) is chosen to be 0.05 as it is the standard choice when conducting
research of this nature (Tabachnick and Fidell, 2006). The alpha value is a
measurement that aids in avoiding type 1 errors. Type 1 errors are when the null
hypothesis is true but it is rejected anyway (Tabachnick and Fidell, 2006). An
example of a type 1 error in this study would be that there is no difference when it

20
comes to password lengths but the conclusion drawn from the result is that there is a
difference. The alpha value is commonly presented as p-value and in order for a
statistical significance to be established the p-value of the test must be less than 0.05.
A p-value less than 0.05 means that there is a 5% or less chance that the data of the
study occurred by chance and that the findings are statistically significant
(Tabachnick and Fidell, 2006).
5 Results This section of the report is aimed at presenting the results based on the data
gathered from the online questionnaires. Some of the questions in the questionnaire
were control questions and questions that were meant to be warmup questions for
the participants and do not have a direct tie to the problem formulation. However, for
the sake of transparency these questions and their results can be found in appendix
C. For each research question presented in the report their will be a conclusion
presented in the results.
5.1 Participants The study was conducted at three different universities in three different countries.
The countries were Sweden, Norway and India. The surveys were distributed online
and the country with most participants was India with 96 respondents. From
Norway, a total of 58 responses were received and in Sweden a total of 60 responses
were collected. In total 214 participants chose to partake in the survey. However, due
to the majority of the participants being students of engineering and technology the
decision was made to only analyze the results of those respondents as it would further
eliminate a factor that might affect the results, namely what program the students are
studying. The final number of participants can be seen in Table 1.
Norway Sweden India
Men 45 26 71
Women 9 21 17
Prefer not to say 0 0 3
T able 1: Num ber of participants.
Only three people chose the option “prefer not to say” when it came to gender. Those
answers cannot be included when comparing the differences between genders. The
ratio discrepancy between male and female students should not impact the results as
the results try to provide a fair picture of what the current differences are between the
students that partake in this study and not try to generalize beyond the population.
Furthermore, Gonzalez (2008) notes that no additional analysis or particular

21
procedure needs to be applied in a case were the unequal sample size has occurred by
accident, which is the case in this study.
5.2 Password reuse behaviour This section of the report aims to answer research question 1: What are the
differences between culture and gender when it comes to password reuse
behaviour?
To investigate the participant’s password reuse behaviour, two to different questions
were asked. The first question asked how often the participants reuse their password.
The reply alternatives for this question ranged from ‘1’ (“Never, I have unique
passwords for all my accounts”) to ‘5’ (“Always, I use the same password for all my
accounts”). Reply alternative 3 would mean that the participant would reuse
password for half of their accounts. The percentage and total number for each reply
alternative can be seen in Figure 1.
Figure: 1. How often the participants reuse passwords.
As seen in Figure 1, male students in India had a higher percentage for reply
alternative number 1 compared to the other particpants, indicating that its more
common for the male students in India to have unique passwords for all accounts.
The most common reply alternative across all groups except the female students in
India was number 4 which indicates that it is quite common to reuse passwords for
the majority of the user’s accounts but not for all. The male students in Norway and
the female students in Sweden were the only ones reporting that they did not reuse
passwords for all of their accounts.

22
Figure: 2. T he frequency of password re-use.
The mean and standard deviation were calculated for each of the groups. A lower
mean indicates that the participants do not reuse passwords for multiple accounts
whereas a mean of 5, which is the maximum, would indicate that the participants
would reuse passwords for all their accounts, e.g. they do not have any account with a
unique password. As seen in Figure 2 there is very little difference between both
gender and country. Female students in Norway reported re-using password slightly
more often than the other participants.
The standard deviation can be calculated for any instance where the mean can be
calculated and represents the dispersment within the data. A high standard deviation
indicates a large variance amongst the particpants answers whereas a low standard
deviation means that the particpants have answered roughly the same to a larger
extent. The standard deviation for each group can be seen in Table 2.
Norway Sweden India
Men 0.8 1 1
Women 0.9 0.9 0.8
T able 2: Standard deviation - How often passwords are reused.
The standard deviation shown in Table 2 show that the spread is fairly equal amongst
all of the participants with the standard deviation ranging from 0.8 to 1 across all
groups.
A two-way ANOVA (gender*country) was calculated to see whether or not the means
between gender and country had any statistical significant value. The result showed

23
that the p-value was larger than 0.05 for all cases, which means that no statistical
significance could be established when it comes to the reuse of passwords.
The second question in the survey regarding password reuse pertained to how many
accounts a password generally is used for. For instance, do the participants reuse a
certain password 2 times or 7 times. Figure 3 shows the mean of how many times a
password is used across different accounts.
Figure: 3. Average of number of tim es a password is reused for different accounts.
A higher mean value indicates that a password is reused for more accounts than a low
mean value. According to the data gathred and presented in Figure 3, there are some
differences between men and women in both Sweden and India, with less difference
in Norway. Women in Sweden reuses the same password most times across multiple
accounts with an average of 4.5 accounts for each password. The biggest difference
can be seen between women in Sweden and India where the average is considerably
lower for the female students in India with a mean of (M = 3.4). A two-way ANOVA
was calculated to investigate whether or not any statistical signifance could be
established for the results. The p-value was shown to be larger than 0.05 across all
groups which indicates that no statistical signifiance can be seen in the results. The
standard deviation was calculated to show the spread of the data within the sample
and can be seen in Table 3.
Norway Sweden India
Men 1.3 1.6 2.7
Women 2.3 2.0 1.0
T able 3: Standard deviation for password reuse frequency.

24
As seen in Table 3 the standard deviation is larger for men in India (SD = 2.7) than
any other group which indicate that some of the partcipants reused a password for
more accounts than the average for that country and gender. The group with the
lowest spred of data was women in India with a standard deviation of (SD = 1).
5.2.1 Summary of research question 1.
The conclusion of the results in regard to password reuse behaviour showed that
there is no reason to conclude that there are any differences between gender and
culture at large. Based on the participants having relatively close means for both
questions and that the two-way ANOVAs showed that the p-value was larger than
0.05 (which means no statistical significance) leads to the conclusion that there is no
difference when it comes to the users password reuse behaviour. There are some
previous studies that indicate that there might not be any difference between gender
and culture when it comes to password reuse and those articles are presented in the
related work section of this report and will be discussed at further length in the
discussion.
5.3 Length and complexity of passwords
This section of the results shows the data gathered to answer the research question
number 2: What are the differences in the length and complexity of passwords?
Figure: 4. T he average length of the longest password m easured in characters.
Shown in Figure 4 is the average length of the longest password the participants
reported using. Men in Norway had the longest password of all participants followed
by men in India and Sweden. The male students had longer passwords than women
across all countries. In Sweden, the difference in password length between men and
women were noticeably less than in both Norway and in India. The largest
discrepancy in length of passwords were shown in Norway between the men and

25
women where on average there was a 6.1 character difference in length for the longest
password used.
Norway Sweden India
Men 8.1 4.0 9
Women 1.9 3.6 2.6
T able 4: Standard deviation for the longest password.
As shown in Table 4 the standard deviation is higher in both Norway and India.
These two countries are also where the students reported having the longest
passwords. The higher standard deviations shown in Norway and India indicate that
some of the participants used passwords substantially longer that the mean. One
student in India reported having a 64 character password. In Sweden, the standard
deviation was closer between the genders than in any other country. Furthermore,
women both in Norway and India had considerably lower standard deviation
compared to the men.
A two-way ANOVA was conducted and showed that no statistical significance could
be established between countries since the p-value was larger than 0.05. However, for
the genders the p-value was lower than 0.05, thus indicating that there is a statistical
significance in password length between the genders. To further investigate this, a
one-way ANOVA was calculated for the male and female students in Norway since
they had the biggest difference in mean values out of all groups. The results of the
one-way ANOVA showed that the p-value was less than 0.05 thereby establishing a
statistical significance.
Figure: 5. Average length of shortest password.

26
The participants were also asked to estimate how long their shortest password was in
an open-ended question format.
Figure 5 represents the mean value of the length for the shortest password reported
by the participants.Compared to the results presented in Figure 4 there are less
differences between countries and gender when it comes to the average length of the
shortest password. The biggest difference can be seen in Norway between men and
women which is also the country that had the biggest difference in password length
when it came to the longest passwords.
Norway Sweden India
Men 3.2 2.4 3
Women 1.6 2.7 1.6
T able 5. Standard dev iation for average password length for the shortest passwords.
The two-way ANOVA showed no statistical significance between the genders or
countries in terms of the length of the shortest password as the p-value was larger
than 0.05 for all instances.
Figure: 6. How often number and/or sy mbols are put at the end of passwords.

27
One way of making a password more complex and secure is by adding numbers and
special symbols such as “@” in the password. As discussed earlier in the background
section of this report, there is a tendency for users to only use a small subset of
special symbols and also put them at the end of the passwords, thus creating a false
sense of increased security. The participants were asked, using a Likert scale, if they
tend to put numbers or special symbols at the end of their passwords. The scale
presented in the question ranged from 1 to 5 where 1 being “Never” and 5 “Always”.
As seen in Figure 6, the participants tend to lean towards reply alternative 4 and 5
more so than 1 and 2. The mean and standard deviation was calculated for all groups.
A higher mean indicates a tendency to put special symbols or numbers toward the
end of passwords.
The women in Norway had the highest mean with (M = 4) and a standard deviation
of (SD = 0.7) indicating that the data had a small spread from the mean. The same
group was the only group not to chose the reply alternative 1. The other groups were
relativley close in terms of the mean with men from India having a mean of (M = 3.7)
and (SD = 1.2) and the women having (M = 3.4) with a standard deviation of (SD =
1.2). The women in Sweden had a mean of (M = 3.6) and a standard deviation of (SD
= 1.1). The lowest average of all groups was the men from Sweden with a average of
(M = 3.2) with a standard deviation of (SD = 1.4) which indicate that the data was
somewhat spread out from the mean compared to the other groups.
A two-way ANOVA was performed and the results showed that the p-value was larger
than 0.05 thus no significant statistical difference could be concluded.
5.3.1 Summary of research question 2
When it comes to the length and complexity of the participants passwords, the only
difference that could be observed was in regard to the average length of the longest
password, where it was shown that there was a difference between the genders. The
longest passwords reported was by the male students in Norway with their female
counterparts reporting a significantly lower number of characters used in their
passwords. This was further investigated by a one-way ANOVA between the male and
females in Norway since they had the biggest difference in password length when it
came to the longest passwords reported. The same conclusion could not be drawn for
the length of the shortest password or how likely the participants were to put symbols
or numbers at the end of their passwords.

28
5.4 Native language used in passwords To answer research question number 3 “What are the differences when it comes to
the use of native language used in passwords?” a Likert scale with reply alternatives
ranging from 1-5 with 1 being “Never” to 5 being “I use native language in all my
passwords” was presented to the participants. Figure 7 shows how the participants
answered.
Figure: 7 . Native language used in passwords.
Figure 7 shows that the difference in native language used when creating passwords
is relatively small between the genders. However, there is a noticeable difference in
native language used by the students in Norway compared to the students in Sweden
and India. Male and female students in Norway had a higher rate of reply alternatives
in the range of 4-5 indicating that it is more common to use native language when
creating passwords.
The mean and standard deviation was calculated for each country and gender. A high
mean for this question corresponds to a more frequent use of native language in
password creation. The women in Norway had the highest mean of (M = 3.7) and (SD
= 1.4) followed by the men in Norway which had (M = 2.9) and (SD = 1.3) suggesting
that it is more common with native language for the students in Norway than the
other two countries. India and Sweden had lower means and less differences
compared to each other with the men in India having a (M = 1.9) and (SD =1.1),
whereas the female students in India had a mean which was slightly higher (M = 2)
and (SD = 1.2). Sweden had the lowest overall average with the men having a mean of
(M = 1.7) with a standard deviation of (SD = 1) and the women averaging (M = 1.6)
with a standard deviation of (SD = 0.8).

29
An analysis of the result from a two-way ANOVA showed that there was no statistical
significance between genders. However, between countries the p-value was less than
0.05 showing that there is a statistical significance to the results shown in Figure 7.
5.4.1 Summary of research question 3
The conclusion drawn from the results is that there is a difference when it comes to
native language used in password creation. Differences was observed between the
countries, students in Norway used native language in their passwords to a larger
extent than the other participants. The students in Sweden reported the least use of
native language out of all participants. No statistical significance could be established
between the genders indicating that culture has a bigger impact on the frequency of
native language used in passwords.
5.5 Meaningful words and passphrases This section aims to analyze the data gathered in regard to research question number
4 “What are the differences in the use of meaningful words or phrases in passwords
/ passphrases?”. The participants were asked two questions about their behaviour
when it came to the usage of meaningful words and passphrases. The first question
asked how often they use passphrases and the second one was in regard to the use of
meaningful words or phrases when creating passwords.
The participants were asked about how often they used passphrases with reply
alternatives ranging from 1 – “Never” to 5 “Always” with reply alternative 3
corresponding to passphrase use for half of the participant ’s passwords.
Figure: 8. How often the participants use passphrases.
Figure 8 shows that the participants leaned more heavily towards reply alternative 1
which suggest that the use of passphrases is farily uncommon amongst all the
students that partook in the study. The students in India were the only ones that

30
chose reply alternative 5 out of all particpants in the study.The mean and standard
deviation was calculated for all partcipants. The mean is shown in Figure 9.
Figure: 9. Average use of passphrases.
A lower value of the mean indicates a lower use of passphrases whereas a high mean
would indicate a more frequent use of passphrases. Figure 9 shows that the mean is
relatively close across both genders and countries with the only noticiable difference
being the female students in Norway which reported a less frequent use of
passphrases compared to the other groups. The mean was below 3 for all groups
indicating that passphrases are used less than 50% for all passwords. The standard
deviation for each group can be seen in Table 6.
Norway Sweden India
Men 1.2 1 1.3
Women 1 1 1.3
T able 6. Standard deviation for the use of passphrases.
To see if there were any statistical significance the mean values between and within
the groups were compared using a two-way ANOVA which showed that the p-value
was larger than 0.05 thus concluding there was no statistical significance between the
means.
The participants were asked what, if any, sort of meaningful words of phrases they
used when creating their passwords. The reply alternatives were “important dates”,
“Family members name”, “Locations”, “Lyrics”, “Celebrities”, “No” and “Other”.
Figure 10 shows the participants answers in regard to this question.

31
Figure: 10. Meaningful words or phrases used by the participants.
Male students in Norway had the biggest percentage of all groups answering “No”,
meaning that they use no meaningful words or phrases when creating passwords. A
total of 56% of all male students in Norway reported this. However, the female
students in Norway all chose that they use meaningful words when creating their
passwords with family and important dates being the most used, creating a large
discprency in the strategies implemented when creating passwords. Seen amongst all
female particiapnts is the higher percentage in using family members name when
creating passwords compared to their male counterparts. The least popular
alternative across all participants was “lyrics”.
Some of the particpants opted for using the other alternative and freely wrote an
answer of what they use, those answers are represented in the reply alternative
“other”, they were mostly different from each other except for fictional characters
which were reported a total of 3 times.
5.5.1 Summary of research question 4
When asked how often they used passphrases the participants reported a relatively
low mean across all groups indicating that passphrases are not commonly used when
creating passwords. No statistical significance could be established between the
groups indicating that the low use of passphrases reported is largely the same across
all groups.
The participants were also asked what kind of meaningful words or phrases they
used, if any, when creating their passwords. For these results no mean or standard
deviation can be calculated and therefore no ANOVA either. However, some
differences could still be observed. For instance, the male students in Norway were
more likely not to use any kind of meaningful words or phrases when creating their

32
passwords. Another difference that could be observed is that the female students in
all countries reported to a larger extent that they use family members name when
creating their passwords compared to the male students.
5.6 Attitude towards password policies To answer research question number 5 “What are the differences between culture
and gender in the attitude towards password policies? “ a series of questions were
presented to the participants. The questions and the data analyzed will be presented
in this section of the report.
The participants were asked how often they change their passwords by their own
choice. The reply alternatives were “Never”, “Every 6 month”, “Every year” and
“Other”.
Figure: 11. How often participants change password voluntarily.
As seen in Figure 11 the most common choice across all groups were “Never”
indicating that the majority of the respondents do not change their password on their
own accord. The male students in India and Norway had slightly fewer answers in the
“Never” category compared to all the other participants.
One of the things that can lead to users experiencing frustration and even in some
cases lead to bad passwords being created is when users are forced to change
password. The participants were asked to estimate their level of annoyance when
forced to change password, this was done using a Likert Scale. Figure 12 shows the
participants answers where reply alternative 1 corresponds to “Not annoying at all”
and 5 being “Very annoying”.

33
Figure: 12. Annoyance felt when forced to change password.
As seen in Figure 12, the answers are towards reply alternatives 4 and 5 rather than
reply alternatives 1 and 2, which suggest that the participants tend to agree with the
statement that being forced to change password can be seen as annoying. The mean
and standard deviation was calculated for each group.
The students in India had the highest mean, the female students had a mean of (M =
3.8) with a standard deviation of (SD = 1.2) and the males had a mean of (M=3.7)
with a standard deviation of (SD = 1.2). In Norway, the men had a mean of (M = 3.5)
with a standard deviation of (SD = 1.1) and the women had (M = 3.7) with (SD = 0.7).
The biggest difference when it came to means was between genders in Sweden were
the men had a mean of (M = 3.7) with a standard deviation of 1.2 and the females had
a mean of 3.2 with a standard deviation of 1.2.
The mean for each group was relatively close indicating that all participants had the
same feeling towards being forced to change passwords. A two-way ANOVA was
calculated to see whether or not there were any statistical significance to the mean
between the participants. The ANOVA returned a p-value larger than 0.05 thus no
statistical significance could be concluded.
The participants were also asked about the strategies they use when they are forced to
change password. To this close-ended question there were four alternatives: “Use an
old password”, “Use same password again with some variation”, “Yes” and “Other”.
Figure 13 displays their replies.

34
Figure: 13. Strategies used when forced to change password.
The most common choice across all groups, except for the male students in Sweden,
was to use the same password again but with some variation. The students in Sweden
chose the reply alternative “Use an old password” to larger extent than any of the
other countires. None of the female students in Norway chose to use a old password
when asked to change password, instead they chose to use the same password again
with some degree of variation.The reply alternatives for this question seem to
correspond well as the main strategies used amongst the student that partook in this
study since no one used the “Other” reply-alternative as their choice.
Figure: 14. Attitude towards feeling safe after changing password.
The participants were also asked to rate if they felt that that changing passwords
made them feel more secure than before. The reply alternatives ranged from 1 –

35
“Strongly disagree” to “Strongly agree”. Figure 14 represents the answers chosen by
the participants.
Reply alternatives 4-5 seem to be more common amongst the students than 1 -2 which
indicates that the students feel that changing passwords is a contributing factor to
feeling more secure. The mean and standard deviation was calculated for each group.
The group with the lowest mean (feeling less secure) was the female students in
Sweden with a mean of (M = 2.7) and a (SD = 1.2). The next lowest mean was the
males in Sweden and Norway both with a mean of (M = 3.0). The males in Sweden
however had a lower standard deviation with (SD = 1.2) compared to the males in
Norway which had a standard deviation of (SD = 1.5). The females in Norway had a
higher mean than their male counterparts with a mean of (M = 3.5) with a standard
deviation of (SD = 1.5). Men in India had the same mean as the females in Norway (M
= 3.5) but with a lower standard deviation (SD = 1.2). The female students in India
had the highest mean reported (M = 3.8). They also had the lowest standard
deviation reported across all groups with a standard deviation of (SD = 1).
A two-way ANOVA showed that the p-value was larger than 0.05 for gender, meaning
that no statistical significance could be seen amongst the male and female students.
However, the ANOVA also returned a p-value which was lower than 0.05 establishing
a statistical significance between the countries in terms of attitude towards feeling
safer after changing passwords. Students in Sweden reported to a lesser extent than
the other participants, that changing password made them feel more secure online.
Figure: 15. T he participants perceptions of what’s the hardest part of creating a password.
Password policies usually consist of rules dictating what a password should contain in
order to make the passwords safer. The participants were asked what they found to be
the most difficult requirement when creating a password. The reply alternatives were

36
“The requirement of special symbols”, “The requirements of numbers”, “The
requirements of uppercase letters”, “The requirements of minimum length”,
“Nothing” and “Other”. Figure 15 shows the participants answers.
The most common answer across all groups were “the requirement of special
symbols”. In Sweden and Norway, over 50% of the students replied that special
symbols were the most difficult requirement when creating passwords. In India,
however, this number were lower for both genders. Male students in Sweden and the
female students in Norway were the only ones that did not say that the minimum
length requirement when creating a password was a problem. Female students in
India had the lowest percentage for reply alternative “Nothing” compared to the other
groups. No one of the participants chose the “other” option.
The last question of the survey asked the participants to rank how they felt towards
password policies actually making them safer.
Figure: 16. Participants attitudes towards password polices m aking them safer.
The reply alternatives ranged from “Strongly disagree” to “Strongly agree” on a 5-
point Likert-scale.Figure 16 shows that the answers are pretty evenly distributed
amongst the genders within each country. Furthermore, the male students in India
and Norway were the only ones that reported that they did not agree at all with that
statement that password policies made them safer. However, those were in the
minority of those groups. The male and female students in Sweden had the highest
overall percent out of all the other groups when it came to choosing strongly agree
with the statement that password policies make them feel more secure. The mean and
standard deviation was calculated for each group and is shown in Figure 17.

37
Figure: 17 . Mean of attitude towards password policies m aking the students safer.
A high mean, with 5 being the highest, would equal agreement that the participants
think the use of password policies makes them more secure online. A lower mean
indicates that the participants feel less inclined to agree that password policies makes
them feel more secure. The lowest mean amongst all participants were the male
students from Norway which had a mean of (M = 3.2) and a standard deviation of
(1.2). Across all groups the male participants showed a lower mean compared to the
women. The standard deviation for each group can be seen in the Table 7.
Norway Sweden India
Men 1.2 1.2 1.2
Women 0.9 1.1 0.8
T able 7 . Standard deviation for attitude towards password policies making the
participants safer.
The standard deviation was lower for all the female students compared to all the male students. A low standard deviation shows that the data was close to the mean, suggesting that the female students felt the same sense of agreement towards the question compared to their male counterparts. No statistical significance when comparing the means between each group could be found when a two-way ANOVA was conducted. The ANOVA returned a p-value that was larger than 0.05 across all groups.
5.6.1 Summary of research question 5
The participants reported “the requirement of special symbols” as the hardest part of
creating passwords. This was the most common reply alternative for both countries

38
and gender. No ANOVA could be conducted for this question since it is not possible
to calculate mean or standard deviation for that question. However, since the overall
results of that particular question was fairly equal across all groups there is no
indication that there is any difference.
The students were also asked to estimate the level of annoyance they feel when forced
to change passwords. The mean was fairly equal across all groups and the ANOVA
showed that no statistical significance could be established, which indicates that the
groups felt the same level of annoyance when forced to change passwords. However,
when asked to rank if they felt that changing passwords made them safer, the results
varied more. The two-way ANOVA showed that a statistical significance could be
established between the countries. Concluding that the students in Sweden were less
likely to agree with the statement that changing password often makes you more
secure compared to the other groups.
The last question dealt with the statement that password policies aids in making the
user more secure. The two-way ANOVA showed that no statistical significance could
be established when comparing the mean thus suggesting that there are no grounds
to assume that there is a difference in attitude between the groups when it comes to
the statement that password policies makes users safer.

39
6 Discussion The aim of the research was to investigate and see if differences exists in regard to
password creation and behaviour when it comes to culture and gender. This was done
by conducting a survey with a quantitative research method as it’s foundation.
Furthermore, the methods used when analyzing the data was inspired by Petrie and
Merdenyan’s (2016) research where they were fully transparent with which statistical
tools and methods they used when conducing their research.
The works mentioned in the related work section of this report also support some of
the findings in this report. For instance, Haque et al. (2013) observed no difference in
the rate of which participants in different countries reused passwords, something that
was also concluded in this study. They also note that there was a difference between
the usage of meaningful words and phrases between the countries in their research
(Haque et al., 2013). However, some of the findings in this final year project are not
in accordance with some of the previous research. For example, Petrie and
Merdenyan (2016) concluded that women had longer passwords than men which is
the opposite of what this research shows. However, they also saw that women were
more likely to share their passwords and that family members were the most
common persons to share their passwords with, something that was also concluded in
this final year project.
It is important to note that the previous research (whether it reached the same
conclusions or not) were done in completely different countries compared to this
research meaning that differences in the results are very likely to occur. However, it is
quite clear that differences in password behaviour exists between gender and culture.
6.1 Handling of validity threat
When analyzing the data, several validity threats were considered such as fishing and
error rate which is kept to a minimum by being transparent with the results and
making sure to present the results that did not show any difference in password
behaviour.
The external validity for this research can be considered low. However, this is not due
to lack of participants but due to the sampling method used in this research. The non-
probability sampling method is commonly used when conducting surveys at school or
workplaces and since it was completely optional to take part in the study and the
participants for two of the universities were outside Sweden the aim was to get as
many responses as possible. This means that the results in this study cannot be
generalized beyond the scope of the participants. However, the results shown indicate
that there are differences which is also supported by the related work. The survey was
distributed in a best effort scenario with the goal of reaching as many participants as
possible.

40
When creating the questionnaire the validity threats described in appendix A were
taken into consideration. For instance, to minimize the threat of evaluation
apprehension the participants had to be completely anonymous. Another important
validity threat to the research was confounding constructs and levels of constructs
and to mitigate this threat it was important to explain certain terms to make sure that
the participants knew what they were asked.
A validity threat that could have been better handled is the threat of maturity. One
way of dealing with this would have been to end the questionnaire with a question
regarding if the participants have become more aware when it comes to password
behaviour.
6.2 Construction of questionnaire In hindsight when analyzing the data, some of the questions could have had better
structure and maybe even some follow up questions. Question 17 asks the
participants about their strategy used when forced to change password. One of the
reply alternative were “Use same password with some variation”. A follow-up
question could have been used to further investigate what the participants mean in
regard to “some variation”. Furthermore, the Likert scale items in the questionnaire
did not have any “other” or “not applicable” alternative which were presented as
reply-alternative questions for some of the other questions, which could have
improved the overall quality of the questionnaire. The first question of the
questionnaire asked how many passwords each user has, this question had an open-
ended answer since it was very unlikely that the participants would write anything
other than a number. However, some participants did write for example “Sixteen”
instead of 16 this had to be corrected manually in Excel and could have been
completely skipped by having a closed-ended question instead. However, this did not
necessarily make the questionnaire worse but it did create some extra manual work
that could have introduced errors in the results. This question was checked extra
carefully to see that no errors were made when translating the few answers that were
not a number.
In hindsight, the questionnaire could have been shortened by one question since
question 11 is a yes/no-answer question to the statement if the user has ever shared a
password and question 12 asks the participants to evaluate how often they share
passwords. If they answered that they have shared a password, in question 12, that
would automatically mean that they answered yes in the previous question. Another
solution would have been to only show question 12 for the participants that said yes
to question 11.
6.3 Reflections on general changes and improvements In hindsight, there are a few changes that could have been made to improve this final
year project. The questions regarding password sharing would have been better
suited as a research question which would replace the research question regarding

41
users attitude toward password polices. The reason for this is twofold, the first reason
is that upon viewing the results regarding password sharing it was apparent that they
were easier to interpret and the second reason is that it has a clearer connection to
security issues, even though users attitude toward password polices are also very
important. A research question pertaining to sharing of passwords is more in line
with the other questions and is easier to analyze and thus also easier to give a
concrete answer to.
Some of the studies mentioned in the related work section of this report investigated
user habits in regard to writing down passwords. This could have been done in this
study as well, which would have improved the ability to compare this study with other
similar studies that where conducted in different countries.

42
7 Conclusion The goal with this research was to investigate differences between gender and culture
when it comes to password creation and amongst students. Five research questions
were designed in order to give an answer to the problem formulation. The questions
are listed below.
1. What are the differences in password reuse behaviour?
2. What are the differences in the length and complexity of passwords?
3. What are the differences when it comes to the use of native language used in
passwords?
4. What are the differences in the use of meaningful words or phrases in passwords /
5. What are the differences between culture and gender in the attitude towards
password policies?
To answer these questions, a quantitative questionnaire was constructed and
distributed across three universities. The conclusion for each question can be seen in
section 5 in the report where the conclusion is presented after each question’s section
in chronological order.
The overall conclusion for this research is that some differences between gender and
culture did emerge. The analyzed results provide a fair picture of what the
participants’ behaviour is in regard to password creation and password behaviour as
well as their attitudes toward password policies. Some differences that were seen
were in regard to native language used when creating passwords, password length,
and how the participants perceived changing password as an act that made them
safer online.
The students in Norway were more likely to use native language when creating
passwords compared to the other groups. When it came to password length, a
difference could be seen with men having on average longer passwords than women
with men in Norway having the longest password on average.
The students in Sweden reported feeling safer when changing passwords compared to
other students. Furthermore, differences could also be seen in the use of meaningful
words when creating password were women across all countries had a higher
tendency to use family members name in their passwords.
There were also areas were the students did not have any noticeable difference. Some
of these areas include password reuse and the tendency to put special numbers or
symbols at the end of passwords.
Additional findings showed that users do not tend to use passphrases when creating
passwords, and that the students reported reusing passwords across multiple
accounts but still made sure to have unique passwords for more important services
such as online-banking.

43
This final year project set out to investigate what differences might exist in regard to
password creation, password behaviour, and attitudes towards password polices.
Presented in the results were some differences but also some areas where no
difference could be concluded. Although the results cannot be generalized beyond
this study’s population, the findings indicate that there are differences in password
behaviour between gender and countries which is also supported by the related work.
Why exactly these differences appear the way they do cannot be answered in this
report nor is it the goal of this report to do so.
By answering the research questions postulated in this report an answer to the
problem formulation has been given, namely, an overview of what the differences are
between gender and culture when it comes to password behaviour amongst the
students that partook in this study.

44
8 Future work In conducting the research for this final year project it seemed as this research area
was fairly small and new with the only papers found and used in the related work
section of this final year project just being a couple of years old. There is still much
that can be explored within this research area and this part of the report aims to
provide the reader with some insight into what might be good areas to keep
investigating and which might be suitable for future final year projects.
In the conclusion of this final year project some noticeable differences could be seen
when it comes to password behaviour between gender and countries. However, this
report does not try to explain why these differences exists. This could be done for
instance by qualitative method either by a survey or by conducting interviews
although it might be noted that this would probably be better suited for a program
with more focus on the humanities rather than the technological aspects. Another
possibility would be to examine the same factors but for other countries with the
same method and way of analyzing the data to see if there are any conclusion to be
drawn by comparing the research. The same type of research could also be done but
with other factors such as age or educational level rather than gender and country.
Another potential idea for future work could be to investigate what differences, if any,
might be present in other areas of computer security. Examples of this could be to
investigate differences in other authentication schemes, users perceived knowledge
about their own skills when it comes to computer security or security regarding
mobile device use. This type of research could also be extended to investigate if there
are any differences in perception and attitudes towards online privacy between
gender and culture.

45
9 Time plan Week Objective
7 Hand in problem formulation /
background for the seminar
8 Continued literature research for
methodology
Get in touch with possible universities.
9 Review previously written parts of the
report based on seminar feedback.
Begin with question construction of
questionnaire.
10-11 Start designing the questionnaire. And
start testing it before sending it out.
12-15 While waiting for results: review as
much as possible of the already written
report and start reading up on statistical
analysis.
16 Try to analyze the data gathered from
the questionnaire.
16 - Start writing the results, discussion and
future work.
19 Finish the report by the end of week 19
20-22 Proofreading and finalizing the report
23 Implementing feedback from the last
seminar
The biggest change to the time plan was that I got delayed for about one week after
the first seminar, where I got recommended to take an extra week to test the
questionnaire in order to find potential flaws, which turned out to be very helpful.
Furthermore, the time plan got delayed by another week when the distribution of the
questionnaire was delayed in France. The questionnaires were sent out to Norway,
India, Sweden, France and China as the participation might be very low for the
survey. This resulted in a remake of the questionnaire in SurveyMonkey since Google
Forms is not allowed in China, which caused additional delay.
Once the data was gathered and the surveys were closed I kept to the current and

46
updated time plan until I finished the report. The last update to the time plan was in
regard to week 23 which will be used to implement feedback from the last seminar
and further proofreading.

References Adams, A. & Sasse, M.A. (1999). Users are not the enemy. Communications of the
ACM, 42(12), pp. 40–46. DOI: 10.1145/322796.322806.
Bryant, K. & Campbell, J. (2006). User behaviours associated with password security
and management. Australasian Journal of Information Systems 14, 1: 81 - 100.
Cox, E. P. (1980). The optimal number of response alternatives for a scale: A review.
Journal of Marketing Research, 27, 407–422. DOI:10.2307/3150495
Betram, D. (2009). Likert Scales. Topic Report, The Faculty of Mathematics
University of Belgrad, 2009. DOI: 10.3127/ajis.v14i1.9
Das, A., Bonneau, J., Caesar, M., Borisov, N. & Wang., X. (2014). The Tangled Web of
Password Reuse. NDSS Symposium, Sand Diego, CA USA.
Egelman, S., Bonneau, J., Chiasson, S., Dittrich, D. & Schechter, S. (2012). It’s Not
Stealing If You Need It: A panel on the Ethics of Performing Research Using Public
Data of Illicit Origin. Financial Cryptography and Data Security. DOI: 10.1007/978-
3-642-34638-5_11
Florêncio, D. & Herley, C. (2007). A large-scale study of web password
habits. Proceedings of the 16th international conference on World Wide Web -
WWW ’07. DOI: 10.1145/1242572.1242661.
Fukumitsu, M., Hasegawa, S., Iwazaki, J., Sakai, M. & Takahashi, D. (2016). A
Proposal of a Password Manager Satisfying Security and Usability by Using the Secret
Sharing and a Personal Server. 2016 IEEE 30th International Conference on
Advanced Information Networking and Applications (AINA). DOI:
10.1109/aina.2016.45
Gonzalez, R, 2008. Data Analysis for Experimental Design. The Guildford Press.
Harbach, M., De Luca, A., Malkin, N. & Egelman, S. (2016). Keep on Lockin’ in the
Free World.
Proceedings of the 2016 CHI Conference on Human Factors in Computing Systems -
CHI '16.
DOI: 10.1145/2858036.2858273
Haque, T., Alam, T., Mamoon-Al-Rasheed. & Wright, M. (2013). Password
Construction and Management Strategies of the Online Users of Bangladesh: A
Demographic Comparison with the Users of the First-World Countries. Workshop on
Human and Technology. Kuhlna University.

48
Howard, A. & Hu, Y. (2012). An Approach for Detecting Malicious Keyloggers.
Proceedings of the 2012 Information Security Curriculum Development Conference
on - InfoSecCD '12. DOI: 10.1145/2390317.2390326
Inglesant, P.G. & Sasse, M.A. (2010). The true cost of unusable password
policies. Proceedings of the 28th international conference on Human factors in
computing systems - CHI ’10. DOI: 10.1145/1753326.1753384.
Ives, B., Walsh, K.R. & Schneider, H. (2004). The domino effect of password
reuse. Communications of the ACM, 47(4), pp. 75–78. DOI: 10.1145/975817.975820.
Mujeye, S. & Levy, Y. (2013). Complex passwords: How far is too far? The role of
cognitive load on employee productivity. Online Journal of Applied Knowledge
Management. ISBN: 2325-4688
John the Ripper password cracker. (2016). Retrieved from:
http://www.openwall.com/john/
Petrie, H. & Merdenyan, B. (2016). Cultural and gender differences in Password
behaviours. Proceedings of the 9th Nordic Conference on Human-Computer
Interaction - NordiCHI ’16. DOI: 10.1145/2971485.2971563.
Pinkas, B. & Sander, T. (2002). Securing Passwords Against Dictionary Attacks.
Proceedings of the 9th ACM conference on Computer and communications security
– CSS ’02. DOI: 10.1145/586110.586133
Robson, C. (2011). Real World Research. 3rd ed. Chichester: John Wiley & Sons.
Sawaya, Y., Sharif, M., Christin, N., Kubota, A., Nakarai, A. & Yamanda, A. (2017).
Self-Confidence Trumps Knowledge. Proceedings of the 2017 CHI Conference on
Human Factors in Computing Systems - CHI '17. DOI: 10.1145/3025453.3025926
Shay, R., Cranor, L.F., Komanduri, S., Durity, A.L., Huh, P.s., Mazurek, M.L., Segreti,
S.M., Ur, B., Bauer, L. & Christin, N. (2016). Designing Password policies for strength
and usability. ACM Transactions on Information and System Security , 18(4), pp. 1–
34. DOI: 10.1145/2891411
Stobert, E. & Biddle, R. (2014). The Password Life Cycle: User Behaviour in
Managing Passwords. Symposium on Usable Privacy and Security (SOUPS). Menlo
Park.
Tabachnick, G. & Fidell, L. (2006). Using Multivariate Statistics. Ally & Bacon, inc.
Needham Heights, MA, USA. ISBN: 0205459382
Taneski, V., Hericko, M. & Brumen, B. (2014). Password security – No change in 35
years? 37th International Convention on Information and Communication

49
Technology, Electronics and Microelectronics (MIPRO). DOI:
10.1109/mipro.2014.6859779
Trost, J. & Hultåker, O. (2016). Stora enkätboken. Studentlitteratur AB.
Wohlin, C., Runeson, P., Höst, M., Ohlsson, M. C., Regnell, B. & Wesslén, A. (2012).
Experimentation in software engineering. Berlin: Springer Science & Business Media.
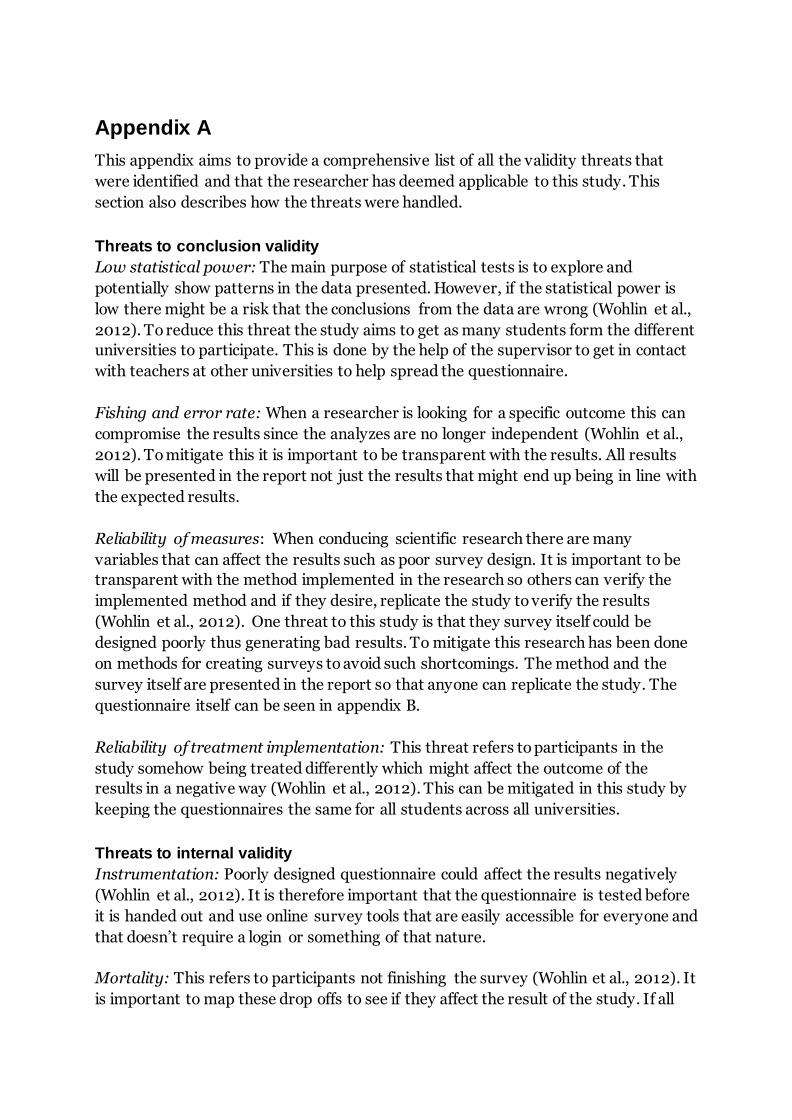
Appendix A
This appendix aims to provide a comprehensive list of all the validity threats that
were identified and that the researcher has deemed applicable to this study. This
section also describes how the threats were handled.
Threats to conclusion validity
Low statistical power: The main purpose of statistical tests is to explore and
potentially show patterns in the data presented. However, if the statistical power is
low there might be a risk that the conclusions from the data are wrong (Wohlin et al.,
2012). To reduce this threat the study aims to get as many students form the different
universities to participate. This is done by the help of the supervisor to get in contact
with teachers at other universities to help spread the questionnaire.
Fishing and error rate: When a researcher is looking for a specific outcome this can
compromise the results since the analyzes are no longer independent (Wohlin et al.,
2012). To mitigate this it is important to be transparent with the results. All results
will be presented in the report not just the results that might end up being in line with
the expected results.
Reliability of measures: When conducing scientific research there are many
variables that can affect the results such as poor survey design. It is important to be
transparent with the method implemented in the research so others can verify the
implemented method and if they desire, replicate the study to verify the results
(Wohlin et al., 2012). One threat to this study is that they survey itself could be
designed poorly thus generating bad results. To mitigate this research has been done
on methods for creating surveys to avoid such shortcomings. The method and the
survey itself are presented in the report so that anyone can replicate the study. The
questionnaire itself can be seen in appendix B.
Reliability of treatment implementation: This threat refers to participants in the
study somehow being treated differently which might affect the outcome of the
results in a negative way (Wohlin et al., 2012). This can be mitigated in this study by
keeping the questionnaires the same for all students across all universities.
Threats to internal validity
Instrumentation: Poorly designed questionnaire could affect the results negatively
(Wohlin et al., 2012). It is therefore important that the questionnaire is tested before
it is handed out and use online survey tools that are easily accessible for everyone and
that doesn’t require a login or something of that nature.
Mortality: This refers to participants not finishing the survey (Wohlin et al., 2012). It
is important to map these drop offs to see if they affect the result of the study. If all

males were drop off or not finish the questionnaire that would affect the results. This
has controlled when analyzing the data gathered form the questionnaire.
Threats to construct validity
Construct validity refers to how well a test measures what it is set out to measure.
(Wohlin et al., 2012). Listed below are potential threats identified to construct
validity of this study and how they are addressed.
Inadequate preoperational explication of constructs: Means that the theory, aim or
concepts of the study is not sufficiently defined which in turn can lead to bad
implementation of methods and thus leading to bad results (Wohlin et al., 2012). To
reduce this as much as possible it is important to do an extensive background
research around the subject at hand as well as research about methods that might be
applicable to this type of study.
Mono-method bias: This threat refers to the use of only a single method to obtain the
results which can be problematic since the method itself can have an impact on the
result (Wohlin et al., 2012). This threat cannot be handled in this study since a
quantitative survey is the only realistic option with the given timeframe for this final
year project.
Confounding constructs and levels of constructs: This relates to the user’s knowledge
about the subject (Wohlin et al., 2012). If the participants do not understand what the
survey or a specific question is referring to they might not be able to answer the
question. To mitigate this it is important to use simple language and explain certain
terms if deemed necessary.
Hypothesis guessing: This refers to when participants in a study figure out or try to
figure out what the purpose of the study is and changing their behaviour after the fact
(Wohlin et al., 2012). The best way to mitigate this is explain in the beginning of the
survey what this survey and the research is about.
Evaluation apprehension: In some cases the participants in a study can be afraid of
being evaluated. A common tendency in humans is to try to look better when
evaluated which can impact the conclusions drawn from the results (Wohlin et al.,
2012). To mitigate this threat, it will be made clear to the participants that they will
be completely anonymous and that there will be no way for the researcher or readers
of this report to trace the results back to them individually.
Experimenter expectancies: In some cases the researcher might be biased towards
the research which can impact the way they carry out the experiment or design the
survey both consciously and unconsciously (Wohlin et al., 2012). The risk for this
study is that the researcher is biased towards the expected results and thus

formulates the questions in such a way that is reflected in the results. The best way to
mitigate this is to have a test period for the survey.
Maturation: This threat refers to participants in the study behaving different during
the test due to for instance being bored which can affect the results in a survey
(Wohlin et al., 2012). To mitigate this the survey is kept short with a simple language.
Threats to external validity
Interaction of selection and treatment: Refers to the threat of using a population
other than what the aim indicates and thus the researcher won’t be able to generalize
the results (Wohlin et al., 2012). To mitigate this threat in this study it is important
that only students participate and not for instance teachers.
Interaction of setting and treatment: This threat refers to using the wrong tools or
tools that are out of date when conducting a research. (Wohlin et al., 2012). In this
study both Google Forms and SurveyGizmo was used since they are both known and
trusted survey tools.

Appendix B - Questionnaire

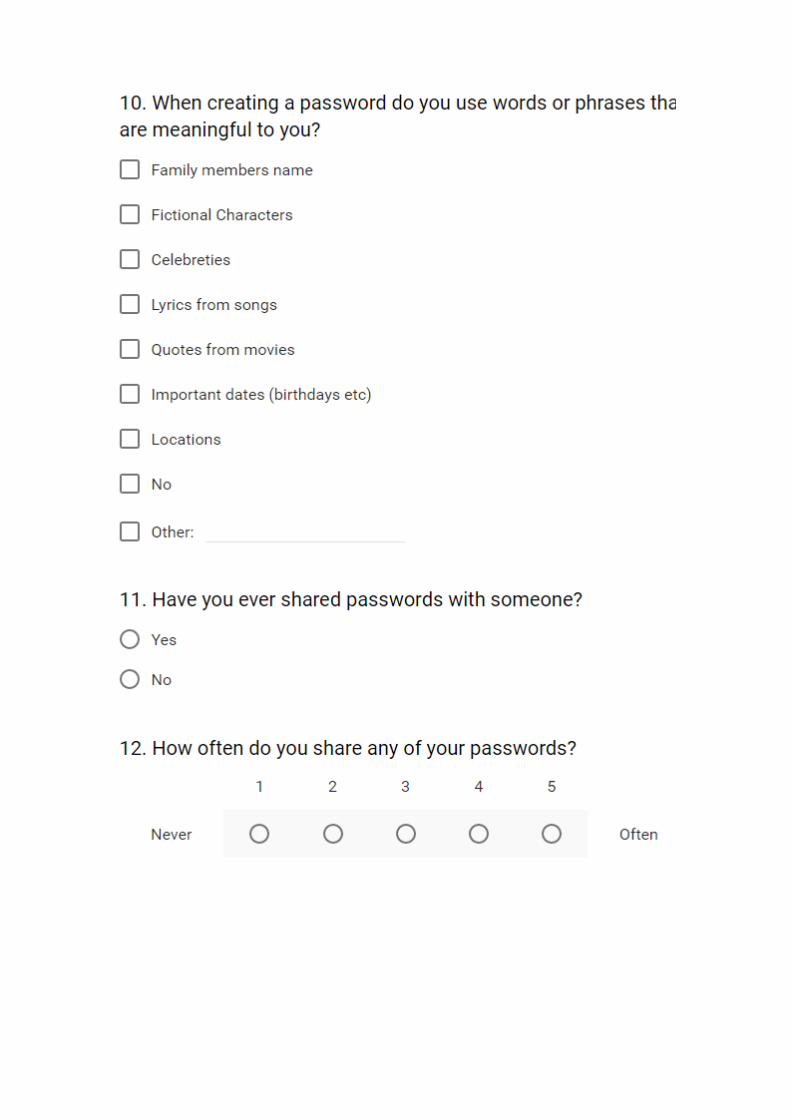


Appendix C – Results
The first questions in the survey served as warm up questions and did not relate directly to the research questions. Another set of questions were also asked that did not directly relate to the research question. The results of these questions will be presented in this appendix.
The participants were first asked how many passwords they have and how often they
type them each day. The result of the first question can be seen in figure 18.
Figure: 18. Average number of passwords.
As seen in the graph men in Norway had more passwords on average than any other
group. The largest discrapency was also seen in Norway between the male and female
students. Sweden had least difference between genders. The standard deviation for
each country and gender can be seen in table 8.
Men Women
Norway 13.3 2.8
Sweden 5.0 3.1
India 9.1 4.3
T able 8. Standard deviation for average number of passwords.
The men in Norway had on average the longest passwords but had also by far the
highest standard deviation meaning that some of the participants in Norway had
many more passwords compared to the other male students in Norway. The same can
be seen in India were the standard deviation for male students also was very high.

The participants were also asked to estimate how many times each day they use their
passwords, e.g. type them. The reply alternatives ranged from 1-3, 4-6, 7-9 and 9 or
more times per day. The results can be seen in Figure 19.
Figure: 19. Num ber of tim es passwords are used in a day .
The students in India chose 1-3 to a larger extent than the other groups. In Sweden it
was more common to choose the reply alternative “9 or more” times indicating that
the students in Sweden type their passwords more often than the other participants.
The largest differences are seen between the countries.
The participants were asked if they ever shared any of their passwords with someone
else.
Figure: 20. If participants share passwords or not .

Their responses can be seen in Figure 20. It is quite clear from the data that the
majority of participants has at some point shared a password with someone. India
had a lower overall percentage in the “yes” category compared the students in Sweden
and Norway. Overall the female students had a very slight higher percentage towards
the “yes” category compared to the men in their countries.
The participants were also asked to estimate how often they share passwords. This
was done by using a Likert-scale item with a range of 1-5 were 1 being “never” and 5
being “often”.
Figure: 21. How often participants share passwords.
Figure 21 shows the mean for each group. A high mean, with 5 being the highest
indicates that the users would share passwords very often were as a low mean with 1
being the lowest would indicate that they never share passwords. The common trend
across all groups is that it seems quite uncommon to share passwords and that
women have a higher mean in all countries compared to their male student
counterparts. A two-way ANOVA was setup and performed and showed that p < 0.05
for gender and thus showing that there is a statistical significance between the means
between the genders with the female students being more likely to share passwords
than the male students.

Figure: 22. Who users share their passwords with.
The participants were also asked with whom they had shared passwords with. Figure
22 shows their responses to the question. No noticeable difference can be seen
between the countries. Family members and friends are the two most represented
categories that the participants chose across all groups. The partner category was
edited when analyzing the results and is the combination of the responses that were
in the “other” category that mentioned girlfriend and boyfriend.