Embed Size (px)
Citation preview

Passive Sampling Techniques: Measuring Hydrophobic Organic Contaminants in
Sediment Porewater and Surface Water
Matt Lambert U.S. Environmental Protection Agency,
Office of Superfund Remediation and Technology Innovation,
Science Policy Branch
http://www.epa.gov/superfund/health/conmedia/sediment/index.htm
Talk Outline
I. Introduction
a) A CSM for sediment sites
b) Traditional vs Passive Sampling
c) Passive Sampling Fundamentals
II. Field Deployment & Laboratory Analysis
III. Benefits and Limitations of Passive Samplers
IV. A Superfund Case Study
5/7/2013 U.S. Environmental Protection Agency 2

5/7/2013 U.S. Environmental Protection Agency 3
Non-Point Sources
Channel
Precipitation
Historic Shoreline
Filling/Erosion
Point Sources
Groundwater
CSOs/ Storm Sewers/
Industrial Discharges
Atmospheric Deposition Volatilization
Surface Water
Mixing Layer
Burial
Advection/ Diffusion
Scour
Submerged Aquatic
Vegetation
Source Load
•Solids •Contaminants
–Particulate –Dissolved
•Other
Partitioning
Bioturbation
(BAZ)
Deeper Sediment
Export Load
Clams
Benthic Invertebrates Benthic Demersal Fish
Detritus/Algae/Plankton
Grass Shrimp
Forage Fish
Blue Crab
Predatory Fish
Birds Fisherman/ Recreator
Tributary Sources

Traditional Sampling
1. Bulk Sediment
Concentrations – Analysis is fast, simple, and
well established.
– Generally used to establish
Action Levels, Cleanup
Levels, etc.
– Poorly correlated with
sediment toxicity and
bioaccumulation tests or risk
exposure.
5/7/2013 4
2. Equilibrium Partitioning-
(fOCKOC) – Improved relationship to
toxicity and bioaccumulation
tests.
– Does not account for multiple
types of OC or competitive
sorption of DOC and other
contaminants.
– Literature values of KOC can
vary over 2 orders of
magnitude.

Traditional Sampling
3. Surface Water
– Requires large volumes of
water.
– Water must be filtered.
– Requires a correction for
the presence of dissolved
organic carbon (DOC).
5/7/2013 U.S. Environmental Protection Agency 5
4. Porewater
– Difficult to obtain
significant volume of
water.
– Water must be separated
from the sediment
particles.
– Requires a correction for
the presence of DOC.
Key Message: traditional sampling methods have logistical challenges,
high detection limits, and much uncertainty.

Types of Surface Water/Sediment Porewater Samplers
• For Hydrophobic Organic Contaminants (HOCs) – Solid-phase microextraction (SPME)
– Polyethylene (PE)
– Polyoxymethylene (POM)
– Ethylvinylacetate (EVA)
– Silicone Rubber (SR)
• For Metals – Peepers
– Diffusion Gel Thin Film Device (DGT)
– Gellyfish
– Metal-chelating media
5/7/2013 U.S. Environmental Protection Agency 6

SPME, PE, & POM
5/7/2013 U.S. Environmental Protection Agency 7
SPME
fiber-optic cable
Solid-phase
Microextraction

What information do you get from passive samplers?
5/7/2013 U.S. Environmental Protection Agency 8
1. The Freely Dissolved Concentration of the HOC
– It involves the following calculation (the partitioning coefficient must
be known):
Passive Sampler Sorbed
Concentration (CiPS) Freely Dissolved
Concentration (Ciw) Passive Sampler – Water
Partitioning Coefficient (KiPS)
=
Key Message: This method is more accurate than the traditional
methods, but it depends on having an accurate KiPS
value.

What information do you get from passive samplers? (cont.)
• “Biomimicry?” –
No, but…
5/7/2013 U.S. Environmental Protection Agency 9
102 103 104 105 106
10
2
10
3
1
04
10
5 1
06
Ob
serv
ed
T
issu
e
(µg
/kg
lip
id)
Predicted Tissue = Cfree x Kow
in oligochaetes
PCBs & PAHs
Lu et al (2011) ET&C 30, 1109-16.

5/7/2013 U.S. Environmental Protection Agency 10
PC
B C
on
cen
trati
on
in
Pass
ive S
am
ple
r
Time
(a) Deployment
0
(b) Uptake
(c) Equilibrium How does it work?

Time Averaged Sample
5/7/2013 U.S. Environmental Protection Agency 11
Dis
so
lved
Co
ncen
trati
on
(µ
g/L
)
Time (days)
Actual Concentration
0
Storm Event
Passive Sampler-Based Concentration

Cost Estimate for Different Types of Sampling
• Cost estimates provided courtesy of an independent
laboratory in dollars per sample
5/7/2013 U.S. Environmental Protection Agency 12
Type of Sample Materials
($)
Chemical
Analysis
($)
Total ($)
Water (5 L by conventional method) <5 525 530
Semi-permeable Membrane Device
(SPMD) 505 400 905
Polyethylene (PE) ~5 375 380
Polyoxymethylene (POM) ~50 375 425
Solid Phase Micro-extraction
(SPME) ~35 275 310

Deployment Methods: Surface Water
5/7/2013 U.S. Environmental Protection Agency 13
Water Depth: 8-15 ft 25 µm & 51 µm PEDs
~3 ft
~15 ft
YS
I S
on
de
Polyethylene Device (PED) Moorings

Deployment Methods: Sediment Porewater
5/7/2013 U.S. Environmental Protection Agency 14
Marker Line
Passive samplers (e.g., SPME) deployed in
stainless steel rod
Passive samplers (e.g., SPME) deployed in copper tubing
Passive samplers (e.g., PE or POM) deployed in aluminum frame
(NOT TO SCALE)
Buoy
Sediment Bed
POM
PE & Frame
SPME & Casing

Deployment Methods: Sediment Porewater (cont.)
5/7/2013 U.S. Environmental Protection Agency 15

Deployment Time
5/7/2013 U.S. Environmental Protection Agency 16
The time to equilibrium is affected by
1. the polymer thickness,
2. the temperature and salinity of the water,
3. advection of water adjacent to the polymer, and
4. algal growth (biofouling) on the sampler.
The sampler must be at equilibrium
in order to make accurate measurements
– Unless you know how “close” to equilibrium the sampler is
Deployment Time (cont.)
5/7/2013 U.S. Environmental Protection Agency 17
HO
C C
on
cen
trati
on
(ng
/mL
Passiv
e S
am
ple
r)
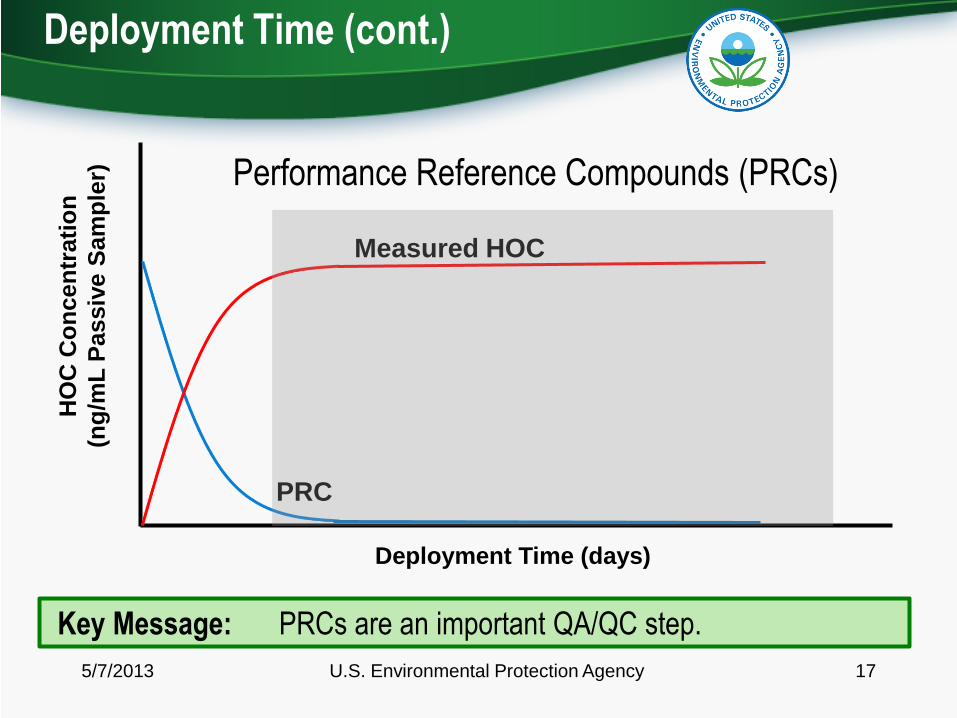
Measured HOC
PRC
Deployment Time (days)
Performance Reference Compounds (PRCs)
Key Message: PRCs are an important QA/QC step.

Sample Extraction and Analysis
5/7/2013 U.S. Environmental Protection Agency 18
• HOCs are typically extracted from passive samplers using solvents at
room temperature for 24 – 48 hrs
– Soxhlet Extractors or Accelerated Solvent Extractors are not necessary
– SPMEs can be inserted directly into a GC without any extraction or cleanup
– Fewer cleanup steps are necessary relative to sediment, water, or tissue
extractions
• Sample analysis uses the same methods as traditional samples
Key Message: Passive samplers generally use fewer chemicals and are
easier to prepare for analysis, making them a sustainable, green remediation
technology
Passive Sampling Method Limitations
5/7/2013 U.S. Environmental Protection Agency 19
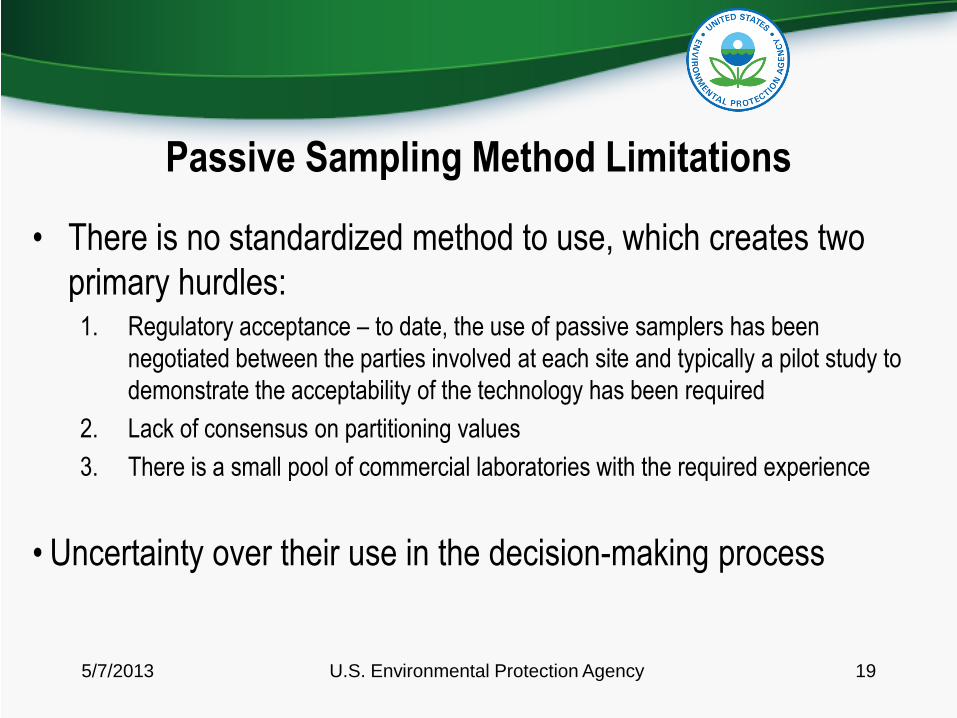
• There is no standardized method to use, which creates two
primary hurdles: 1. Regulatory acceptance – to date, the use of passive samplers has been
negotiated between the parties involved at each site and typically a pilot study to
demonstrate the acceptability of the technology has been required
2. Lack of consensus on partitioning values
3. There is a small pool of commercial laboratories with the required experience
• Uncertainty over their use in the decision-making process
5/7/2013 U.S. Environmental Protection Agency 20
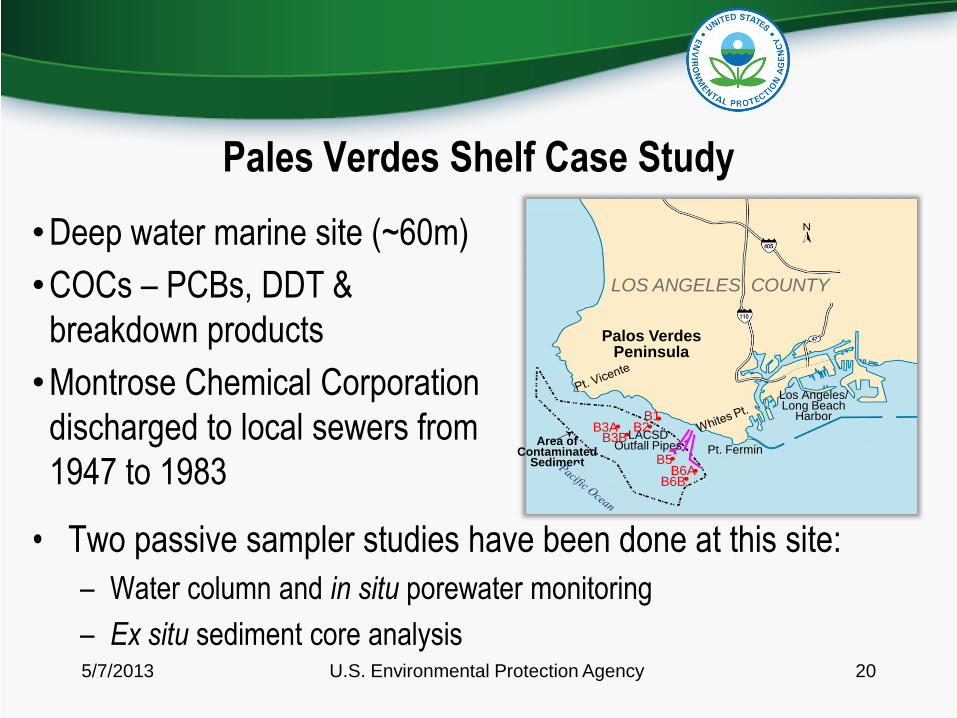
Pales Verdes Shelf Case Study
•Deep water marine site (~60m)
•COCs – PCBs, DDT &
breakdown products
•Montrose Chemical Corporation
discharged to local sewers from
1947 to 1983
• Two passive sampler studies have been done at this site:
– Water column and in situ porewater monitoring
– Ex situ sediment core analysis
LACSD Outfall Pipes Area of
Contaminated Sediment
Pt. Fermin
Los Angeles/ Long Beach
Harbor
Palos Verdes Peninsula
B6B
B3B
B5 B6A
B1 B2 B3A
LOS ANGELES COUNTY

Deployment of Monitoring Stations
5/7/2013 U.S. Environmental Protection Agency 21
Water Column – PEDs
(flow meter deployment)
Sediments – PEs & POMs
(flux platform deployment)

Sediment Monitoring
Platform in Place
5/7/2013 U.S. Environmental Protection Agency 22

PCBs Prior to Remediation
5/7/2013 U.S. Environmental Protection Agency 23
0
200
400
600
800
1000
B1 B2 B3A B3B B5 B6A B6B
Passive Sampler-based Total Dissolved PCBs versusAmbient Water Quality Criteria (AWQC)
(prior to remediation)
Human Health
AWQC
Co
ncen
trati
on
(p
g/L
, p
pQ
)
Station
Aquatic
Life
AWQC
30,000
60

In Situ Sediment Core Analysis: SPME
5/7/2013 U.S. Environmental Protection Agency 24
SPME fiber

In Situ Sediment Core Analysis (cont.): SPME
0
5
10
15
20
25
30
35
40
45
0 50 100 150
Sub
-bo
tto
m d
ep
th (
cm)
Estimated MU, o-E, p-E (ng/L)124B1-WC
p,p'-DDMU
o,p'-DDE
p,p'-DDE
MDL-MU
MDL-oE
MDL-pE
124B1sed
0
5
10
15
20
25
30
35
40
45
0 50 100 150
Sub
-bo
tto
m d
ep
th (
cm)
Estimated MU, o-E, p-E (ng/L)147B4-WC
p,p'-DDMU
o,p'-DDE
p,p'-DDE
MDL-MU
MDL-oE
MDL-pE
147B4sed

Lessons Learned- Perspectives from the
Principle Investigators and RPM
5/7/2013 U.S. Environmental Protection Agency 26
•PE, POM, & SPME are extremely sensitive
•In situ equilibration of PE & POM is feasible in deep water
•High spatial resolution in cores is possible because small size of SPME,
−but this small size resulted in higher detection limits (ppt in the SPME vs
ppq in the PE and POM)
•Relatively long equilibration times are required for HOCs; PRCs are necessary!
Key Message: Passive Sampling is an important tool being used at this
site to better understand the link between sediment concentrations and fish
tissue concentrations.

Take-Home Points –
5/7/2013 U.S. Environmental Protection Agency 27
• Passive sampling is a significant improvement over
traditional methods, though not a perfect method
a. Better detection limits, less sample variability
b. Better able to explain toxicity and bioaccumulation results
c. They’re cheaper
d. Long deployment times

Acknowledgements
5/7/2013 U.S. Environmental Protection Agency 28
•Dr. Rob Burgess – EPA, Office of Research and Development
•Dr. Bob Eganhouse – USGS Water Resources Division
•NAVFAC Alternative Restoration Technology Team (ARTT) Workgroup
•Judy Huang – RPM Palos Verdes Shelf
•Dr. Marc Greenberg – EPA, Office of Superfund Remediation and
Technology Innovation
•Steve Ells – EPA, Office of Superfund Remediation and Technology
Innovation