Embed Size (px)
Citation preview

Passive optical link budget for LEO space surveillance
Paul Wagner, Thomas Hasenohr, Daniel Hampf, Fabian Sproll, Leif Humbert, Jens Rodmann, Wolfgang Riede
German Aerospace Center, Institute of Technical Physics, Pfaffenwaldring 38-40, 70569 Stuttgart, Germany
Abstract The rising space debris population is becoming an increasing risk for space assets. Even objects with the size of 10mm can cause major damages to active spacecraft. Especially the orbits around 800km high are densely populated with space debris objects. To assess the risk of collisions with active satellites, the Earth orbits need to be surveyed permanently. Space debris laser ranging systems for example can deliver highly accurate positional data for precise orbit determination. Therefor a priori information about the objects coarse trajectory is needed. Such initial orbit information can be provided by wide angle optical sensors. The Institute of Technical Physics at the German Aerospace Center in Stuttgart runs an observatory to perform passive as well as laser optical measurements to LEO objects. In order to detect unknown objects, a wide-angle imaging system with a field of view in the range of 5° to 15° equipped with an astronomical CCD camera and a commercial off the shelf (COTS) lens was designed to continuously observe the night sky for LEO objects. This paper presents the passive optical link budget for observing LEO objects to show the benefits and limits of the physical performance of an optical surveillance system. A compact COTS system is able to detect objects with a couple of decimeters in size while a large aperture telescope can detect objects with diameters below 10cm. Additionally, data captured by a passive optical staring system with a 10 cm aperture was analyzed. It is shown that 90% of all objects with a radar cross section larger than 2m² are detected with such a system during twilight conditions. The smallest detected LEO object with this system has a size of 0.32m x 0.32m x 0.26m. These measurements are compared to the developed link budget which allows an estimation of the performance of larger systems.
1. INTRODUCTION Satellite laser ranging (SLR) is commonly used in geodesy to measure tectonic plate drifts etc. for over 50 years. The ILRS (International Laser Ranging Service) network contains 43 active stations and performs SLR routinely, [1]. The precise laser distance measurement is also very attractive for orbit determination which can be used for collision avoidance of space debris with active satellites for example. The increasing number of nano- and cube-sats leads to an increasing demand on space surveillance sensors in order to maintain highly accurate orbits. This variety of different SLR tasks requires a network of SLR stations. In order to perform laser ranging an accurate tracking of the satellites is required. Therefore highly accurate predictions of the satellite positions are used by the ILRS network. Unfortunately such highly accurate orbits are only available for a few satellites. In contrast, so called TLE (two line elements) predictions are accessible for about 17000 orbital objects. Since the typical accuracy of TLE based predictions are in the range of several 100 meters [2], the telescope used for ranging needs to perform an optical fine tracking. Therefore, sunlight reflected by the object is imaged on a camera to realize a closed loop tracking. The TLE data of LEO objects is mainly generated from radar sensors by the NORAD [8] and such a cost effective optical sensor can support such sensor network. To overcome the dependency on the preliminary orbit input of a narrow FOV telescope system, which can perform angular and time of flight (TOF) measurements, a wide angle passive optical system is used instead to deliver preliminary orbit information for a SLR system. The passive optical system measures apparent angular position of orbital objects with respect to the star background. Then a preliminary orbit is determined, this will be valid for a short time and for a close location only. However, it will allow a separate optical system to perform SLR to this object. In this paper is presented how we estimate and evaluate properties of such a passive optical system. The minimal achievable object size was evaluated for different passive optical configurations to extract general design rules of such a system. That is why we compare the link budget equation and the simulation (using ESA’s PROOF software).
Copyright © 2017 Advanced Maui Optical and Space Surveillance Technologies Conference (AMOS) – www.amostech.com

2. PASSIVE OPTICAL LINK BUDGET EQUATION The presented link budget equation is mainly based on the work from Shell et al. [1]. The resulting Signal-to-Noise ratio (SNR) equation is used to estimate the minimal detectable object size (diameter, d) of a given system.
∙
4 ′4
(1)
2.755 ∙ 10 ∙ ∙ ² ∙ 4
, ∙ ∙ 4 (2)
This formula was used for all the simulations presented in the following chapter. Assuming circular orbits, the angular velocity ω is the velocity of the RSO divided by the distance to the earth center. Whereas the velocity of the RSO is depending on the earth gravity, mass and the distance the earth center
6.674 ∙ 10³²∙ 5.972 ∙ 10
6371
6371
(3)
The background illumination Lb is given to,
2.3515 ∙ 10 10 . ∙
∙ ² ∙ (4)
Where, Mb is the background brightness in magnitude unit. The background brightness Mb with the sun 12 degree below the horizon is 19.5mag which reduces to 21mag or 22mag within the night. The photon flux ERSO where dobj is the diameter and ρ is the reflectivity of the object, ψ is the phase angle between observer and sun, and R the distance from the observer to the RSO,
2.755 ∙ 10 ∙ , ∙
∙ ² (5)
,4
23
sin cos (6)
This simplified model equation, allows some general statements about the different parameters and their optimal values to detect small objects. Furthermore suitable hardware properties can be suggested: Location and observation time:
As high as possible for better atmospheric transmission As remote as possible for lower background illumination As late as possible due to background illumination but RSOs need to be illuminated by the sun. Especially
in LEO objects are in the earth shadow during midnight depends on latitude.
Detector:
Copyright © 2017 Advanced Maui Optical and Space Surveillance Technologies Conference (AMOS) – www.amostech.com

The dark noise is minor on cooled detectors The read noise is minor compared to presence of background illumination. Quantum efficiency should be as high as possible Pixel size should be large as possible (but this results in a smaller angular resolution). In practice this follows a back illuminated CCD and using pixel binning is recommended.
RSO:
Properties cannot be controlled Objects with a small reflectivity are less likely to be discovered Objects in lower orbits are easier to detect Due to the random phase angle of space debris smaller RSO can be detected if you are “lucky” due to
specular reflections.
Optic: Transmission over the whole detection spectrum should be as high as possible. Thus anti reflective coatings
are recommended for refractive optics. On reflective optics the central obscuration should be as small as possible. The focal length should be small while the diameter should be large; if background illumination is large a
small focal length is not necessary. Note the size of the point spread function (of the optic) should be smaller than the pixel size.
Image processing:
The smaller the SNR the better is the performance. Thus the image processing should work reliable at bad SNR ratio.
3. PASSIVE OPTICAL LINK BUDGET SIMULATION
In the following table all parameters of the equation are listed including their typical values, if not otherwise stated these values are used for the graphs in the following chapter.
Parameter Value Description QE (eff.) 0.7 Quantum efficiency τoptic 0.4 Transmission of the optical system τatm 0.7 Transmission of the atmosphere doptic [m] 1 Diameter of the optical aperture ypix [µm] 15 Pixel size eread [e
-] 15 Read out noise of the image sensor f' [m] 2 Focal length of the optical system Mb [mag] 19.5 Background brightness SNR 6 Signal to noise ratioR [km] 800 Orbit height of the RSO ρspec, ρdiff 0.175 Specular and diffuse reflectivity of the RSO ψ 90° Phase angle between the RSO, the observer and the sun f# 2 f-number of the optical system t [s] 1 Exposure time
Table 1: List of parameters and their values used for the calculation of the passive link equation. For the SNR a conservative value of 6 is used which is sufficient to prevent any false detections of a simple image processing method. The reflectivity of typical space debris is 0.175 [3]. We typically use a 1s exposure for our observation in staring mode. The orbit height of 800km is of special interest because it is densely populated. The two main properties of an optical system are the diameter of the optical aperture, doptic and the focal length, f’ or the f-number (f# = f’/doptic). That is why we first simulate the dependence of these parameters on the detection
Copyright © 2017 Advanced Maui Optical and Space Surveillance Technologies Conference (AMOS) – www.amostech.com

threshold. The following graphs show the detection threshold according to equation (2) for two different background illuminations: nautical twilight with 19.5mag (Figure 1) and 22mag (Figure 2).
Figure 1: The detectable RSO size in 800km orbit height with a background illumination of 19.5mag for different
optical system diameters and f-numbers.
Figure 2: The detectable RSO size in 800km orbit height with a background illumination of 22mag for different
optical system diameters and f-numbers. Whereas a low f-number is beneficial in case of low background illumination, the effect is negligible for high background illuminations. For an optical system with 10cm aperture and an f-number of 2, which was used in the measurements presented in chapter 5, the detection threshold is 7cm with background illumination and 5cm without.
Copyright © 2017 Advanced Maui Optical and Space Surveillance Technologies Conference (AMOS) – www.amostech.com

Figure 3 shows the detectability of RSOs of different sizes as function of the orbit height and elevation. It can be seen that the optimal observation condition is zenith and the detection threshold drops on higher orbits as the RSO is farther away.
Figure 3: The detectable RSO with a background illumination of 19.5mag and an optical system with 0.1m in
diameter and an f-number of 2 for different elevations and orbit heights.
4. SENSOR PERFORMANCE SIMULATION USING ESA’S PROOF TOOL PROOF is a software tool developed by the University of Brunswick, Germany commissioned by ESA. It uses the European orbital population model MASTER and simulates an arbitrary population to verify the performance of an optical or radar sensor. The PROOF simulations use a much better optical model than the link budget equation. The optical model was developed by the University of Bern and was verified using actual observations. Due to the PROOF working principle it is only able to simulate a certain system during one specific observation. It is very difficult to estimate general system properties from these simulations. A lot of simulations need to be performed to get the data from a single system including a high amount of processing the data. The properties of all 7 systems used for the comparison are listed in Table 2. Further explanation about the method of how the Proof simulations were performed can be found in reference [3] and [4]. System 85mm
f1.2 135 mm f/2
200mm f2 Baker Nunn
1m f/1 800mm f/1
SST
Focal length [mm] 1000 2000 500 475 1000 800 3500 Aperture [mm] 1000 1000 700 500 1000 800 3500 F number 1.2 2 2 0.95 1 1 1.0 (1.4
eff) Image plane diameter [mm]
52 52 52 52 87 87 220
FOV [°] 35 22 15 6.3 5 6.2 3.6 camera FLI 16803 Andor iKon 231 SST Simulation period/duration
April/ sunset to sunrise
Line of sight (Alt/Az) 90°/0° Exposure time /gap time between frames
1s/4s
location central Europe Table 2: Properties of the optical systems used for proof simulations presented in Figure 4 and Figure 5.
Copyright © 2017 Advanced Maui Optical and Space Surveillance Technologies Conference (AMOS) – www.amostech.com

Whereas COTS lenses are presented in Figure 4, the performance of large telescopes is visualized in Figure 5. Those graphs show the detection efficiency depending on the RSO diameter. The detection efficiency is the ratio of the detected object to the objects crossing the FOV of the system. This gives an overview of how good the system can detect certain object size. Note that the maximum detection efficiency does not reach one due to high background illumination during dusk and dawn. Figure 4 shows three sample COTS lenses and their system detection efficiencies according to PROOF simulations. A larger aperture diameter results in higher detection efficiency for small objects. This is in agreement with the link budget equation. However, the detection threshold extracted from PROOF simulations is much higher than the values estimated with the link budget.
Figure 4: Detection efficiency according to PROOF simulations of selected COTS lenses equipped with a FLI
camera. The same dependence of the detection efficiency on the aperture diameter can be seen in Figure 5. In this graph, the PROOF simulation results of two existing reflective telescopes (A Baker-Nunn located in Spain and the Air Force Space Surveillance telescope SST) and two fictive systems are presented.
0
10
20
30
40
50
0.1 1 10
Det
ecti
on e
ffic
ien
cy [
%]
RSO diameter [m]
Detection efficiency
85mm f1.2 135mm f2 200mm f2
Copyright © 2017 Advanced Maui Optical and Space Surveillance Technologies Conference (AMOS) – www.amostech.com

Figure 5: Detection efficiency according to PROOF simulations of selected systems which are able to detect objects
below 10cm in diameter. According to the simulations RSOs smaller than 10cm can be detected with these optical systems. However, the detection efficiency is fairly low even with the SST. Those graphs only show the amount of detected objects by the system over the objects which crossing the FOV. However, as longer the focal length becomes as smaller gets the FOV. Besides the detection efficiency, the absolute number of detections in a certain time is of interest. This detection rate is shown as cumulated quantity in Figure 6 as a function of the object size for different optical systems. In this simulation all systems using the same image sensor.
0
25
50
0.01 0.1 1 10
Det
ecti
on e
ffic
ien
cy [
%]
RSO diameter [m]
Detection efficiency
1m f/1 800mm f/1 Baker Nunn (475mm f/0.95) SST (3490mm f/1.2)
Copyright © 2017 Advanced Maui Optical and Space Surveillance Technologies Conference (AMOS) – www.amostech.com
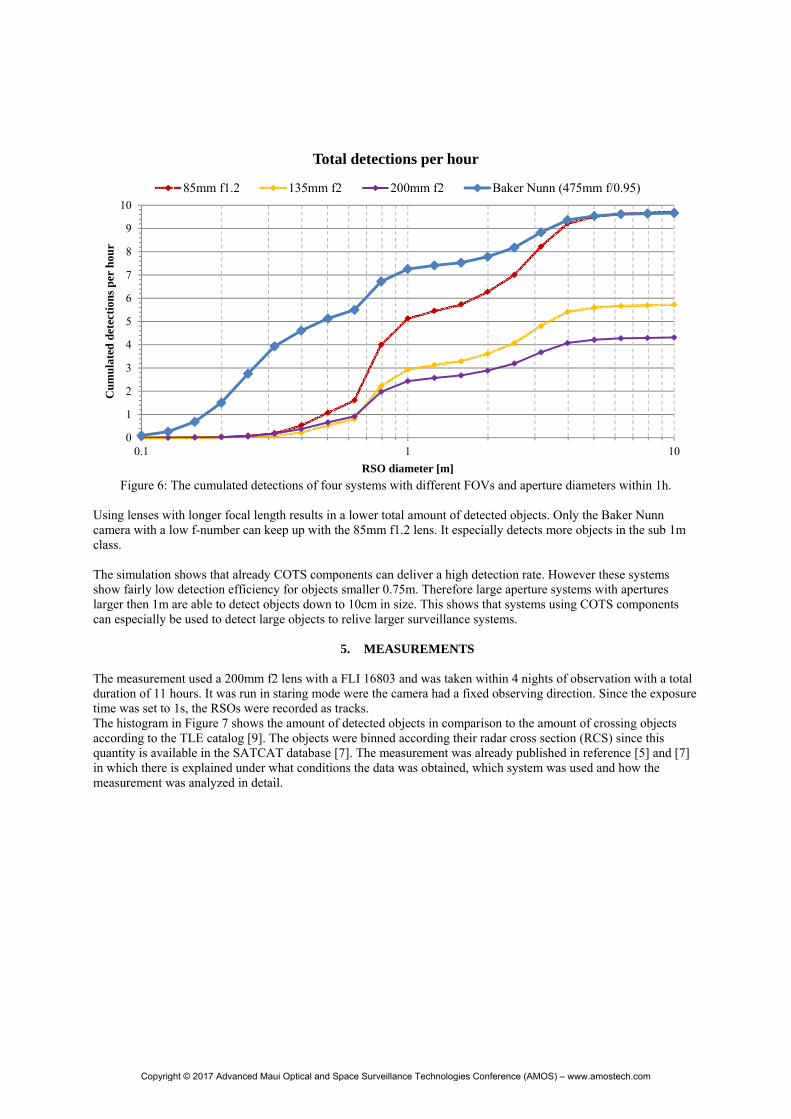
Figure 6: The cumulated detections of four systems with different FOVs and aperture diameters within 1h.
Using lenses with longer focal length results in a lower total amount of detected objects. Only the Baker Nunn camera with a low f-number can keep up with the 85mm f1.2 lens. It especially detects more objects in the sub 1m class. The simulation shows that already COTS components can deliver a high detection rate. However these systems show fairly low detection efficiency for objects smaller 0.75m. Therefore large aperture systems with apertures larger then 1m are able to detect objects down to 10cm in size. This shows that systems using COTS components can especially be used to detect large objects to relive larger surveillance systems.
5. MEASUREMENTS The measurement used a 200mm f2 lens with a FLI 16803 and was taken within 4 nights of observation with a total duration of 11 hours. It was run in staring mode were the camera had a fixed observing direction. Since the exposure time was set to 1s, the RSOs were recorded as tracks. The histogram in Figure 7 shows the amount of detected objects in comparison to the amount of crossing objects according to the TLE catalog [9]. The objects were binned according their radar cross section (RCS) since this quantity is available in the SATCAT database [7]. The measurement was already published in reference [5] and [7] in which there is explained under what conditions the data was obtained, which system was used and how the measurement was analyzed in detail.
0
1
2
3
4
5
6
7
8
9
10
0.1 1 10
Cum
ula
ted
det
ecti
ons
per
hou
r
RSO diameter [m]
Total detections per hour
85mm f1.2 135mm f2 200mm f2 Baker Nunn (475mm f/0.95)
Copyright © 2017 Advanced Maui Optical and Space Surveillance Technologies Conference (AMOS) – www.amostech.com

Figure 7: Detected objects of the staring system (FLI PL16803 camera & 200mm f2 lens) and theoretical FOV
passes, based on TLE data as function of the radar cross section (top) and resulting detection efficiency (bottom).
Further analyses were performed of the detected RSOs with a RCS smaller than 2.5m² to determine their actual size. Using the ESA’s DISCOS catalog [11] we were able to identify most of those objects with their actual physical size. Figure 8 shows a histogram of the number of detected objects and their size in comparison to the simulated detection rate for the same system.
Figure 8: Detected objects during 11h of observation using a staring system (FLI PL16803 camera & 200mm f/2 lens) as a function of the object diameter, according to ESA’s DISCOS catalog (left). And the simulated detection
rate as a function of object diameter using PROOF simulation tool of passive optical system with a 20mm lens and a FLI camera (right).
The smallest object we could identify was the satellite EduSat by University of Roma with a size of 32cm x 32cm x 26cm in 650km orbit height. The low statistics were a result of firstly: only 75% of all detected objects could be identified using the TLE catalog and secondly: we were not able to identify the physical size of all objects with the DISCOS catalog. The number of detected object is in agreement with the simulation made by PROOF. In total 135 TLE objects were found during the 11h of observation. This is more than the PROOF simulation estimated with 4.32 objects per hour. However, the measurement showed less detections then the simulation for objects smaller than 0.75m. Only one object was detected which was smaller than 0.8m.
0.00
0.50
1.00
1.50
0.1 1 10
Det
ecti
ons
per
hou
r
Size [m]
Simulated detection rate
200mm f2
Copyright © 2017 Advanced Maui Optical and Space Surveillance Technologies Conference (AMOS) – www.amostech.com

6. DISCUSSION For our system with a 200mm f2 lens and a FLI camera, the measured detection threshold was 0.3m. The PROOF simulation estimated a detection threshold of 0.3m. The estimated detection threshold of an RSO calculated by the link budget equation is about an order of magnitude smaller than the measurement. The link budget estimated that a 200mm f2 optical system can detect objects down to 7cm. The PROOF simulation proved to be a better tool to investigate the performance of a passive optical system. It estimated a detection threshold of 30cm, see Figure 4. Furthermore, PROOF simulations give a better understanding about total amount of detected objects and the detection efficiency. The equation instead shows nicely which optical parameters should be tuned and which are actually relevant for the detection of small RSO using an optical system. On comparison between equation and simulation we always see a difference of one magnitude. Thus the equation can be used to estimate the relative performance. Note that the simulation assumes that all the light of the RSO is focused onto the pixel, this could explain the difference.
7. CONCLUSION It was shown that a system with a 10cm aperture was able to detect objects below half a meter in size. And the simulation showed that an optical system, using an aperture of 1m can detect RSOs in LEO with 10cm in diameter. The Link Budget proofed to be too simplified to fit realistic results. Therefore a different more realistic model needs to be used. Thus, the simulation tool PROOF which uses a complex object, atmosphere and sensor model showed realistic results.
8. ACKNOWLEDGEMENTS We gratefully acknowledge the support provided by BAAINBw (Federal Office of Bundeswehr Equipment, Information Technology and In-Service Support)
9. REFERENCES 1. ILRS Website, https://ilrs.cddis.eosdis.nasa.gov/index.html 2. Assessment and Categorization of TLE Orbit Errors for the US SSN Catalogue, Tim Flohrer, (2008)
AMOS 3. Optimizing orbital debris monitoring with optical telescopes, James R. Shell, (2010) AMOS 4. Detection and laser ranging of orbital objects using optical methods, Paul Wagner et al., (09.2016), SPIE
Optical Engineering and Applications - Remote Sensing System Engineering VI
5. “Initial Detection and Tracking of Objects in Low Earth Orbit”, Thomas Hasenohr, (2016), Master thesis
6. “Passive optical space surveillance system for initial LEO object detection” Paul Wagner et al., (2015) In Proceedings of 66th International Astronautical Conference, Jerusalem, Israel
7. “Initial detection of low earth orbit objects through passive optical wide angle imaging systmes”, Thomas Hasenohr et. al. (2016), DLRK,
8. Space Surveillance Telescope: focus and alignment of a three mirror telescope, Deborah Freedman Woods, (2013) SPIE Optical Engineering
9. NORAD TLE Data; https://celestrak.com/NORAD/elements/
10. SATCAT Database; https://celestrak.com/pub/satcat.txt
11. ESA DISCOS catalog; https://discosweb-api.sdo.esoc.esa.int/
Copyright © 2017 Advanced Maui Optical and Space Surveillance Technologies Conference (AMOS) – www.amostech.com