Embed Size (px)
DESCRIPTION
Passive acoustic detection of right, fin and humpback whales in the eastern Bering Sea. David K. Mellinger 1,2 , Kate Stafford 3 , Sue E. Moore 2 , Sharon L. Nieukirk 1,2 , Sara L. Heimlich 1,2 , Phyllis J. Stabeno 2. 1 Oregon State University - PowerPoint PPT Presentation
Citation preview

Passive acoustic detection of right, fin and humpback whales in the eastern Bering Sea
David K. Mellinger1,2, Kate Stafford3, Sue E. Moore2, Sharon L. Nieukirk1,2, Sara L. Heimlich1,2, Phyllis J. Stabeno2
1 Oregon State University
2 NOAA Pacific Marine Environmental Laboratory
3 University of Washington
UW

Background• Little is known about year-round occurrence of large cetaceans in
the Bering Sea• Why do we care?
> ecologists: most are top predators> managers: some are endangered species> social scientists: some are culturally vital
• We focus here on three species:> right whale – highly endangered> fin whale – very common, ecologically important> humpback whale – also common, ecologically important
• This talk is on data analysis

Overview• Background
> passive acoustics> study area
• Right whale detection• Fin whale detection• Humpback whale detection• Conclusion
> future work

Overview• Background
> passive acoustics> study area
• Right whale detection• Fin whale detection• Humpback whale detection• Conclusion
> future work

Survey method• Passive acoustics is a good approach for long-term surveys
> “passive” means just listening, not emitting sonar sounds> we can distinguish baleen whale and seal sounds> not limited by weather, time of day or year, sea state, etc.
• Seafloor instruments can record sound continuously for more than one year> continuous monitoring with only one instrument turnaround per year> relatively low cost

Bering Sea survey• Passive acoustic survey conducted in 2006-07
> also in 2007 and later, but only the first year is covered here
• Three sites in southeastern Bering Sea> locations of PMEL’s (Phyllis Stabeno’s) long-term oceanographic moorings
M2, M4, M5> these moorings made this
project possible

Piles of data• What do we do with three instrument-years (390 GBytes) of
recordings?> potentially millions of whale calls
• Answer: automate the first stage(s) of analysis> detect calls of the three species
right
humpback
fin

Overview• Background
> passive acoustics> study area
• Right whale detection• Fin whale detection• Humpback whale detection• Conclusion
> future work

Detecting right whale calls• Right whale (Eubalaena japonica)
> very rare species; perhaps 25 in the eastern Bering Sea population
• Right whale ‘up’ call> common call, believed to be a contact call> made by both males and females> fairly stereotyped – calls are similar, but not exactly alike
• Detection method: spectrogram correlation> synthetic kernel correlated with normalized spectrogram> kernel is designed to reject interfering noise> kernel parameters were measured from a small number of calls

Detecting right whale up calls
* =
detection threshold

Detection, continued• For a rare species like the right whale, want to use a low
detection threshold > prevents missing too many calls> but results in many wrong detections
• Check the detections> aural inspection (listening) plus visual inspection of spectrograms
> diagram of keeping 1, tossing 3 calls

• 151 total hours with calls, mostly in summer/fall 2006> none at M5
Results: right whale detection
ho
urs
/day
wit
h c
all
s
2006 2007
M5: Ø
Right whale calling

Overview• Background
> passive acoustics> study area
• Right whale detection• Fin whale detection• Humpback whale detection• Conclusion
> future work

Detecting fin whale calls• Fin whale (Balaenoptera physalus)
> common species, heard nearly continuously in late summer and early fall> hundreds of thousands of calls
• Calls are not as stereotyped> frequency varies from one call to the next> bandwidth varies from one call to the next
• There can be a lot of noise in their frequency band

Detecting fin whale calls• Detection method: Don’t count calls; just measure sound energy in
their frequency band• Have to eliminate energy from other noise sources in the band• Use a noise-corrected estimate of energy
> correction factor comes from adjacent frequency bands
1
0
),()(f
f
ftStE
)(
)()(
80 tE
tEtD
)(80 tE80th-percentile valuein ‘guard’ frequency
range g0 – g1
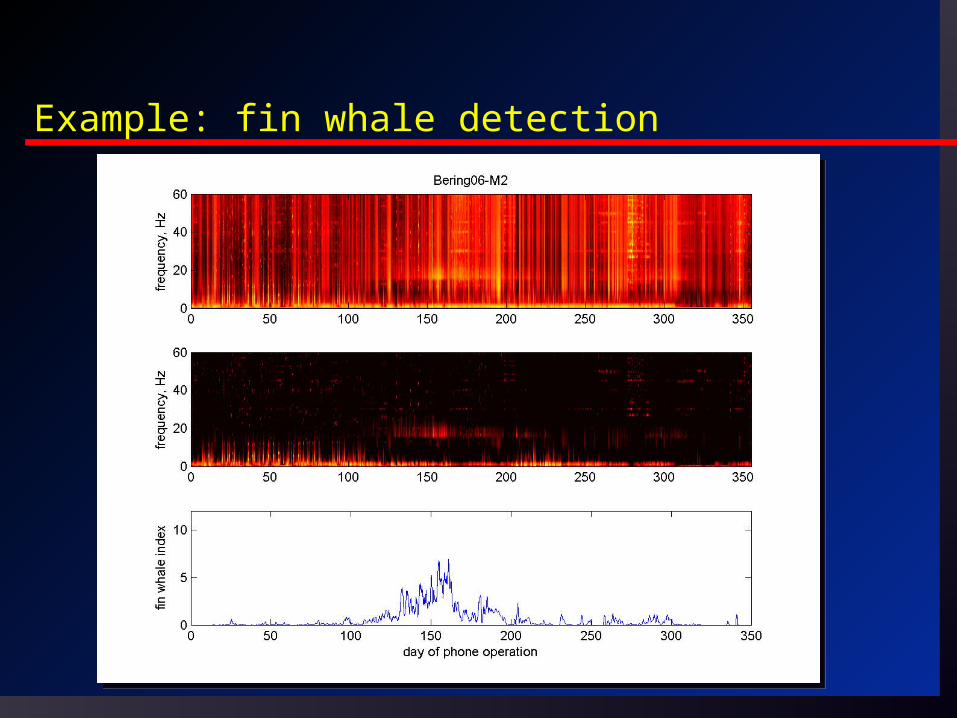
Example: fin whale detection

Results: fin whale detection
BS-M5
BS-M4
BS-M2

Overview• Background
> passive acoustics> study area
• Right whale detection• Fin whale detection• Humpback whale detection• Conclusion
> future work
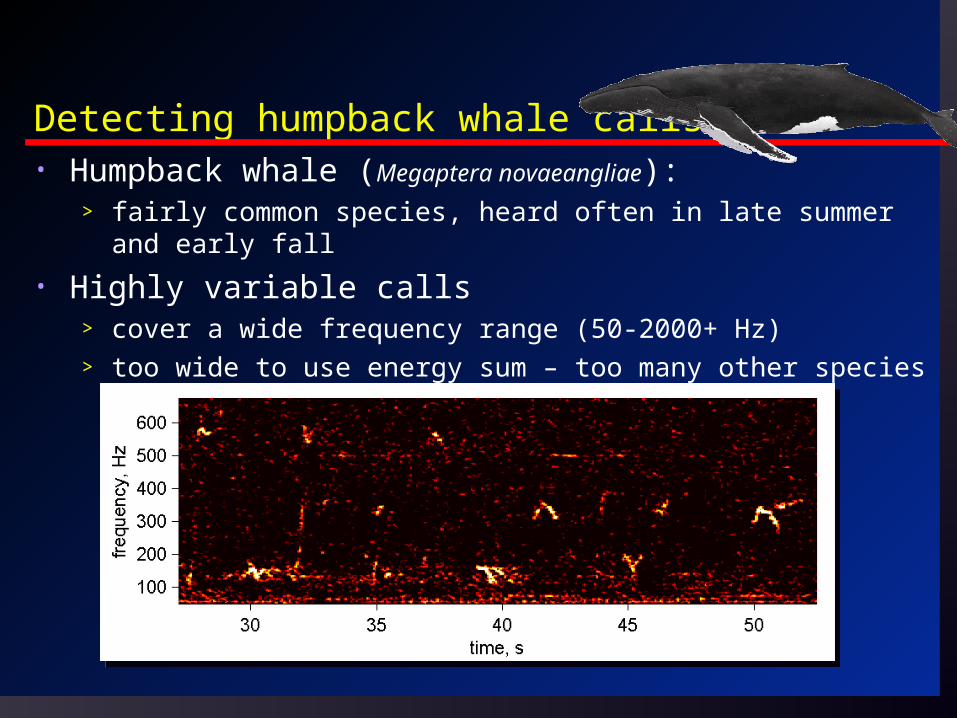
Detecting humpback whale calls• Humpback whale (Megaptera novaeangliae):
> fairly common species, heard often in late summer and early fall
• Highly variable calls> cover a wide frequency range (50-2000+ Hz)> too wide to use energy sum – too many other species present in the band

Detecting humpback whale calls• Detection method: Find all “moans” (tone-like) sounds in a limited
frequency range> can use an algorithm originally developed for dolphin whistles
• Check detection accuracy manually (work in progress)> estimate the false-detection rate and the missed-call rate

Results: humpback whale detections• Results shown for times when no ice was present
> prevents bearded seal interferenceM5
M4
M2

Overview• Background
> passive acoustics> study area
• Right whale detection• Fin whale detection• Humpback whale detection• Conclusion
> future work
Conclusions• Passive acoustics works for detecting these three species
> different call-detection methods needed for each species> sometimes need correction factors
• But there are limitations> animals must call to be heard> we get an index of occurrence
- would be nice to relate this to spatial whale density
- this is especially difficult for summer baleen whales
• Good to have year-round data (over several years) on these top predators

• Develop correction factors for humpbacks> measure wrong-detection rate and missed-call rate in each month> correct the detection curves using these factors
• Check fin call index> do we need correction factors for fins too?
• Detect right whale “gunshot” vocalizations, other species
What’s next?

• Understand the results: relate inter-mooring differences in whale occurrence to physical (temperature, ice, currents) and biological (chl a, zooplankton, etc.) data > develop predictive models
- see talk by Stabeno et al.,
poster by Stafford et al.
What’s next?
in-situ tempM5M4M2
% ice
chl a
satellite surface temperature
The End
• Thanks to NPRB (#518 and #719) and the Office of Naval Research for funding
• Thanks to Haru Matsumoto, Bob Dziak, and PMEL’s mooring shop for assistance designing, building, and deploying hydrophone instruments
• Thanks to Susan Parks for assistance with right whale calls