Embed Size (px)
Citation preview

C.-P. YuanMichigan State University
Parton Distributions at High Energy Colliders
In collaboration with CTEQ-TEA
Workshop of IASThe Future of High Energy Physics
HKUST, Hong Kong
Jan 26, 2105
CTEQ-TEA group
CTEQ – Tung et al. (TEA) in memory of Prof. Wu-Ki Tung, who
established CTEQ Collaboration in early 90’s
Current members:Sayipjamal Dulat (Xinjiang Univ.)Tie-Jiun Hou (Academia Sinica, Taipei)Southern Methodist Univ. -- Pavel Nadolsky, Jun Gao, Marco GuzziMichigan State Univ. -- Joey Huston, Jon Pumplin, Dan Stump, Carl Schmidt, CPY

Parton Distribution Functions
Needed for making theoretical calculations to compare with
experimental data


Outline
5
1) CT10 NLO/NNLO PDFs review and update Gao et al, PRD 89, 033009 (2014)
2) Update of Intrinsic Charm Analysis Dulat et al, PRD 89, 073004 (2014)
4) Lagrange Multiplier (LM) Uncertainty Analysis on gg->H Dulat et al, arXiv:1309.0025[hep-ph]
5) Lagrange Multiplier (LM) Uncertainty Analysis on gg-> t tbar
6) QED effects in parton evolution and Photon PDFs
7) PDF Benchmarking
8) PDFs for Future Hadron Collider
CT10 NNLO PDFsand
Beyond
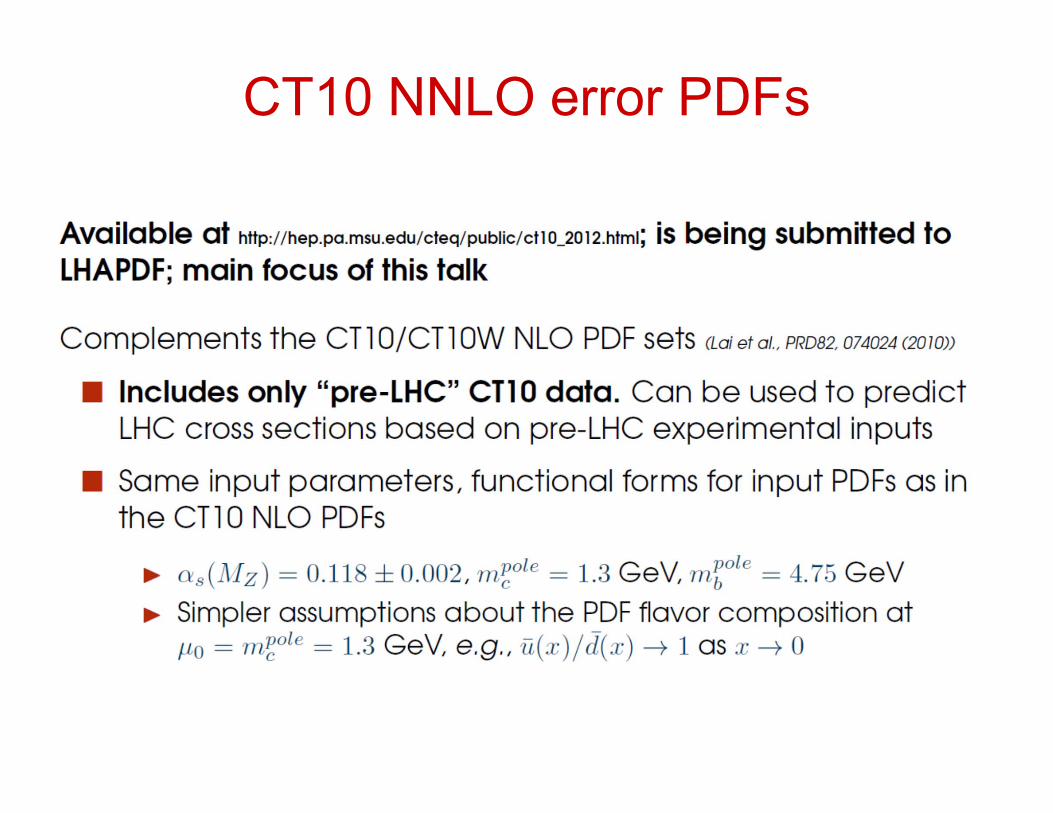
CT10 NNLO error PDFs
8

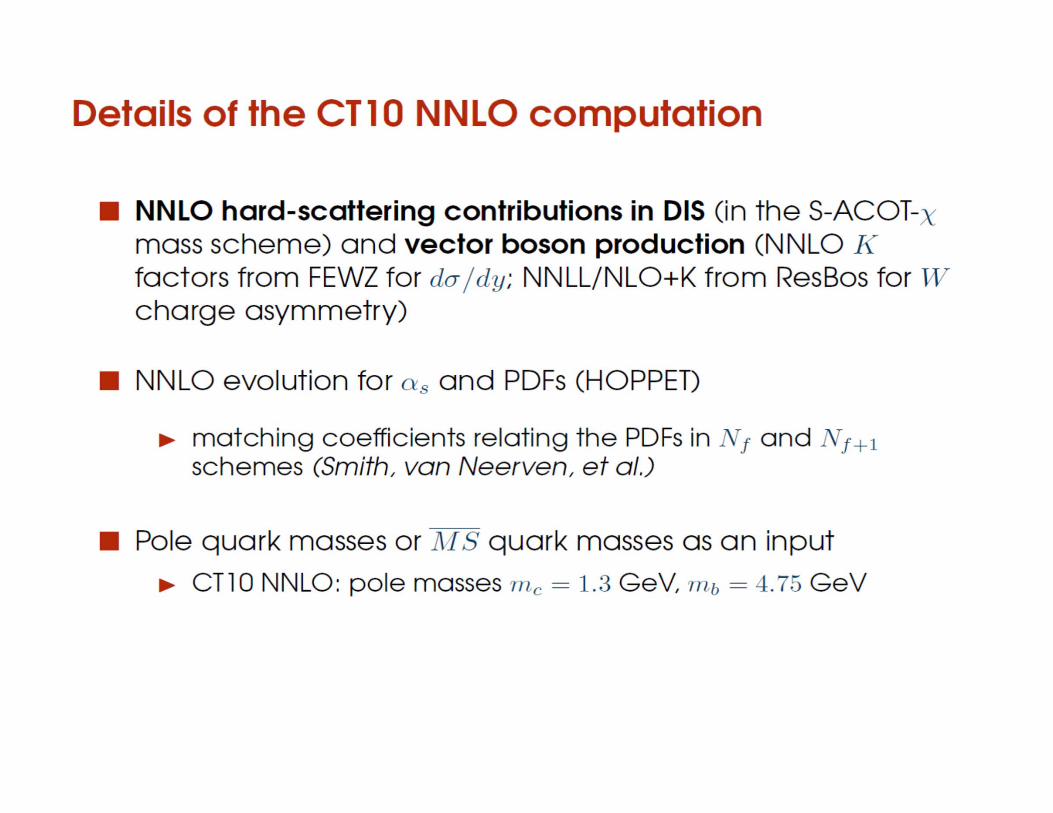
The CT10‐NNLO global analysis of QCD
Parametrization of PDFs at Q = 1.3 GeV, with 25 parameter values to be chosen; there are from 4 to 6 parameters for each parton type.
Many data sets, for short distance interactions.
Perturbative QCD, using NNLO approximations wherever available.
Taking account of experimental errors, statistical and systematic.
(Not so strong on systematic theoretical errors.)
Heavy flavor mass effects are included using the S‐ACOT‐factorization formalism (extended to NNLO).
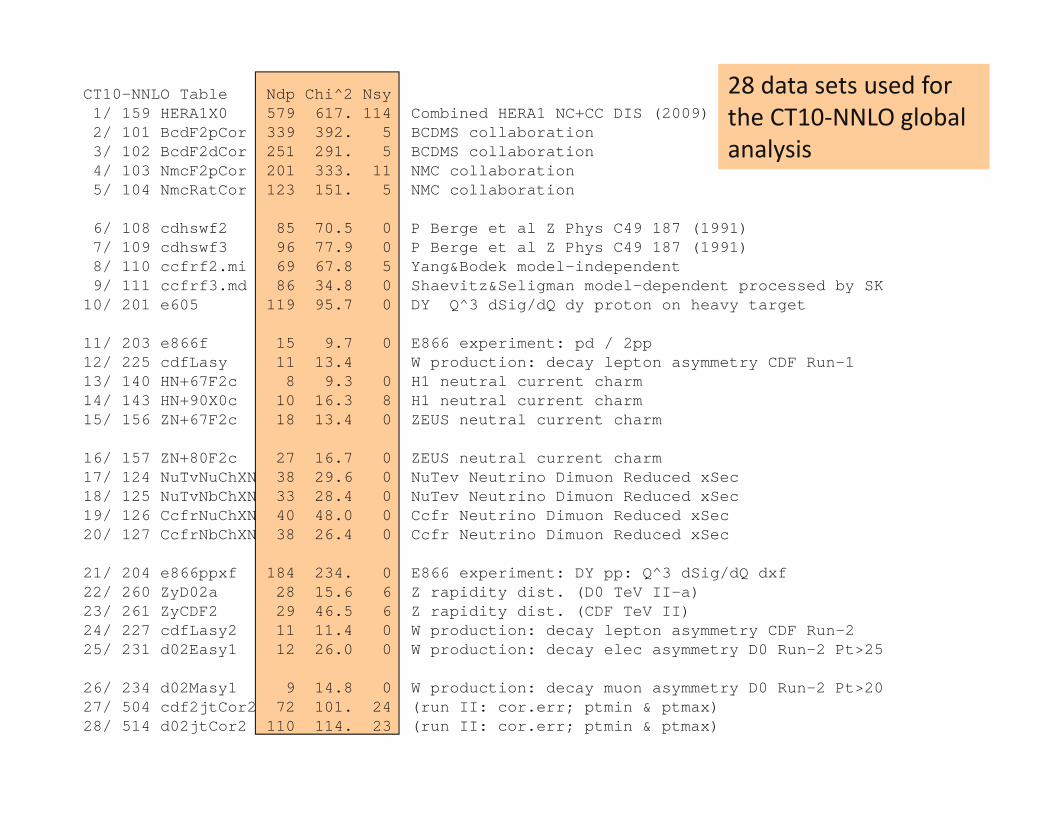
28 data sets used for the CT10‐NNLO global analysis
CT10-NNLO Table Ndp Chi^2 Nsy1/ 159 HERA1X0 579 617. 114 Combined HERA1 NC+CC DIS (2009)2/ 101 BcdF2pCor 339 392. 5 BCDMS collaboration3/ 102 BcdF2dCor 251 291. 5 BCDMS collaboration4/ 103 NmcF2pCor 201 333. 11 NMC collaboration5/ 104 NmcRatCor 123 151. 5 NMC collaboration
6/ 108 cdhswf2 85 70.5 0 P Berge et al Z Phys C49 187 (1991)7/ 109 cdhswf3 96 77.9 0 P Berge et al Z Phys C49 187 (1991)8/ 110 ccfrf2.mi 69 67.8 5 Yang&Bodek model-independent9/ 111 ccfrf3.md 86 34.8 0 Shaevitz&Seligman model-dependent processed by SK
10/ 201 e605 119 95.7 0 DY Q^3 dSig/dQ dy proton on heavy target
11/ 203 e866f 15 9.7 0 E866 experiment: pd / 2pp12/ 225 cdfLasy 11 13.4 W production: decay lepton asymmetry CDF Run-113/ 140 HN+67F2c 8 9.3 0 H1 neutral current charm14/ 143 HN+90X0c 10 16.3 8 H1 neutral current charm15/ 156 ZN+67F2c 18 13.4 0 ZEUS neutral current charm
16/ 157 ZN+80F2c 27 16.7 0 ZEUS neutral current charm17/ 124 NuTvNuChXN 38 29.6 0 NuTev Neutrino Dimuon Reduced xSec18/ 125 NuTvNbChXN 33 28.4 0 NuTev Neutrino Dimuon Reduced xSec19/ 126 CcfrNuChXN 40 48.0 0 Ccfr Neutrino Dimuon Reduced xSec20/ 127 CcfrNbChXN 38 26.4 0 Ccfr Neutrino Dimuon Reduced xSec
21/ 204 e866ppxf 184 234. 0 E866 experiment: DY pp: Q^3 dSig/dQ dxf22/ 260 ZyD02a 28 15.6 6 Z rapidity dist. (D0 TeV II-a)23/ 261 ZyCDF2 29 46.5 6 Z rapidity dist. (CDF TeV II)24/ 227 cdfLasy2 11 11.4 0 W production: decay lepton asymmetry CDF Run-2 25/ 231 d02Easy1 12 26.0 0 W production: decay elec asymmetry D0 Run-2 Pt>25
26/ 234 d02Masy1 9 14.8 0 W production: decay muon asymmetry D0 Run-2 Pt>2027/ 504 cdf2jtCor2 72 101. 24 (run II: cor.err; ptmin & ptmax)28/ 514 d02jtCor2 110 114. 23 (run II: cor.err; ptmin & ptmax)
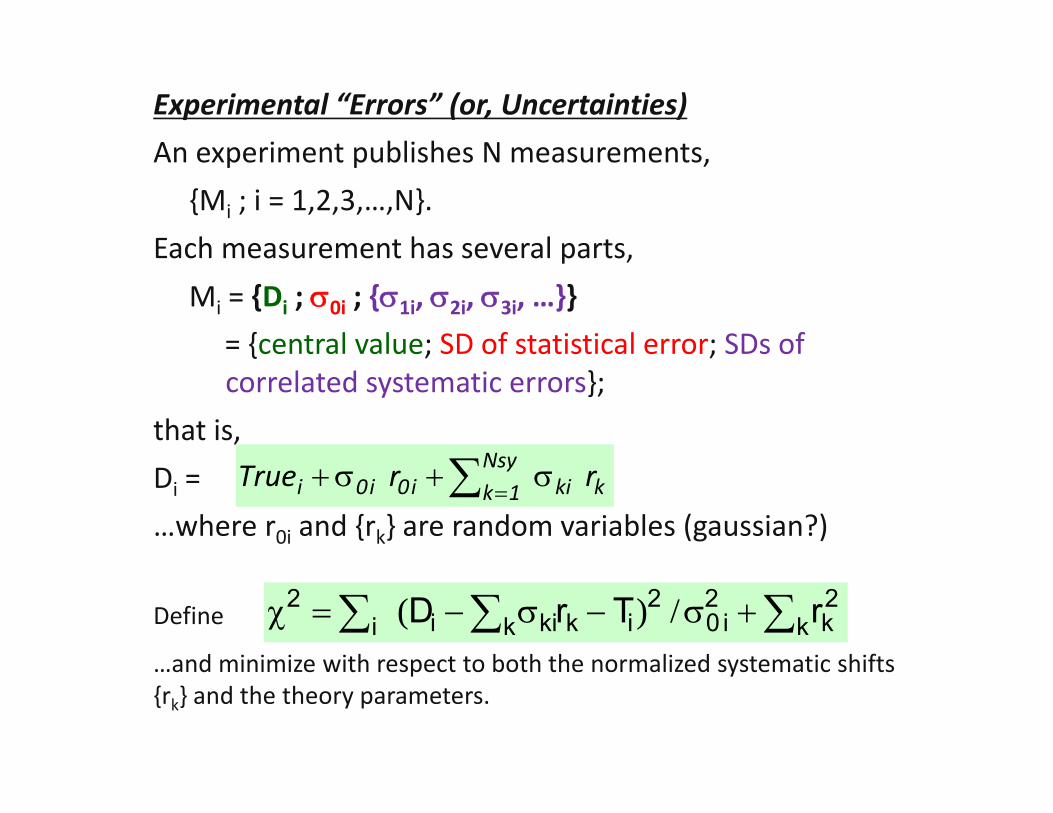
Experimental “Errors” (or, Uncertainties)An experiment publishes N measurements,
{Mi ; i = 1,2,3,…,N}.Each measurement has several parts,
Mi = {Di ; 0i ; {1i, 2i, 3i, …}} = {central value; SD of statistical error; SDs of correlated systematic errors};
that is,Di = …where r0i and {rk} are random variables (gaussian?)
Nsy1k kkii0i0i rrTrue
k2k
2i0
2ii k kkii
2 rTrD /)(Define
…and minimize with respect to both the normalized systematic shifts {rk} and the theory parameters.
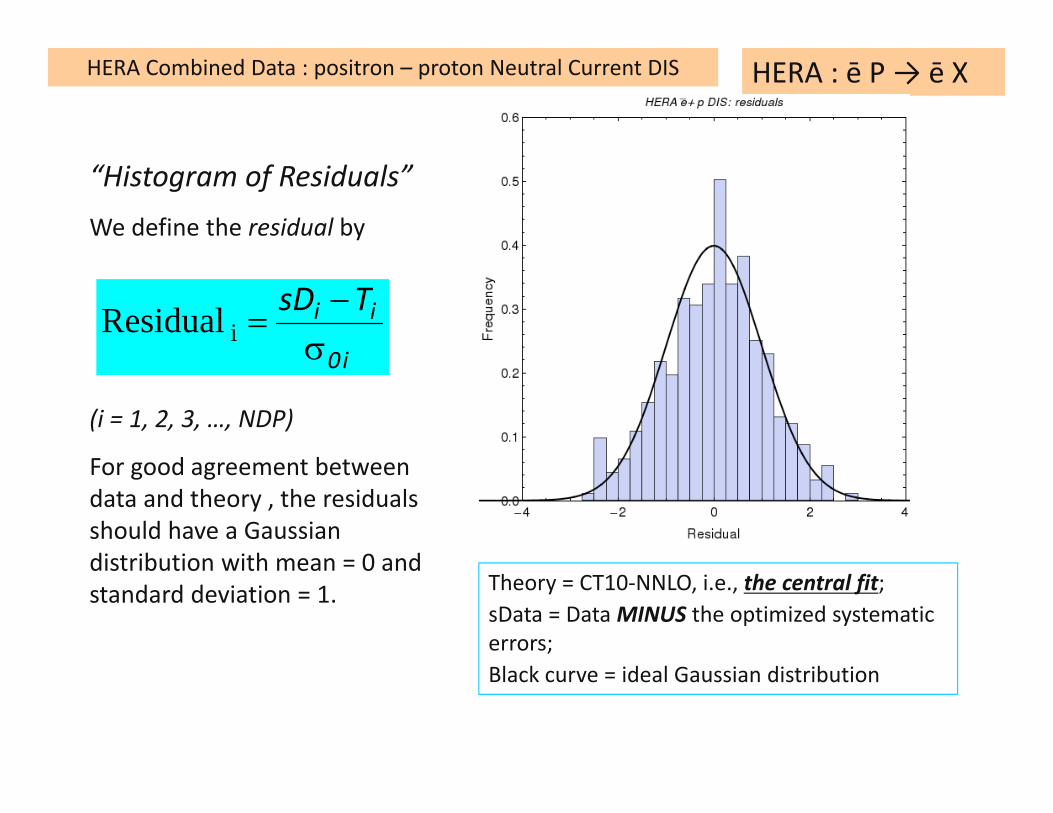
HERA : ē P → ē PHERA : ē P → ē XHERA Combined Data : positron – proton Neutral Current DIS
“Histogram of Residuals”We define the residual by
(i = 1, 2, 3, …, NDP)
For good agreement between data and theory , the residuals should have a Gaussian distribution with mean = 0 and standard deviation = 1.
i0
ii TsD
iResidual
Theory = CT10‐NNLO, i.e., the central fit;sData = Data MINUS the optimized systematic errors;Black curve = ideal Gaussian distribution
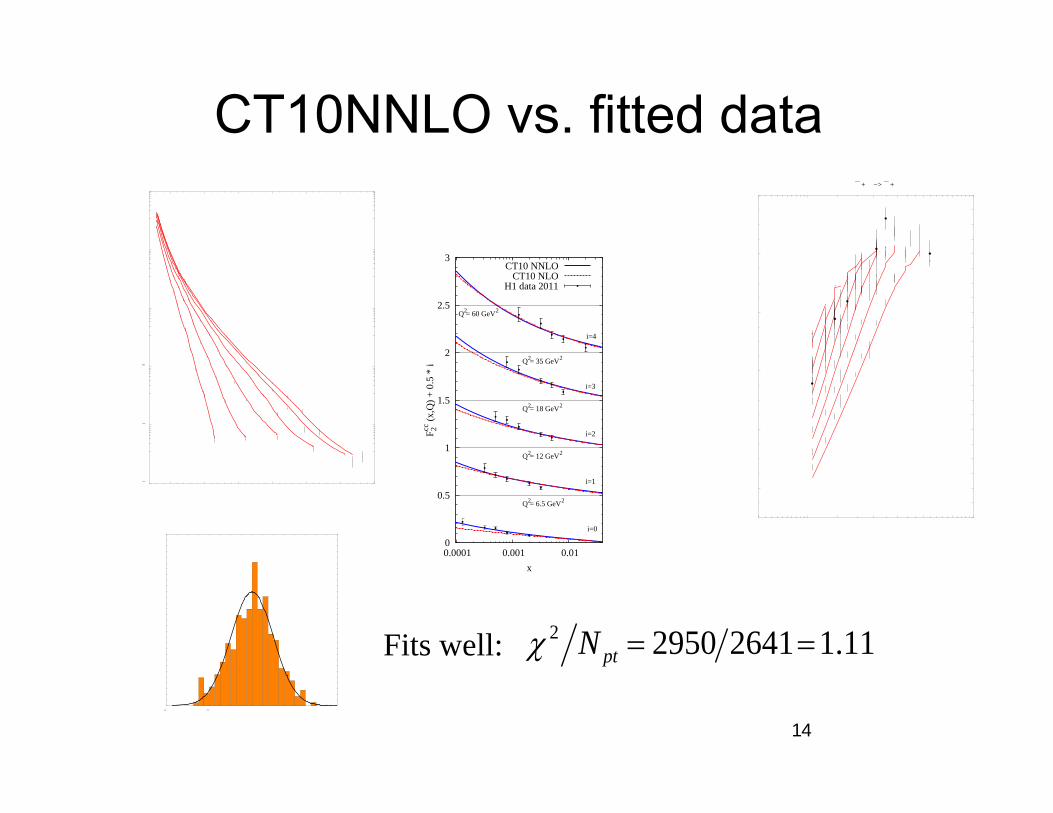
CT10NNLO vs. fitted data
14
0
0.5
1
1.5
2
2.5
3
0.0001 0.001 0.01
F 2cc (x
,Q) +
0.5
* i
x
Q2 = 6.5 GeV2
i=0
Q2 = 12 GeV2
i=1
Q2 = 18 GeV2
i=2
Q2 = 35 GeV2
i=3
Q2 = 60 GeV2
i=4
CT10 NNLOCT10 NLO
H1 data 2011
2 N pt 2950 26411.11Fits well:
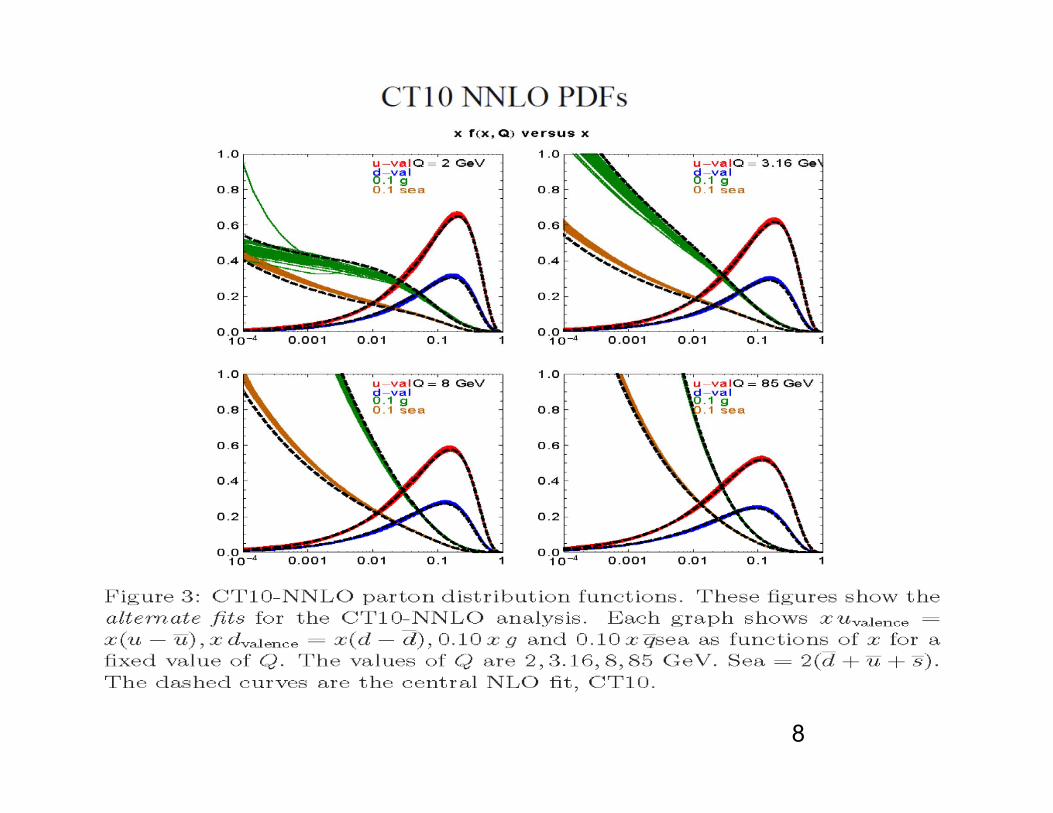
CT10 NNLO PDFsPDF error bands
u and d PDFs are best known currently no constraint for x below 1E-4 large error for x above 0.3 larger sea (e.g., ubar and dbar) quark
uncertainties in large x region with non-perturbative parametrization form
dependence in small and large x regionsPDF eigensets
useful for calculating PDF induced uncertainty sensitive to some special (combination of) parton
flavor(s). (e.g., eigenset 7 is sensitive to d/u or dbar/ubar;
hence, W asymmetry data at Tevatron and LHC.)
PD
F R
atio
to B
est F
it
x
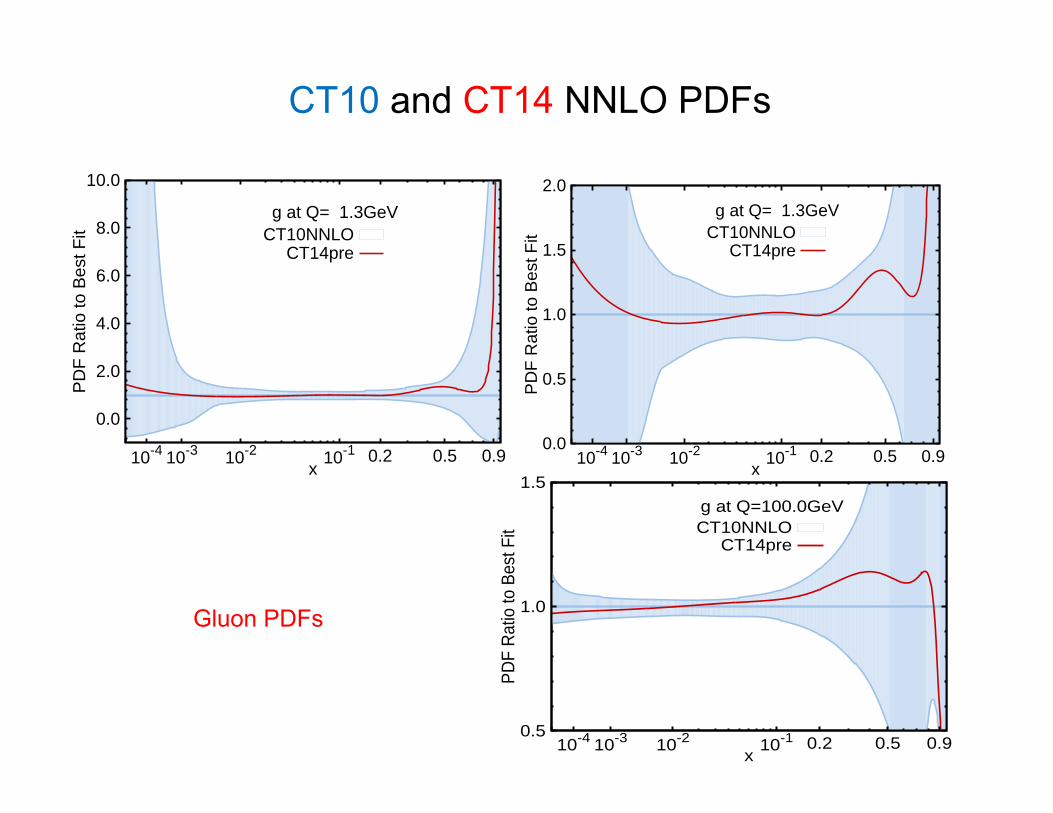
g at Q= 1.3GeVCT10NNLO
CT14pre
0.0
0.5
1.0
1.5
2.0
10-4 10-3 10-2 10-1 0.2 0.5 0.9
PD
F R
atio
to B
est F
it
x
g at Q= 1.3GeVCT10NNLO
CT14pre
0.0
2.0
4.0
6.0
8.0
10.0
10-4 10-3 10-2 10-1 0.2 0.5 0.9
CT10 and CT14 NNLO PDFs
PD
F R
atio
to B
est F
it
x
g at Q=100.0GeVCT10NNLO
CT14pre
0.5
1.0
1.5
10-4 10-3 10-2 10-1 0.2 0.5 0.9
Gluon PDFs
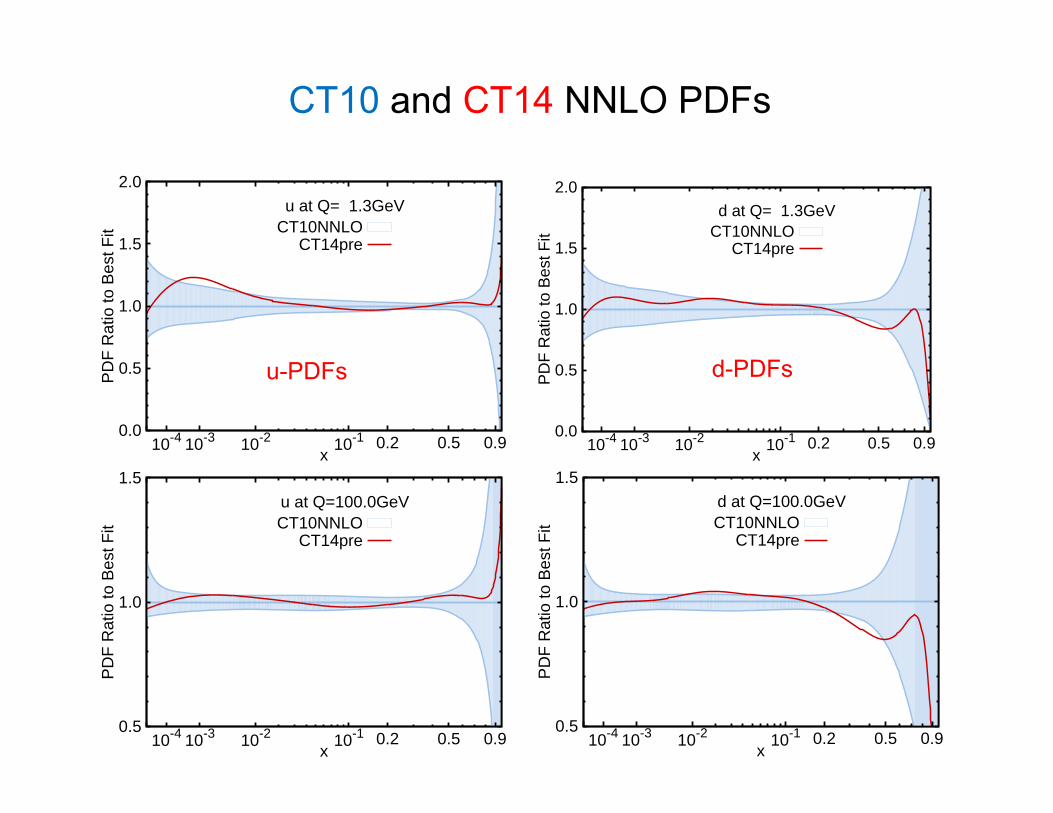
CT10 and CT14 NNLO PDFs
u-PDFsPD
F R
atio
to B
est F
it
x
u at Q= 1.3GeVCT10NNLO
CT14pre
0.0
0.5
1.0
1.5
2.0
10-4 10-3 10-2 10-1 0.2 0.5 0.9
PD
F R
atio
to B
est F
it
x
d at Q= 1.3GeVCT10NNLO
CT14pre
0.0
0.5
1.0
1.5
2.0
10-4 10-3 10-2 10-1 0.2 0.5 0.9
d-PDFs
PD
F R
atio
to B
est F
it
x
u at Q=100.0GeVCT10NNLO
CT14pre
0.5
1.0
1.5
10-4 10-3 10-2 10-1 0.2 0.5 0.9
PD
F R
atio
to B
est F
it
x
d at Q=100.0GeVCT10NNLO
CT14pre
0.5
1.0
1.5
10-4 10-3 10-2 10-1 0.2 0.5 0.9
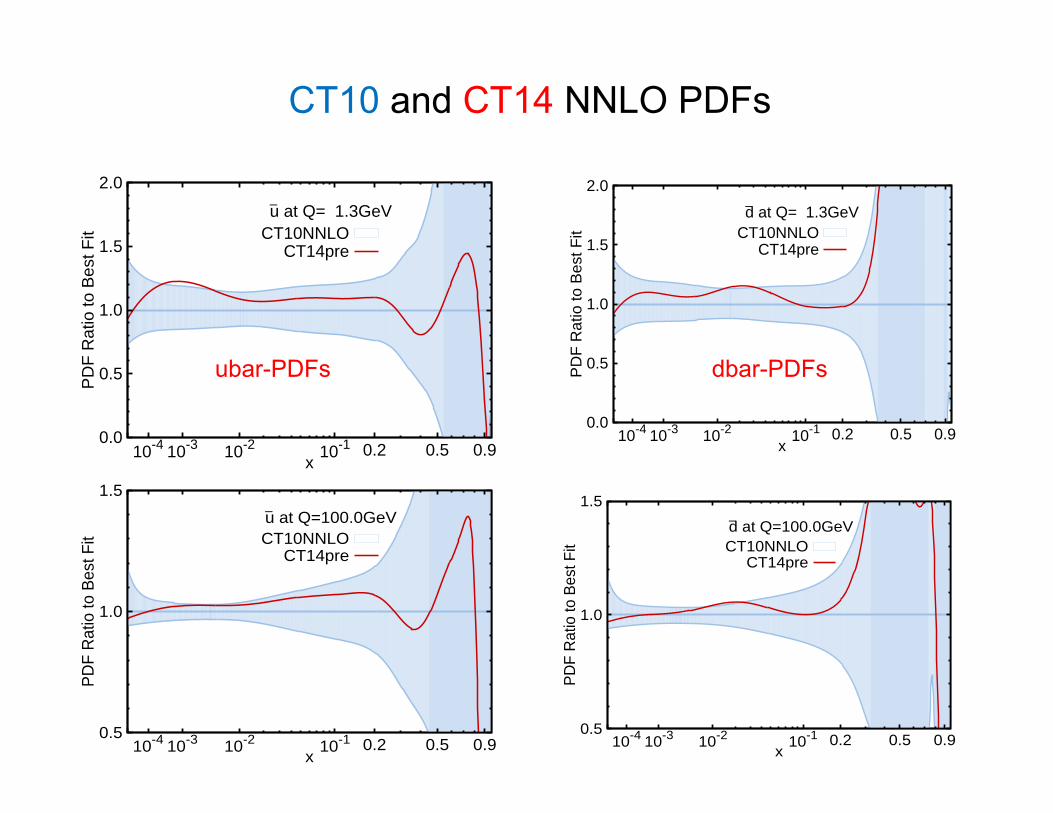
CT10 and CT14 NNLO PDFs
ubar-PDFs dbar-PDFs
PD
F R
atio
to B
est F
it
x
–u at Q=100.0GeVCT10NNLO
CT14pre
0.5
1.0
1.5
10-4 10-3 10-2 10-1 0.2 0.5 0.9
PD
F R
atio
to B
est F
it
x
–d at Q=100.0GeVCT10NNLO
CT14pre
0.5
1.0
1.5
10-4 10-3 10-2 10-1 0.2 0.5 0.9
PD
F R
atio
to B
est F
it
x
–u at Q= 1.3GeVCT10NNLO
CT14pre
0.0
0.5
1.0
1.5
2.0
10-4 10-3 10-2 10-1 0.2 0.5 0.9
PD
F R
atio
to B
est F
it
x
–d at Q= 1.3GeVCT10NNLO
CT14pre
0.0
0.5
1.0
1.5
2.0
10-4 10-3 10-2 10-1 0.2 0.5 0.9
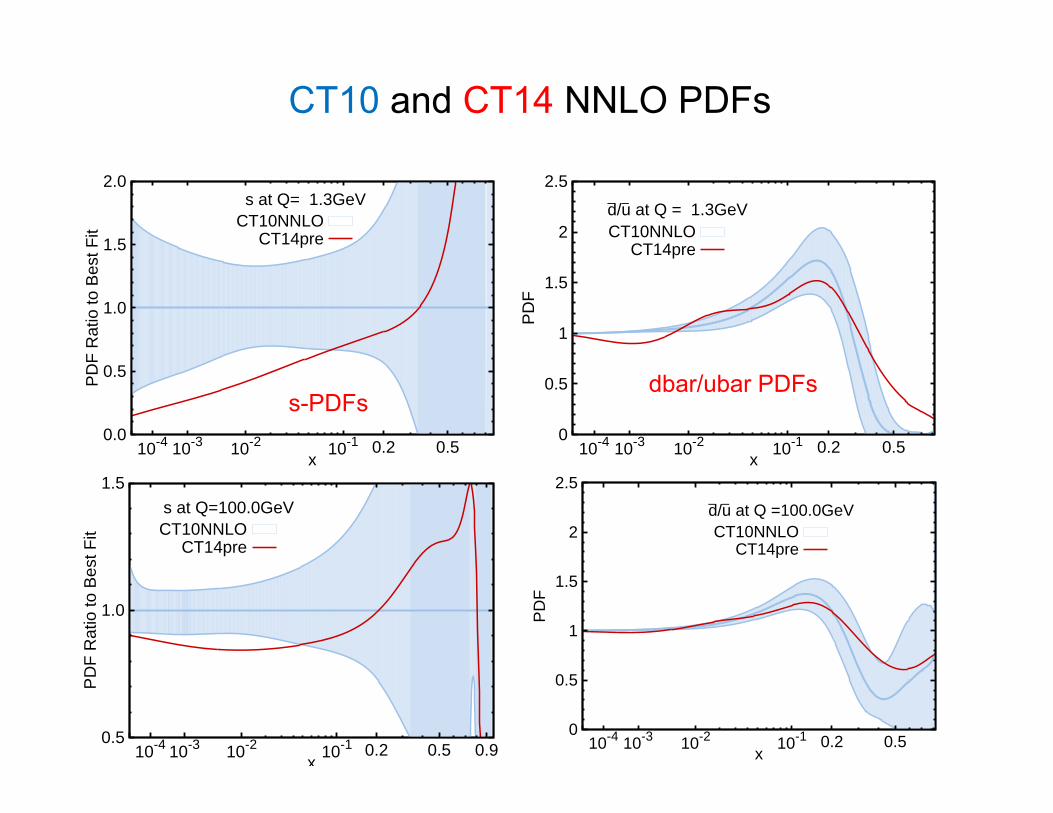
CT10 and CT14 NNLO PDFs
s-PDFsdbar/ubar PDFsP
DF
Rat
io to
Bes
t Fit
x
s at Q= 1.3GeVCT10NNLO
CT14pre
0.0
0.5
1.0
1.5
2.0
10-4 10-3 10-2 10-1 0.2 0.5
PD
F
x
–d/–u at Q = 1.3GeVCT10NNLO
CT14pre
0
0.5
1
1.5
2
2.5
10-4 10-3 10-2 10-1 0.2 0.5
PD
F R
atio
to B
est F
it
x
s at Q=100.0GeVCT10NNLO
CT14pre
0.5
1.0
1.5
10-4 10-3 10-2 10-1 0.2 0.5 0.9
PD
F
x
–d/–u at Q =100.0GeVCT10NNLO
CT14pre
0
0.5
1
1.5
2
2.5
10-4 10-3 10-2 10-1 0.2 0.5
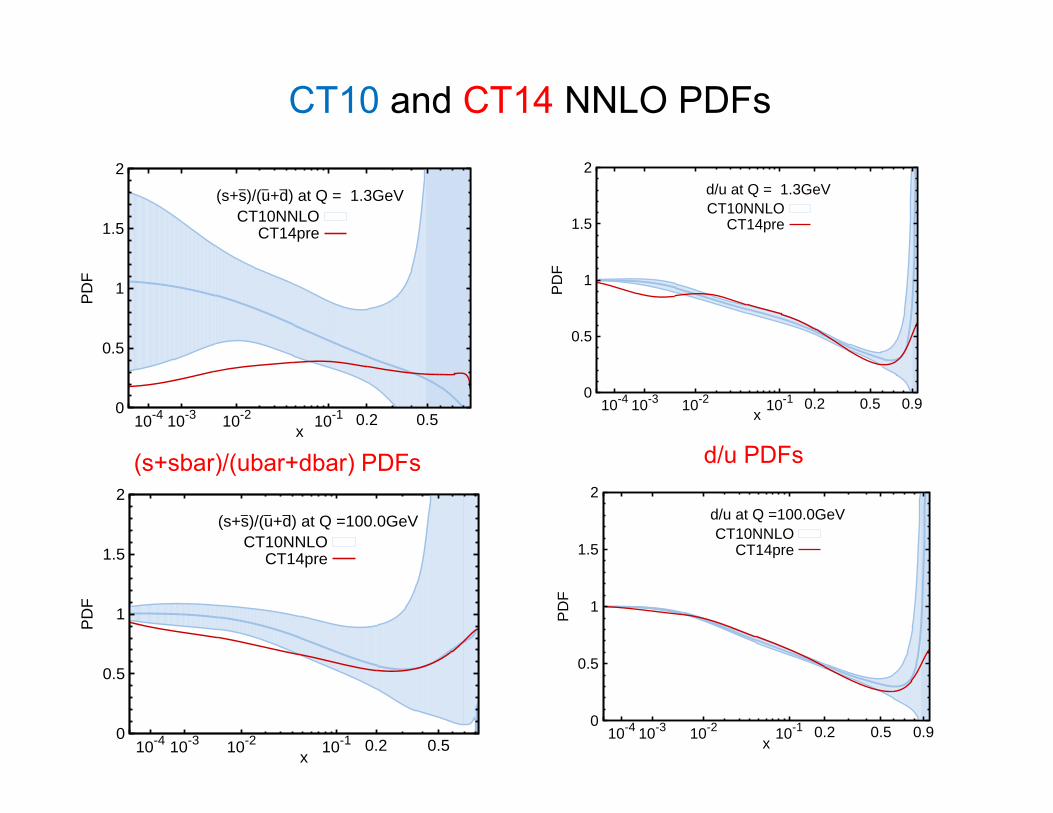
CT10 and CT14 NNLO PDFs
(s+sbar)/(ubar+dbar) PDFs d/u PDFs
PD
F
x
(s+–s)/(–u+–d) at Q =100.0GeVCT10NNLO
CT14pre
0
0.5
1
1.5
2
10-4 10-3 10-2 10-1 0.2 0.5
PD
F
x
d/u at Q =100.0GeVCT10NNLO
CT14pre
0
0.5
1
1.5
2
10-4 10-3 10-2 10-1 0.2 0.5 0.9
PD
F
x
d/u at Q = 1.3GeVCT10NNLO
CT14pre
0
0.5
1
1.5
2
10-4 10-3 10-2 10-1 0.2 0.5 0.9
PD
F
x
(s+–s)/(–u+–d) at Q = 1.3GeVCT10NNLO
CT14pre
0
0.5
1
1.5
2
10-4 10-3 10-2 10-1 0.2 0.5
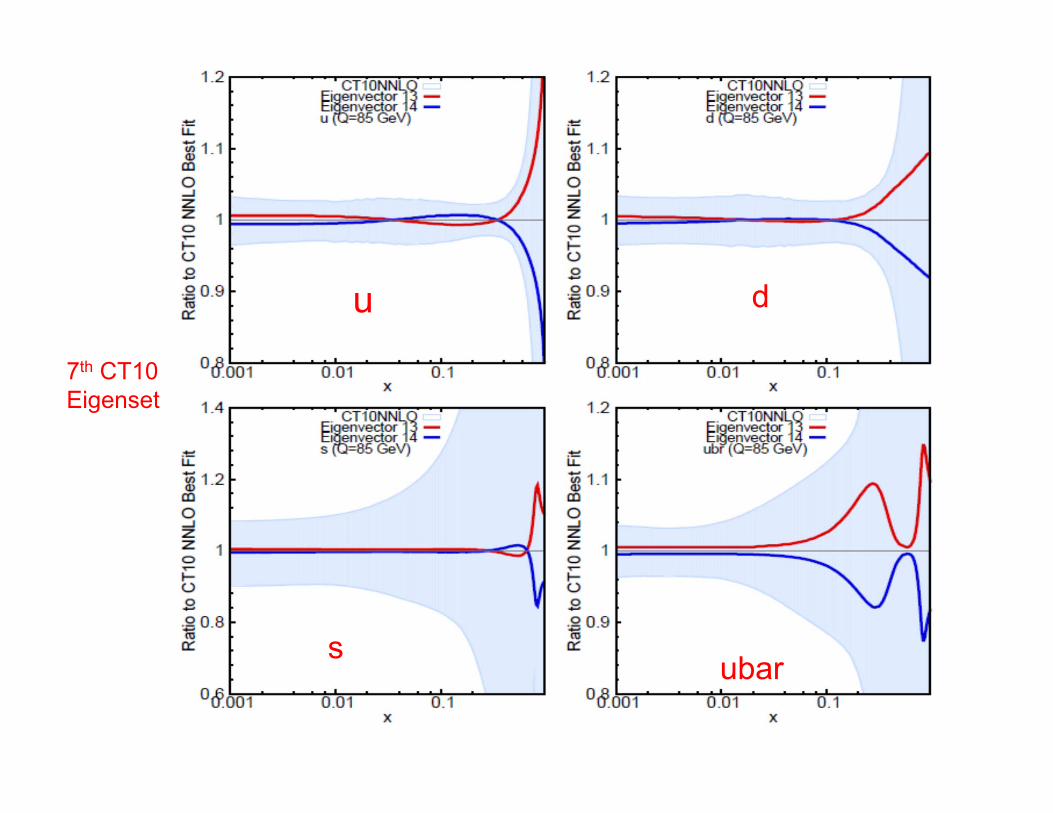
7th CT10Eigenset
u d
s ubar
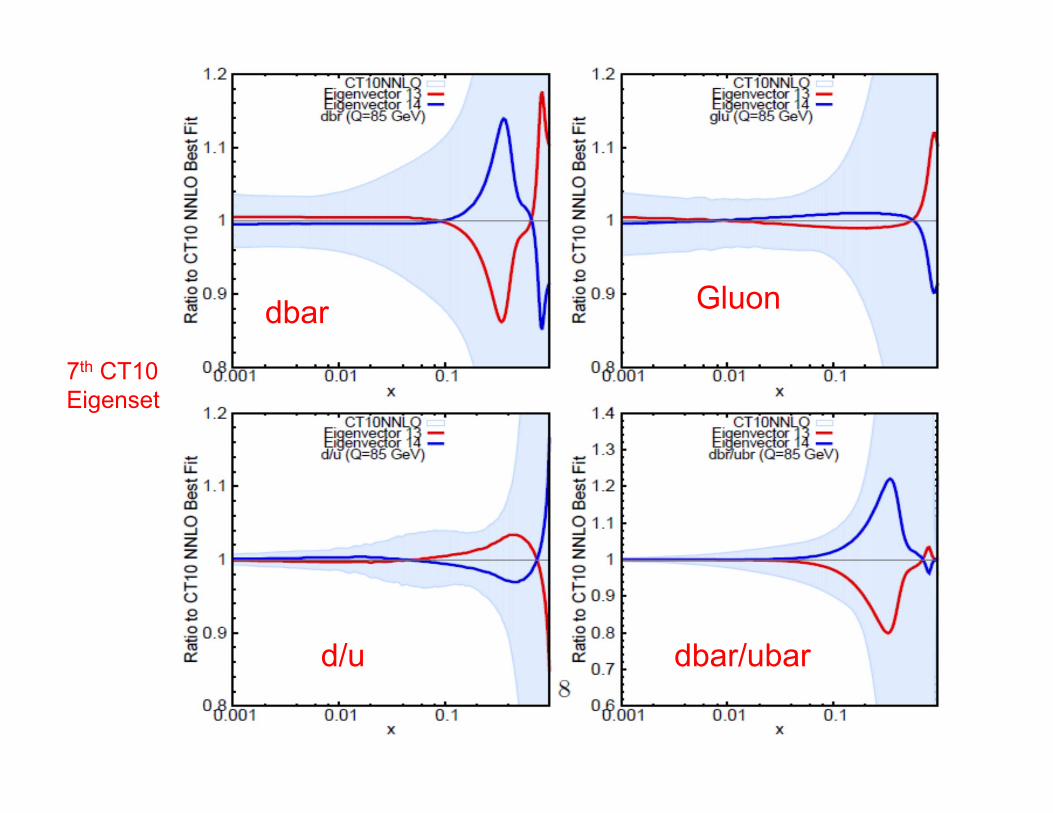
7th CT10Eigenset
dbar Gluon
d/u dbar/ubar


|Muon |0 0.5 1 1.5 2
Cha
rge
asym
met
ry
0.05
0.1
0.15
0.2
0.25
NLO FEWZ + NLO PDF, 68% CLCT10NNPDF23HERAPDF15MSTW2008MSTW2008CPdeut
> 35 GeVT
(b) p
Data
= 7 TeVs at -1CMS, L = 4.7 fb
26
Data is already more precise than current PDFuncertainty.
Will help to determine PDFs in small x region.
Most useful for determining dbar/ubar.

Intrinsic Charm and CT10IC
27
1) Update of CTEQ6.5 IC study from 2007 to CT10NNLO- includes combined H1 and ZEUS data, HERA inclusive charm
2) Recent CT10 global analysis study of charm quark mass:Gao et al, Eur.Phys.J. C73 (2013) 2541
Use mc(pole)=1.3 GeV for this study- some correlation between mc and IC
3) Two model Intrinsic Charm distributions at Qc=1.3 GeV- BHPS valence-like model (Brodsky et al, Phys. Lett. 93B, 451 (1980))- SEA-like model
4) 90% CL limits:
BHPS
SEA
mc (mc ) 1.150.120.18 GeV
2960
3000
3040
3080
3120
3160
0 0.01 0.02 0.03
2 F
<x>IC
BHPS1
BHPS2SEA1
SEA2
BHPSSEABHPS + T2SEA + T2
xIC 0.025
xIC 0.015
xIC x c(x,Qc ) c (x,Qc )
0
1 dx
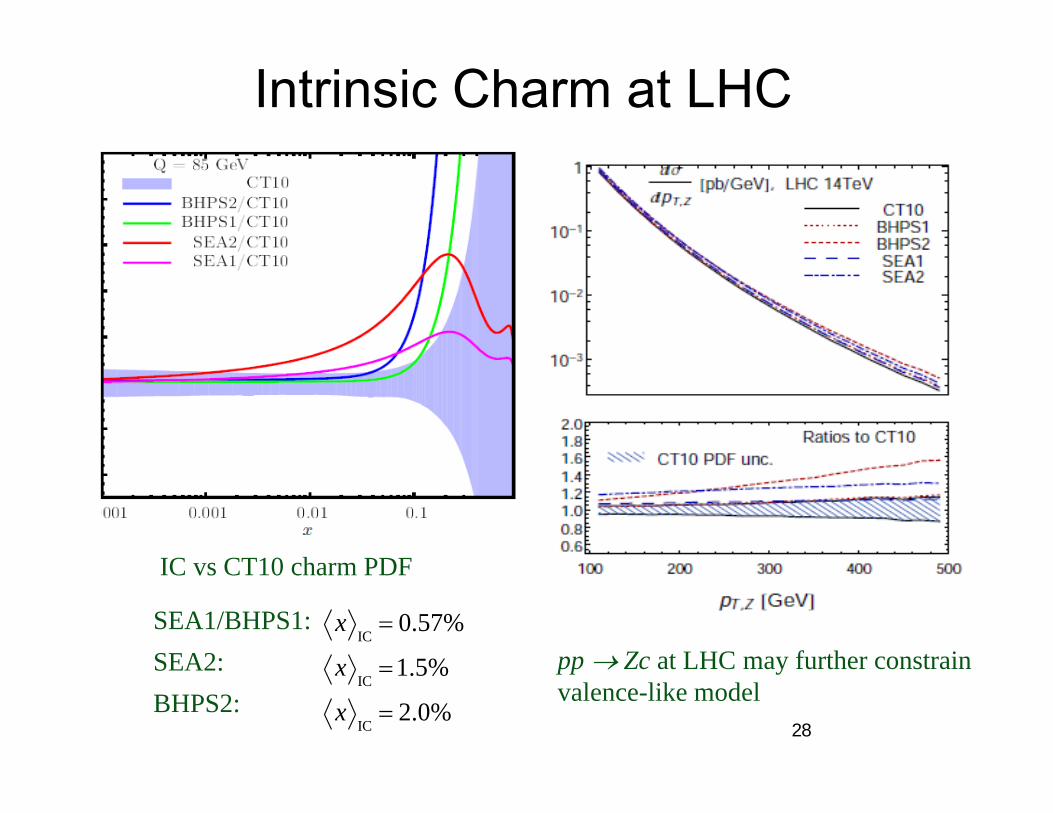
Intrinsic Charm at LHC
28
IC vs CT10 charm PDF
pp Zc at LHC may further constrainvalence-like model
SEA1/BHPS1:SEA2:BHPS2:
xIC 0.57%
xIC1.5%
xIC 2.0%
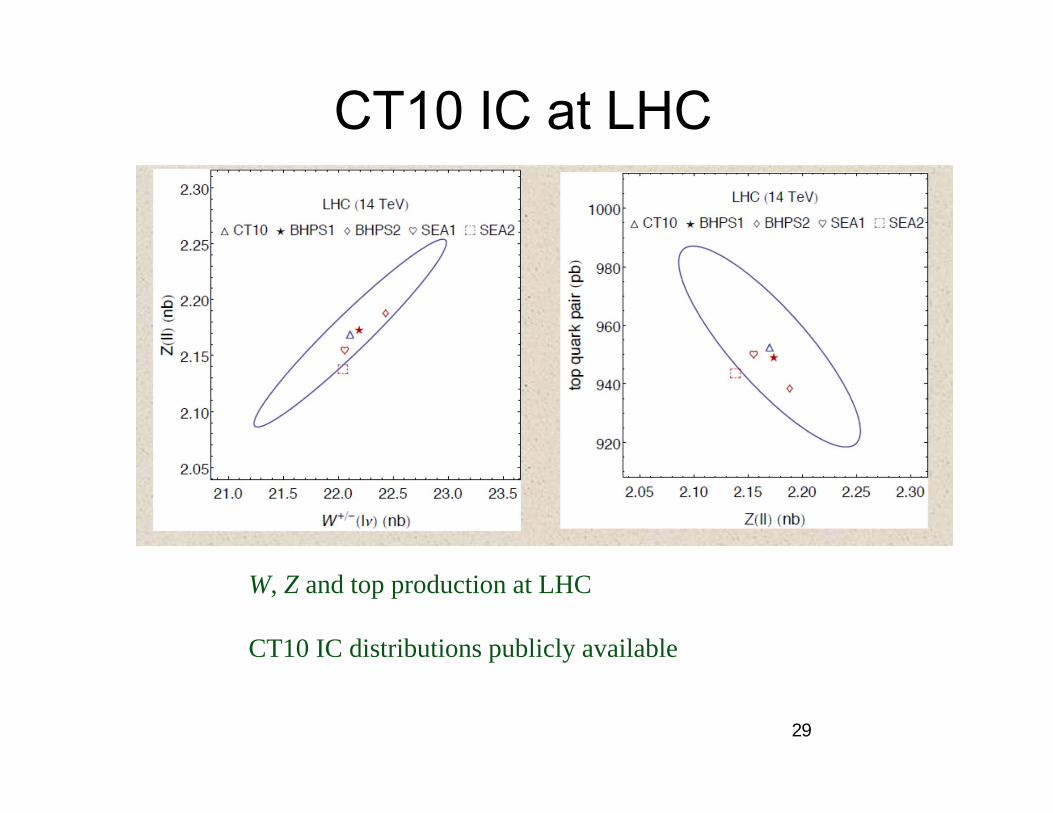
CT10 IC at LHC
29
W, Z and top production at LHC
CT10 IC distributions publicly available
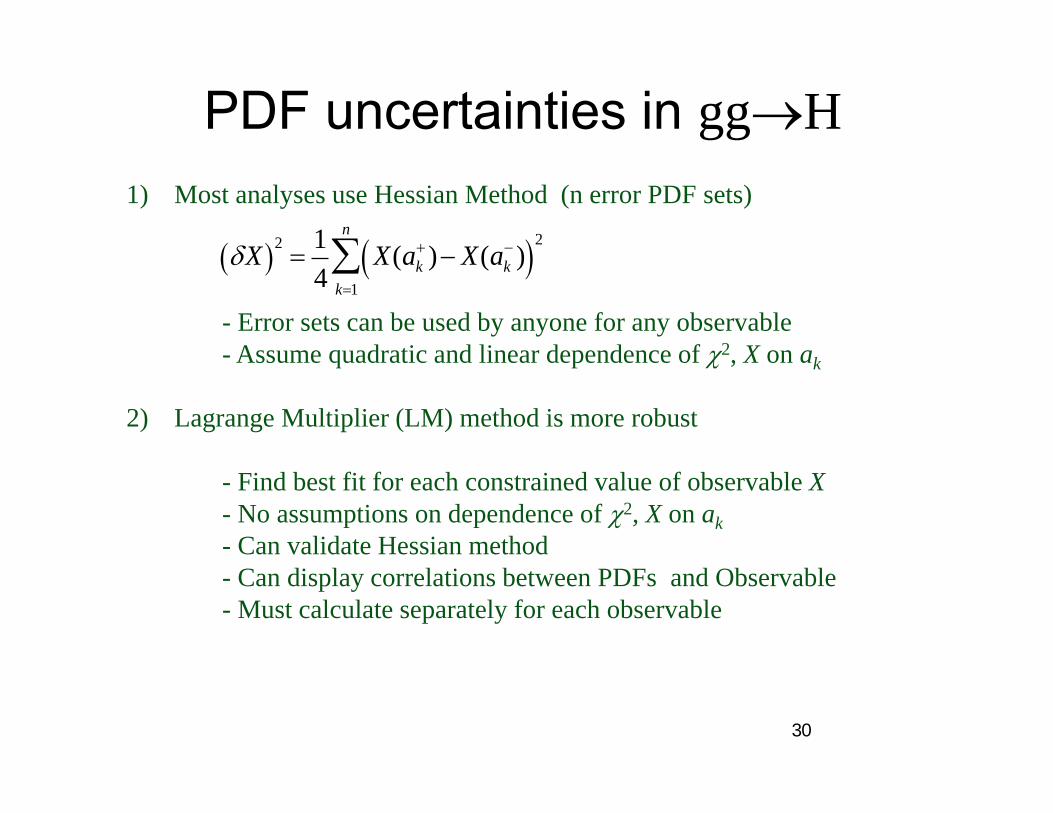
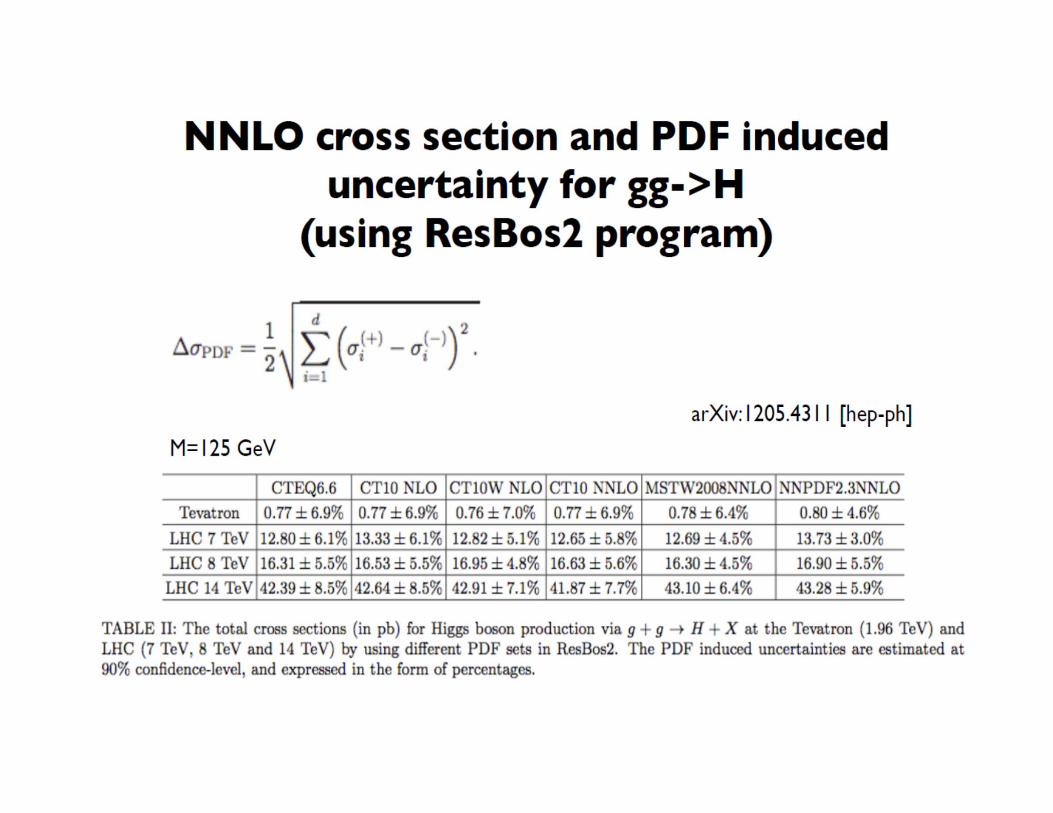
PDF uncertainties in ggH
30
1) Most analyses use Hessian Method (n error PDF sets)
- Error sets can be used by anyone for any observable- Assume quadratic and linear dependence of 2, X on ak
2) Lagrange Multiplier (LM) method is more robust
- Find best fit for each constrained value of observable X- No assumptions on dependence of 2, X on ak- Can validate Hessian method- Can display correlations between PDFs and Observable- Must calculate separately for each observable
X 2 14
X(ak ) X(ak
) 2
k1
n
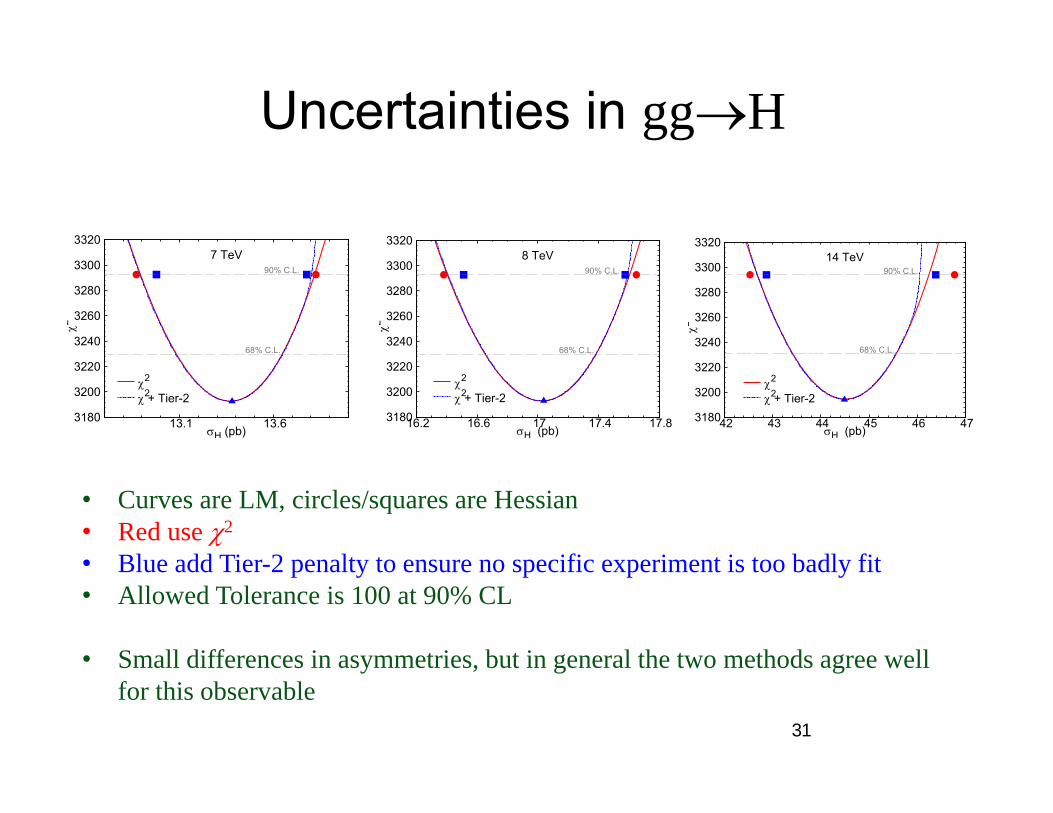
Uncertainties in ggH
31
• Curves are LM, circles/squares are Hessian• Red use 2
• Blue add Tier-2 penalty to ensure no specific experiment is too badly fit• Allowed Tolerance is 100 at 90% CL
• Small differences in asymmetries, but in general the two methods agree well for this observable
3180
3200
3220
3240
3260
3280
3300
3320
42 43 44 45 46 47
2
H (pb)
14 TeV90% C.L.
68% C.L.
2
2 + Tier-2 3180
3200
3220
3240
3260
3280
3300
3320
16.2 16.6 17 17.4 17.8
2
H (pb)
8 TeV90% C.L.
68% C.L.
2
2 + Tier-2 3180
3200
3220
3240
3260
3280
3300
3320
13.1 13.6
2
H (pb)
7 TeV90% C.L.
68% C.L.
2
2 + Tier-2
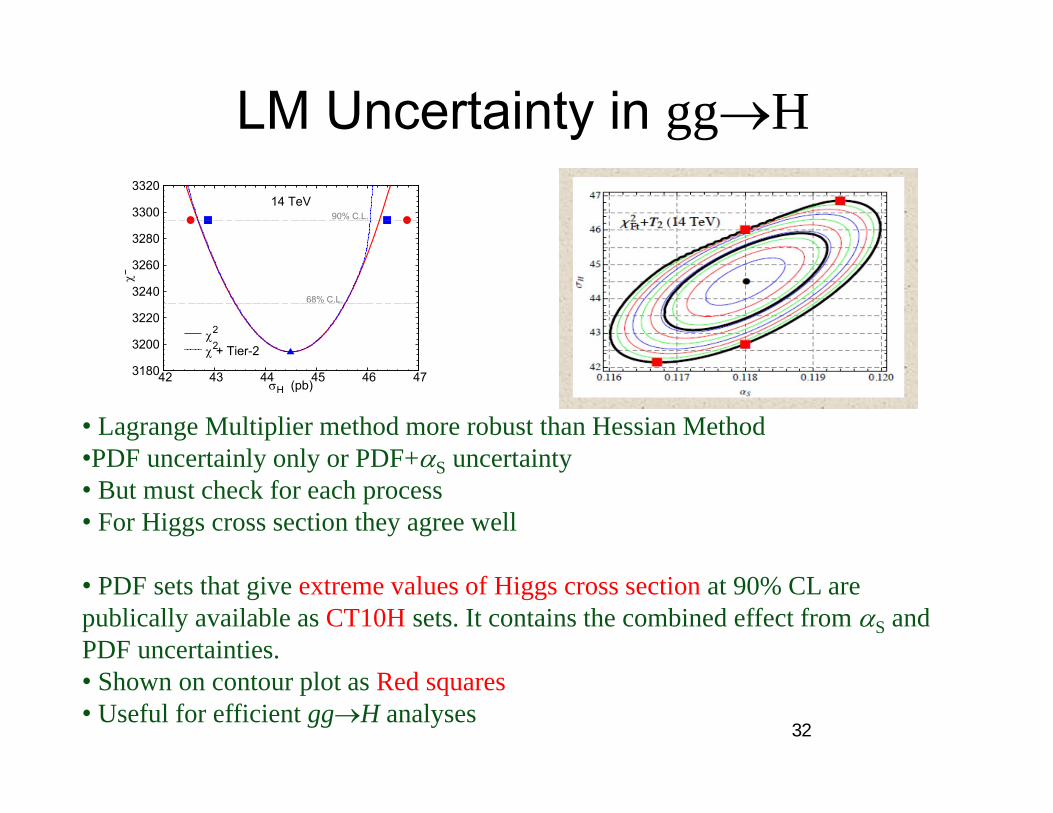
LM Uncertainty in ggH
32
• Lagrange Multiplier method more robust than Hessian Method•PDF uncertainly only or PDF+S uncertainty• But must check for each process• For Higgs cross section they agree well
• PDF sets that give extreme values of Higgs cross section at 90% CL are publically available as CT10H sets. It contains the combined effect from S and PDF uncertainties. • Shown on contour plot as Red squares• Useful for efficient ggH analyses
3180
3200
3220
3240
3260
3280
3300
3320
42 43 44 45 46 47
2
H (pb)
14 TeV90% C.L.
68% C.L.
2
2 + Tier-2
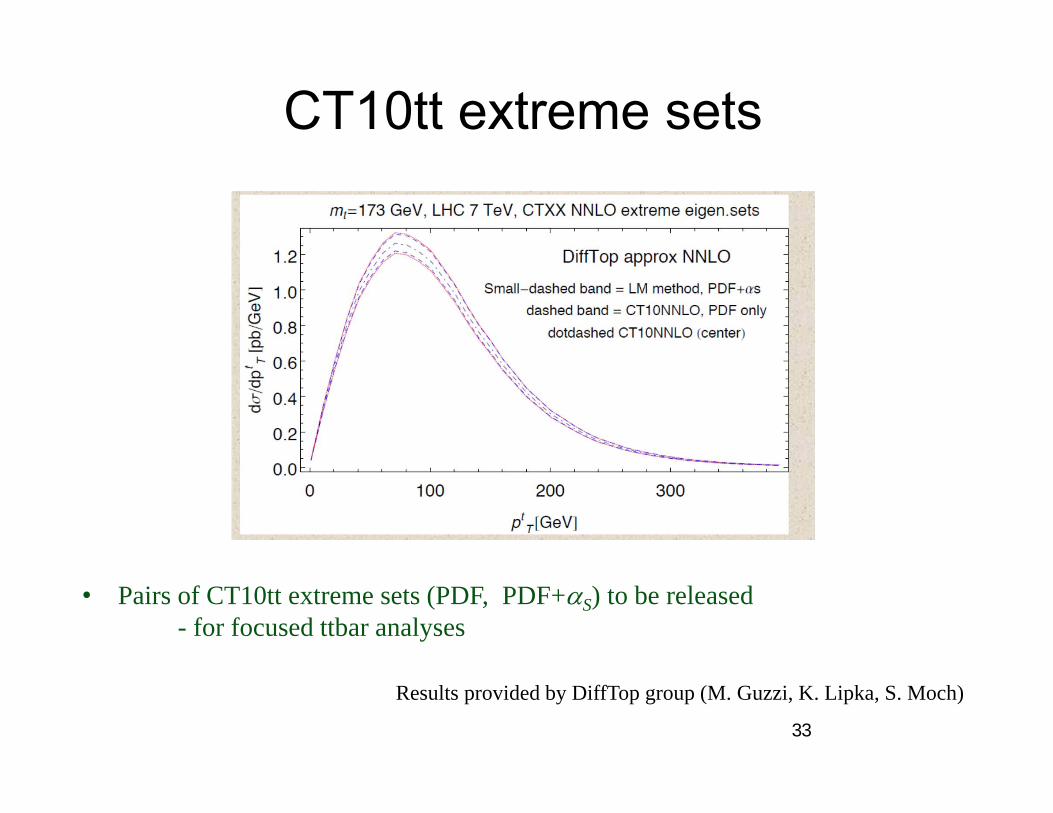
CT10tt extreme sets
33
• Pairs of CT10tt extreme sets (PDF, PDF+S) to be released - for focused ttbar analyses
Results provided by DiffTop group (M. Guzzi, K. Lipka, S. Moch)
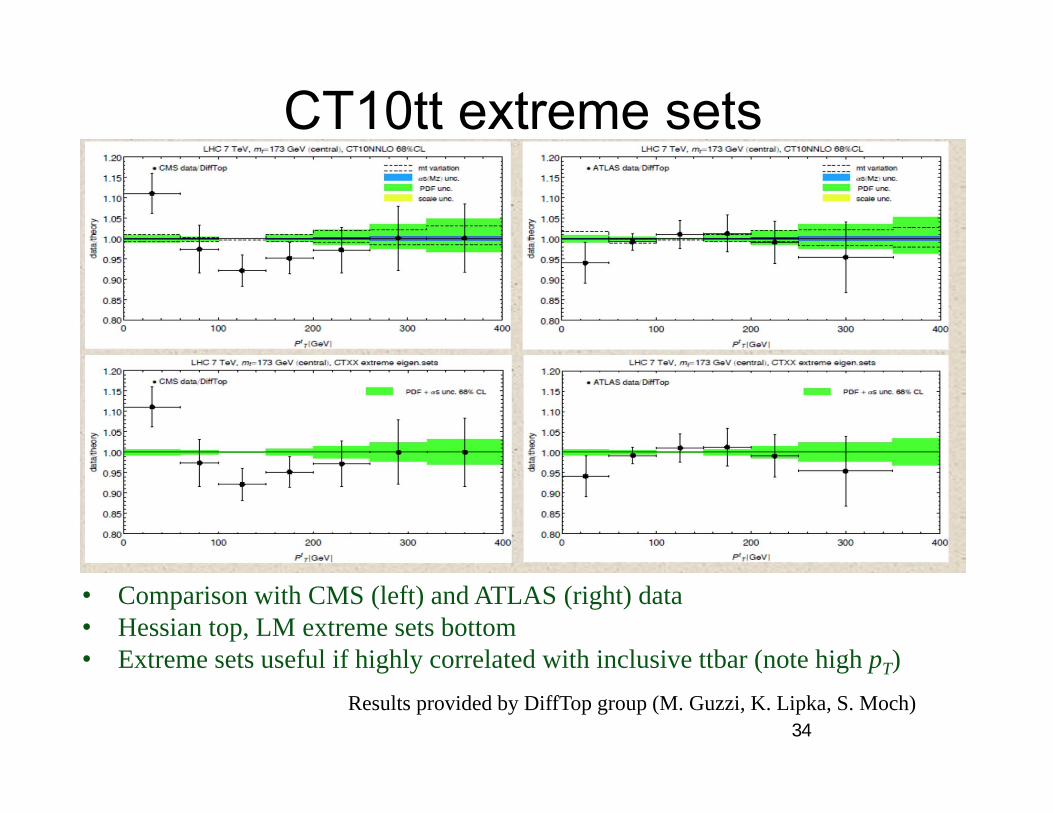
CT10tt extreme sets
34
• Comparison with CMS (left) and ATLAS (right) data• Hessian top, LM extreme sets bottom• Extreme sets useful if highly correlated with inclusive ttbar (note high pT)
Results provided by DiffTop group (M. Guzzi, K. Lipka, S. Moch)
Recap
• Intrinsic Charm•Limits on valence-like and sea-like IC
•CT10IC PDFs available for further study•LHC will probe further
• Lagrange Multiplier Uncertainty analysis•Less dependent on assumptions than Hessian analysis
•Allows study of data correlations with particular observable•Test of Hessian results
•Consistent with Hessian results for both Higgs and ttbar•CT10H extreme sets available for focused studies
(CT10tt extreme sets to come)

Photon PDFs
36
1) Previous studiesa) MRST Martin et al., EPJC 39 (2005) 155
- Radiation off “primordial current quark” distributionsb) NNPDF Ball et al., Nuc. Phys. B 877 (2013) 290
- parametrized fit, predominantly constrained by W,Z,* Drell-Yanc) Sadykov arXiv:1401.1133
- photon evolution in QCDNum
2) Photon evolution at LO in and NLO in S currently implemented in CTEQ-TEA global analysis packagea) Alternative parametrization approachb) Constrain with DIS + photon data
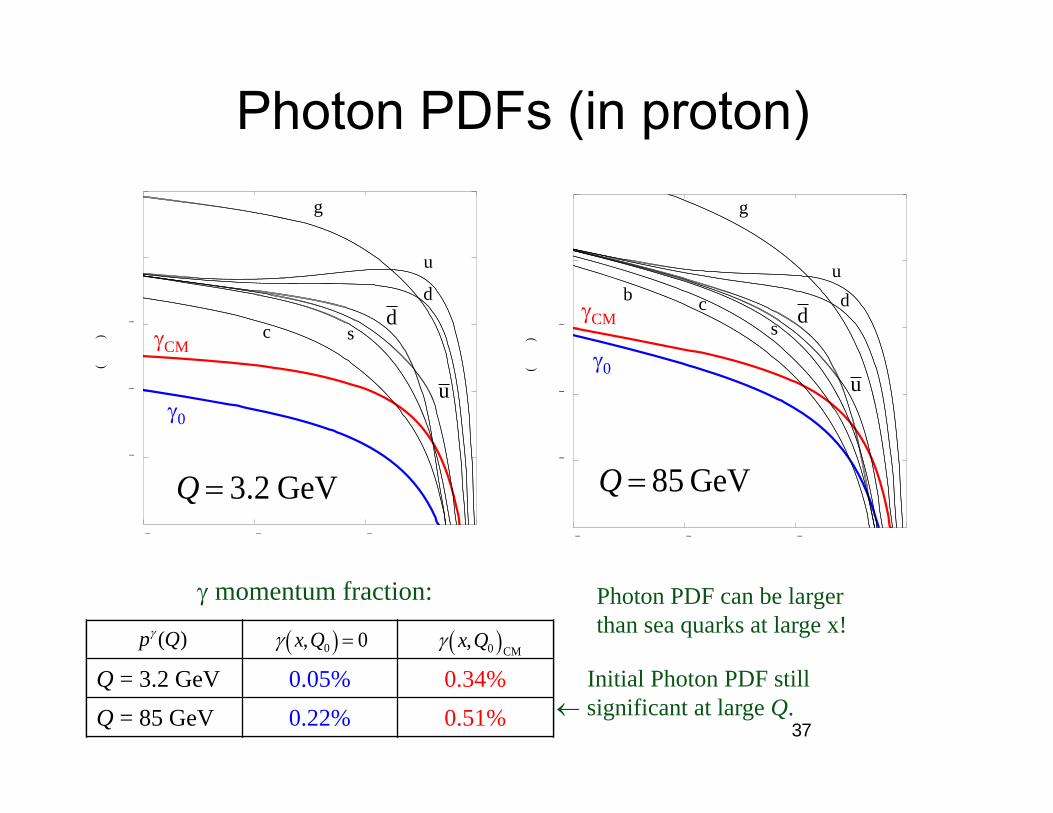
Photon PDFs (in proton)
37
Q = 3.2 GeV 0.05% 0.34%Q = 85 GeV 0.22% 0.51%
p (Q) x,Q0 0 x,Q0 CM
momentum fraction:
0
0
CM
CM
g g
u ud d
ccb
ssd d
uu
Q 3.2 GeV Q 85 GeV
Photon PDF can be largerthan sea quarks at large x!
Initial Photon PDF stillsignificant at large Q.
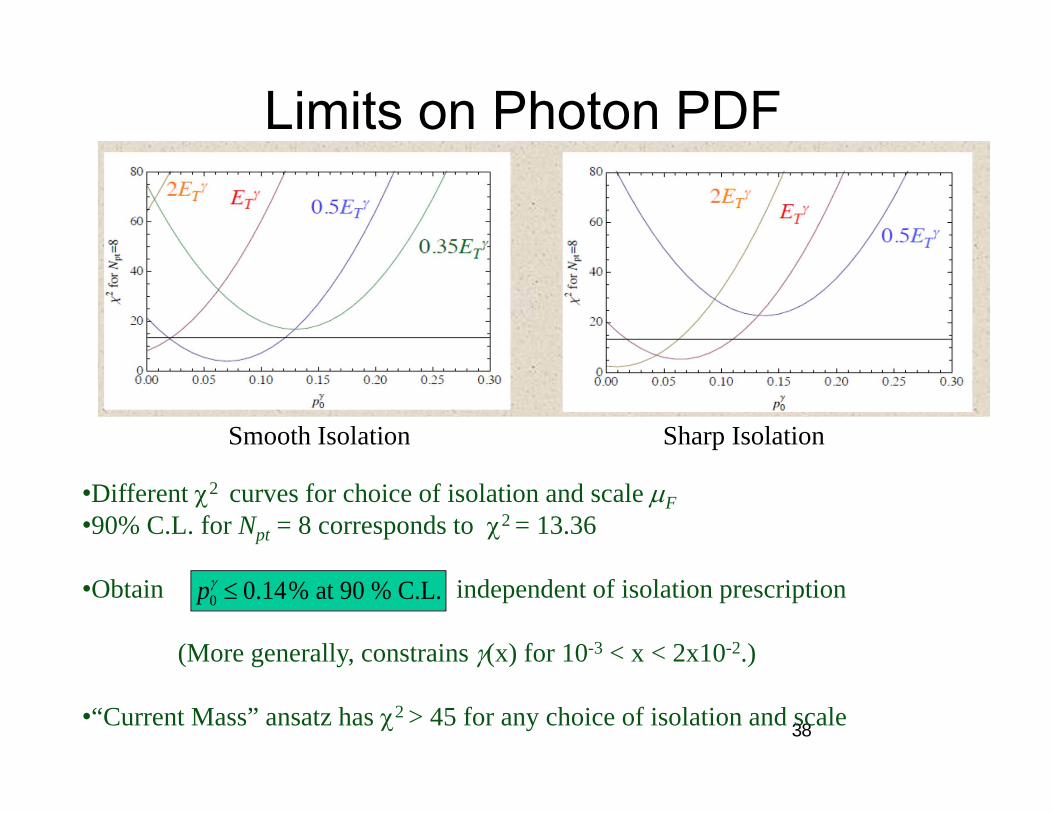
Limits on Photon PDF
38
Smooth Isolation Sharp Isolation
•Different 2 curves for choice of isolation and scale F•90% C.L. for Npt = 8 corresponds to 2 = 13.36
•Obtain independent of isolation prescription
(More generally, constrains (x) for 10-3 < x < 2x10⁻².)
•“Current Mass” ansatz has 2 > 45 for any choice of isolation and scale
p0 0.14% at 90 % C.L.
CT10, CT14, and LHC data
39
• We have since included early (7 TeV) LHC data: Atlas W/Z production and asymmetry at 7 TeV, Atlas single jet inclusive, CMS W asymmetry,
HERA FL and F2c
• New D0 (9.7 1/fb) W-electron rapidity asymmetry data.
• More flexible parametrization – gluon, d/u at large x and both, d/u and dbar/ubar at small x, strangeness, and s - sbar.
• Improvements modest so far, but expectation from ttbar, W/Z, Higgs, etc.
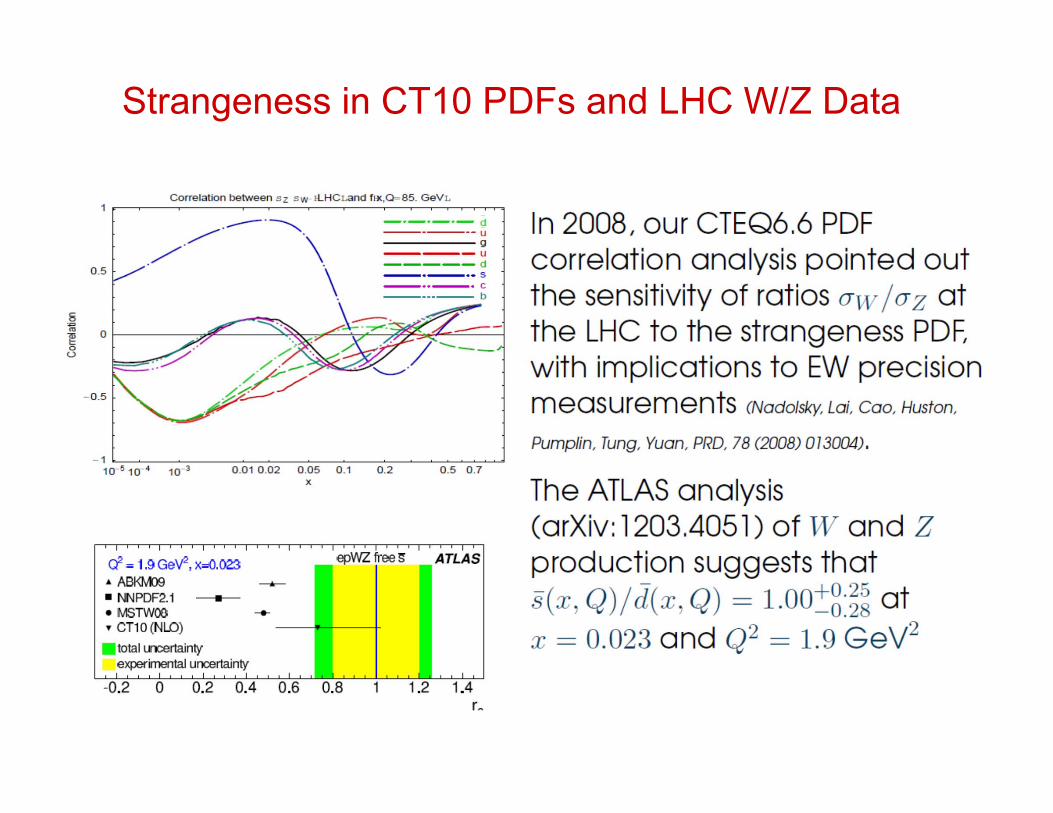
Strangeness in CT10 PDFs and LHC W/Z Data

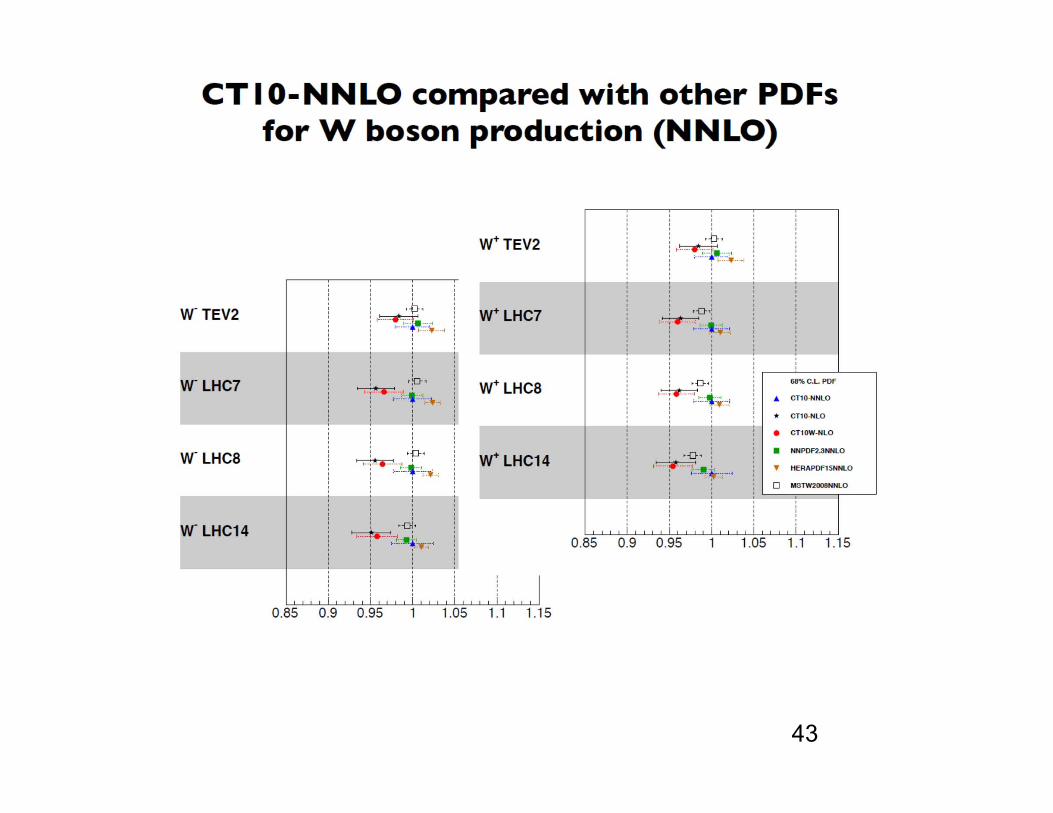
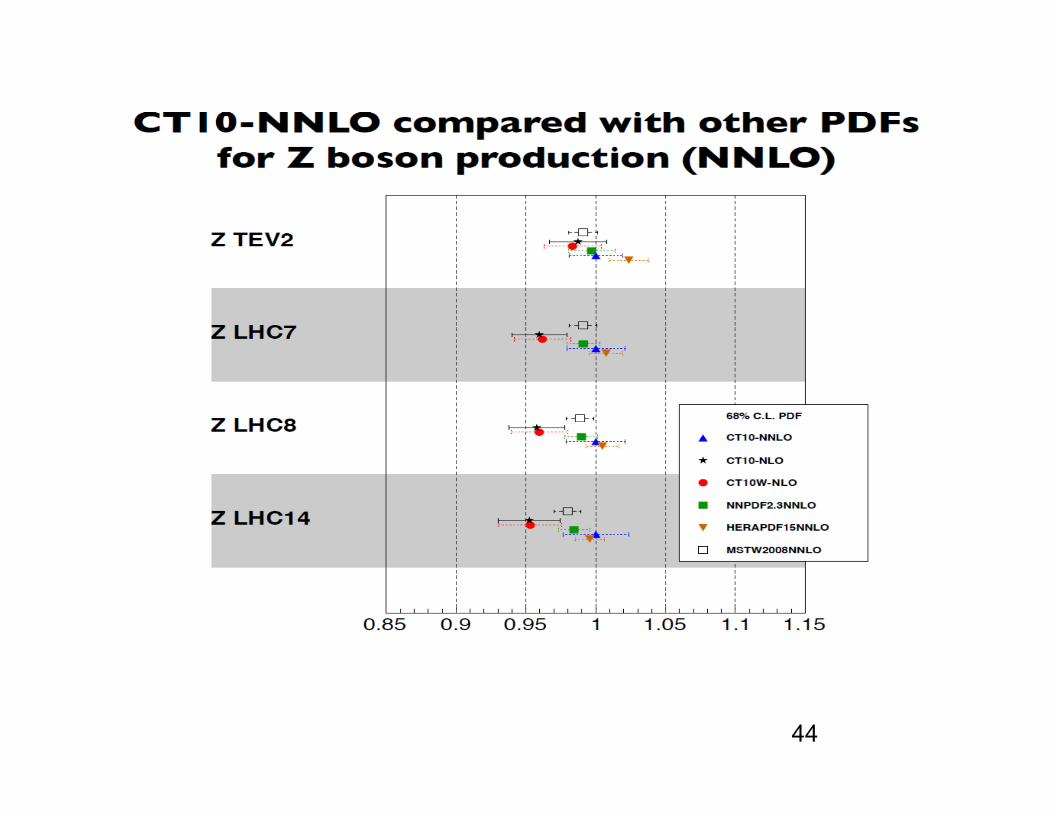
PDF Benchmarking:compared with other PDF global analysis
groups
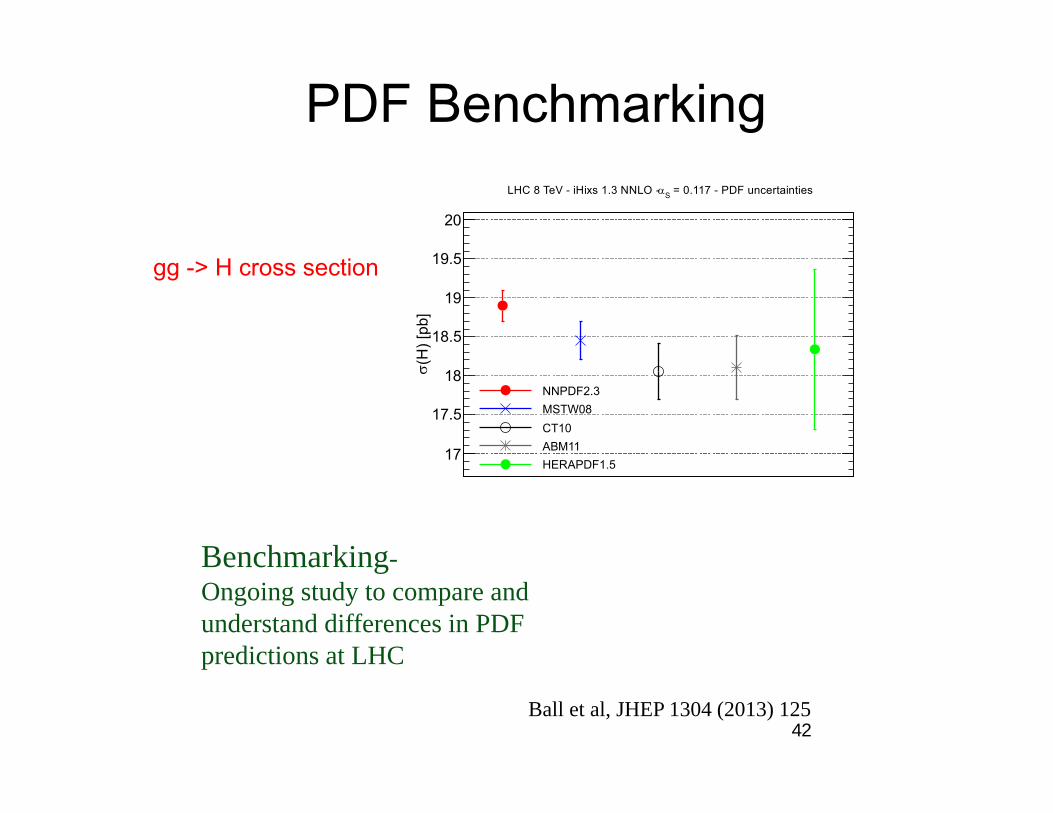
PDF Benchmarking
42
(H) [
pb]
17
17.5
18
18.5
19
19.5
20
= 0.117 - PDF uncertaintiesSLHC 8 TeV - iHixs 1.3 NNLO -
NNPDF2.3MSTW08CT10ABM11HERAPDF1.5
Benchmarking-Ongoing study to compare andunderstand differences in PDF predictions at LHC
Ball et al, JHEP 1304 (2013) 125
gg -> H cross section
43
44

PDFs for
Future Hadron Colliders
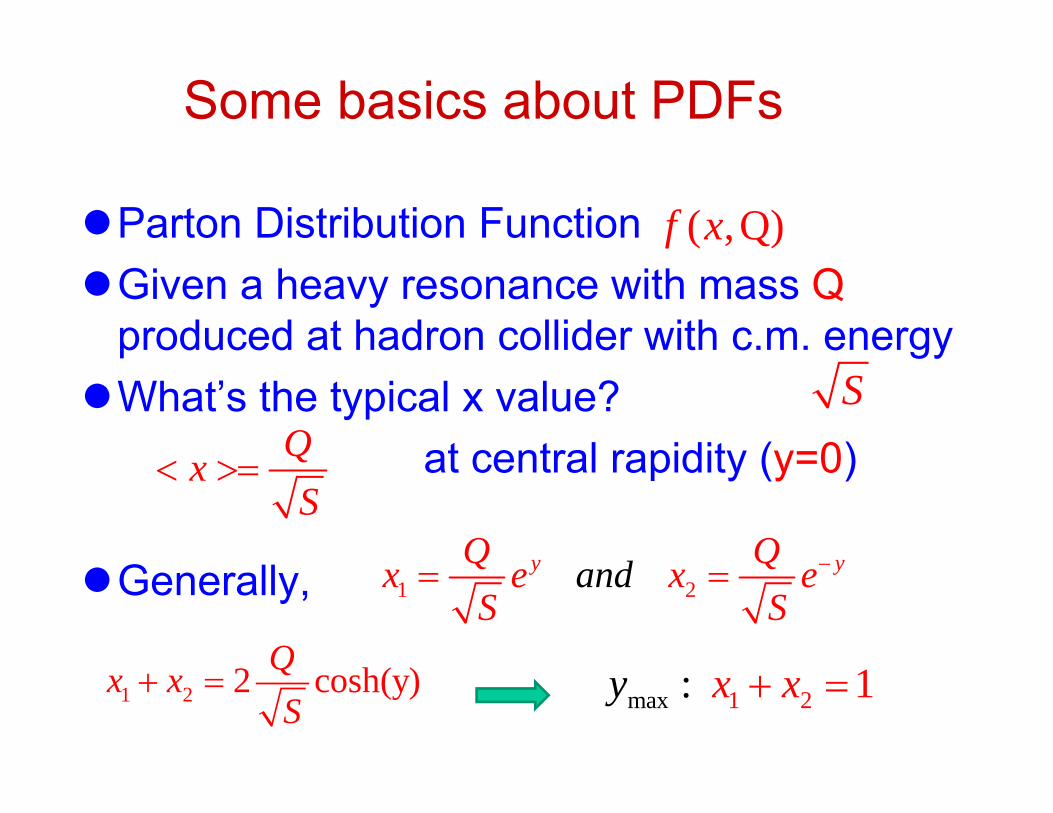
Some basics about PDFs
Parton Distribution Function Given a heavy resonance with mass Q
produced at hadron collider with c.m. energy What’s the typical x value?
at central rapidity (y=0)
Generally,
S
( ,Q)f x
QxS
1 2y yandQ Qx e x e
S S
1 2 2 cosh(y)Qx xS
1 2max : 1y x x

Kinematics of a 100 TeV SppC
• J. Rojo: kickoff meeting for FCC at CERN, Feb. 2014
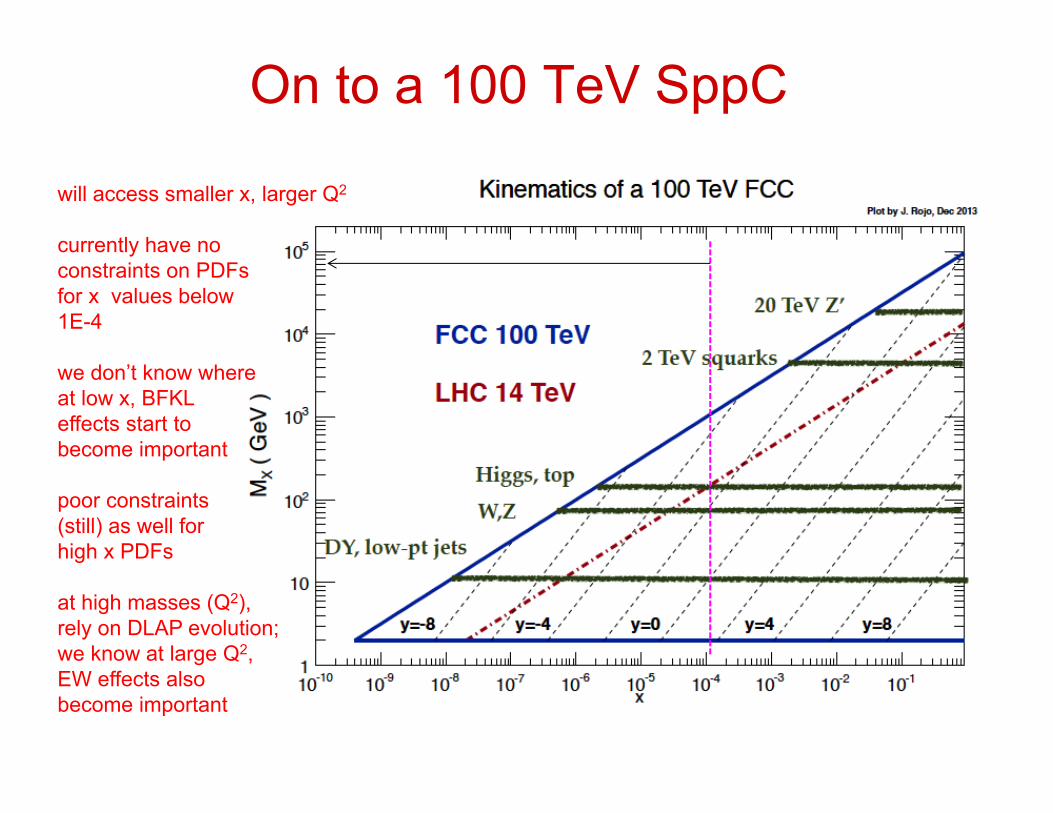
On to a 100 TeV SppC
will access smaller x, larger Q2
currently have no constraints on PDFsfor x values below1E-4
we don’t know whereat low x, BFKL effects start tobecome important
poor constraints (still) as well for high x PDFs
at high masses (Q2), rely on DLAP evolution; we know at large Q2,EW effects also become important

PDF luminosities1 2 1 2
2
1 2
2
( , ) ( , ) ( )
( , ) ( , ) ( )
( )
dx dx g x M g x M M
d dy g x M g x
dLdM
M M
dM M
PDF Luminosity
1 2
1
2
x x
1y ln2
xx
Top quark as a parton
For a 100 TeV SppC, top mass (172 GeV) can be ignored; top quark, just like bottom quark, can be a parton of proton. Top parton will take away some of the
momentum of proton, mostly, from gluon (at NLO). Need to use s-ACOT scheme to calculate
hard part matrix elements, to be consistent with CT10 PDFs.
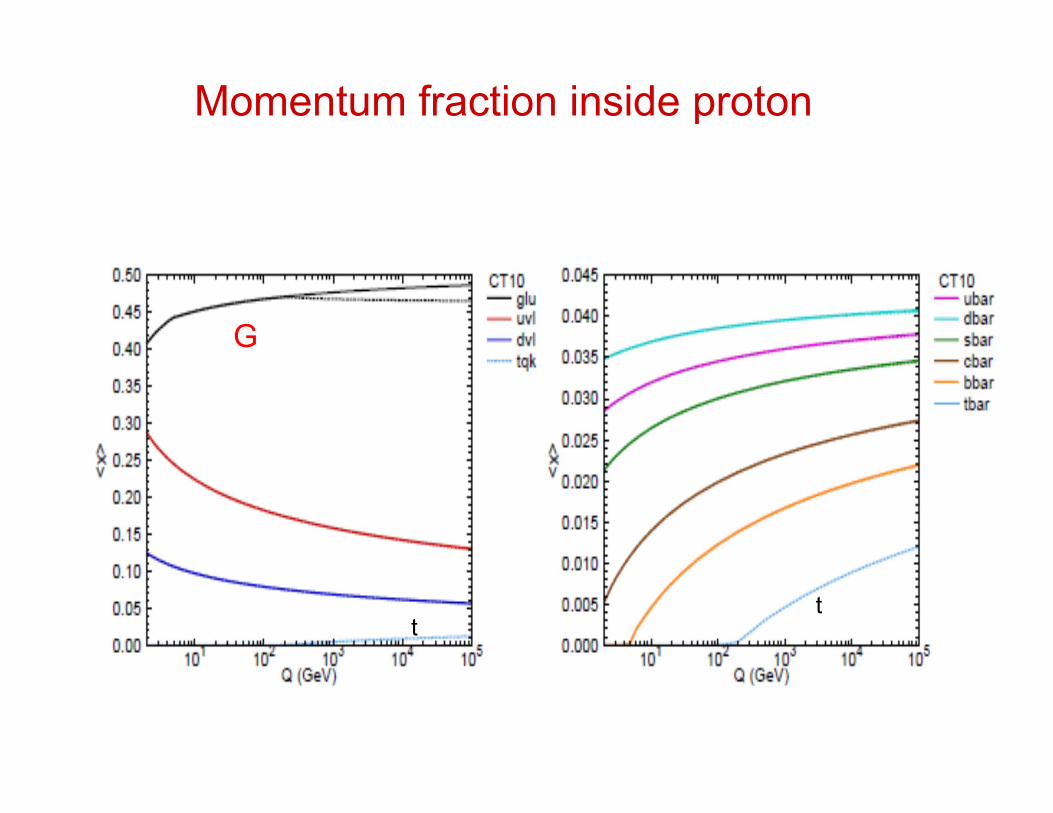
Momentum fraction inside proton
G
tt
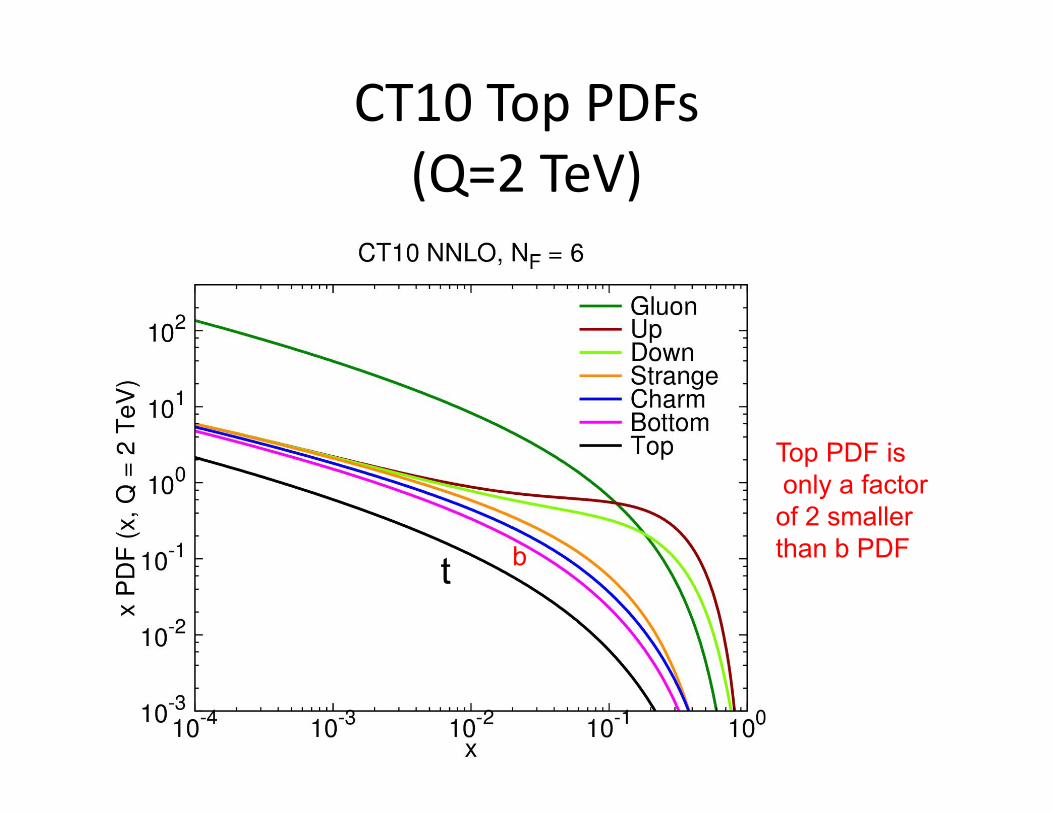
CT10 Top PDFs(Q=2 TeV)
Top PDF isonly a factorof 2 smaller than b PDF
t b
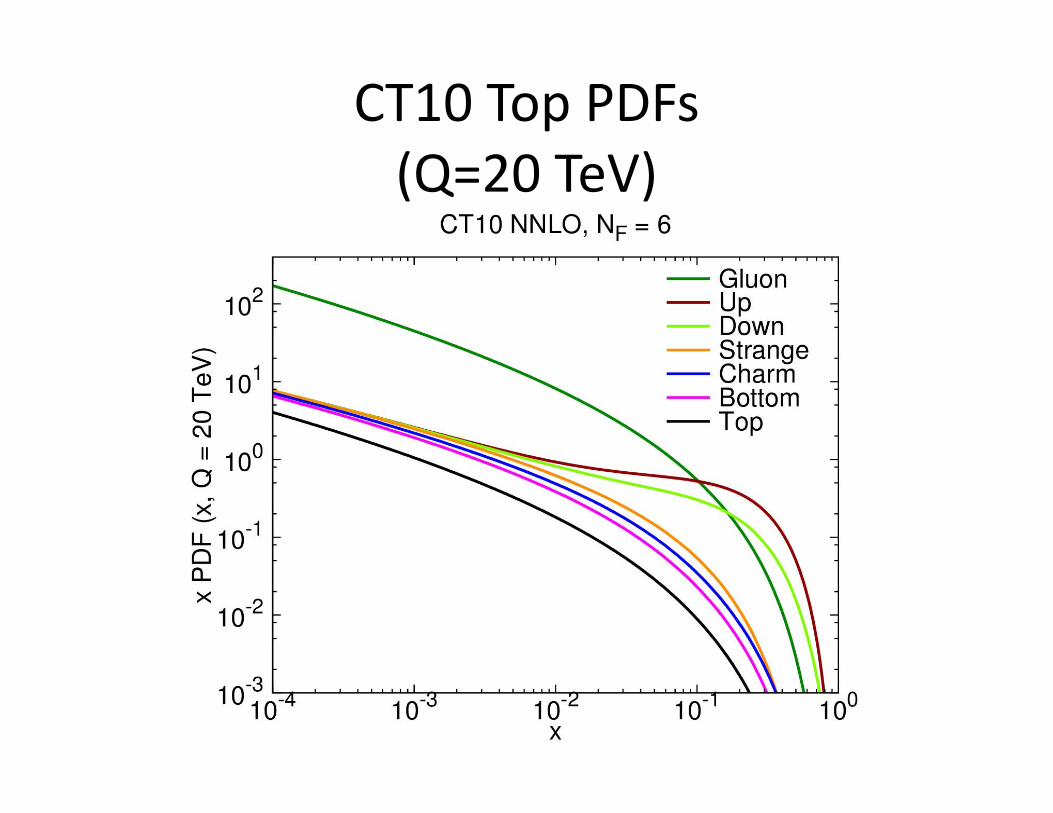
CT10 Top PDFs(Q=20 TeV)
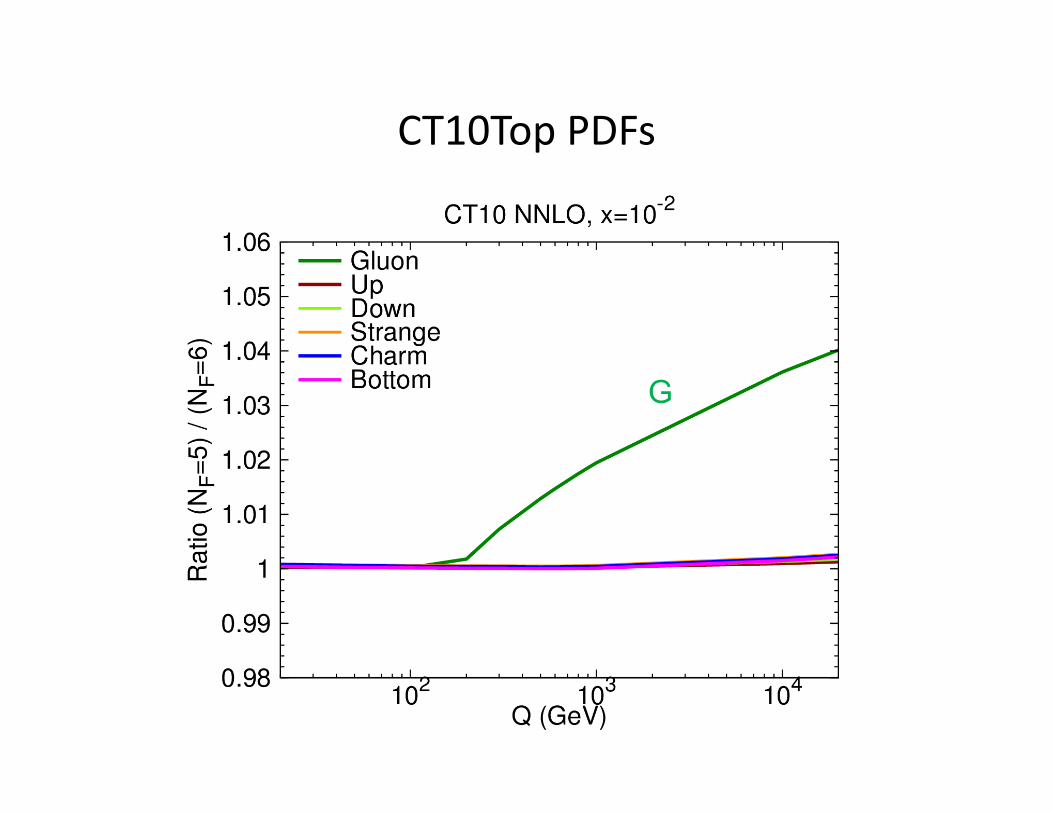
CT10Top PDFs
G
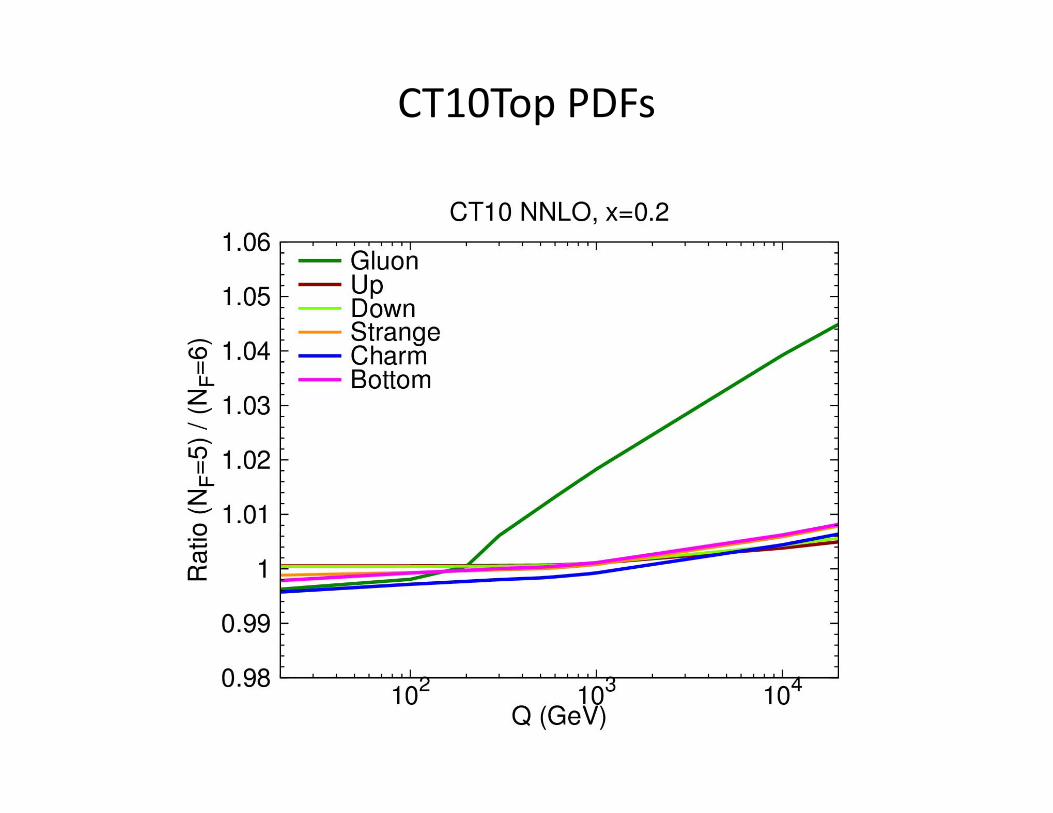
CT10Top PDFs

Hard part calculation
S-ACOT schemeExample: single-top production
Summary
PDFs have larger uncertainties in both small x and large x regions. PDFs will be further determined by LHC
data.Photon can be treated as a parton inside
proton. In a 100TeV SppC, top quark can be a
parton of proton, consistent hard part calculations are needed.