Embed Size (px)
Citation preview
Highlights • Partnerships filed more than 3.7 million returns for 2015, a
2.9-percent increase over the number filed for 2014. These returns represented 27.1 million partners, down 2.2 percent from the pre-vious year.
• Domestic limited liability companies (LLCs) made up the majority (67.7 percent) of all partnerships, surpassing all other entity types for the 14th consecutive year.
• Domestic limited partnerships represented only 11.0 percent of all partnerships, but reported the most profits (31.2 percent), and had the largest share of partners (44.1 percent).
• Real estate and rental and leasing accounted for about half (49.7 percent) of all partnerships and over a quarter (29.2 percent) of all partners. The Finance and insurance sector reported the largest shares of total net income (loss) (40.9 percent), total assets (55 per-cent), and total receipts (23.0 percent) for 2015.
• Total assets increased 4.7 percent between 2014 and 2015, from $26.1 trillion to $27.4 trillion. Nineteen out of twenty industrial sec-tors reported an increase.
• Receipts totaled $7.1 trillion for 2015, down 4.4 percent from the amount reported for 2014. Business receipts made up much of total receipts (68.3 percent), declining 5.9 percent for the year.
• Total net income (loss) or profits decreased 6.8 percent (from $837.4 billion to $780.5 billion) between 2014 and 2015. Ordinary business income accounted for the majority of this decrease.
• Between 2014 and 2015, total income (loss) minus total deductions available for allocation decreased from $1,722.5 billion to $1,607.3 billion. Partners classified as partnerships received the largest share of income (loss) allocated to partners, $542.9 billion.
SOI has published partnership data annually since 1957A partnership is the relationship between two or more persons who join to carry on a trade or business. Each person contributes money, property, labor, or skill with the expectation of sharing in the profits and losses of the business, regardless of whether a formal partnership agreement was made. Every partnership that engages in trade or business, or has income from sources in the United States, must file an annual information return with the Internal Revenue Service, either Form 1065, U.S. Partnership Return of Income, or Form 1065-B, U.S. Return of Income for Electing Large Partnerships.
The IRS Statistics of Income (SOI) Division has published part-nership data annually since 1957. Prior to that, SOI published fi-nancial data for 1939, 1946, 1947, and 1953 only. SOI individual income tax statistics show the number of returns with income or loss from partnerships, and the corresponding amounts, starting with 1917.
The number of partnerships grew 2.9 percent (from 3,611,255 to 3,715,187) between 2014 and 2015 (Figure B). Since 2006, the number of partnerships has grown at an average annual rate of 3.0 percent. Partnerships classified as limited liability compa-nies (LLCs) accounted for the majority of this growth.2
The number of partners declined for the first time since 2003, dropping 2.2 percent (from 27,714,478 to 27,093,015) between 2014 and 2015. Partnerships with less than 3 partners made up more than half (55.0 percent) of all partnerships (Figure C). These same-sized partnerships accounted for just over a quar-ter (25.6 percent) of all partnerships with total assets of $100 million or more. Despite the large portion of partnerships with less than 3 partners, partnerships with 100 or more partners ac-counted for just under half (44.5 percent) of all partners in 2015.
(1) (2) (3) (4) (5)2006 6.6 3.2 24.8 12.5 22.1 2007 5.1 10.7 18.9 14.9 2.5 2008 1.6 4.2 -5.5 -0.3 -33.0 2009 0.7 9.5 -2.4 -18.1 -10.5 2010 2.5 6.1 5.4 14.3 44.9 2011 1.1 8.7 3.8 9.8 -2.2 2012 3.1 3.9 7.0 9.4 33.9 2013 2.1 8.5 9.8 7.1 -1.2 2014 4.4 0.8 8.1 5.6 9.0 2015 2.9 -2.2 4.7 -4.4 -6.8 SOURCE: IRS, Statistics of Income Division, Partnerships, August 2017.
Total net income(loss)
Taxyear
Totalassets
Totalreceipts
Number of partnerships
Number of partners
Figure A
1 This article references Tax Year 2014 data. For further information on these data, see Ron DeCarlo and Nina Shumofsky, “Partnership Returns, Tax Year 2014,” Statistics of Income Bulletin, Fall 2016, Volume 36, Number 2.2 See the “Explanation of Selected Terms” section for more information on LLCs.
w w w . i r s . g o v / t a x s t a t sStatistics of Income Bulletin | Spring 2018
Partnership Returns, Tax Year 2015By Ron DeCarlo and Nina Shumofsky
T he number of partnerships and partners in the United States continued to increase for Tax Year 2015. Partnerships filed more than 3.7 million informational returns for the year,
representing more than 27 million partners. The Real estate and rental and leasing sector contained just under half of all part-nerships (49.7 percent) and over a quarter of all partners (29.2 percent).
Total assets increased in 2015 compared to the prior year while total receipts and total net income (loss) declined (Figure A).1 The Finance and insurance sector accounted for the largest portion of each of these three critical financial figures.
Figure APartnership Returns: Percentage Changes in Selected Items,Tax Years 2006–2015

3 For further discussion of passthrough income, see the section of the article entitled “Partnerships allocated more than $1.6 trillion to their partners in 2015.”
(1) (2) (3) (4) (5) (6)Number of partnerships, total 3,715,187 27,707 0.7 27,093,015 10,206,445 37.7 Number of partners per partnership: Less than 3 2,046,500 7,088 0.3 4,092,846 14,170 0.3 3 less than 5 1,027,626 5,883 0.6 3,460,914 19,626 0.6 5 less than 10 414,906 3,796 0.9 2,566,215 24,852 1.0 10 less than 20 127,761 2,551 2.0 1,727,249 35,115 2.0 20 less than 30 47,263 1,469 3.1 1,117,934 35,472 3.2 30 less than 40 16,646 1,107 6.6 593,394 37,896 6.4 40 less than 50 9,324 813 8.7 419,119 35,974 8.6 50 less than 60 4,696 671 14.3 257,199 36,481 14.2 60 less than 70 3,841 508 13.2 243,564 32,683 13.4 70 less than 80 4,133 520 12.6 302,769 38,682 12.8 80 less than 90 1,562 335 21.5 131,345 28,356 21.6 90 less than 100 1,239 316 25.5 116,832 29,996 25.7 100 or greater 9,690 2,648 27.3 12,063,634 9,837,139 81.5 1,000 or greater [1] 407 248 60.9 10,295,020 9,254,906 89.9
Number of partners per partnership Total number of partnerships
Partnerships with $100,000,000 or more in assets
Number of partnerships
Percentageof total
Total number of partners
Partnerships with $100,000,000 or more in assets
Number of partners
Percentageof total
[1] These statistics are also included on the line entitled “100 or greater.”NOTE: Detail may not add to totals because of rounding.SOURCE: IRS, Statistics of Income Division, Partnerships, August 2017.
Partnerships do not pay taxes on their income, but “pass through” any profits and losses to their partners, who must in-clude those profits and losses on their income tax returns. For 2015, partnerships passed through $1,607.3 billion in total income (loss) minus total deductions available for allocation to their partners (Table 5). This amount represents a 6.7-percent
decline from 2014 when partnerships passed through $1,722.5 billion. The Finance and insurance sector accounted both for the largest amount reported and the biggest change in passthrough dollars, decreasing $178.0 billion to $913.5 billion for 2015. For the fourth consecutive year, partners who are partnerships re-ceived the largest portion of this income for 2015.3
2
Partnership Returns, Tax Year 2015
Spring 2018Statistics of Income Bulletin
Figure BPartnership Returns: Number of Partnerships and Partners, by Selected Industrial Group, Tax Years 2014–2105
(1) (2) (3) (4) (5) (6)
All industries 3,611,255 3,715,187 2.9 27,714,478 27,093,015 -2.2 Finance and insurance 334,546 358,416 7.1 6,634,114 6,189,038 -6.7
Securities, commodity contracts, and other financial investments and related activities 254,206 274,604 8.0 5,163,383 5,555,048 7.6 Securities and commodity contracts and exchanges 10,369 7,206 -30.5 375,341 478,907 27.6 Other financial investment activities 243,837 267,398 9.7 4,788,042 5,076,141 6.0 Funds, trusts and other financial vehicles 44,434 49,526 11.5 1,275,532 421,816 -66.9 Other finance and insurance 35,905 34,285 -4.5 195,199 212,175 8.7 Real estate and rental and leasing 1,816,889 1,846,071 1.6 7,887,184 7,914,900 0.4 Real estate 1,781,949 1,811,793 1.7 7,577,856 7,782,932 2.7
Lessors of residential buildings and dwellings and cooperative housing 605,322 635,165 4.9 2,548,073 2,765,271 8.5 Lessors of nonresidential buildings (except miniwarehouses) 726,353 707,032 -2.7 2,890,074 2,759,951 -4.5 Lessors of miniwarehouses and self-storage units 18,525 17,422 -6.0 69,206 71,821 3.8 Lessors of other real estate property 108,373 110,412 1.9 485,239 495,761 2.2 Other real estate activities 323,377 341,761 5.7 1,585,263 1,690,129 6.6
Rental and leasing services and lessors of nonfinancial intangible assets (except copyrighted works) 34,940 34,278 -1.9 309,329 131,968 -57.3
Industrial group
NOTES: Detail may not add to totals because of rounding. For data on additional industries, see Table 10.SOURCE: IRS, Statistics of Income Division, Partnerships, August 2017.
Number of partnershipsPercentage
change
Number of partnersPercentage
change2014 2015 2014 2015
Figure CPartnership Returns: Number of Partnerships and Partners, by Number of Partners per Partnership, Tax Year 2015
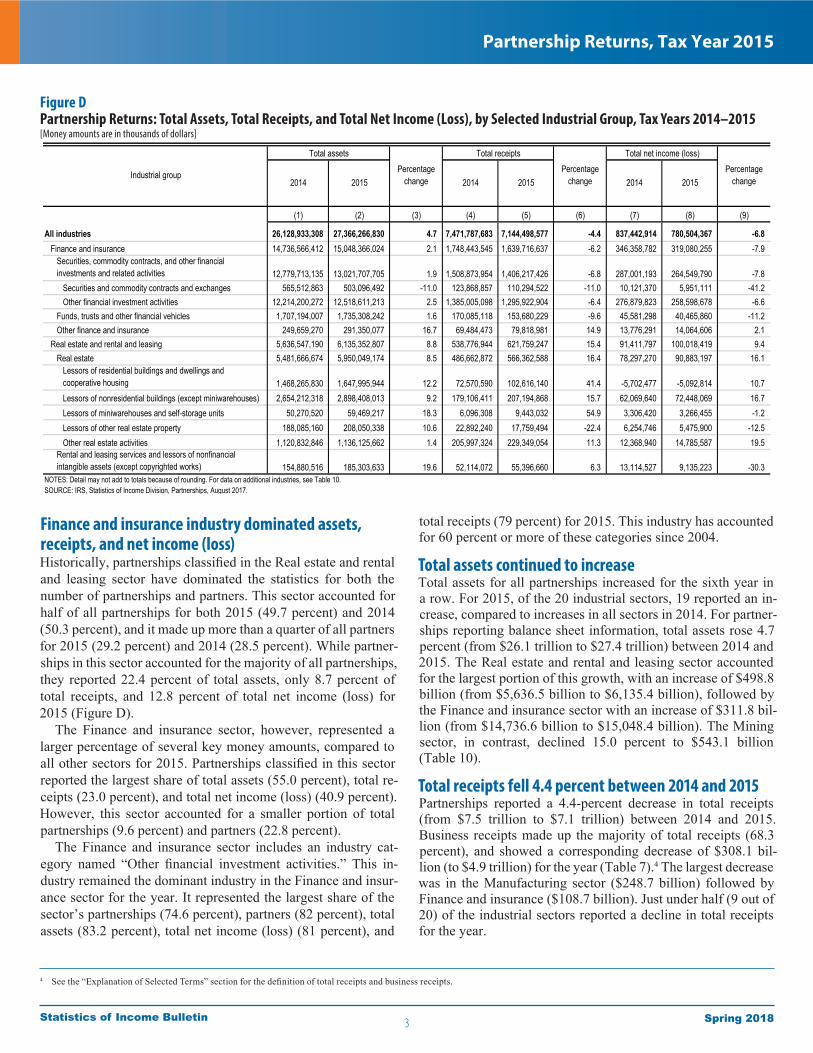
Finance and insurance industry dominated assets, receipts, and net income (loss)Historically, partnerships classified in the Real estate and rental and leasing sector have dominated the statistics for both the number of partnerships and partners. This sector accounted for half of all partnerships for both 2015 (49.7 percent) and 2014 (50.3 percent), and it made up more than a quarter of all partners for 2015 (29.2 percent) and 2014 (28.5 percent). While partner-ships in this sector accounted for the majority of all partnerships, they reported 22.4 percent of total assets, only 8.7 percent of total receipts, and 12.8 percent of total net income (loss) for 2015 (Figure D).
The Finance and insurance sector, however, represented a larger percentage of several key money amounts, compared to all other sectors for 2015. Partnerships classified in this sector reported the largest share of total assets (55.0 percent), total re-ceipts (23.0 percent), and total net income (loss) (40.9 percent). However, this sector accounted for a smaller portion of total partnerships (9.6 percent) and partners (22.8 percent).
The Finance and insurance sector includes an industry cat-egory named “Other financial investment activities.” This in-dustry remained the dominant industry in the Finance and insur-ance sector for the year. It represented the largest share of the sector’s partnerships (74.6 percent), partners (82 percent), total assets (83.2 percent), total net income (loss) (81 percent), and
total receipts (79 percent) for 2015. This industry has accounted for 60 percent or more of these categories since 2004.
Total assets continued to increaseTotal assets for all partnerships increased for the sixth year in a row. For 2015, of the 20 industrial sectors, 19 reported an in-crease, compared to increases in all sectors in 2014. For partner-ships reporting balance sheet information, total assets rose 4.7 percent (from $26.1 trillion to $27.4 trillion) between 2014 and 2015. The Real estate and rental and leasing sector accounted for the largest portion of this growth, with an increase of $498.8 billion (from $5,636.5 billion to $6,135.4 billion), followed by the Finance and insurance sector with an increase of $311.8 bil-lion (from $14,736.6 billion to $15,048.4 billion). The Mining sector, in contrast, declined 15.0 percent to $543.1 billion (Table 10).
Total receipts fell 4.4 percent between 2014 and 2015Partnerships reported a 4.4-percent decrease in total receipts (from $7.5 trillion to $7.1 trillion) between 2014 and 2015. Business receipts made up the majority of total receipts (68.3 percent), and showed a corresponding decrease of $308.1 bil-lion (to $4.9 trillion) for the year (Table 7).4 The largest decrease was in the Manufacturing sector ($248.7 billion) followed by Finance and insurance ($108.7 billion). Just under half (9 out of 20) of the industrial sectors reported a decline in total receipts for the year.
Figure DPartnership Returns: Total Assets, Total Receipts, and Total Net Income (Loss), by Selected Industrial Group, Tax Years 2014–2015[Money amounts are in thousands of dollars]
(1) (2) (3) (4) (5) (6) (7) (8) (9)
All industries 26,128,933,308 27,366,266,830 4.7 7,471,787,683 7,144,498,577 -4.4 837,442,914 780,504,367 -6.8 Finance and insurance 14,736,566,412 15,048,366,024 2.1 1,748,443,545 1,639,716,637 -6.2 346,358,782 319,080,255 -7.9 Securities, commodity contracts, and other financial investments and related activities 12,779,713,135 13,021,707,705 1.9 1,508,873,954 1,406,217,426 -6.8 287,001,193 264,549,790 -7.8 Securities and commodity contracts and exchanges 565,512,863 503,096,492 -11.0 123,868,857 110,294,522 -11.0 10,121,370 5,951,111 -41.2 Other financial investment activities 12,214,200,272 12,518,611,213 2.5 1,385,005,098 1,295,922,904 -6.4 276,879,823 258,598,678 -6.6 Funds, trusts and other financial vehicles 1,707,194,007 1,735,308,242 1.6 170,085,118 153,680,229 -9.6 45,581,298 40,465,860 -11.2 Other finance and insurance 249,659,270 291,350,077 16.7 69,484,473 79,818,981 14.9 13,776,291 14,064,606 2.1 Real estate and rental and leasing 5,636,547,190 6,135,352,807 8.8 538,776,944 621,759,247 15.4 91,411,797 100,018,419 9.4 Real estate 5,481,666,674 5,950,049,174 8.5 486,662,872 566,362,588 16.4 78,297,270 90,883,197 16.1 Lessors of residential buildings and dwellings and cooperative housing 1,468,265,830 1,647,995,944 12.2 72,570,590 102,616,140 41.4 -5,702,477 -5,092,814 10.7 Lessors of nonresidential buildings (except miniwarehouses) 2,654,212,318 2,898,408,013 9.2 179,106,411 207,194,868 15.7 62,069,640 72,448,069 16.7 Lessors of miniwarehouses and self-storage units 50,270,520 59,469,217 18.3 6,096,308 9,443,032 54.9 3,306,420 3,266,455 -1.2 Lessors of other real estate property 188,085,160 208,050,338 10.6 22,892,240 17,759,494 -22.4 6,254,746 5,475,900 -12.5 Other real estate activities 1,120,832,846 1,136,125,662 1.4 205,997,324 229,349,054 11.3 12,368,940 14,785,587 19.5 Rental and leasing services and lessors of nonfinancial intangible assets (except copyrighted works) 154,880,516 185,303,633 19.6 52,114,072 55,396,660 6.3 13,114,527 9,135,223 -30.3
2015 2014 2015
NOTES: Detail may not add to totals because of rounding. For data on additional industries, see Table 10.SOURCE: IRS, Statistics of Income Division, Partnerships, August 2017.
Industrial group
Total assets
Percentagechange
Total receipts
Percentagechange
Total net income (loss)
Percentagechange2014 2015 2014
4 See the “Explanation of Selected Terms” section for the definition of total receipts and business receipts.
3
Partnership Returns, Tax Year 2015
Spring 2018Statistics of Income Bulletin
05001,0001,5002,0002,5003,0003,5004,0004,5005,0005,5006,0006,5007,000
-400
-300
-200
-100
0
100
200
300
400
500
600
2006 2007 2008 2009 2010 2011 2012 2013 2014 2015Tax year
Net income Net loss# of partnerships with income # of partnerships with loss# of partners with Income # of partners with loss
Number (in thousands)
NOTE: For the full tabular data represented in this figure, see Tables 9a, 9b, and 9c.SOURCE: IRS, Statistics of Income Division, Partnerships, August 2017.
Current dollars (in billions)
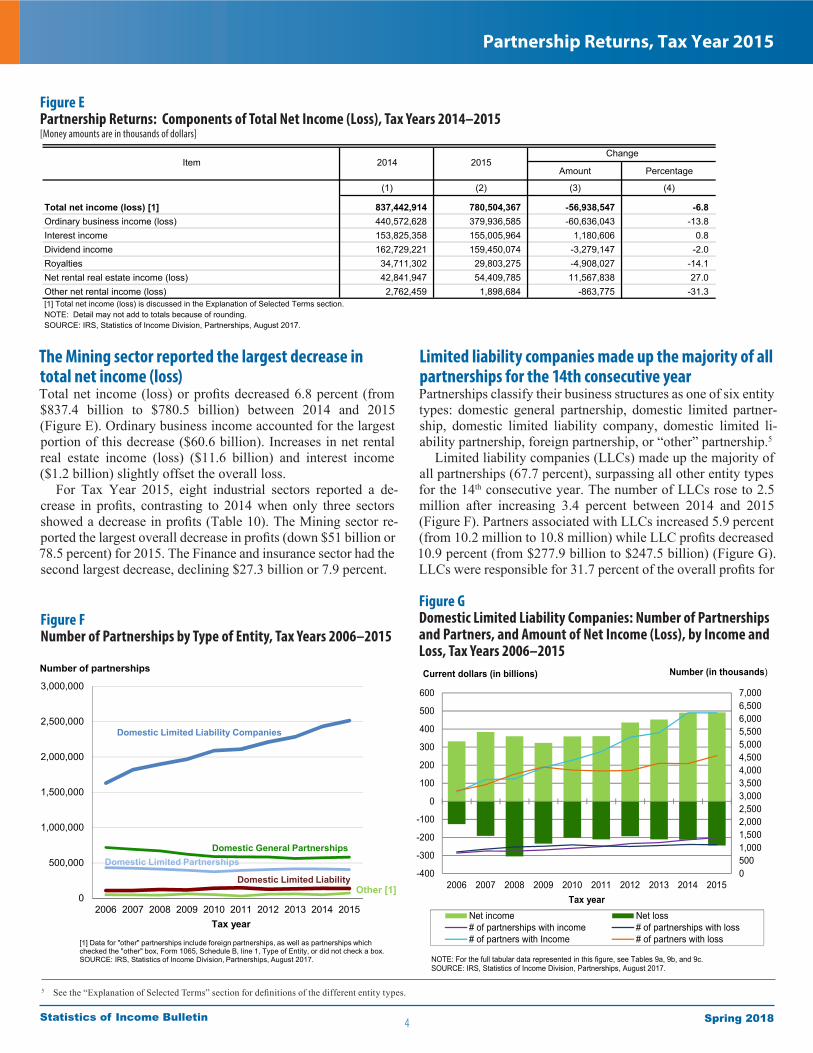
The Mining sector reported the largest decrease in total net income (loss)Total net income (loss) or profits decreased 6.8 percent (from $837.4 billion to $780.5 billion) between 2014 and 2015 (Figure E). Ordinary business income accounted for the largest portion of this decrease ($60.6 billion). Increases in net rental real estate income (loss) ($11.6 billion) and interest income ($1.2 billion) slightly offset the overall loss.
For Tax Year 2015, eight industrial sectors reported a de-crease in profits, contrasting to 2014 when only three sectors showed a decrease in profits (Table 10). The Mining sector re-ported the largest overall decrease in profits (down $51 billion or 78.5 percent) for 2015. The Finance and insurance sector had the second largest decrease, declining $27.3 billion or 7.9 percent.
Limited liability companies made up the majority of all partnerships for the 14th consecutive yearPartnerships classify their business structures as one of six entity types: domestic general partnership, domestic limited partner-ship, domestic limited liability company, domestic limited li-ability partnership, foreign partnership, or “other” partnership.5
Limited liability companies (LLCs) made up the majority of all partnerships (67.7 percent), surpassing all other entity types for the 14th consecutive year. The number of LLCs rose to 2.5 million after increasing 3.4 percent between 2014 and 2015 (Figure F). Partners associated with LLCs increased 5.9 percent (from 10.2 million to 10.8 million) while LLC profits decreased 10.9 percent (from $277.9 billion to $247.5 billion) (Figure G). LLCs were responsible for 31.7 percent of the overall profits for
Figure EPartnership Returns: Components of Total Net Income (Loss), Tax Years 2014–2015[Money amounts are in thousands of dollars]
Amount Percentage
(1) (2) (3) (4)
Total net income (loss) [1] 837,442,914 780,504,367 -56,938,547 -6.8 Ordinary business income (loss) 440,572,628 379,936,585 -60,636,043 -13.8 Interest income 153,825,358 155,005,964 1,180,606 0.8 Dividend income 162,729,221 159,450,074 -3,279,147 -2.0 Royalties 34,711,302 29,803,275 -4,908,027 -14.1 Net rental real estate income (loss) 42,841,947 54,409,785 11,567,838 27.0 Other net rental income (loss) 2,762,459 1,898,684 -863,775 -31.3
Item 2014 2015Change
[1] Total net income (loss) is discussed in the Explanation of Selected Terms section.NOTE: Detail may not add to totals because of rounding.SOURCE: IRS, Statistics of Income Division, Partnerships, August 2017.
Figure GDomestic Limited Liability Companies: Number of Partnerships and Partners, and Amount of Net Income (Loss), by Income and Loss, Tax Years 2006–2015
5 See the “Explanation of Selected Terms” section for definitions of the different entity types.
0
500,000
1,000,000
1,500,000
2,000,000
2,500,000
3,000,000
2006 2007 2008 2009 2010 2011 2012 2013 2014 2015Tax year
[1] Data for "other" partnerships include foreign partnerships, as well as partnerships which checked the "other" box, Form 1065, Schedule B, line 1, Type of Entity, or did not check a box. SOURCE: IRS, Statistics of Income Division, Partnerships, August 2017.
Domestic Limited Liability Companies
Domestic General PartnershipsDomestic Limited Partnerships
Domestic Limited Liability
Number of partnerships
Other [1]
4
Partnership Returns, Tax Year 2015
Spring 2018Statistics of Income Bulletin
Figure FNumber of Partnerships by Type of Entity, Tax Years 2006–2015
0
500
1,000
1,500
2,000
2,500
-40
-20
0
20
40
60
80
100
120
2006 2007 2008 2009 2010 2011 2012 2013 2014 2015
Tax year
Net income Net loss# of partnerships with income # of partnerships with loss# of partners with income # of partners with loss
NOTE: For the full tabular data represented in this figure, see Tables 9a, 9b, and 9c.SOURCE: IRS, Statistics of Income Division, Partnerships, August 2017.
Current dollars (in billions) Number (in thousands)
all partnerships for 2015, a decrease from 33.2 percent in 2014. Looking at gains and losses separately, the losses for LLCs ($245.0 billion) were more than double the combined losses for all other types of partnerships ($112.0 billion) and reduced the net profit amount for partnerships overall.
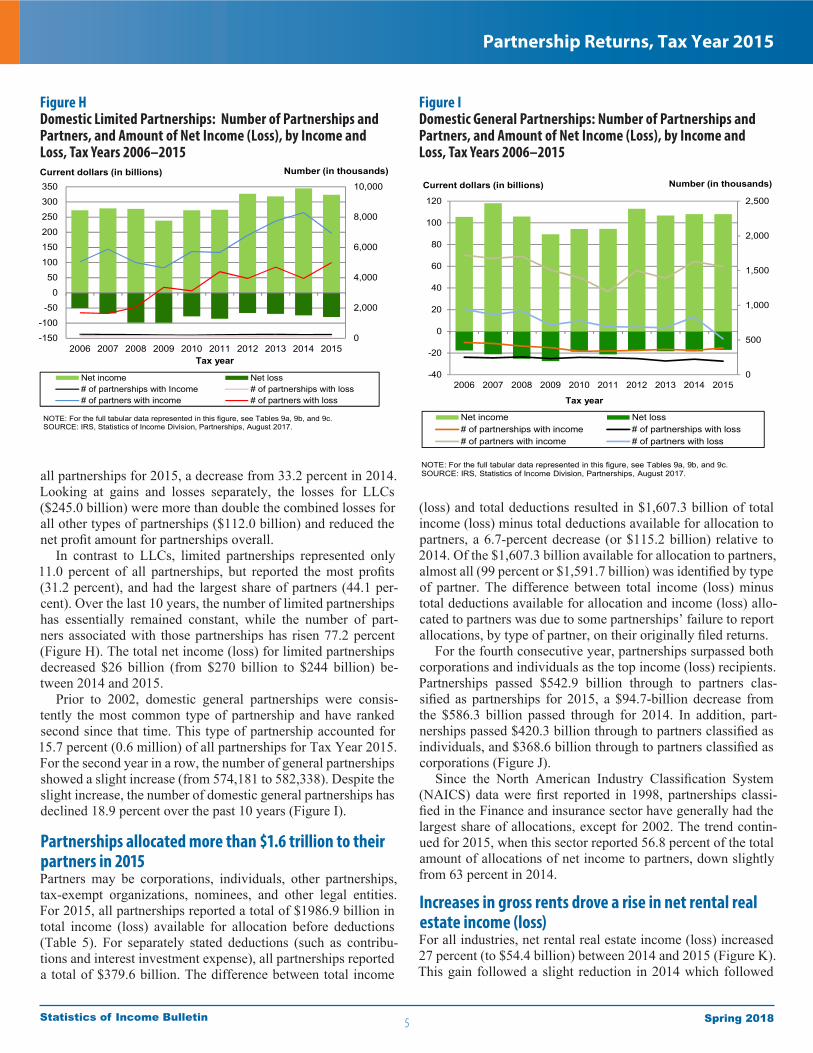
In contrast to LLCs, limited partnerships represented only 11.0 percent of all partnerships, but reported the most profits (31.2 percent), and had the largest share of partners (44.1 per-cent). Over the last 10 years, the number of limited partnerships has essentially remained constant, while the number of part-ners associated with those partnerships has risen 77.2 percent (Figure H). The total net income (loss) for limited partnerships decreased $26 billion (from $270 billion to $244 billion) be-tween 2014 and 2015.
Prior to 2002, domestic general partnerships were consis-tently the most common type of partnership and have ranked second since that time. This type of partnership accounted for 15.7 percent (0.6 million) of all partnerships for Tax Year 2015. For the second year in a row, the number of general partnerships showed a slight increase (from 574,181 to 582,338). Despite the slight increase, the number of domestic general partnerships has declined 18.9 percent over the past 10 years (Figure I).
Partnerships allocated more than $1.6 trillion to their partners in 2015Partners may be corporations, individuals, other partnerships, tax-exempt organizations, nominees, and other legal entities. For 2015, all partnerships reported a total of $1986.9 billion in total income (loss) available for allocation before deductions (Table 5). For separately stated deductions (such as contribu-tions and interest investment expense), all partnerships reported a total of $379.6 billion. The difference between total income
(loss) and total deductions resulted in $1,607.3 billion of total income (loss) minus total deductions available for allocation to partners, a 6.7-percent decrease (or $115.2 billion) relative to 2014. Of the $1,607.3 billion available for allocation to partners, almost all (99 percent or $1,591.7 billion) was identified by type of partner. The difference between total income (loss) minus total deductions available for allocation and income (loss) allo-cated to partners was due to some partnerships’ failure to report allocations, by type of partner, on their originally filed returns.
For the fourth consecutive year, partnerships surpassed both corporations and individuals as the top income (loss) recipients. Partnerships passed $542.9 billion through to partners clas-sified as partnerships for 2015, a $94.7-billion decrease from the $586.3 billion passed through for 2014. In addition, part-nerships passed $420.3 billion through to partners classified as individuals, and $368.6 billion through to partners classified as corporations (Figure J).
Since the North American Industry Classification System (NAICS) data were first reported in 1998, partnerships classi-fied in the Finance and insurance sector have generally had the largest share of allocations, except for 2002. The trend contin-ued for 2015, when this sector reported 56.8 percent of the total amount of allocations of net income to partners, down slightly from 63 percent in 2014.
Increases in gross rents drove a rise in net rental real estate income (loss)For all industries, net rental real estate income (loss) increased 27 percent (to $54.4 billion) between 2014 and 2015 (Figure K). This gain followed a slight reduction in 2014 which followed
0
2,000
4,000
6,000
8,000
10,000
-150
-100
-50
0
50
100
150
200
250
300
350
2006 2007 2008 2009 2010 2011 2012 2013 2014 2015Tax year
Net income Net loss# of partnerships with Income # of partnerships with loss# of partners with income # of partners with loss
NOTE: For the full tabular data represented in this figure, see Tables 9a, 9b, and 9c.SOURCE: IRS, Statistics of Income Division, Partnerships, August 2017.
Current dollars (in billions) Number (in thousands)
Figure HDomestic Limited Partnerships: Number of Partnerships and Partners, and Amount of Net Income (Loss), by Income and Loss, Tax Years 2006–2015
Figure IDomestic General Partnerships: Number of Partnerships and Partners, and Amount of Net Income (Loss), by Income and Loss, Tax Years 2006–2015
5
Partnership Returns, Tax Year 2015
Spring 2018Statistics of Income Bulletin
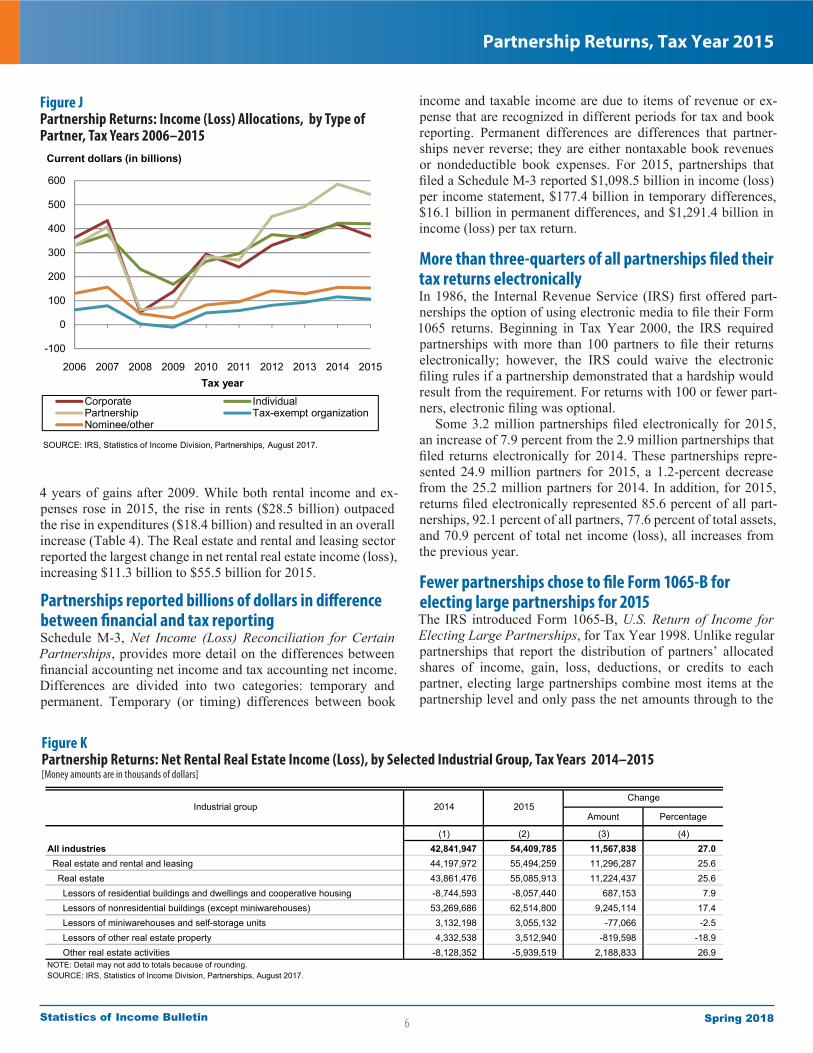
4 years of gains after 2009. While both rental income and ex-penses rose in 2015, the rise in rents ($28.5 billion) outpaced the rise in expenditures ($18.4 billion) and resulted in an overall increase (Table 4). The Real estate and rental and leasing sector reported the largest change in net rental real estate income (loss), increasing $11.3 billion to $55.5 billion for 2015.
Partnerships reported billions of dollars in difference between financial and tax reportingSchedule M-3, Net Income (Loss) Reconciliation for Certain Partnerships, provides more detail on the differences between financial accounting net income and tax accounting net income. Differences are divided into two categories: temporary and permanent. Temporary (or timing) differences between book
income and taxable income are due to items of revenue or ex-pense that are recognized in different periods for tax and book reporting. Permanent differences are differences that partner-ships never reverse; they are either nontaxable book revenues or nondeductible book expenses. For 2015, partnerships that filed a Schedule M-3 reported $1,098.5 billion in income (loss) per income statement, $177.4 billion in temporary differences, $16.1 billion in permanent differences, and $1,291.4 billion in income (loss) per tax return.
More than three-quarters of all partnerships filed their tax returns electronically In 1986, the Internal Revenue Service (IRS) first offered part-nerships the option of using electronic media to file their Form 1065 returns. Beginning in Tax Year 2000, the IRS required partnerships with more than 100 partners to file their returns electronically; however, the IRS could waive the electronic filing rules if a partnership demonstrated that a hardship would result from the requirement. For returns with 100 or fewer part-ners, electronic filing was optional.
Some 3.2 million partnerships filed electronically for 2015, an increase of 7.9 percent from the 2.9 million partnerships that filed returns electronically for 2014. These partnerships repre-sented 24.9 million partners for 2015, a 1.2-percent decrease from the 25.2 million partners for 2014. In addition, for 2015, returns filed electronically represented 85.6 percent of all part-nerships, 92.1 percent of all partners, 77.6 percent of total assets, and 70.9 percent of total net income (loss), all increases from the previous year.
Fewer partnerships chose to file Form 1065-B for electing large partnerships for 2015The IRS introduced Form 1065-B, U.S. Return of Income for Electing Large Partnerships, for Tax Year 1998. Unlike regular partnerships that report the distribution of partners’ allocated shares of income, gain, loss, deductions, or credits to each partner, electing large partnerships combine most items at the partnership level and only pass the net amounts through to the
Figure KPartnership Returns: Net Rental Real Estate Income (Loss), by Selected Industrial Group, Tax Years 2014–2015[Money amounts are in thousands of dollars]
Amount Percentage
(1) (2) (3) (4)All industries 42,841,947 54,409,785 11,567,838 27.0 Real estate and rental and leasing 44,197,972 55,494,259 11,296,287 25.6 Real estate 43,861,476 55,085,913 11,224,437 25.6 Lessors of residential buildings and dwellings and cooperative housing -8,744,593 -8,057,440 687,153 7.9 Lessors of nonresidential buildings (except miniwarehouses) 53,269,686 62,514,800 9,245,114 17.4 Lessors of miniwarehouses and self-storage units 3,132,198 3,055,132 -77,066 -2.5 Lessors of other real estate property 4,332,538 3,512,940 -819,598 -18.9 Other real estate activities -8,128,352 -5,939,519 2,188,833 26.9 NOTE: Detail may not add to totals because of rounding.SOURCE: IRS, Statistics of Income Division, Partnerships, August 2017.
Industrial group 2014 2015Change
Figure JPartnership Returns: Income (Loss) Allocations, by Type of Partner, Tax Years 2006–2015
-100
0
100
200
300
400
500
600
2006 2007 2008 2009 2010 2011 2012 2013 2014 2015Tax year
Corporate IndividualPartnership Tax-exempt organizationNominee/other
SOURCE: IRS, Statistics of Income Division, Partnerships, August 2017.
Current dollars (in billions)
6
Partnership Returns, Tax Year 2015
Spring 2018Statistics of Income Bulletin
partners. For 2015, some 67 partnerships filed Form 1065-B, down from 79 filed for 2014. The number of partners decreased slightly (from 12,801 to 12,747) between 2014 and 2015. Despite these decreases, total net income (loss) increased 2.4 percent (from $277.1 million to $284.0 million), and total assets rose 6.5 percent (from $12.3 billion to $13.1 billion) for the year.
Data Sources and LimitationsSOI based the statistics for Tax Year 2015 on a stratified prob-ability sample of 40,493 returns selected from a population of 3,972,169 partnerships. Tax Year 2015 covers returns pro-cessed by the IRS during Calendar Year 2016. All partnerships engaged in business in, or having income from sources within, the United States were required to file either Form 1065, U.S. Partnership Return of Income, or Form 1065-B, U.S. Return of Income for Electing Large Partnerships, to report income or loss, deductions, tax credits, and other tax-related items gener-ated by the partnership. The statistics are only for active partner-ships, defined as those reporting any items of income or deduc-tion derived from a trade or business, or from rental or portfolio income.
SOI stratified the population into classes based on industry, type of return, size of total assets, and size of certain receipt or income amounts from both ordinary business income (loss) and portfolio income (loss). From these classes, SOI selected returns at various probabilities (from 0.01 percent to 100 percent) and weighted them to represent the total population. SOI ruled 502 sampled returns as “out of scope” because they had no activity or duplicated other returns already in the study. This resulted in a final sample of 39,985 returns and an estimated overall active population of 3,715,187.
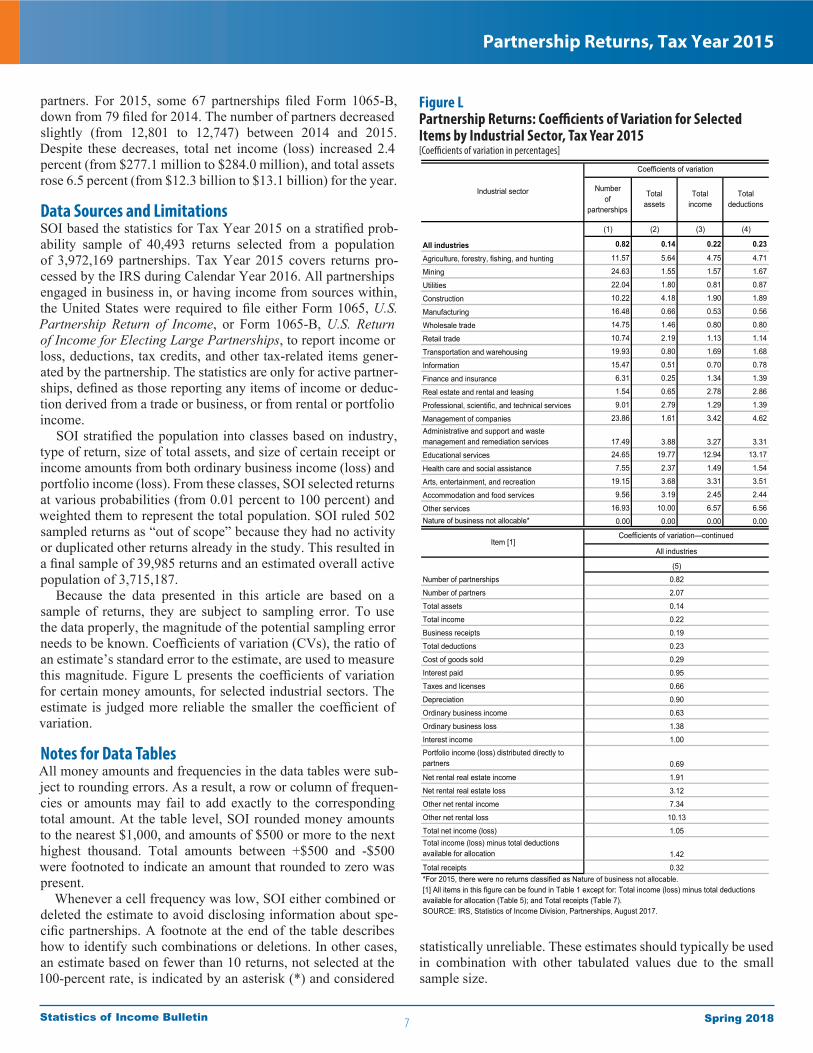
Because the data presented in this article are based on a sample of returns, they are subject to sampling error. To use the data properly, the magnitude of the potential sampling error needs to be known. Coefficients of variation (CVs), the ratio of an estimate’s standard error to the estimate, are used to measure this magnitude. Figure L presents the coefficients of variation for certain money amounts, for selected industrial sectors. The estimate is judged more reliable the smaller the coefficient of variation.
Notes for Data TablesAll money amounts and frequencies in the data tables were sub-ject to rounding errors. As a result, a row or column of frequen-cies or amounts may fail to add exactly to the corresponding total amount. At the table level, SOI rounded money amounts to the nearest $1,000, and amounts of $500 or more to the next highest thousand. Total amounts between +$500 and -$500 were footnoted to indicate an amount that rounded to zero was present.
Whenever a cell frequency was low, SOI either combined or deleted the estimate to avoid disclosing information about spe-cific partnerships. A footnote at the end of the table describes how to identify such combinations or deletions. In other cases, an estimate based on fewer than 10 returns, not selected at the 100-percent rate, is indicated by an asterisk (*) and considered
statistically unreliable. These estimates should typically be used in combination with other tabulated values due to the small sample size.
Figure LPartnership Returns: Coefficients of Variation for Selected Items by Industrial Sector, Tax Year 2015[Coefficients of variation in percentages]
(1) (2) (3) (4)
All industries 0.82 0.14 0.22 0.23
Agriculture, forestry, fishing, and hunting 11.57 5.64 4.75 4.71
Mining 24.63 1.55 1.57 1.67
Utilities 22.04 1.80 0.81 0.87
Construction 10.22 4.18 1.90 1.89
Manufacturing 16.48 0.66 0.53 0.56
Wholesale trade 14.75 1.46 0.80 0.80
Retail trade 10.74 2.19 1.13 1.14
Transportation and warehousing 19.93 0.80 1.69 1.68
Information 15.47 0.51 0.70 0.78
Finance and insurance 6.31 0.25 1.34 1.39
Real estate and rental and leasing 1.54 0.65 2.78 2.86
Professional, scientific, and technical services 9.01 2.79 1.29 1.39
Management of companies 23.86 1.61 3.42 4.62Administrative and support and waste management and remediation services 17.49 3.88 3.27 3.31
Educational services 24.65 19.77 12.94 13.17
Health care and social assistance 7.55 2.37 1.49 1.54
Arts, entertainment, and recreation 19.15 3.68 3.31 3.51
Accommodation and food services 9.56 3.19 2.45 2.44
Other services 16.93 10.00 6.57 6.56Nature of business not allocable* 0.00 0.00 0.00 0.00
Number of partnerships
Number of partners
Total assets
Total income
Business receipts
Total deductions
Cost of goods sold
Interest paid
Taxes and licenses
Depreciation
Ordinary business income
Ordinary business loss
Interest incomePortfolio income (loss) distributed directly to partners
Net rental real estate income
Net rental real estate loss
Other net rental income
Other net rental loss
Total net income (loss)Total income (loss) minus total deductions available for allocation
Total receipts
2.07
Industrial sector
Coefficients of variation
Numberof
partnerships
Totalassets
Totalincome
Totaldeductions
Item [1]Coefficients of variation—continued
All industries
(5)
0.82
0.69
0.14
0.22
0.19
0.23
0.29
0.95
0.66
0.90
0.63
1.38
1.00
0.32
1.91
3.12
7.34
10.13
1.05
1.42
*For 2015, there were no returns classified as Nature of business not allocable. [1] All items in this figure can be found in Table 1 except for: Total income (loss) minus total deductions available for allocation (Table 5); and Total receipts (Table 7).SOURCE: IRS, Statistics of Income Division, Partnerships, August 2017.
7
Partnership Returns, Tax Year 2015
Spring 2018Statistics of Income Bulletin
The IRS issued new requirements for safeguarding Federal Tax Information (FTI) in the latest edition of Publication 1075, Tax Information Security Guidelines for Federal, State and Local Agencies (Rev. 11/2016). While FTI is subject to Internal Revenue Code Section 6103(p)(4) safeguarding requirements, the increased availability of data on the internet and in the cloud creates greater challenges for government agencies responsible for protecting the confidentiality of, and preventing the com-mingling of, Federal Tax Information with other information. This article provides, for the first time, revised data tables that meet the new requirements, with the understanding that periodic reviews could lead to further adjustments of content in future editions
The statistical reliability of each cell in the tables was deter-mined separately from all other cells. Thus, it was possible for a total figure to be marked with an asterisk (*), indicating sta-tistical unreliability, while a subset of the total is not so marked. For example, a sector amount could be based on 7 returns, 3 not sampled at the 100-percent rate. The amount would receive an asterisk. However, an industry amount, within the sector, may include all 9 returns sampled at the 100-percent rate and would not receive an asterisk.
Explanation of Selected TermsAssets and liabilities—A partnership was required to provide
balance sheet information, in general, only if it had total receipts of $250,000 or more, total assets of $1,000,000 or more, and was not required to file Schedule M-3. For partnerships with ac-counting periods ending before 2008, the total asset requirement was $600,000. SOI did not estimate the assets and liabilities of partnerships that did not provide this information. If a partner-ship provided balance sheet data in a format of its own, instead of that provided on the return form, an effort was made during data collection to associate the amounts provided with the items on the partnership balance sheet. In addition, for returns with accounting periods ending after December 31, 2005, total assets should have been determined without offset by liabilities and not reported as a negative amount. If, however, the partnership continued to report negative total assets, no effort was made during data collection to change the amount.
Business receipts—Business receipts represent the gross re-ceipts or sales less returns and allowances from trade or busi-ness income. Business receipts were the largest component of gross receipts for industry groups such as manufacturing. SOI did not adjust business receipts to include rental real estate ac-tivity, which was reported separately on the partnership’s return.
Electing large partnerships—Partnerships with 100 or more partners in the preceding year could elect to file Form 1065-B, U.S. Return of Income for Electing Large Partnerships, in lieu of the more general Form 1065. Unlike a regular partnership reporting its allocated share of income, gain, loss, deductions, or credits to each partner, an electing large partnership com-bines most items at the partnership level and passes through net amounts to partners.
Electronically filed (ELF) partnerships—Certain partnerships with more than 100 partners were required to file their returns
electronically. Other partnerships could volunteer to file elec-tronically. Partnerships submitting ELF returns electronically did so in lieu of paper returns.
Foreign partnerships—A foreign partnership that has gross income effectively connected with the conduct of a trade or business within the United States or has gross income derived from sources in the United States must file a Form 1065, even if its principal place of business was outside the United States or all its partners were foreign persons.
Limited liability companies (domestic)—A limited liability company (LLC) is an entity formed under State law by filing articles of organization as an LLC. Limited liability compa-nies that choose to be classified as partnerships file Form 1065, U.S. Partnership Return of Income. SOI identified LLCs by their response to a question on Form 1065, Schedule B, Other Information. Limited liability companies combine the corpo-rate characteristics of limited liability for all members with the passthrough income treatment of a partnership. (The owners of an LLC are called members, not partners.) These businesses offer more organizational flexibility than S corporations. (S corporations pass through their income, gains and losses, de-ductions, and credits to their shareholders for tax purposes, like partnerships.) For example, unlike S corporations, LLCs are not limited in the number and type of owners. Unlike partners in limited partnerships, all members of LLCs have limited liability protection, even if they actively participate in the management of the business. In some cases, LLCs file as sole proprietorships on individual income tax returns or as corporations on corpo-ration income tax returns. LLC data reported on these returns were not included in this article.
Limited liability partnerships (domestic)—A limited liabil-ity partnership (LLP) is formed under a State limited liability partnership law. Limited liability partnerships file Form 1065, U.S. Partnership Return of Income. SOI identified LLPs by their response to a question on Form 1065, Schedule B, Other Information. Organizationally, LLPs are available in some States only for professional partnerships, such as law firms or account-ing firms. A partner in an LLP receives liability protection from the actions of other partners, but is liable for the partnership debts as well as the consequences of his or her own actions.
Nonrecourse loans—Nonrecourse loans are those partnership liabilities for which no partner bears the economic risk of loss.
North American Industry Classification System—Starting with the 1998 partnership study, SOI classified data using the North American Industry Classification System (NAICS), which replaced the Standard Industry Classification system (SIC). NAICS is a hierarchical system that classifies businesses, including partnerships, into sectors, subsectors, industry groups, and industries. Although the complete NAICS uses 20 sectors, SOI grouped the partnership data into 20 industrial divisions in Tax Year 1998 through Tax Year 2001 SOI Bulletin articles for presentation purposes and easier comparison between NAICS and SIC data. SOI dropped the industrial division for the Tax Year 2002 article and grouped the partnership data into the same 20 industrial sectors used in NAICS, except for: 1) excluding public administration, and 2) adding nature of business not
8
Partnership Returns, Tax Year 2015
Spring 2018Statistics of Income Bulletin

allocable. Businesses are only classified in the nature of busi-ness not allocable sector when a more specific activity cannot be identified from the return. SOI classified data within these industrial sectors in industrial groups. The most detailed clas-sification in this article and related data tables is the “industry.” The 20 sectors used in this article are:
• Agriculture, forestry, fishing, and hunting;
• Mining;
• Utilities;
• Construction;
• Manufacturing;
• Wholesale trade;
• Retail trade;
• Transportation and warehousing;
• Information;
• Finance and insurance;
• Real estate and rental and leasing;
• Professional, scientific, and technical services;
• Management of companies (holding companies);
• Administrative and support and waste management and remediation services;
• Educational services;
• Health care and social assistance;
• Arts, entertainment, and recreation;
• Accommodation and food services;
• Other services; and
• Nature of business not allocable.
In addition, in 2002, 2007, and 2012, NAICS updated its classification system. In 2002, the new version included a re-vised structure for both the Construction and Information sec-tors and additional detail for the Retail trade sector. NAICS updated the Information sector again in 2007, along with one financial industry. In 2012, changes occurred in the following sectors: Manufacturing; Wholesale trade; Retail trade; Real estate and rental and leasing; and Accommodation and food services. The North American Industry Classification System publication contains appendices comparing the 2002, 2007, and 2012 NAICS United States structures to the 1997 NAICS United States structure.6
SOI determined a partnership industry based on the activity from which the business derived the largest percentage of its total receipts. For industry coding purposes only, SOI defined total receipts as the sum of:
• gross receipts or sales less returns and allowances (i.e., business receipts in the statistics);
• ordinary income from other partnerships, estates, and trusts;
• net farm profit;
• net gain from Form 4797;
• other income (Form 1065, page 1, line 7);
• other gross rental income;
• interest income;
• dividend income;
• royalties;
• net short-term capital gain;
• net long-term capital gain;
• net section 1231 gain;
• other income (Form 1065, page 4, line 11);
• gross rents from rental real estate;
• net gain from the disposition of property from rental real estate activities; and
• net income from rental real estate activities from partner-ships, estates, and trusts in which the partnership is a part-ner or beneficiary.
Total receipts for partnership industry coding purposes dif-fers from total receipts used elsewhere in this article (see “Total receipts” in this section).
Partner—Partners can be individuals, corporations, other partnerships, or any other legal entity. Partners are classified as either general or limited. General partners are those who assume liability for the partnership’s debts and losses. Limited partners are those whose liability in the partnership is limited to their in-vestment. A partnership must have at least two partners, at least one of which must be a general partner. A general partnership is composed entirely of general partners. A limited partnership has at least one general partner and one or more limited partners.
Partnerships—A partnership is the relationship between two or more persons who join to carry on a trade or business. Each person contributes money, property, labor, or skill with the ex-pectation of sharing in the profits and losses of the business, re-gardless of whether a formal partnership agreement was made. Every partnership that engages in a trade or business or has income from sources in the United States must file an annual in-formation return with the Internal Revenue Service, either Form 1065, U.S. Partnership Return of Income, or Form 1065-B, U.S. Return of Income for Electing Large Partnerships, showing the partnership’s income or loss for the year. A partnership must file this return even if its principal place of business is outside
6 For further information about the North American Industry Classification System, including background, formats, and detailed descriptions of the activities included in each classification, see North American Industry Classification System, United States, Executive Office of the President, Office of Management and Budget (http://www.census.gov/eos/www/naics/).
9
Partnership Returns, Tax Year 2015
Spring 2018Statistics of Income Bulletin
the United States and even if all its members are nonresident aliens.
Total net income (loss)—Through Tax Year 1986, partner-ships reported the amounts for total net income (loss) as ordi-nary income (loss) on Form 1065. After the tax law changes and tax form revisions in 1987, Statistics of Income studies began computing a similar total figure as the sum of the following:
• ordinary business income (loss);
• interest income;
• dividend income;
• royalties;
• net rental real estate income (loss) from Form 8825; and
• other net rental income (loss).
The sum of these components is a measure of overall part-nership profit or loss, which allows for comparisons with total net income (loss) reported for years before 1987. The profit status of a partnership is determined based on the sum of these six amounts. Partnerships where the sum of these six amounts equals zero are included with loss partnerships. For 2004, the definition of total net income (loss) was revised because other portfolio income (loss) was excluded since it was no longer re-ported separately on Schedule K, but was included on Schedule K, Line 11, “Other income (loss).” This resulted in the 2004 total net income (loss) being understated by that amount when compared to years prior to 2004. However, this understatement was small since, for 2003, other portfolio income (loss) for all partnerships was only $3.1 billion or 1 percent of the $301.4 bil-lion reported for total net income (loss).
Total receipts—Total receipts is computed for the statistics to reflect similar computations published in other Statistics of Income (SOI) studies. It is the sum of positive income received by partnerships for the specific items listed below (note that negative amounts or losses are included in the statistics as de-duction items):
• gross receipts or sales less returns and allowances (i.e., business receipts in the statistics);
• ordinary income from other partnerships, estates and trusts;
• net farm profit;
• net gain from Form 4797;
• other income (Form 1065, page 1, line 7);
• net rental real estate income;
• other net rental income;
• interest income;
• dividend income;
• royalties;
• net short-term capital gain;
• net long-term capital gain;
• net section 1231 gain; and
• other income (Form 1065, page 4, line 11).
Total receipts in Table 7 differ from total receipts presented in Table 11 in the Selected Historical and Projected Data accessi-ble online at http://www.irs.gov/uac/SOI-Tax-Stats-Historical-Table-11. Table 11 excludes certain income items allocated directly to partners (such as net short-term and long-term capital gains, net gain under Internal Revenue Code section 1231, and other income (Schedule K, Line 11)).
Additional Tabular Data on Tax Stats WebsiteFor additional partnership tabular data by size of total assets, see the Partnership section on IRS’s Tax Stats Website at www.irs.gov/taxstats/index.html. This site also includes tabular data on partnership returns for prior years, as well as information on filing requirements, sample designs, an explanation of terms, and links to other SOI studies. Beginning in 2007, tabular data for partnerships that reported foreign transaction data on Form 1065, Schedule K, Partners’ Distributive Share Items, lines 16a–m, were added to Tax Stats. Table 23 shows these foreign transaction data by selected industry group. Table 24 shows total assets, trade or business income and deductions, portfolio income, rental income, and total net income, by size of total assets, for partnerships that reported these foreign transaction data. In addition, Table 25 is the same as Table 24, except that it displays data for partnerships that did not report foreign transaction data.
10
Partnership Returns, Tax Year 2015
Spring 2018Statistics of Income Bulletin
Ron DeCarlo and Nina Shumofsky are economists with the Partnership and Special Projects Section. This article was prepared under the direc-tion of Joseph Koshansky, Chief.
[All figures are estimates based on samples--money amounts are in thousands of dollars]
(1) (2) (3) (4) (5) (6)
Number of partnerships 3,715,187 136,376 34,900 4,431 163,067 88,670 Number of partners 27,093,015 432,747 2,008,209 142,481 438,932 1,080,296 Total assets 27,366,266,830 226,482,789 543,098,584 422,412,381 226,150,469 838,556,408 Income and deductions from a trade or business: Total income 5,295,334,204 46,217,895 150,640,483 160,043,395 304,724,059 907,463,543 Business receipts 4,877,414,510 32,944,055 132,046,341 151,352,178 296,527,531 887,266,738 Ordinary income from other partnerships, estates and trusts 139,229,298 1,728,670 4,019,620 4,548,235 1,679,484 4,980,055 Net gain, noncapital assets 28,409,855 1,022,710 2,350,046 2,508,574 1,195,759 2,713,059 Other income [1] 250,280,540 10,522,460 12,224,476 1,634,407 5,321,285 12,503,690 Total deductions 4,915,397,618 43,733,207 141,609,913 167,597,121 289,685,050 859,864,413 Cost of goods sold [2] 2,695,613,646 21,611,065 58,446,721 118,263,563 239,434,454 694,463,952 Inventory, beginning of year 291,139,488 3,617,239 5,318,784 3,151,925 33,234,564 83,285,514 Purchases 1,884,856,950 14,267,414 9,272,613 93,044,253 66,605,023 511,059,062 Cost of labor 154,316,206 [d] [d] 598,630 [d] 38,694,189 Additional inventory costs (section 263A) 16,899,796 [d] [d] 46,179 [d] 4,582,537 Other costs 649,265,349 5,712,233 43,561,142 25,805,738 147,128,811 140,007,942 Less: Inventory, end of year 305,950,278 4,010,002 5,170,655 4,383,161 35,021,884 83,980,518 Salaries and wages 577,746,711 2,745,376 6,544,452 1,988,307 13,215,474 35,100,314 Guaranteed payments to partners 67,146,214 1,022,198 340,304 189,943 2,505,924 2,876,729 Rent paid 101,279,145 553,091 875,177 1,040,230 1,469,750 4,511,194 Interest paid 85,496,044 575,071 7,597,582 5,969,962 2,125,079 8,171,687 Taxes and licenses 87,315,881 465,954 3,431,545 1,859,314 2,093,411 12,918,977 Bad debts 17,186,398 13,116 94,058 99,713 341,404 522,473 Repairs and maintenance 32,838,705 559,451 1,044,681 1,993,924 785,145 3,593,106 Depreciation 176,033,137 1,005,018 18,556,759 19,114,339 2,560,935 11,891,264 Retirement plans, etc. 13,475,978 43,248 87,849 113,148 211,051 1,935,723 Employee benefit programs 41,003,456 161,026 626,276 197,397 733,124 5,966,209 Ordinary loss from other partnerships, estates and trusts 76,356,647 815,492 3,031,415 3,230,367 380,143 2,257,738 Net loss, noncapital assets 6,485,226 128,575 1,311,608 43,976 88,218 308,771 Other deductions [3] 937,420,431 14,034,527 39,621,487 13,492,939 23,740,940 75,346,276 Ordinary business income (loss) 379,936,585 2,484,688 9,030,570 -7,553,726 15,039,008 47,599,129 Net income 672,317,946 12,267,275 32,747,352 12,568,194 22,592,571 71,772,040 Loss 292,381,361 9,782,587 23,716,782 20,121,920 7,553,562 24,172,911 Portfolio income (loss) distributed directly to partners 995,539,608 3,275,920 7,045,456 2,135,669 1,646,359 22,380,545 Interest income 155,005,964 723,230 614,107 337,245 480,175 4,321,801 Dividend income 159,450,074 642,687 272,007 24,931 46,103 4,547,969 Royalties 29,803,275 521,685 3,883,761 2,569 61,151 8,215,954 Net short-term capital gain (loss) 5,086,159 -93,041 99,414 29,107 -51,894 -66,292 Net long-term capital gain (loss) 646,194,135 1,481,358 2,176,167 1,741,817 1,110,824 5,361,112 Net rental real estate income (loss) 54,409,785 582,445 -26,862 269 49,012 67,305 Net income 150,848,414 625,872 107,237 570 541,503 77,094 Loss 96,438,628 43,427 134,099 * 301 492,491 9,788Other net rental income (loss) 1,898,684 99,048 163,713 -553,089 2,632 441,398 Total net income (loss) [4] 780,504,367 5,053,783 13,937,296 -7,741,801 15,678,082 65,193,558 Net income 1,137,464,573 14,286,277 37,331,316 12,710,833 23,365,588 85,903,653 Loss 356,960,206 9,232,493 23,394,020 20,452,634 7,687,506 20,710,095 Footnotes at end of table.
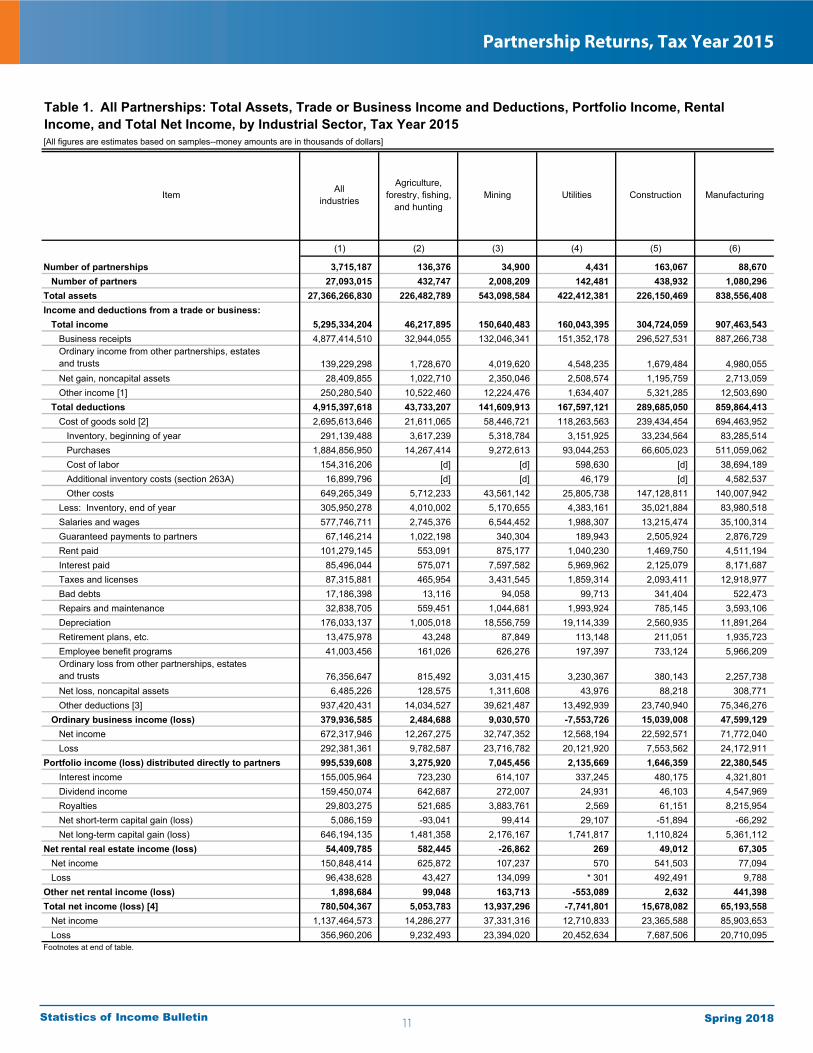
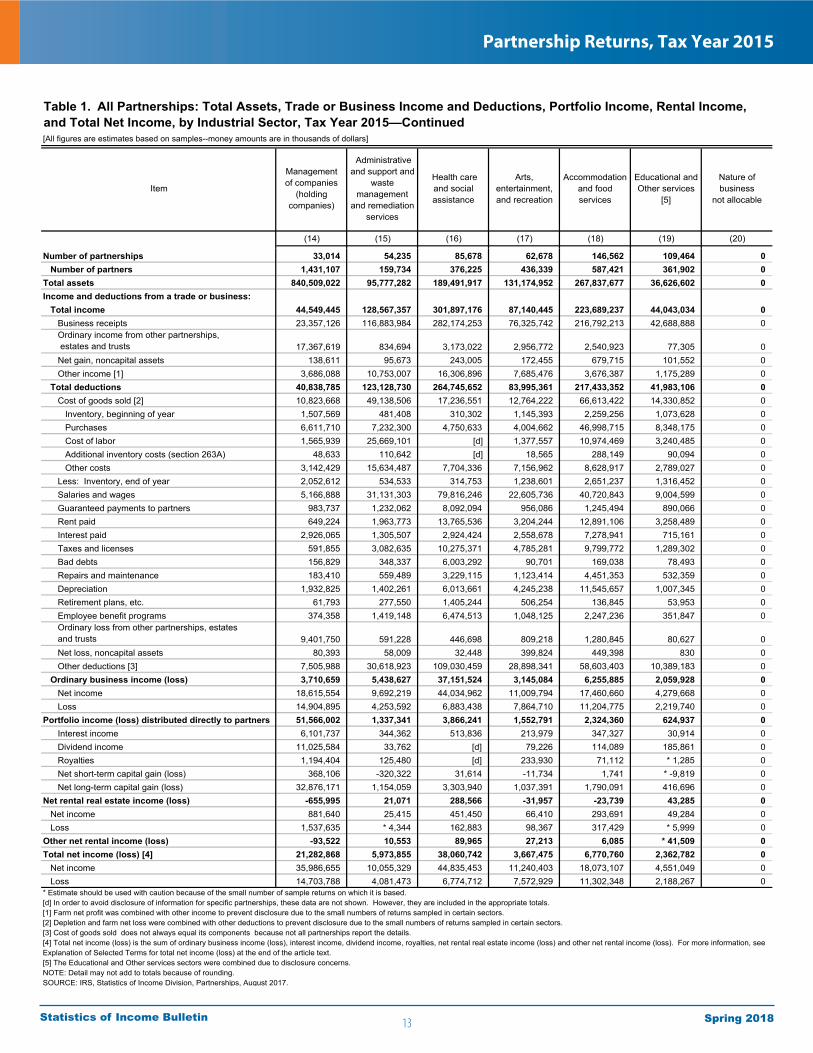
Table 1. All Partnerships: Total Assets, Trade or Business Income and Deductions, Portfolio Income, Rental Income, and Total Net Income, by Industrial Sector, Tax Year 2015
Item Allindustries
Agriculture,forestry, fishing,
and huntingMining Utilities Construction Manufacturing
11
Partnership Returns, Tax Year 2015
Spring 2018Statistics of Income Bulletin

[All figures are estimates based on samples--money amounts are in thousands of dollars]
(7) (8) (9) (10) (11) (12) (13)
Number of partnerships 72,188 173,225 40,294 57,547 358,416 1,846,071 248,370 Number of partners 776,030 724,049 2,947,681 205,197 6,189,038 7,914,900 880,726 Total assets 328,457,345 220,825,048 697,714,613 844,035,002 15,048,366,024 6,135,352,807 273,397,909 Income and deductions from a trade or business: Total income 638,996,509 550,785,037 226,159,413 391,297,792 397,708,899 208,185,025 483,225,461 Business receipts 631,587,448 535,925,791 212,213,818 367,222,495 233,994,532 170,737,752 467,373,626 Ordinary income from other partnerships, estates and trusts 1,856,236 1,334,162 3,972,395 15,363,593 52,578,023 14,665,708 5,552,782 Net gain, noncapital assets 344,238 567,169 3,144,960 1,090,589 7,044,391 4,352,286 645,062 Other income [1] 5,208,587 12,957,915 6,828,239 7,621,114 104,091,953 18,429,279 9,653,990 Total deductions 621,750,382 540,091,673 219,046,580 338,135,884 335,516,233 194,696,104 391,546,073 Cost of goods sold [2] 535,995,196 418,771,724 105,783,867 98,941,889 69,580,197 77,844,869 85,568,926 Inventory, beginning of year 55,360,511 59,526,009 4,677,522 4,184,556 3,165,226 27,200,493 1,639,591 Purchases 493,682,008 401,868,781 65,377,085 45,311,418 47,991,221 29,301,201 29,130,674 Cost of labor 3,547,669 4,368,851 [d] [d] [d] 2,664,895 18,181,545 Additional inventory costs (section 263A) 1,622,893 1,192,755 [d] [d] [d] 3,403,319 494,637 Other costs 36,038,984 19,085,972 34,369,966 53,302,791 20,913,232 40,504,791 37,777,589 Less: Inventory, end of year 55,430,268 67,715,752 4,488,866 6,156,239 3,796,184 25,726,155 1,962,405 Salaries and wages 25,400,645 40,140,798 12,552,977 28,466,779 78,191,318 22,857,588 122,097,068 Guaranteed payments to partners 2,321,669 2,175,699 920,796 2,319,387 12,930,857 2,197,233 23,945,939 Rent paid 3,930,671 11,563,481 3,229,152 10,687,865 6,553,362 4,572,732 16,560,066 Interest paid 4,037,062 3,165,483 7,971,293 7,328,253 11,020,038 7,122,627 2,703,132 Taxes and licenses 2,884,804 5,725,812 3,880,145 5,087,399 4,768,921 3,550,989 10,824,394 Bad debts 397,088 755,100 147,478 2,715,922 3,786,955 1,058,224 408,178 Repairs and maintenance 1,429,020 2,473,394 4,233,345 2,756,518 849,435 1,491,514 1,550,033 Depreciation 5,792,412 5,466,967 34,718,245 23,269,932 5,101,261 17,430,507 4,978,514 Retirement plans, etc. 516,975 638,693 336,839 682,351 1,416,785 191,014 4,860,663 Employee benefit programs 2,196,683 2,973,089 1,478,882 2,662,072 3,598,783 1,255,656 7,239,035 Ordinary loss from other partnerships, estates and trusts 368,282 294,058 2,608,458 1,572,976 37,482,319 9,495,467 2,209,567 Net loss, noncapital assets 59,301 234,734 226,972 189,032 1,811,483 864,709 196,943 Other deductions [3] 36,420,574 45,712,640 40,958,131 151,455,508 98,424,520 44,762,975 108,403,617 Ordinary business income (loss) 17,246,127 10,693,364 7,112,833 53,161,908 62,192,667 13,488,921 91,679,388 Net income 23,967,534 18,216,753 23,254,977 72,665,233 125,768,013 45,483,330 105,921,816 Loss 6,721,407 7,523,389 16,142,144 19,503,325 63,575,347 31,994,409 14,242,428 Portfolio income (loss) distributed directly to partners 2,168,344 1,098,718 1,420,376 7,003,496 793,187,079 83,994,797 8,911,178 Interest income 432,743 328,351 487,201 3,001,473 122,933,485 12,737,003 1,056,997 Dividend income 399,293 186,736 [d] 711,363 129,124,829 10,914,345 567,369 Royalties 67,311 8,113 [d] 1,646,426 6,510,427 5,914,124 1,303,071 Net short-term capital gain (loss) -11,537 -4,565 -2,755 377,029 4,762,616 76,705 -88,214 Net long-term capital gain (loss) 1,280,535 580,083 336,390 1,267,205 529,855,721 54,352,621 6,071,954 Net rental real estate income (loss) 103,662 250,935 6,395 68,667 -1,800,733 55,494,259 -26,801 Net income 148,711 290,476 90,360 71,307 4,188,976 142,772,307 166,111 Loss 45,049 39,541 * 83,965 * 2,640 5,989,709 87,278,048 192,911 Other net rental income (loss) 59,967 64,188 -54,772 92,742 119,581 1,469,768 -88,296Total net income (loss) [4] 18,309,102 11,531,687 8,151,197 58,682,579 319,080,255 100,018,419 94,491,729 Net income 24,655,669 18,849,251 23,816,417 76,865,578 375,069,578 211,660,228 108,208,189 Loss 6,346,567 7,317,564 15,665,220 18,183,000 55,989,322 111,641,808 13,716,460 Footnotes at end of table.
Table 1. All Partnerships: Total Assets, Trade or Business Income and Deductions, Portfolio Income, Rental Income, and Total Net Income, by Industrial Sector, Tax Year 2015—Continued
Finance and insuranceWholesale trade Retail trade
Transportationand
warehousingInformationItem
Real estate and rental and
leasing
Professional,scientific, and
technicalservices
12
Partnership Returns, Tax Year 2015
Spring 2018Statistics of Income Bulletin
[All figures are estimates based on samples--money amounts are in thousands of dollars]
(14) (15) (16) (17) (18) (19) (20)
Number of partnerships 33,014 54,235 85,678 62,678 146,562 109,464 0 Number of partners 1,431,107 159,734 376,225 436,339 587,421 361,902 0 Total assets 840,509,022 95,777,282 189,491,917 131,174,952 267,837,677 36,626,602 0 Income and deductions from a trade or business: Total income 44,549,445 128,567,357 301,897,176 87,140,445 223,689,237 44,043,034 0 Business receipts 23,357,126 116,883,984 282,174,253 76,325,742 216,792,213 42,688,888 0 Ordinary income from other partnerships, estates and trusts 17,367,619 834,694 3,173,022 2,956,772 2,540,923 77,305 0 Net gain, noncapital assets 138,611 95,673 243,005 172,455 679,715 101,552 0 Other income [1] 3,686,088 10,753,007 16,306,896 7,685,476 3,676,387 1,175,289 0 Total deductions 40,838,785 123,128,730 264,745,652 83,995,361 217,433,352 41,983,106 0 Cost of goods sold [2] 10,823,668 49,138,506 17,236,551 12,764,222 66,613,422 14,330,852 0 Inventory, beginning of year 1,507,569 481,408 310,302 1,145,393 2,259,256 1,073,628 0 Purchases 6,611,710 7,232,300 4,750,633 4,004,662 46,998,715 8,348,175 0 Cost of labor 1,565,939 25,669,101 [d] 1,377,557 10,974,469 3,240,485 0 Additional inventory costs (section 263A) 48,633 110,642 [d] 18,565 288,149 90,094 0 Other costs 3,142,429 15,634,487 7,704,336 7,156,962 8,628,917 2,789,027 0 Less: Inventory, end of year 2,052,612 534,533 314,753 1,238,601 2,651,237 1,316,452 0 Salaries and wages 5,166,888 31,131,303 79,816,246 22,605,736 40,720,843 9,004,599 0 Guaranteed payments to partners 983,737 1,232,062 8,092,094 956,086 1,245,494 890,066 0 Rent paid 649,224 1,963,773 13,765,536 3,204,244 12,891,106 3,258,489 0 Interest paid 2,926,065 1,305,507 2,924,424 2,558,678 7,278,941 715,161 0 Taxes and licenses 591,855 3,082,635 10,275,371 4,785,281 9,799,772 1,289,302 0 Bad debts 156,829 348,337 6,003,292 90,701 169,038 78,493 0 Repairs and maintenance 183,410 559,489 3,229,115 1,123,414 4,451,353 532,359 0 Depreciation 1,932,825 1,402,261 6,013,661 4,245,238 11,545,657 1,007,345 0 Retirement plans, etc. 61,793 277,550 1,405,244 506,254 136,845 53,953 0 Employee benefit programs 374,358 1,419,148 6,474,513 1,048,125 2,247,236 351,847 0 Ordinary loss from other partnerships, estates and trusts 9,401,750 591,228 446,698 809,218 1,280,845 80,627 0 Net loss, noncapital assets 80,393 58,009 32,448 399,824 449,398 830 0 Other deductions [3] 7,505,988 30,618,923 109,030,459 28,898,341 58,603,403 10,389,183 0 Ordinary business income (loss) 3,710,659 5,438,627 37,151,524 3,145,084 6,255,885 2,059,928 0 Net income 18,615,554 9,692,219 44,034,962 11,009,794 17,460,660 4,279,668 0 Loss 14,904,895 4,253,592 6,883,438 7,864,710 11,204,775 2,219,740 0Portfolio income (loss) distributed directly to partners 51,566,002 1,337,341 3,866,241 1,552,791 2,324,360 624,937 0 Interest income 6,101,737 344,362 513,836 213,979 347,327 30,914 0 Dividend income 11,025,584 33,762 [d] 79,226 114,089 185,861 0 Royalties 1,194,404 125,480 [d] 233,930 71,112 * 1,285 0 Net short-term capital gain (loss) 368,106 -320,322 31,614 -11,734 1,741 * -9,819 0 Net long-term capital gain (loss) 32,876,171 1,154,059 3,303,940 1,037,391 1,790,091 416,696 0Net rental real estate income (loss) -655,995 21,071 288,566 -31,957 -23,739 43,285 0 Net income 881,640 25,415 451,450 66,410 293,691 49,284 0 Loss 1,537,635 * 4,344 162,883 98,367 317,429 * 5,999 0Other net rental income (loss) -93,522 10,553 89,965 27,213 6,085 * 41,509 0 Total net income (loss) [4] 21,282,868 5,973,855 38,060,742 3,667,475 6,770,760 2,362,782 0 Net income 35,986,655 10,055,329 44,835,453 11,240,403 18,073,107 4,551,049 0 Loss 14,703,788 4,081,473 6,774,712 7,572,929 11,302,348 2,188,267 0
Table 1. All Partnerships: Total Assets, Trade or Business Income and Deductions, Portfolio Income, Rental Income, and Total Net Income, by Industrial Sector, Tax Year 2015—Continued
* Estimate should be used with caution because of the small number of sample returns on which it is based.[d] In order to avoid disclosure of information for specific partnerships, these data are not shown. However, they are included in the appropriate totals.[1] Farm net profit was combined with other income to prevent disclosure due to the small numbers of returns sampled in certain sectors.[2] Depletion and farm net loss were combined with other deductions to prevent disclosure due to the small numbers of returns sampled in certain sectors.[3] Cost of goods sold does not always equal its components because not all partnerships report the details.[4] Total net income (loss) is the sum of ordinary business income (loss), interest income, dividend income, royalties, net rental real estate income (loss) and other net rental income (loss). For more information, see Explanation of Selected Terms for total net income (loss) at the end of the article text.[5] The Educational and Other services sectors were combined due to disclosure concerns.NOTE: Detail may not add to totals because of rounding.SOURCE: IRS, Statistics of Income Division, Partnerships, August 2017.
Accommodationand food services
Educational and Other services
[5]
Nature of business
not allocable
Managementof companies
(holdingcompanies)
Administrative and support and
wastemanagement
and remediation services
Health careand socialassistance
Arts,entertainment,and recreation
Item
13
Partnership Returns, Tax Year 2015
Spring 2018Statistics of Income Bulletin
[All figures are estimates based on samples—money amounts are in thousands of dollars)
(1) (2) (3) (4) (5) (6)
Number of partnerships 2,152,282 75,730 23,506 1,948 103,588 35,638 Number of partners 16,617,446 210,390 1,745,371 10,412 250,685 391,214 Total assets 19,729,772,234 114,353,957 322,015,356 219,310,693 137,703,267 615,171,083 Income and deductions from a trade or business: Total income 4,205,025,239 37,461,058 112,023,261 110,032,115 251,940,920 749,579,286 Business receipts 3,846,902,562 25,168,379 96,157,585 102,316,974 244,499,008 733,374,090 Ordinary income from other partnerships and fiduciaries 133,659,214 1,589,394 3,908,677 4,451,407 1,555,690 4,958,200 Net gain, noncapital assets 24,749,382 531,898 2,229,500 2,259,395 1,169,864 2,485,071 Other income [1] 199,714,081 10,171,387 9,727,500 1,004,338 4,716,357 8,761,924 Total deductions 3,547,989,830 25,398,566 79,451,457 97,532,140 229,450,004 679,892,680 Cost of goods sold [2] 2,067,564,621 15,854,311 34,658,931 77,180,645 194,998,272 565,265,902 Inventory, beginning of year 197,622,823 2,350,156 2,651,646 1,769,782 21,389,699 61,111,619 Purchases 1,459,185,146 10,598,175 5,555,741 60,943,026 53,799,502 421,125,324 Cost of labor 116,373,603 [d] [d] 204,903 [d] 28,513,380 Additional inventory costs (section 263A) 11,547,704 [d] [d] * 32,159 [d] 2,732,796 Other costs 485,886,791 4,232,478 26,294,121 16,039,804 119,636,994 112,877,069 Less: Inventory, end of year 207,307,187 2,570,201 2,683,330 1,809,029 21,540,208 61,907,621 Salaries and wages 425,594,514 2,018,399 3,695,542 1,156,015 9,512,463 23,849,919 Guaranteed payments to partners 51,973,367 489,327 216,539 103,706 1,856,143 2,091,497 Rent paid 71,625,428 381,008 459,364 432,490 1,218,068 2,975,937 Interest paid 43,933,058 187,255 3,831,699 2,877,195 1,004,183 4,246,526 Taxes and licenses 65,128,307 339,651 2,399,332 1,239,882 1,470,535 11,492,503 Bad debts 10,561,036 9,787 44,351 74,086 119,797 234,223 Repairs and maintenance 22,287,957 384,461 679,231 1,334,338 626,556 2,611,276 Depreciation 85,470,967 585,898 9,688,253 6,073,780 1,418,593 7,337,277 Retirement plans, etc. 11,305,694 35,083 58,106 43,735 169,214 1,532,269 Employee benefit programs 30,752,438 135,354 396,529 116,343 568,537 4,644,568 Ordinary loss from other partnerships and fiduciaries 8,940,118 45,136 424,631 15,874 98,582 1,048,229 Net loss, noncapital assets 1,765,481 38,289 193,715 3,593 17,826 60,962 Other deductions [3] 651,086,844 4,894,607 22,705,232 6,880,457 16,371,237 52,501,592 Ordinary business income (loss) 657,035,409 12,062,492 32,571,805 12,499,975 22,490,916 69,686,606 Net income 670,641,877 12,267,275 [d] [d] [d] 71,772,040 Loss 13,606,469 204,783 [d] [d] [d] 2,085,434 Portfolio income (loss) distributed directly to partners 866,216,272 2,508,327 6,693,336 852,844 1,095,733 18,773,427 Interest income 145,625,665 644,212 560,096 111,404 330,361 3,946,677 Dividend income 155,907,871 571,284 206,291 [d] 26,455 4,363,575 Royalties 28,105,900 501,397 3,769,994 [d] 61,067 7,690,910 Net short-term capital gain (loss) 933,056 -15,659 58,725 [d] -15,620 -45,547 Net long-term capital gain (loss) 535,643,780 807,093 2,098,231 724,477 693,469 2,817,812 Net rental real estate income (loss) 145,098,872 419,024 63,063 * -13 455,678 55,243 Net income 149,157,584 439,495 102,435 [d] 496,536 64,607 Loss 4,058,713 20,471 39,372 [d] 40,858 9,364 Other net rental income (loss) 5,690,856 87,868 160,068 * 82,993 1,111 160,642 Total net income [4] 1,137,464,573 14,286,277 37,331,316 12,710,833 23,365,588 85,903,653 Footnotes at end of table.
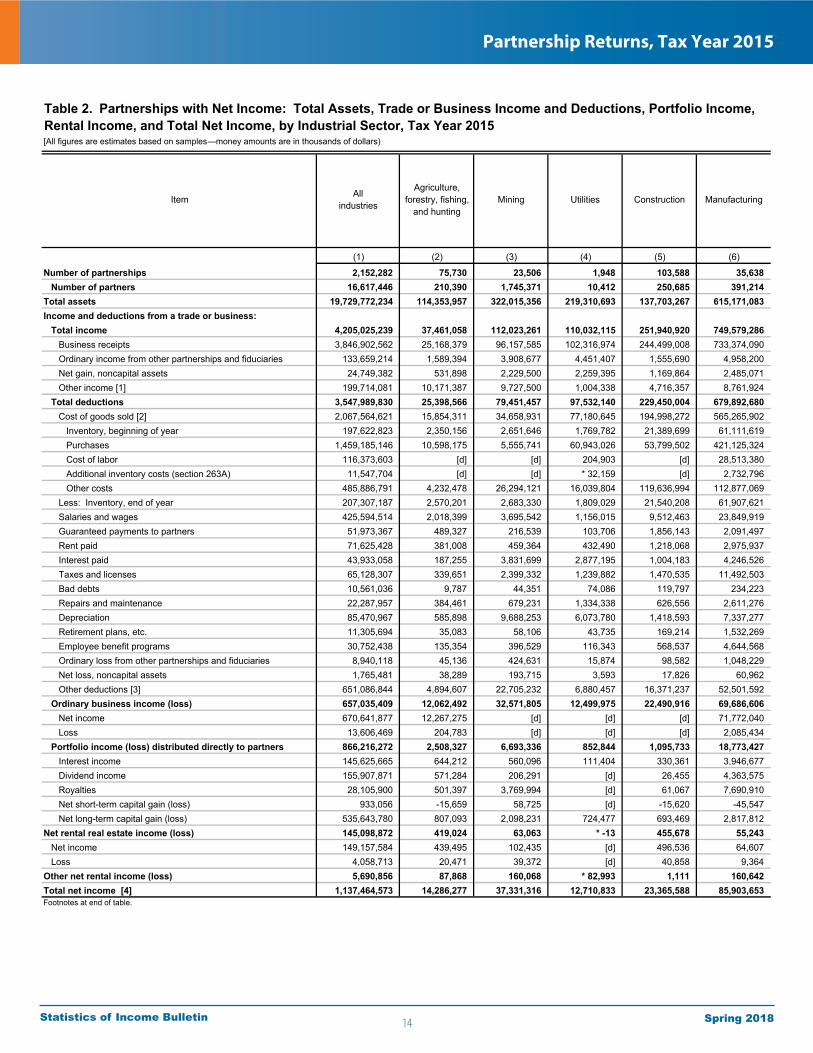
Table 2. Partnerships with Net Income: Total Assets, Trade or Business Income and Deductions, Portfolio Income, Rental Income, and Total Net Income, by Industrial Sector, Tax Year 2015
Item Allindustries
Agriculture,forestry, fishing,
and huntingMining Utilities Construction Manufacturing
14
Partnership Returns, Tax Year 2015
Spring 2018Statistics of Income Bulletin
[All figures are estimates based on samples—money amounts are in thousands of dollars)
(7) (8) (9) (10) (11) (12) (13)
Number of partnerships 38,031 85,671 23,794 23,069 216,649 1,073,977 150,979 Number of partners 541,793 422,177 1,131,671 68,145 4,577,640 4,561,890 543,060 Total assets 242,546,568 151,684,026 312,820,728 715,972,351 12,099,023,201 3,599,536,539 186,898,072 Income and deductions from a trade or business: Total income 528,218,539 404,665,989 128,670,675 329,626,607 333,332,624 151,511,324 432,496,589 Business receipts 522,039,147 394,040,014 117,508,607 307,537,010 191,460,531 120,229,691 418,779,510 Ordinary income from other partnerships and fiduciaries 1,777,301 1,186,328 3,477,329 14,643,590 51,791,868 13,859,435 5,246,781 Net gain, noncapital assets 251,810 512,053 2,916,589 1,027,833 6,345,876 3,266,071 496,375 Other income [1] 4,150,281 8,927,594 4,768,150 6,418,174 83,734,349 14,156,127 7,973,922 Total deductions 504,383,474 386,529,299 105,444,247 258,306,795 213,682,440 109,711,346 326,714,339 Cost of goods sold [2] 441,683,266 307,659,405 51,210,760 76,788,986 55,016,572 51,245,870 69,944,404 Inventory, beginning of year 41,500,405 41,848,516 1,358,220 2,982,916 1,667,180 13,554,904 1,114,528 Purchases 408,505,526 297,713,825 27,493,244 34,108,246 41,532,875 20,006,807 23,608,200 Cost of labor 2,724,774 3,077,223 [d] [d] [d] 1,763,505 15,115,141 Additional inventory costs (section 263A) 1,102,891 833,785 [d] [d] [d] 2,353,420 468,804 Other costs 28,866,841 11,659,127 19,771,044 42,326,332 13,309,515 25,880,343 30,858,609 Less: Inventory, end of year 42,190,570 47,781,282 1,118,590 4,446,727 2,293,467 12,508,020 1,434,909 Salaries and wages 19,808,807 25,932,516 7,507,919 21,471,529 57,507,998 14,469,161 106,623,871 Guaranteed payments to partners 1,449,238 1,453,164 616,060 1,819,515 9,989,882 1,570,338 20,334,245 Rent paid 2,926,743 7,559,507 1,900,363 7,742,604 4,533,256 2,707,887 14,688,438 Interest paid 2,739,977 1,886,197 3,704,464 2,749,887 6,265,266 3,251,619 1,551,314 Taxes and licenses 2,271,287 3,751,987 2,304,646 4,154,112 3,737,350 1,951,961 9,427,344 Bad debts 240,531 495,845 88,278 2,051,822 1,739,356 276,375 287,355 Repairs and maintenance 1,031,757 1,684,702 1,899,260 2,111,087 548,237 791,127 1,395,760 Depreciation 3,685,890 3,072,529 10,681,898 18,829,416 2,091,378 5,443,606 3,172,603 Retirement plans, etc. 430,243 264,989 211,417 609,691 1,229,086 112,427 4,616,419 Employee benefit programs 1,733,788 1,652,865 1,057,148 1,985,909 2,797,210 658,220 6,329,045 Ordinary loss from other partnerships and fiduciaries 56,224 41,613 79,686 679,338 4,396,617 1,069,872 420,653 Net loss, noncapital assets 19,397 25,666 40,966 43,344 845,089 164,380 182,220 Other deductions [3] 26,306,326 31,048,312 24,141,382 117,269,556 62,985,144 25,998,503 87,740,666 Ordinary business income (loss) 23,835,065 18,136,690 23,226,428 71,319,812 119,650,184 41,799,978 105,782,250 Net income 23,967,534 [d] [d] [d] 125,631,070 44,215,894 [d] Loss 132,469 [d] [d] [d] 5,980,886 2,415,916 [d] Portfolio income (loss) distributed directly to partners 1,341,292 853,140 698,476 5,691,609 721,308,077 59,760,111 3,988,108 Interest income 338,817 285,907 175,118 2,801,868 118,670,885 10,468,286 729,485 Dividend income 340,396 182,518 [d] 594,286 127,321,274 10,283,892 542,728 Royalties 34,296 7,871 [d] 1,472,544 6,321,398 5,772,498 990,931 Net short-term capital gain (loss) 197 -3,743 [d] 106,187 1,729,920 -918,176 -555,618 Net long-term capital gain (loss) 627,587 380,588 300,545 716,725 467,264,599 34,153,611 2,280,581 Net rental real estate income (loss) 57,163 171,328 84,716 39,705 2,421,674 139,892,535 138,278 Net income 101,252 179,941 88,242 [d] 3,860,002 142,010,155 155,218 Loss 44,089 8,614 3,527 [d] 1,438,328 2,117,620 16,940 Other net rental income (loss) 49,932 64,938 105,284 637,363 684,162 3,443,039 24,516 Total net income [4] 24,655,669 18,849,251 23,816,417 76,865,578 375,069,578 211,660,228 108,208,189 Footnotes at end of table.
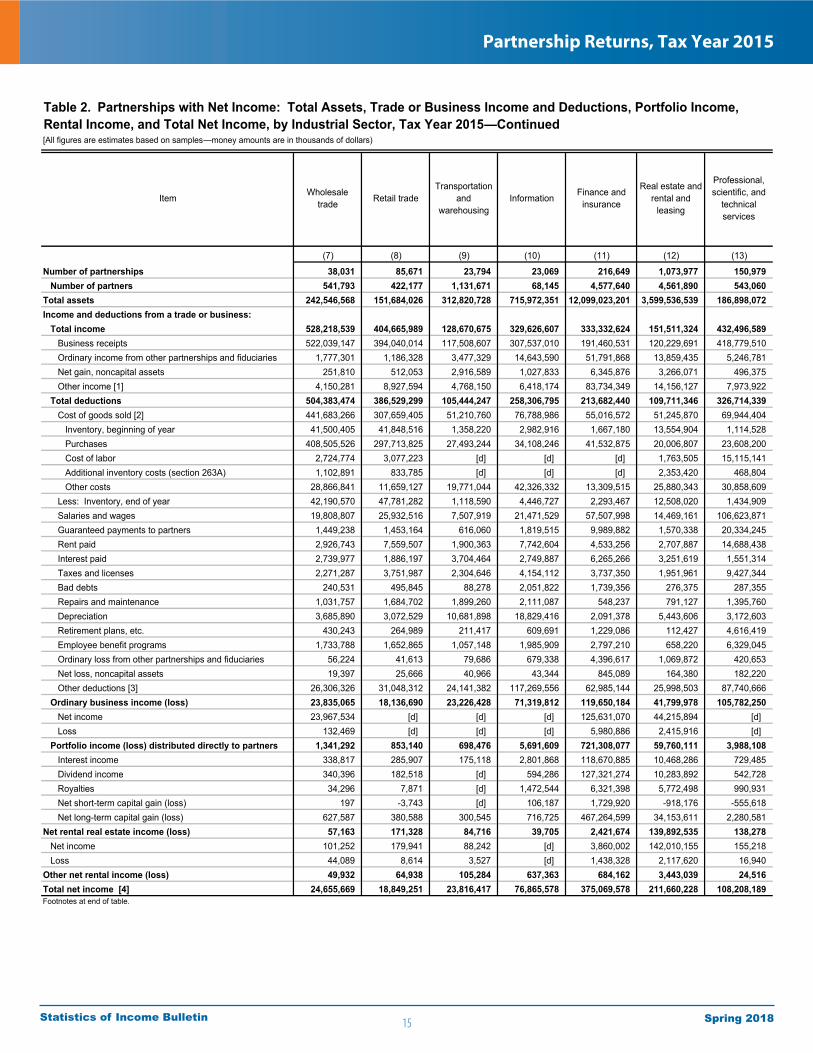
Table 2. Partnerships with Net Income: Total Assets, Trade or Business Income and Deductions, Portfolio Income, Rental Income, and Total Net Income, by Industrial Sector, Tax Year 2015—Continued
Finance and insurance
Wholesaletrade Retail trade
Transportationand
warehousingInformationItem
Real estate and rental and
leasing
Professional,scientific, and
technicalservices
15
Partnership Returns, Tax Year 2015
Spring 2018Statistics of Income Bulletin
[All figures are estimates based on samples—money amounts are in thousands of dollars)
(14) (15) (16) (17) (18) (19) (20)
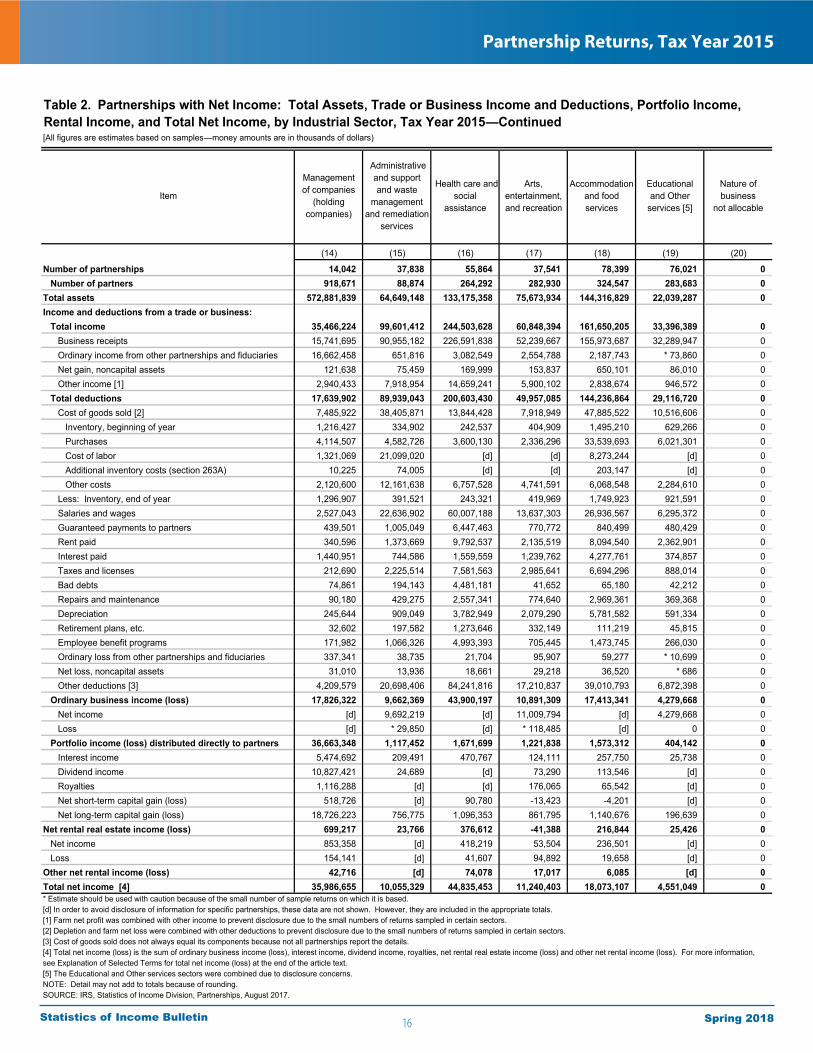
Number of partnerships 14,042 37,838 55,864 37,541 78,399 76,021 0 Number of partners 918,671 88,874 264,292 282,930 324,547 283,683 0 Total assets 572,881,839 64,649,148 133,175,358 75,673,934 144,316,829 22,039,287 0 Income and deductions from a trade or business: Total income 35,466,224 99,601,412 244,503,628 60,848,394 161,650,205 33,396,389 0 Business receipts 15,741,695 90,955,182 226,591,838 52,239,667 155,973,687 32,289,947 0 Ordinary income from other partnerships and fiduciaries 16,662,458 651,816 3,082,549 2,554,788 2,187,743 * 73,860 0 Net gain, noncapital assets 121,638 75,459 169,999 153,837 650,101 86,010 0 Other income [1] 2,940,433 7,918,954 14,659,241 5,900,102 2,838,674 946,572 0 Total deductions 17,639,902 89,939,043 200,603,430 49,957,085 144,236,864 29,116,720 0 Cost of goods sold [2] 7,485,922 38,405,871 13,844,428 7,918,949 47,885,522 10,516,606 0 Inventory, beginning of year 1,216,427 334,902 242,537 404,909 1,495,210 629,266 0 Purchases 4,114,507 4,582,726 3,600,130 2,336,296 33,539,693 6,021,301 0 Cost of labor 1,321,069 21,099,020 [d] [d] 8,273,244 [d] 0 Additional inventory costs (section 263A) 10,225 74,005 [d] [d] 203,147 [d] 0 Other costs 2,120,600 12,161,638 6,757,528 4,741,591 6,068,548 2,284,610 0 Less: Inventory, end of year 1,296,907 391,521 243,321 419,969 1,749,923 921,591 0 Salaries and wages 2,527,043 22,636,902 60,007,188 13,637,303 26,936,567 6,295,372 0 Guaranteed payments to partners 439,501 1,005,049 6,447,463 770,772 840,499 480,429 0 Rent paid 340,596 1,373,669 9,792,537 2,135,519 8,094,540 2,362,901 0 Interest paid 1,440,951 744,586 1,559,559 1,239,762 4,277,761 374,857 0 Taxes and licenses 212,690 2,225,514 7,581,563 2,985,641 6,694,296 888,014 0 Bad debts 74,861 194,143 4,481,181 41,652 65,180 42,212 0 Repairs and maintenance 90,180 429,275 2,557,341 774,640 2,969,361 369,368 0 Depreciation 245,644 909,049 3,782,949 2,079,290 5,781,582 591,334 0 Retirement plans, etc. 32,602 197,582 1,273,646 332,149 111,219 45,815 0 Employee benefit programs 171,982 1,066,326 4,993,393 705,445 1,473,745 266,030 0 Ordinary loss from other partnerships and fiduciaries 337,341 38,735 21,704 95,907 59,277 * 10,699 0 Net loss, noncapital assets 31,010 13,936 18,661 29,218 36,520 * 686 0 Other deductions [3] 4,209,579 20,698,406 84,241,816 17,210,837 39,010,793 6,872,398 0 Ordinary business income (loss) 17,826,322 9,662,369 43,900,197 10,891,309 17,413,341 4,279,668 0 Net income [d] 9,692,219 [d] 11,009,794 [d] 4,279,668 0 Loss [d] * 29,850 [d] * 118,485 [d] 0 0 Portfolio income (loss) distributed directly to partners 36,663,348 1,117,452 1,671,699 1,221,838 1,573,312 404,142 0 Interest income 5,474,692 209,491 470,767 124,111 257,750 25,738 0 Dividend income 10,827,421 24,689 [d] 73,290 113,546 [d] 0 Royalties 1,116,288 [d] [d] 176,065 65,542 [d] 0 Net short-term capital gain (loss) 518,726 [d] 90,780 -13,423 -4,201 [d] 0 Net long-term capital gain (loss) 18,726,223 756,775 1,096,353 861,795 1,140,676 196,639 0 Net rental real estate income (loss) 699,217 23,766 376,612 -41,388 216,844 25,426 0 Net income 853,358 [d] 418,219 53,504 236,501 [d] 0 Loss 154,141 [d] 41,607 94,892 19,658 [d] 0 Other net rental income (loss) 42,716 [d] 74,078 17,017 6,085 [d] 0 Total net income [4] 35,986,655 10,055,329 44,835,453 11,240,403 18,073,107 4,551,049 0
Table 2. Partnerships with Net Income: Total Assets, Trade or Business Income and Deductions, Portfolio Income, Rental Income, and Total Net Income, by Industrial Sector, Tax Year 2015—Continued
* Estimate should be used with caution because of the small number of sample returns on which it is based.[d] In order to avoid disclosure of information for specific partnerships, these data are not shown. However, they are included in the appropriate totals.[1] Farm net profit was combined with other income to prevent disclosure due to the small numbers of returns sampled in certain sectors.[2] Depletion and farm net loss were combined with other deductions to prevent disclosure due to the small numbers of returns sampled in certain sectors.[3] Cost of goods sold does not always equal its components because not all partnerships report the details.[4] Total net income (loss) is the sum of ordinary business income (loss), interest income, dividend income, royalties, net rental real estate income (loss) and other net rental income (loss). For more information, see Explanation of Selected Terms for total net income (loss) at the end of the article text.[5] The Educational and Other services sectors were combined due to disclosure concerns.NOTE: Detail may not add to totals because of rounding.SOURCE: IRS, Statistics of Income Division, Partnerships, August 2017.
Accommodationand food services
Educationaland Other
services [5]
Nature of business
not allocable
Managementof companies
(holdingcompanies)
Administrativeand supportand waste
managementand remediation
services
Health care and social
assistance
Arts,entertainment,and recreation
Item
16
Partnership Returns, Tax Year 2015
Spring 2018Statistics of Income Bulletin
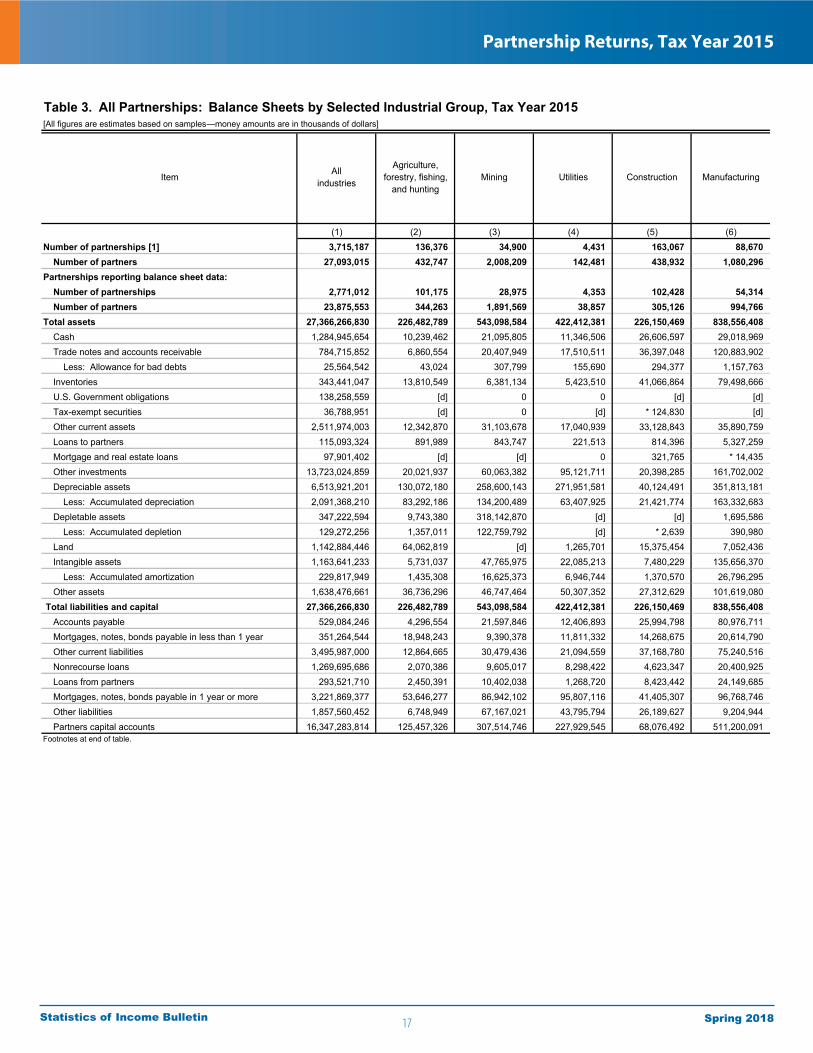
[All figures are estimates based on samples—money amounts are in thousands of dollars]
(1) (2) (3) (4) (5) (6)Number of partnerships [1] 3,715,187 136,376 34,900 4,431 163,067 88,670 Number of partners 27,093,015 432,747 2,008,209 142,481 438,932 1,080,296 Partnerships reporting balance sheet data: Number of partnerships 2,771,012 101,175 28,975 4,353 102,428 54,314 Number of partners 23,875,553 344,263 1,891,569 38,857 305,126 994,766 Total assets 27,366,266,830 226,482,789 543,098,584 422,412,381 226,150,469 838,556,408 Cash 1,284,945,654 10,239,462 21,095,805 11,346,506 26,606,597 29,018,969 Trade notes and accounts receivable 784,715,852 6,860,554 20,407,949 17,510,511 36,397,048 120,883,902 Less: Allowance for bad debts 25,564,542 43,024 307,799 155,690 294,377 1,157,763 Inventories 343,441,047 13,810,549 6,381,134 5,423,510 41,066,864 79,498,666 U.S. Government obligations 138,258,559 [d] 0 0 [d] [d] Tax-exempt securities 36,788,951 [d] 0 [d] * 124,830 [d] Other current assets 2,511,974,003 12,342,870 31,103,678 17,040,939 33,128,843 35,890,759 Loans to partners 115,093,324 891,989 843,747 221,513 814,396 5,327,259 Mortgage and real estate loans 97,901,402 [d] [d] 0 321,765 * 14,435 Other investments 13,723,024,859 20,021,937 60,063,382 95,121,711 20,398,285 161,702,002 Depreciable assets 6,513,921,201 130,072,180 258,600,143 271,951,581 40,124,491 351,813,181 Less: Accumulated depreciation 2,091,368,210 83,292,186 134,200,489 63,407,925 21,421,774 163,332,683 Depletable assets 347,222,594 9,743,380 318,142,870 [d] [d] 1,695,586 Less: Accumulated depletion 129,272,256 1,357,011 122,759,792 [d] * 2,639 390,980 Land 1,142,884,446 64,062,819 [d] 1,265,701 15,375,454 7,052,436 Intangible assets 1,163,641,233 5,731,037 47,765,975 22,085,213 7,480,229 135,656,370 Less: Accumulated amortization 229,817,949 1,435,308 16,625,373 6,946,744 1,370,570 26,796,295 Other assets 1,638,476,661 36,736,296 46,747,464 50,307,352 27,312,629 101,619,080 Total liabilities and capital 27,366,266,830 226,482,789 543,098,584 422,412,381 226,150,469 838,556,408 Accounts payable 529,084,246 4,296,554 21,597,846 12,406,893 25,994,798 80,976,711 Mortgages, notes, bonds payable in less than 1 year 351,264,544 18,948,243 9,390,378 11,811,332 14,268,675 20,614,790 Other current liabilities 3,495,987,000 12,864,665 30,479,436 21,094,559 37,168,780 75,240,516 Nonrecourse loans 1,269,695,686 2,070,386 9,605,017 8,298,422 4,623,347 20,400,925 Loans from partners 293,521,710 2,450,391 10,402,038 1,268,720 8,423,442 24,149,685 Mortgages, notes, bonds payable in 1 year or more 3,221,869,377 53,646,277 86,942,102 95,807,116 41,405,307 96,768,746 Other liabilities 1,857,560,452 6,748,949 67,167,021 43,795,794 26,189,627 9,204,944 Partners capital accounts 16,347,283,814 125,457,326 307,514,746 227,929,545 68,076,492 511,200,091 Footnotes at end of table.
Table 3. All Partnerships: Balance Sheets by Selected Industrial Group, Tax Year 2015
Item Allindustries
Agriculture,forestry, fishing,
and huntingMining Utilities Construction Manufacturing
17
Partnership Returns, Tax Year 2015
Spring 2018Statistics of Income Bulletin
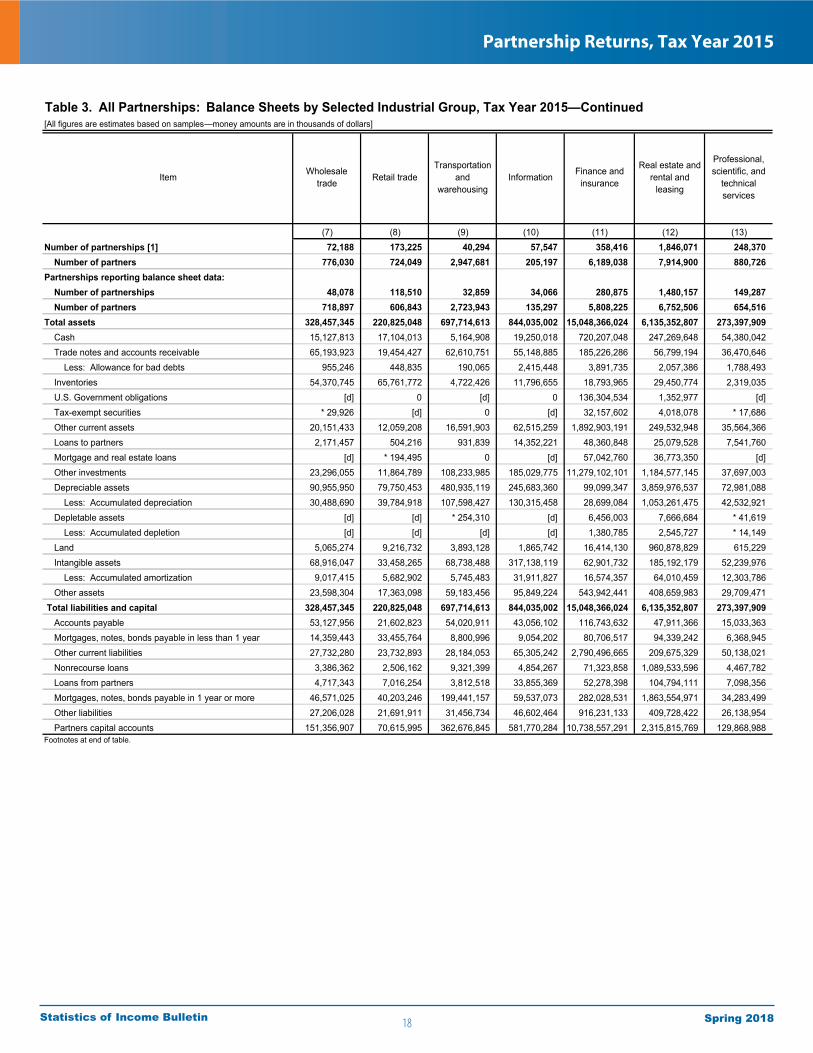
[All figures are estimates based on samples—money amounts are in thousands of dollars]
(7) (8) (9) (10) (11) (12) (13)Number of partnerships [1] 72,188 173,225 40,294 57,547 358,416 1,846,071 248,370 Number of partners 776,030 724,049 2,947,681 205,197 6,189,038 7,914,900 880,726 Partnerships reporting balance sheet data: Number of partnerships 48,078 118,510 32,859 34,066 280,875 1,480,157 149,287 Number of partners 718,897 606,843 2,723,943 135,297 5,808,225 6,752,506 654,516 Total assets 328,457,345 220,825,048 697,714,613 844,035,002 15,048,366,024 6,135,352,807 273,397,909 Cash 15,127,813 17,104,013 5,164,908 19,250,018 720,207,048 247,269,648 54,380,042 Trade notes and accounts receivable 65,193,923 19,454,427 62,610,751 55,148,885 185,226,286 56,799,194 36,470,646 Less: Allowance for bad debts 955,246 448,835 190,065 2,415,448 3,891,735 2,057,386 1,788,493 Inventories 54,370,745 65,761,772 4,722,426 11,796,655 18,793,965 29,450,774 2,319,035 U.S. Government obligations [d] 0 [d] 0 136,304,534 1,352,977 [d] Tax-exempt securities * 29,926 [d] 0 [d] 32,157,602 4,018,078 * 17,686 Other current assets 20,151,433 12,059,208 16,591,903 62,515,259 1,892,903,191 249,532,948 35,564,366 Loans to partners 2,171,457 504,216 931,839 14,352,221 48,360,848 25,079,528 7,541,760 Mortgage and real estate loans [d] * 194,495 0 [d] 57,042,760 36,773,350 [d] Other investments 23,296,055 11,864,789 108,233,985 185,029,775 11,279,102,101 1,184,577,145 37,697,003 Depreciable assets 90,955,950 79,750,453 480,935,119 245,683,360 99,099,347 3,859,976,537 72,981,088 Less: Accumulated depreciation 30,488,690 39,784,918 107,598,427 130,315,458 28,699,084 1,053,261,475 42,532,921 Depletable assets [d] [d] * 254,310 [d] 6,456,003 7,666,684 * 41,619 Less: Accumulated depletion [d] [d] [d] [d] 1,380,785 2,545,727 * 14,149 Land 5,065,274 9,216,732 3,893,128 1,865,742 16,414,130 960,878,829 615,229 Intangible assets 68,916,047 33,458,265 68,738,488 317,138,119 62,901,732 185,192,179 52,239,976 Less: Accumulated amortization 9,017,415 5,682,902 5,745,483 31,911,827 16,574,357 64,010,459 12,303,786 Other assets 23,598,304 17,363,098 59,183,456 95,849,224 543,942,441 408,659,983 29,709,471 Total liabilities and capital 328,457,345 220,825,048 697,714,613 844,035,002 15,048,366,024 6,135,352,807 273,397,909 Accounts payable 53,127,956 21,602,823 54,020,911 43,056,102 116,743,632 47,911,366 15,033,363 Mortgages, notes, bonds payable in less than 1 year 14,359,443 33,455,764 8,800,996 9,054,202 80,706,517 94,339,242 6,368,945 Other current liabilities 27,732,280 23,732,893 28,184,053 65,305,242 2,790,496,665 209,675,329 50,138,021 Nonrecourse loans 3,386,362 2,506,162 9,321,399 4,854,267 71,323,858 1,089,533,596 4,467,782 Loans from partners 4,717,343 7,016,254 3,812,518 33,855,369 52,278,398 104,794,111 7,098,356 Mortgages, notes, bonds payable in 1 year or more 46,571,025 40,203,246 199,441,157 59,537,073 282,028,531 1,863,554,971 34,283,499 Other liabilities 27,206,028 21,691,911 31,456,734 46,602,464 916,231,133 409,728,422 26,138,954 Partners capital accounts 151,356,907 70,615,995 362,676,845 581,770,284 10,738,557,291 2,315,815,769 129,868,988 Footnotes at end of table.
Table 3. All Partnerships: Balance Sheets by Selected Industrial Group, Tax Year 2015—Continued
Finance and insurance
Wholesaletrade Retail trade
Transportationand
warehousingInformationItem
Real estate and rental and
leasing
Professional,scientific, and
technicalservices
18
Partnership Returns, Tax Year 2015
Spring 2018Statistics of Income Bulletin
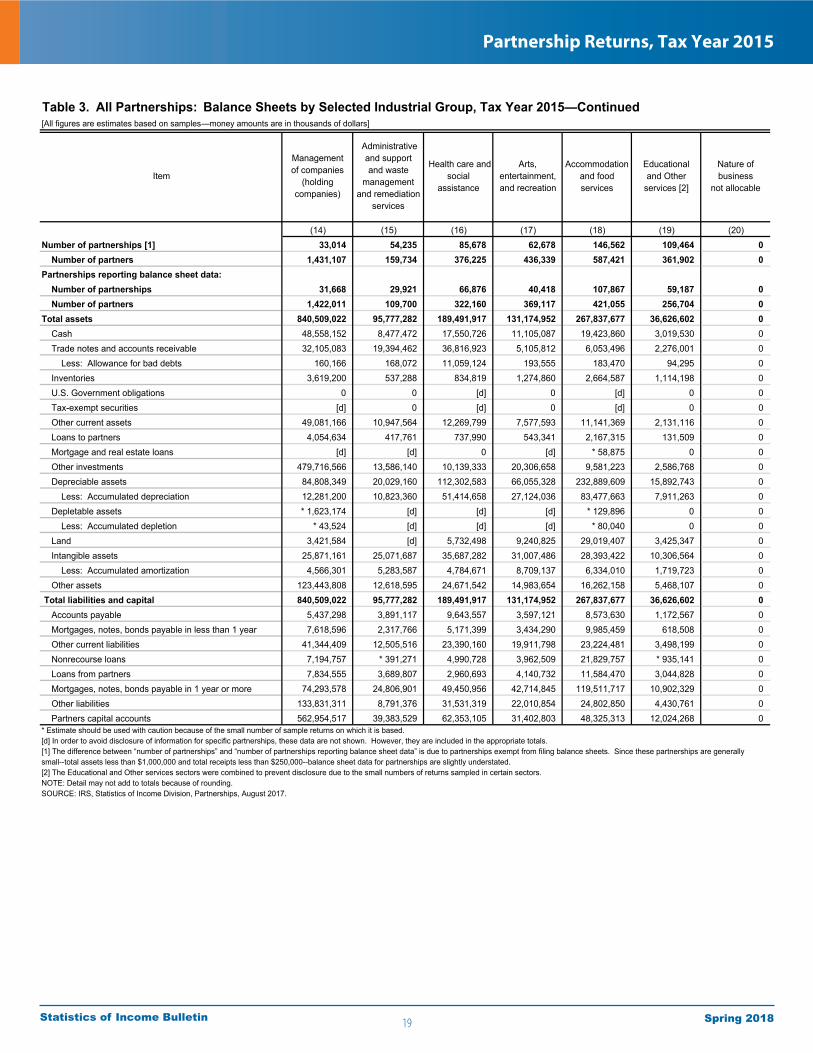
[All figures are estimates based on samples—money amounts are in thousands of dollars]
(14) (15) (16) (17) (18) (19) (20)Number of partnerships [1] 33,014 54,235 85,678 62,678 146,562 109,464 0 Number of partners 1,431,107 159,734 376,225 436,339 587,421 361,902 0 Partnerships reporting balance sheet data: Number of partnerships 31,668 29,921 66,876 40,418 107,867 59,187 0 Number of partners 1,422,011 109,700 322,160 369,117 421,055 256,704 0 Total assets 840,509,022 95,777,282 189,491,917 131,174,952 267,837,677 36,626,602 0 Cash 48,558,152 8,477,472 17,550,726 11,105,087 19,423,860 3,019,530 0 Trade notes and accounts receivable 32,105,083 19,394,462 36,816,923 5,105,812 6,053,496 2,276,001 0 Less: Allowance for bad debts 160,166 168,072 11,059,124 193,555 183,470 94,295 0 Inventories 3,619,200 537,288 834,819 1,274,860 2,664,587 1,114,198 0 U.S. Government obligations 0 0 [d] 0 [d] 0 0 Tax-exempt securities [d] 0 [d] 0 [d] 0 0 Other current assets 49,081,166 10,947,564 12,269,799 7,577,593 11,141,369 2,131,116 0 Loans to partners 4,054,634 417,761 737,990 543,341 2,167,315 131,509 0 Mortgage and real estate loans [d] [d] 0 [d] * 58,875 0 0 Other investments 479,716,566 13,586,140 10,139,333 20,306,658 9,581,223 2,586,768 0 Depreciable assets 84,808,349 20,029,160 112,302,583 66,055,328 232,889,609 15,892,743 0 Less: Accumulated depreciation 12,281,200 10,823,360 51,414,658 27,124,036 83,477,663 7,911,263 0 Depletable assets * 1,623,174 [d] [d] [d] * 129,896 0 0 Less: Accumulated depletion * 43,524 [d] [d] [d] * 80,040 0 0 Land 3,421,584 [d] 5,732,498 9,240,825 29,019,407 3,425,347 0 Intangible assets 25,871,161 25,071,687 35,687,282 31,007,486 28,393,422 10,306,564 0 Less: Accumulated amortization 4,566,301 5,283,587 4,784,671 8,709,137 6,334,010 1,719,723 0 Other assets 123,443,808 12,618,595 24,671,542 14,983,654 16,262,158 5,468,107 0 Total liabilities and capital 840,509,022 95,777,282 189,491,917 131,174,952 267,837,677 36,626,602 0 Accounts payable 5,437,298 3,891,117 9,643,557 3,597,121 8,573,630 1,172,567 0 Mortgages, notes, bonds payable in less than 1 year 7,618,596 2,317,766 5,171,399 3,434,290 9,985,459 618,508 0 Other current liabilities 41,344,409 12,505,516 23,390,160 19,911,798 23,224,481 3,498,199 0 Nonrecourse loans 7,194,757 * 391,271 4,990,728 3,962,509 21,829,757 * 935,141 0 Loans from partners 7,834,555 3,689,807 2,960,693 4,140,732 11,584,470 3,044,828 0 Mortgages, notes, bonds payable in 1 year or more 74,293,578 24,806,901 49,450,956 42,714,845 119,511,717 10,902,329 0 Other liabilities 133,831,311 8,791,376 31,531,319 22,010,854 24,802,850 4,430,761 0 Partners capital accounts 562,954,517 39,383,529 62,353,105 31,402,803 48,325,313 12,024,268 0
Table 3. All Partnerships: Balance Sheets by Selected Industrial Group, Tax Year 2015—Continued
* Estimate should be used with caution because of the small number of sample returns on which it is based.[d] In order to avoid disclosure of information for specific partnerships, these data are not shown. However, they are included in the appropriate totals.[1] The difference between “number of partnerships” and “number of partnerships reporting balance sheet data” is due to partnerships exempt from filing balance sheets. Since these partnerships are generally small--total assets less than $1,000,000 and total receipts less than $250,000--balance sheet data for partnerships are slightly understated.[2] The Educational and Other services sectors were combined to prevent disclosure due to the small numbers of returns sampled in certain sectors.NOTE: Detail may not add to totals because of rounding.SOURCE: IRS, Statistics of Income Division, Partnerships, August 2017.
Accommodationand food services
Educationaland Other
services [2]
Nature of business
not allocable
Managementof companies
(holdingcompanies)
Administrativeand supportand waste
managementand remediation
services
Health care and social
assistance
Arts,entertainment,and recreation
Item
19
Partnership Returns, Tax Year 2015
Spring 2018Statistics of Income Bulletin
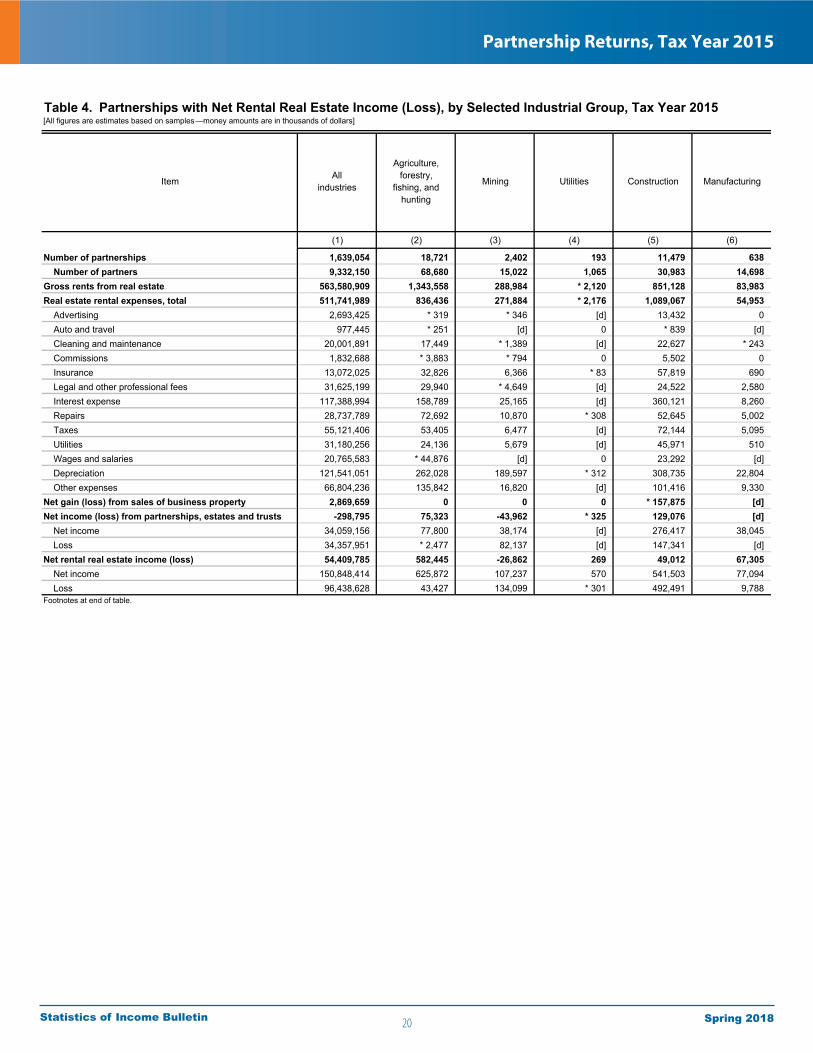
[All figures are estimates based on samples—money amounts are in thousands of dollars]
(1) (2) (3) (4) (5) (6)
Number of partnerships 1,639,054 18,721 2,402 193 11,479 638 Number of partners 9,332,150 68,680 15,022 1,065 30,983 14,698 Gross rents from real estate 563,580,909 1,343,558 288,984 * 2,120 851,128 83,983 Real estate rental expenses, total 511,741,989 836,436 271,884 * 2,176 1,089,067 54,953 Advertising 2,693,425 * 319 * 346 [d] 13,432 0 Auto and travel 977,445 * 251 [d] 0 * 839 [d] Cleaning and maintenance 20,001,891 17,449 * 1,389 [d] 22,627 * 243 Commissions 1,832,688 * 3,883 * 794 0 5,502 0 Insurance 13,072,025 32,826 6,366 * 83 57,819 690 Legal and other professional fees 31,625,199 29,940 * 4,649 [d] 24,522 2,580 Interest expense 117,388,994 158,789 25,165 [d] 360,121 8,260 Repairs 28,737,789 72,692 10,870 * 308 52,645 5,002 Taxes 55,121,406 53,405 6,477 [d] 72,144 5,095 Utilities 31,180,256 24,136 5,679 [d] 45,971 510 Wages and salaries 20,765,583 * 44,876 [d] 0 23,292 [d] Depreciation 121,541,051 262,028 189,597 * 312 308,735 22,804 Other expenses 66,804,236 135,842 16,820 [d] 101,416 9,330 Net gain (loss) from sales of business property 2,869,659 0 0 0 * 157,875 [d] Net income (loss) from partnerships, estates and trusts -298,795 75,323 -43,962 * 325 129,076 [d] Net income 34,059,156 77,800 38,174 [d] 276,417 38,045 Loss 34,357,951 * 2,477 82,137 [d] 147,341 [d] Net rental real estate income (loss) 54,409,785 582,445 -26,862 269 49,012 67,305 Net income 150,848,414 625,872 107,237 570 541,503 77,094 Loss 96,438,628 43,427 134,099 * 301 492,491 9,788 Footnotes at end of table.
Item Allindustries
Agriculture,forestry,
fishing, andhunting
Mining Utilities
Table 4. Partnerships with Net Rental Real Estate Income (Loss), by Selected Industrial Group, Tax Year 2015
Construction Manufacturing
20
Partnership Returns, Tax Year 2015
Spring 2018Statistics of Income Bulletin
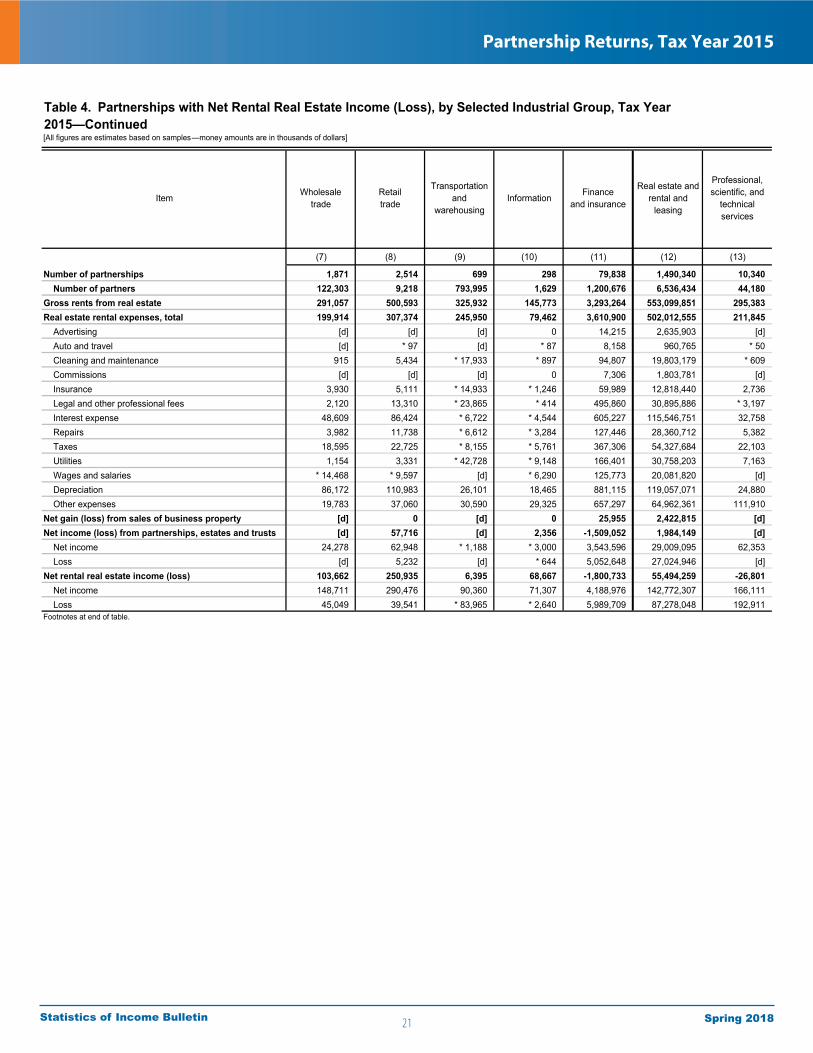
[All figures are estimates based on samples—money amounts are in thousands of dollars]
(7) (8) (9) (10) (11) (12) (13)
Number of partnerships 1,871 2,514 699 298 79,838 1,490,340 10,340 Number of partners 122,303 9,218 793,995 1,629 1,200,676 6,536,434 44,180 Gross rents from real estate 291,057 500,593 325,932 145,773 3,293,264 553,099,851 295,383 Real estate rental expenses, total 199,914 307,374 245,950 79,462 3,610,900 502,012,555 211,845 Advertising [d] [d] [d] 0 14,215 2,635,903 [d] Auto and travel [d] * 97 [d] * 87 8,158 960,765 * 50 Cleaning and maintenance 915 5,434 * 17,933 * 897 94,807 19,803,179 * 609 Commissions [d] [d] [d] 0 7,306 1,803,781 [d] Insurance 3,930 5,111 * 14,933 * 1,246 59,989 12,818,440 2,736 Legal and other professional fees 2,120 13,310 * 23,865 * 414 495,860 30,895,886 * 3,197 Interest expense 48,609 86,424 * 6,722 * 4,544 605,227 115,546,751 32,758 Repairs 3,982 11,738 * 6,612 * 3,284 127,446 28,360,712 5,382 Taxes 18,595 22,725 * 8,155 * 5,761 367,306 54,327,684 22,103 Utilities 1,154 3,331 * 42,728 * 9,148 166,401 30,758,203 7,163 Wages and salaries * 14,468 * 9,597 [d] * 6,290 125,773 20,081,820 [d] Depreciation 86,172 110,983 26,101 18,465 881,115 119,057,071 24,880 Other expenses 19,783 37,060 30,590 29,325 657,297 64,962,361 111,910 Net gain (loss) from sales of business property [d] 0 [d] 0 25,955 2,422,815 [d] Net income (loss) from partnerships, estates and trusts [d] 57,716 [d] 2,356 -1,509,052 1,984,149 [d] Net income 24,278 62,948 * 1,188 * 3,000 3,543,596 29,009,095 62,353 Loss [d] 5,232 [d] * 644 5,052,648 27,024,946 [d] Net rental real estate income (loss) 103,662 250,935 6,395 68,667 -1,800,733 55,494,259 -26,801 Net income 148,711 290,476 90,360 71,307 4,188,976 142,772,307 166,111 Loss 45,049 39,541 * 83,965 * 2,640 5,989,709 87,278,048 192,911 Footnotes at end of table.
Item
Table 4. Partnerships with Net Rental Real Estate Income (Loss), by Selected Industrial Group, Tax Year 2015—Continued
Professional,scientific, and
technicalservices
Real estate and rental and
leasing
Wholesaletrade
Retailtrade
Transportationand
warehousingInformation Finance
and insurance
21
Partnership Returns, Tax Year 2015
Spring 2018Statistics of Income Bulletin
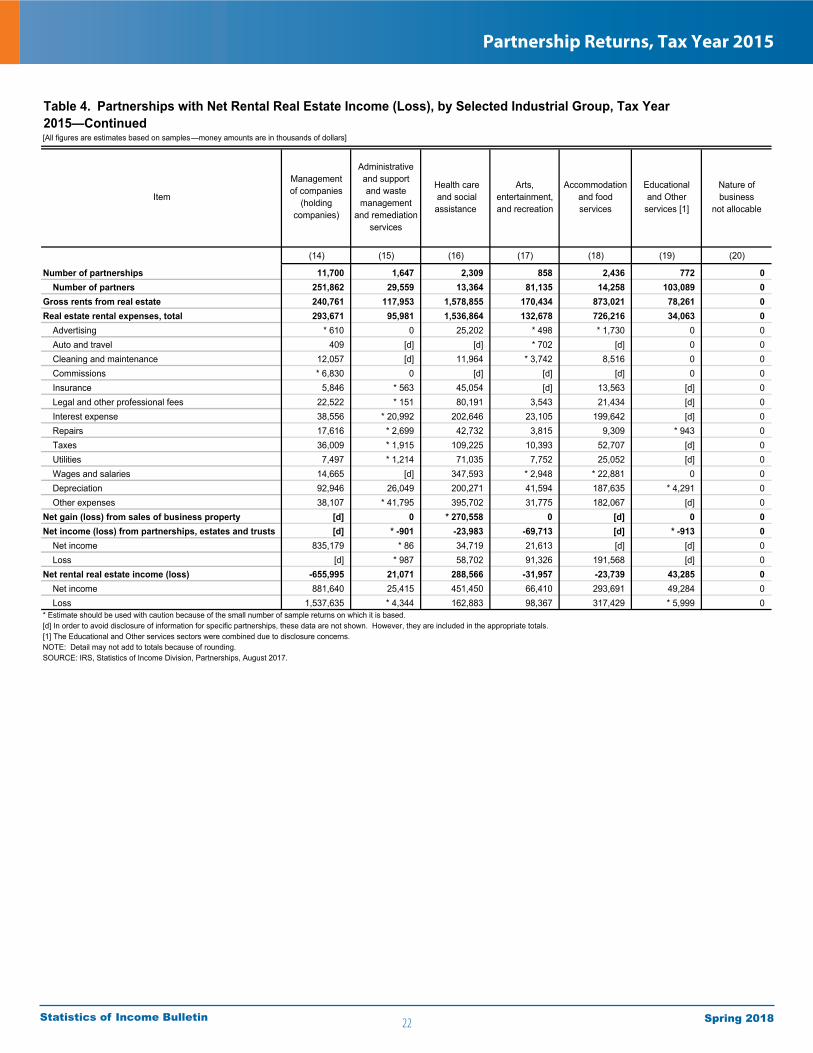
(14) (15) (16) (17) (18) (19) (20)
Number of partnerships 11,700 1,647 2,309 858 2,436 772 0 Number of partners 251,862 29,559 13,364 81,135 14,258 103,089 0 Gross rents from real estate 240,761 117,953 1,578,855 170,434 873,021 78,261 0 Real estate rental expenses, total 293,671 95,981 1,536,864 132,678 726,216 34,063 0 Advertising * 610 0 25,202 * 498 * 1,730 0 0 Auto and travel 409 [d] [d] * 702 [d] 0 0 Cleaning and maintenance 12,057 [d] 11,964 * 3,742 8,516 0 0 Commissions * 6,830 0 [d] [d] [d] 0 0 Insurance 5,846 * 563 45,054 [d] 13,563 [d] 0 Legal and other professional fees 22,522 * 151 80,191 3,543 21,434 [d] 0 Interest expense 38,556 * 20,992 202,646 23,105 199,642 [d] 0 Repairs 17,616 * 2,699 42,732 3,815 9,309 * 943 0 Taxes 36,009 * 1,915 109,225 10,393 52,707 [d] 0 Utilities 7,497 * 1,214 71,035 7,752 25,052 [d] 0 Wages and salaries 14,665 [d] 347,593 * 2,948 * 22,881 0 0 Depreciation 92,946 26,049 200,271 41,594 187,635 * 4,291 0 Other expenses 38,107 * 41,795 395,702 31,775 182,067 [d] 0 Net gain (loss) from sales of business property [d] 0 * 270,558 0 [d] 0 0 Net income (loss) from partnerships, estates and trusts [d] * -901 -23,983 -69,713 [d] * -913 0 Net income 835,179 * 86 34,719 21,613 [d] [d] 0 Loss [d] * 987 58,702 91,326 191,568 [d] 0 Net rental real estate income (loss) -655,995 21,071 288,566 -31,957 -23,739 43,285 0 Net income 881,640 25,415 451,450 66,410 293,691 49,284 0 Loss 1,537,635 * 4,344 162,883 98,367 317,429 * 5,999 0 * Estimate should be used with caution because of the small number of sample returns on which it is based.[d] In order to avoid disclosure of information for specific partnerships, these data are not shown. However, they are included in the appropriate totals.[1] The Educational and Other services sectors were combined due to disclosure concerns.NOTE: Detail may not add to totals because of rounding.SOURCE: IRS, Statistics of Income Division, Partnerships, August 2017.
Item
[All figures are estimates based on samples—money amounts are in thousands of dollars]
Table 4. Partnerships with Net Rental Real Estate Income (Loss), by Selected Industrial Group, Tax Year 2015—Continued
Nature of business
not allocable
Managementof companies
(holdingcompanies)
Administrativeand support and waste
managementand remediation
services
Health care and social assistance
Arts,entertainment,and recreation
Accommodationand foodservices
Educationaland Other
services [1]
22
Partnership Returns, Tax Year 2015
Spring 2018Statistics of Income Bulletin
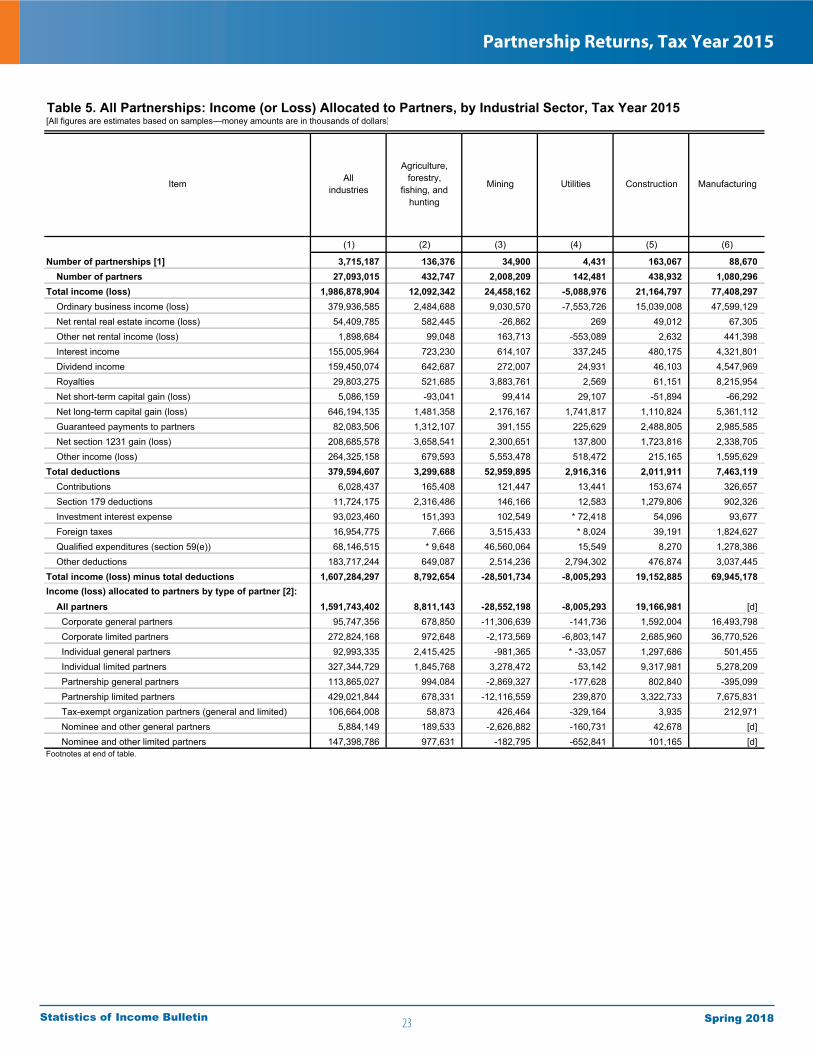
[All figures are estimates based on samples—money amounts are in thousands of dollars]
(1) (2) (3) (4) (5) (6)
Number of partnerships [1] 3,715,187 136,376 34,900 4,431 163,067 88,670 Number of partners 27,093,015 432,747 2,008,209 142,481 438,932 1,080,296 Total income (loss) 1,986,878,904 12,092,342 24,458,162 -5,088,976 21,164,797 77,408,297 Ordinary business income (loss) 379,936,585 2,484,688 9,030,570 -7,553,726 15,039,008 47,599,129 Net rental real estate income (loss) 54,409,785 582,445 -26,862 269 49,012 67,305 Other net rental income (loss) 1,898,684 99,048 163,713 -553,089 2,632 441,398 Interest income 155,005,964 723,230 614,107 337,245 480,175 4,321,801 Dividend income 159,450,074 642,687 272,007 24,931 46,103 4,547,969 Royalties 29,803,275 521,685 3,883,761 2,569 61,151 8,215,954 Net short-term capital gain (loss) 5,086,159 -93,041 99,414 29,107 -51,894 -66,292 Net long-term capital gain (loss) 646,194,135 1,481,358 2,176,167 1,741,817 1,110,824 5,361,112 Guaranteed payments to partners 82,083,506 1,312,107 391,155 225,629 2,488,805 2,985,585 Net section 1231 gain (loss) 208,685,578 3,658,541 2,300,651 137,800 1,723,816 2,338,705 Other income (loss) 264,325,158 679,593 5,553,478 518,472 215,165 1,595,629 Total deductions 379,594,607 3,299,688 52,959,895 2,916,316 2,011,911 7,463,119 Contributions 6,028,437 165,408 121,447 13,441 153,674 326,657 Section 179 deductions 11,724,175 2,316,486 146,166 12,583 1,279,806 902,326 Investment interest expense 93,023,460 151,393 102,549 * 72,418 54,096 93,677 Foreign taxes 16,954,775 7,666 3,515,433 * 8,024 39,191 1,824,627 Qualified expenditures (section 59(e)) 68,146,515 * 9,648 46,560,064 15,549 8,270 1,278,386 Other deductions 183,717,244 649,087 2,514,236 2,794,302 476,874 3,037,445 Total income (loss) minus total deductions 1,607,284,297 8,792,654 -28,501,734 -8,005,293 19,152,885 69,945,178 Income (loss) allocated to partners by type of partner [2]: All partners 1,591,743,402 8,811,143 -28,552,198 -8,005,293 19,166,981 [d] Corporate general partners 95,747,356 678,850 -11,306,639 -141,736 1,592,004 16,493,798 Corporate limited partners 272,824,168 972,648 -2,173,569 -6,803,147 2,685,960 36,770,526 Individual general partners 92,993,335 2,415,425 -981,365 * -33,057 1,297,686 501,455 Individual limited partners 327,344,729 1,845,768 3,278,472 53,142 9,317,981 5,278,209 Partnership general partners 113,865,027 994,084 -2,869,327 -177,628 802,840 -395,099 Partnership limited partners 429,021,844 678,331 -12,116,559 239,870 3,322,733 7,675,831 Tax-exempt organization partners (general and limited) 106,664,008 58,873 426,464 -329,164 3,935 212,971 Nominee and other general partners 5,884,149 189,533 -2,626,882 -160,731 42,678 [d] Nominee and other limited partners 147,398,786 977,631 -182,795 -652,841 101,165 [d] Footnotes at end of table.
Item
Table 5. All Partnerships: Income (or Loss) Allocated to Partners, by Industrial Sector, Tax Year 2015
Allindustries
Agriculture,forestry,
fishing, andhunting
Mining Utilities Construction Manufacturing
23
Partnership Returns, Tax Year 2015
Spring 2018Statistics of Income Bulletin
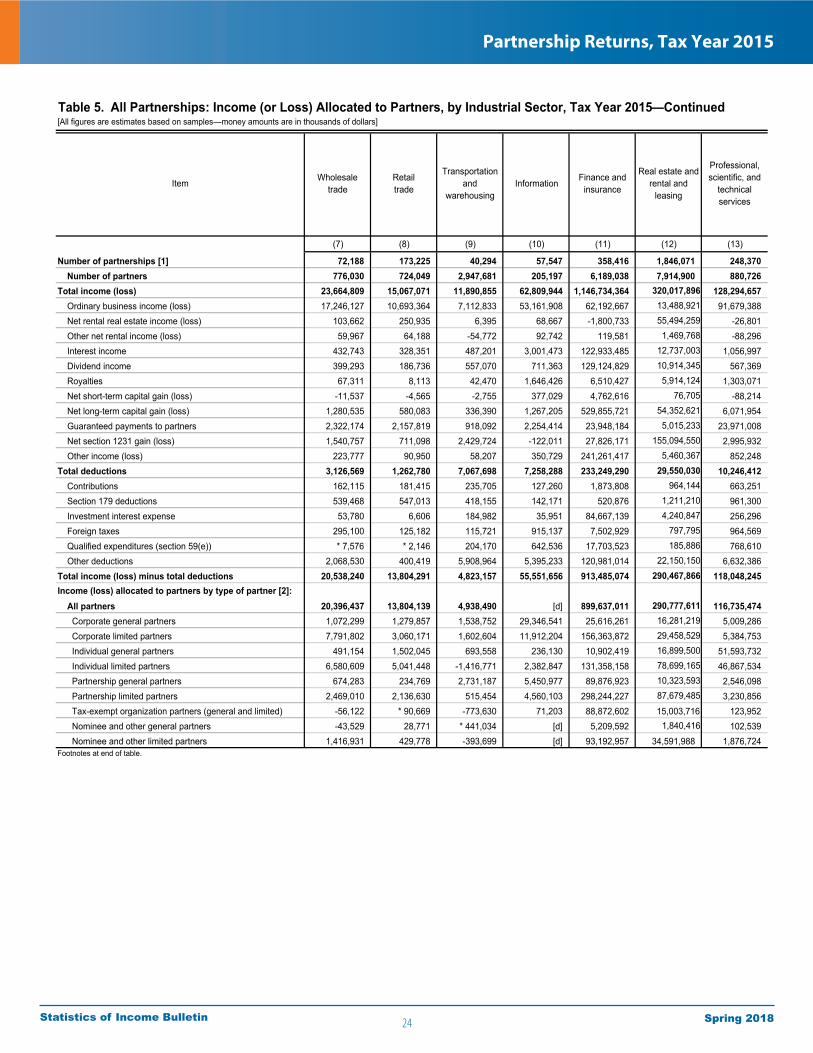
(7) (8) (9) (10) (11) (12) (13)
Number of partnerships [1] 72,188 173,225 40,294 57,547 358,416 1,846,071 248,370 Number of partners 776,030 724,049 2,947,681 205,197 6,189,038 7,914,900 880,726 Total income (loss) 23,664,809 15,067,071 11,890,855 62,809,944 1,146,734,364 320,017,896 128,294,657 Ordinary business income (loss) 17,246,127 10,693,364 7,112,833 53,161,908 62,192,667 13,488,921 91,679,388 Net rental real estate income (loss) 103,662 250,935 6,395 68,667 -1,800,733 55,494,259 -26,801 Other net rental income (loss) 59,967 64,188 -54,772 92,742 119,581 1,469,768 -88,296 Interest income 432,743 328,351 487,201 3,001,473 122,933,485 12,737,003 1,056,997 Dividend income 399,293 186,736 557,070 711,363 129,124,829 10,914,345 567,369 Royalties 67,311 8,113 42,470 1,646,426 6,510,427 5,914,124 1,303,071 Net short-term capital gain (loss) -11,537 -4,565 -2,755 377,029 4,762,616 76,705 -88,214 Net long-term capital gain (loss) 1,280,535 580,083 336,390 1,267,205 529,855,721 54,352,621 6,071,954 Guaranteed payments to partners 2,322,174 2,157,819 918,092 2,254,414 23,948,184 5,015,233 23,971,008 Net section 1231 gain (loss) 1,540,757 711,098 2,429,724 -122,011 27,826,171 155,094,550 2,995,932 Other income (loss) 223,777 90,950 58,207 350,729 241,261,417 5,460,367 852,248Total deductions 3,126,569 1,262,780 7,067,698 7,258,288 233,249,290 29,550,030 10,246,412 Contributions 162,115 181,415 235,705 127,260 1,873,808 964,144 663,251 Section 179 deductions 539,468 547,013 418,155 142,171 520,876 1,211,210 961,300 Investment interest expense 53,780 6,606 184,982 35,951 84,667,139 4,240,847 256,296 Foreign taxes 295,100 125,182 115,721 915,137 7,502,929 797,795 964,569 Qualified expenditures (section 59(e)) * 7,576 * 2,146 204,170 642,536 17,703,523 185,886 768,610 Other deductions 2,068,530 400,419 5,908,964 5,395,233 120,981,014 22,150,150 6,632,386Total income (loss) minus total deductions 20,538,240 13,804,291 4,823,157 55,551,656 913,485,074 290,467,866 118,048,245 Income (loss) allocated to partners by type of partner [2]: All partners 20,396,437 13,804,139 4,938,490 [d] 899,637,011 290,777,611 116,735,474 Corporate general partners 1,072,299 1,279,857 1,538,752 29,346,541 25,616,261 16,281,219 5,009,286 Corporate limited partners 7,791,802 3,060,171 1,602,604 11,912,204 156,363,872 29,458,529 5,384,753 Individual general partners 491,154 1,502,045 693,558 236,130 10,902,419 16,899,500 51,593,732 Individual limited partners 6,580,609 5,041,448 -1,416,771 2,382,847 131,358,158 78,699,165 46,867,534 Partnership general partners 674,283 234,769 2,731,187 5,450,977 89,876,923 10,323,593 2,546,098 Partnership limited partners 2,469,010 2,136,630 515,454 4,560,103 298,244,227 87,679,485 3,230,856 Tax-exempt organization partners (general and limited) -56,122 * 90,669 -773,630 71,203 88,872,602 15,003,716 123,952 Nominee and other general partners -43,529 28,771 * 441,034 [d] 5,209,592 1,840,416 102,539 Nominee and other limited partners 1,416,931 429,778 -393,699 [d] 93,192,957 34,591,988 1,876,724 Footnotes at end of table.
Finance and insurance
Real estate and rental and
leasing
Professional,scientific, and
technicalservices
Item
Table 5. All Partnerships: Income (or Loss) Allocated to Partners, by Industrial Sector, Tax Year 2015—Continued[All figures are estimates based on samples—money amounts are in thousands of dollars]
InformationWholesaletrade
Retailtrade
Transportationand
warehousing
24
Partnership Returns, Tax Year 2015
Spring 2018Statistics of Income Bulletin
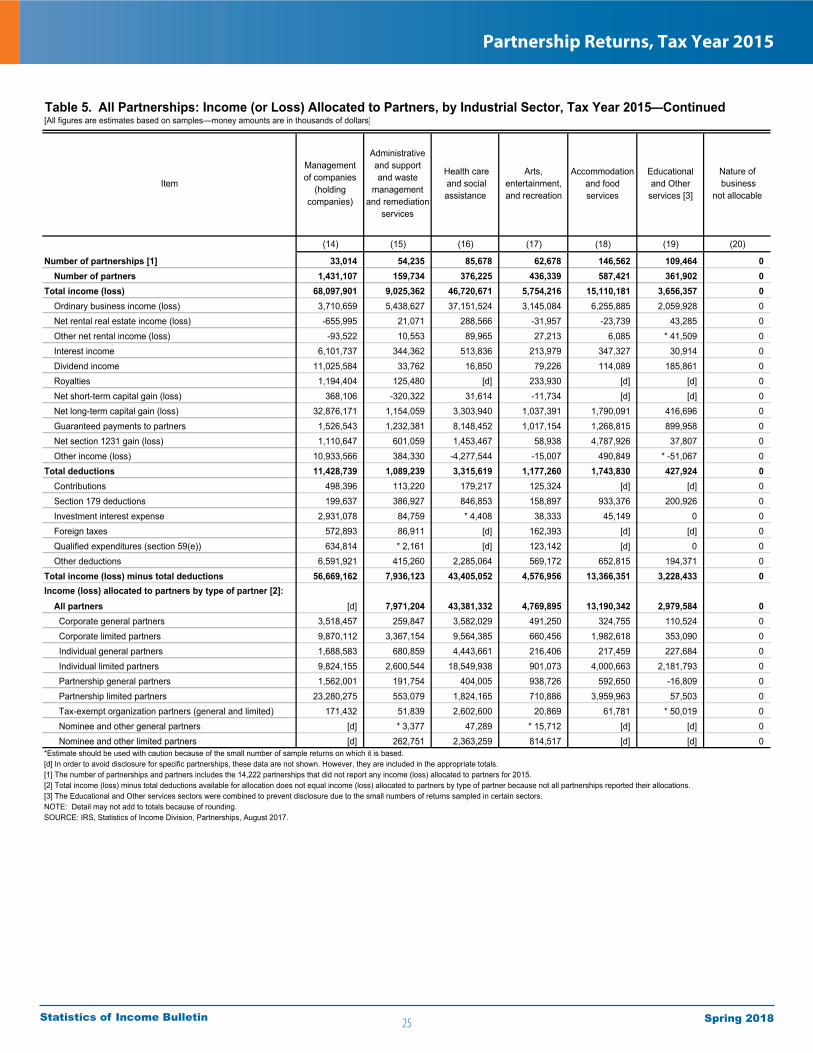
[All figures are estimates based on samples—money amounts are in thousands of dollars]
(14) (15) (16) (17) (18) (19) (20)
Number of partnerships [1] 33,014 54,235 85,678 62,678 146,562 109,464 0 Number of partners 1,431,107 159,734 376,225 436,339 587,421 361,902 0 Total income (loss) 68,097,901 9,025,362 46,720,671 5,754,216 15,110,181 3,656,357 0 Ordinary business income (loss) 3,710,659 5,438,627 37,151,524 3,145,084 6,255,885 2,059,928 0 Net rental real estate income (loss) -655,995 21,071 288,566 -31,957 -23,739 43,285 0 Other net rental income (loss) -93,522 10,553 89,965 27,213 6,085 * 41,509 0 Interest income 6,101,737 344,362 513,836 213,979 347,327 30,914 0 Dividend income 11,025,584 33,762 16,850 79,226 114,089 185,861 0 Royalties 1,194,404 125,480 [d] 233,930 [d] [d] 0 Net short-term capital gain (loss) 368,106 -320,322 31,614 -11,734 [d] [d] 0 Net long-term capital gain (loss) 32,876,171 1,154,059 3,303,940 1,037,391 1,790,091 416,696 0 Guaranteed payments to partners 1,526,543 1,232,381 8,148,452 1,017,154 1,268,815 899,958 0 Net section 1231 gain (loss) 1,110,647 601,059 1,453,467 58,938 4,787,926 37,807 0 Other income (loss) 10,933,566 384,330 -4,277,544 -15,007 490,849 * -51,067 0 Total deductions 11,428,739 1,089,239 3,315,619 1,177,260 1,743,830 427,924 0 Contributions 498,396 113,220 179,217 125,324 [d] [d] 0 Section 179 deductions 199,637 386,927 846,853 158,897 933,376 200,926 0 Investment interest expense 2,931,078 84,759 * 4,408 38,333 45,149 0 0 Foreign taxes 572,893 86,911 [d] 162,393 [d] [d] 0 Qualified expenditures (section 59(e)) 634,814 * 2,161 [d] 123,142 [d] 0 0 Other deductions 6,591,921 415,260 2,285,064 569,172 652,815 194,371 0 Total income (loss) minus total deductions 56,669,162 7,936,123 43,405,052 4,576,956 13,366,351 3,228,433 0 Income (loss) allocated to partners by type of partner [2]: All partners [d] 7,971,204 43,381,332 4,769,895 13,190,342 2,979,584 0 Corporate general partners 3,518,457 259,847 3,582,029 491,250 324,755 110,524 0 Corporate limited partners 9,870,112 3,367,154 9,564,385 660,456 1,982,618 353,090 0 Individual general partners 1,688,583 680,859 4,443,661 216,406 217,459 227,684 0 Individual limited partners 9,824,155 2,600,544 18,549,938 901,073 4,000,663 2,181,793 0 Partnership general partners 1,562,001 191,754 404,005 938,726 592,650 -16,809 0 Partnership limited partners 23,280,275 553,079 1,824,165 710,886 3,959,963 57,503 0 Tax-exempt organization partners (general and limited) 171,432 51,839 2,602,600 20,869 61,781 * 50,019 0 Nominee and other general partners [d] * 3,377 47,289 * 15,712 [d] [d] 0 Nominee and other limited partners [d] 262,751 2,363,259 814,517 [d] [d] 0
Accommodationand food services
Educationaland Other
services [3]
Managementof companies
(holdingcompanies)
Item
Administrativeand support and waste
managementand remediation
services
Health care and social assistance
Arts,entertainment,and recreation
Table 5. All Partnerships: Income (or Loss) Allocated to Partners, by Industrial Sector, Tax Year 2015—Continued
*Estimate should be used with caution because of the small number of sample returns on which it is based.[d] In order to avoid disclosure for specific partnerships, these data are not shown. However, they are included in the appropriate totals.[1] The number of partnerships and partners includes the 14,222 partnerships that did not report any income (loss) allocated to partners for 2015.[2] Total income (loss) minus total deductions available for allocation does not equal income (loss) allocated to partners by type of partner because not all partnerships reported their allocations.[3] The Educational and Other services sectors were combined to prevent disclosure due to the small numbers of returns sampled in certain sectors.NOTE: Detail may not add to totals because of rounding.SOURCE: IRS, Statistics of Income Division, Partnerships, August 2017.
Nature of business
not allocable
25
Partnership Returns, Tax Year 2015
Spring 2018Statistics of Income Bulletin
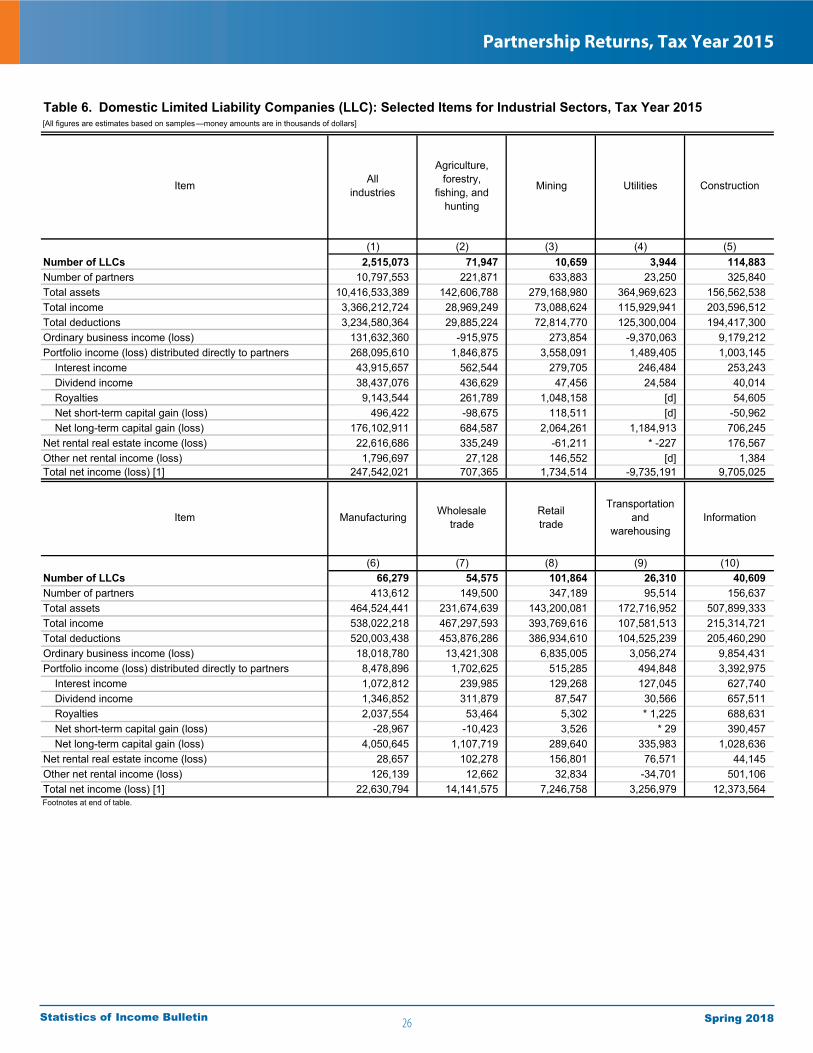
(1) (2) (3) (4) (5)Number of LLCs 2,515,073 71,947 10,659 3,944 114,883 Number of partners 10,797,553 221,871 633,883 23,250 325,840 Total assets 10,416,533,389 142,606,788 279,168,980 364,969,623 156,562,538 Total income 3,366,212,724 28,969,249 73,088,624 115,929,941 203,596,512 Total deductions 3,234,580,364 29,885,224 72,814,770 125,300,004 194,417,300 Ordinary business income (loss) 131,632,360 -915,975 273,854 -9,370,063 9,179,212 Portfolio income (loss) distributed directly to partners 268,095,610 1,846,875 3,558,091 1,489,405 1,003,145 Interest income 43,915,657 562,544 279,705 246,484 253,243 Dividend income 38,437,076 436,629 47,456 24,584 40,014 Royalties 9,143,544 261,789 1,048,158 [d] 54,605 Net short-term capital gain (loss) 496,422 -98,675 118,511 [d] -50,962 Net long-term capital gain (loss) 176,102,911 684,587 2,064,261 1,184,913 706,245 Net rental real estate income (loss) 22,616,686 335,249 -61,211 * -227 176,567 Other net rental income (loss) 1,796,697 27,128 146,552 [d] 1,384 Total net income (loss) [1] 247,542,021 707,365 1,734,514 -9,735,191 9,705,025
(6) (7) (8) (9) (10)Number of LLCs 66,279 54,575 101,864 26,310 40,609 Number of partners 413,612 149,500 347,189 95,514 156,637 Total assets 464,524,441 231,674,639 143,200,081 172,716,952 507,899,333 Total income 538,022,218 467,297,593 393,769,616 107,581,513 215,314,721 Total deductions 520,003,438 453,876,286 386,934,610 104,525,239 205,460,290 Ordinary business income (loss) 18,018,780 13,421,308 6,835,005 3,056,274 9,854,431 Portfolio income (loss) distributed directly to partners 8,478,896 1,702,625 515,285 494,848 3,392,975 Interest income 1,072,812 239,985 129,268 127,045 627,740 Dividend income 1,346,852 311,879 87,547 30,566 657,511 Royalties 2,037,554 53,464 5,302 * 1,225 688,631 Net short-term capital gain (loss) -28,967 -10,423 3,526 * 29 390,457 Net long-term capital gain (loss) 4,050,645 1,107,719 289,640 335,983 1,028,636 Net rental real estate income (loss) 28,657 102,278 156,801 76,571 44,145 Other net rental income (loss) 126,139 12,662 32,834 -34,701 501,106 Total net income (loss) [1] 22,630,794 14,141,575 7,246,758 3,256,979 12,373,564
Allindustries
Agriculture,forestry,
fishing, andhunting
Mining Utilities
Table 6. Domestic Limited Liability Companies (LLC): Selected Items for Industrial Sectors, Tax Year 2015[All figures are estimates based on samples—money amounts are in thousands of dollars]
Footnotes at end of table.
Item
Item Information
Construction
Manufacturing Wholesaletrade
Retailtrade
Transportationand
warehousing
26
Partnership Returns, Tax Year 2015
Spring 2018Statistics of Income Bulletin
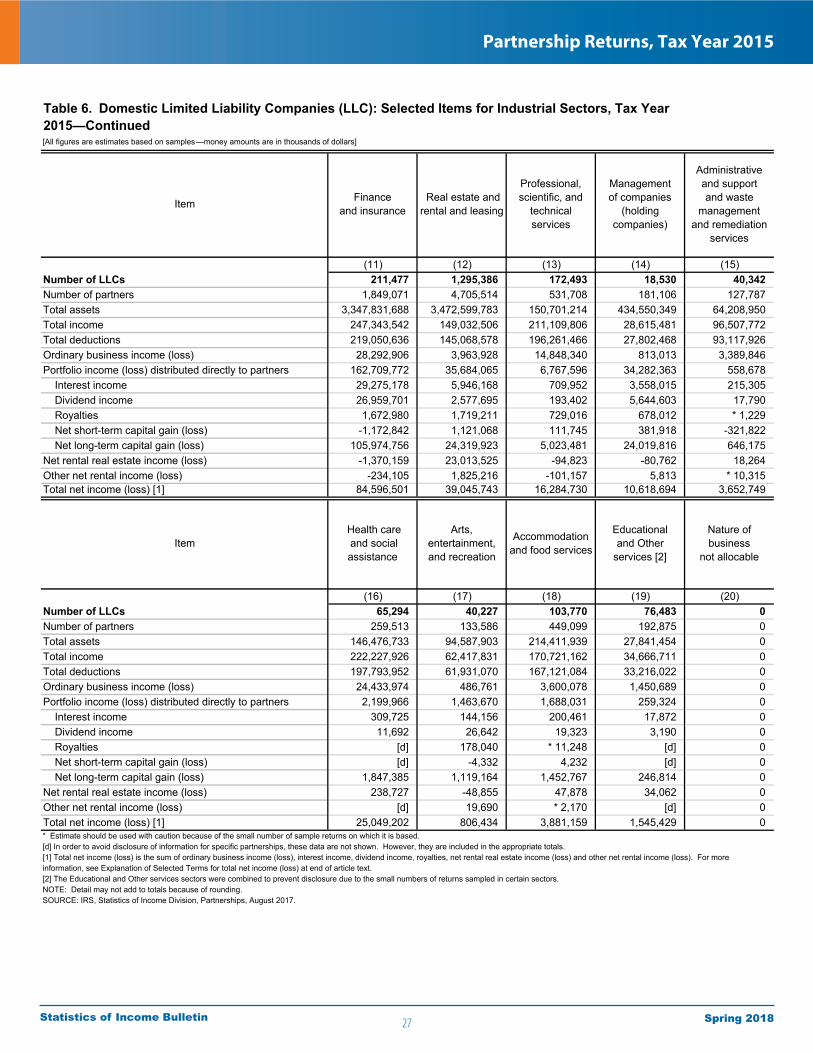
(11) (12) (13) (14) (15)Number of LLCs 211,477 1,295,386 172,493 18,530 40,342 Number of partners 1,849,071 4,705,514 531,708 181,106 127,787 Total assets 3,347,831,688 3,472,599,783 150,701,214 434,550,349 64,208,950 Total income 247,343,542 149,032,506 211,109,806 28,615,481 96,507,772 Total deductions 219,050,636 145,068,578 196,261,466 27,802,468 93,117,926 Ordinary business income (loss) 28,292,906 3,963,928 14,848,340 813,013 3,389,846 Portfolio income (loss) distributed directly to partners 162,709,772 35,684,065 6,767,596 34,282,363 558,678 Interest income 29,275,178 5,946,168 709,952 3,558,015 215,305 Dividend income 26,959,701 2,577,695 193,402 5,644,603 17,790 Royalties 1,672,980 1,719,211 729,016 678,012 * 1,229 Net short-term capital gain (loss) -1,172,842 1,121,068 111,745 381,918 -321,822 Net long-term capital gain (loss) 105,974,756 24,319,923 5,023,481 24,019,816 646,175 Net rental real estate income (loss) -1,370,159 23,013,525 -94,823 -80,762 18,264 Other net rental income (loss) -234,105 1,825,216 -101,157 5,813 * 10,315 Total net income (loss) [1] 84,596,501 39,045,743 16,284,730 10,618,694 3,652,749
(16) (17) (18) (19) (20)Number of LLCs 65,294 40,227 103,770 76,483 0 Number of partners 259,513 133,586 449,099 192,875 0 Total assets 146,476,733 94,587,903 214,411,939 27,841,454 0 Total income 222,227,926 62,417,831 170,721,162 34,666,711 0 Total deductions 197,793,952 61,931,070 167,121,084 33,216,022 0 Ordinary business income (loss) 24,433,974 486,761 3,600,078 1,450,689 0 Portfolio income (loss) distributed directly to partners 2,199,966 1,463,670 1,688,031 259,324 0 Interest income 309,725 144,156 200,461 17,872 0 Dividend income 11,692 26,642 19,323 3,190 0 Royalties [d] 178,040 * 11,248 [d] 0 Net short-term capital gain (loss) [d] -4,332 4,232 [d] 0 Net long-term capital gain (loss) 1,847,385 1,119,164 1,452,767 246,814 0 Net rental real estate income (loss) 238,727 -48,855 47,878 34,062 0 Other net rental income (loss) [d] 19,690 * 2,170 [d] 0 Total net income (loss) [1] 25,049,202 806,434 3,881,159 1,545,429 0
Health care and social assistance
Arts,entertainment,and recreation
Accommodationand food services
Educationaland Other
services [2]
Nature of business
not allocable
Financeand insurance
Real estate and rental and leasing
Professional,scientific, and
technicalservices
Managementof companies
(holdingcompanies)
Administrativeand support and waste
managementand remediation
services
* Estimate should be used with caution because of the small number of sample returns on which it is based.[d] In order to avoid disclosure of information for specific partnerships, these data are not shown. However, they are included in the appropriate totals.[1] Total net income (loss) is the sum of ordinary business income (loss), interest income, dividend income, royalties, net rental real estate income (loss) and other net rental income (loss). For more information, see Explanation of Selected Terms for total net income (loss) at end of article text.[2] The Educational and Other services sectors were combined to prevent disclosure due to the small numbers of returns sampled in certain sectors.NOTE: Detail may not add to totals because of rounding.SOURCE: IRS, Statistics of Income Division, Partnerships, August 2017.
Table 6. Domestic Limited Liability Companies (LLC): Selected Items for Industrial Sectors, Tax Year 2015—Continued[All figures are estimates based on samples—money amounts are in thousands of dollars]
Item
Item
27
Partnership Returns, Tax Year 2015
Spring 2018Statistics of Income Bulletin
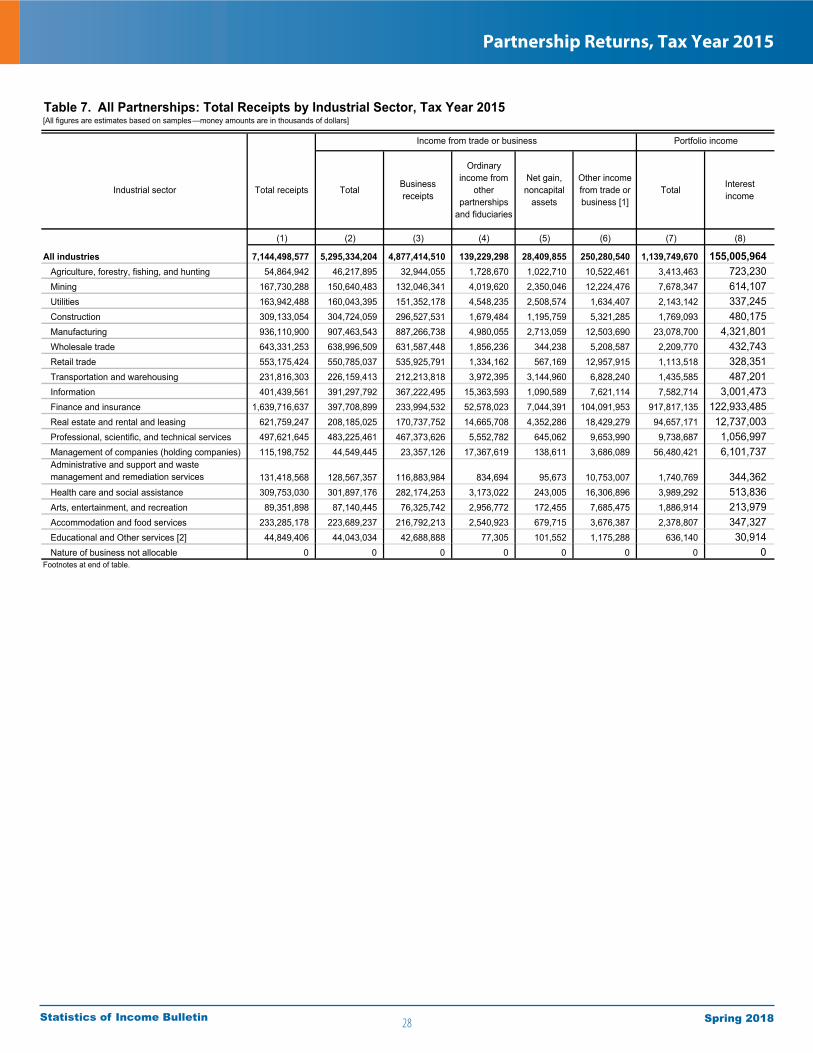
[All figures are estimates based on samples—money amounts are in thousands of dollars]
Industrial sector Total receipts Total Businessreceipts
Ordinaryincome from
otherpartnerships
and fiduciaries
Net gain, noncapital
assets
Other income from trade or business [1]
Total Interestincome
(1) (2) (3) (4) (5) (6) (7) (8)
All industries 7,144,498,577 5,295,334,204 4,877,414,510 139,229,298 28,409,855 250,280,540 1,139,749,670 155,005,964 Agriculture, forestry, fishing, and hunting 54,864,942 46,217,895 32,944,055 1,728,670 1,022,710 10,522,461 3,413,463 723,230 Mining 167,730,288 150,640,483 132,046,341 4,019,620 2,350,046 12,224,476 7,678,347 614,107 Utilities 163,942,488 160,043,395 151,352,178 4,548,235 2,508,574 1,634,407 2,143,142 337,245 Construction 309,133,054 304,724,059 296,527,531 1,679,484 1,195,759 5,321,285 1,769,093 480,175 Manufacturing 936,110,900 907,463,543 887,266,738 4,980,055 2,713,059 12,503,690 23,078,700 4,321,801 Wholesale trade 643,331,253 638,996,509 631,587,448 1,856,236 344,238 5,208,587 2,209,770 432,743 Retail trade 553,175,424 550,785,037 535,925,791 1,334,162 567,169 12,957,915 1,113,518 328,351 Transportation and warehousing 231,816,303 226,159,413 212,213,818 3,972,395 3,144,960 6,828,240 1,435,585 487,201 Information 401,439,561 391,297,792 367,222,495 15,363,593 1,090,589 7,621,114 7,582,714 3,001,473 Finance and insurance 1,639,716,637 397,708,899 233,994,532 52,578,023 7,044,391 104,091,953 917,817,135 122,933,485 Real estate and rental and leasing 621,759,247 208,185,025 170,737,752 14,665,708 4,352,286 18,429,279 94,657,171 12,737,003 Professional, scientific, and technical services 497,621,645 483,225,461 467,373,626 5,552,782 645,062 9,653,990 9,738,687 1,056,997 Management of companies (holding companies) 115,198,752 44,549,445 23,357,126 17,367,619 138,611 3,686,089 56,480,421 6,101,737 Administrative and support and waste management and remediation services 131,418,568 128,567,357 116,883,984 834,694 95,673 10,753,007 1,740,769 344,362 Health care and social assistance 309,753,030 301,897,176 282,174,253 3,173,022 243,005 16,306,896 3,989,292 513,836 Arts, entertainment, and recreation 89,351,898 87,140,445 76,325,742 2,956,772 172,455 7,685,475 1,886,914 213,979 Accommodation and food services 233,285,178 223,689,237 216,792,213 2,540,923 679,715 3,676,387 2,378,807 347,327 Educational and Other services [2] 44,849,406 44,043,034 42,688,888 77,305 101,552 1,175,288 636,140 30,914 Nature of business not allocable 0 0 0 0 0 0 0 0Footnotes at end of table.
Table 7. All Partnerships: Total Receipts by Industrial Sector, Tax Year 2015
Income from trade or business Portfolio income
28
Partnership Returns, Tax Year 2015
Spring 2018Statistics of Income Bulletin
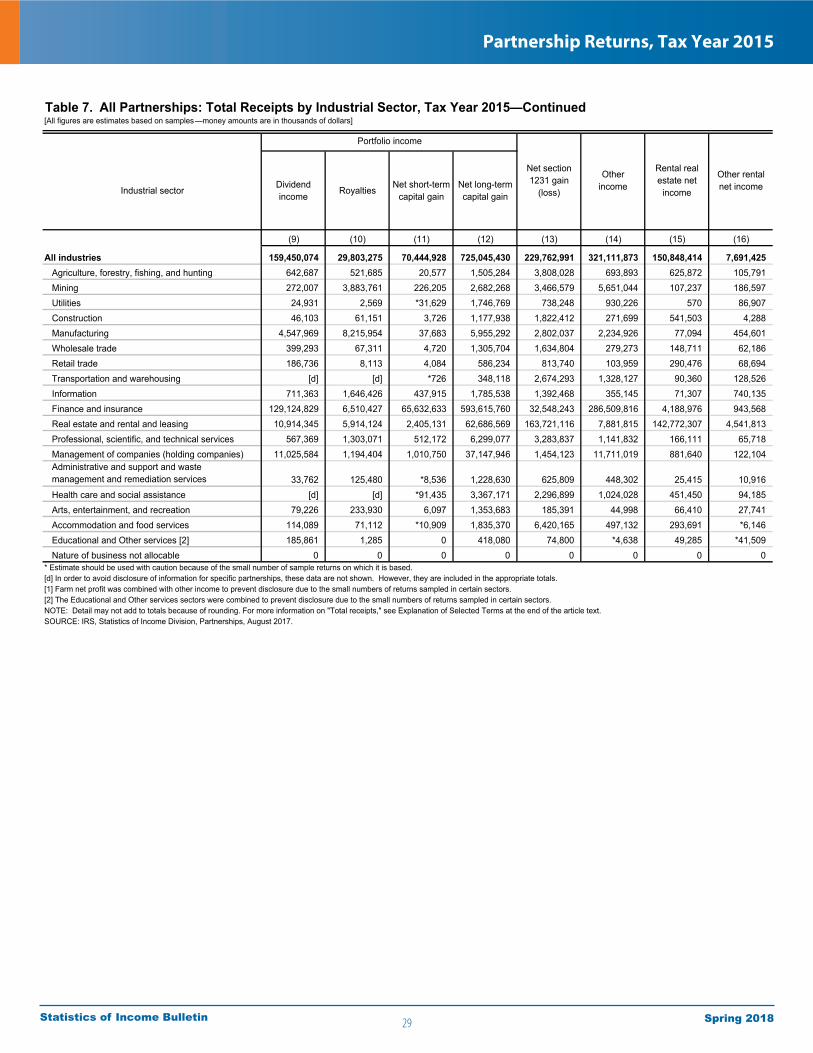
[All figures are estimates based on samples—money amounts are in thousands of dollars]
Industrial sector Dividendincome Royalties Net short-term
capital gainNet long-term capital gain
(9) (10) (11) (12) (13) (14) (15) (16)
All industries 159,450,074 29,803,275 70,444,928 725,045,430 229,762,991 321,111,873 150,848,414 7,691,425 Agriculture, forestry, fishing, and hunting 642,687 521,685 20,577 1,505,284 3,808,028 693,893 625,872 105,791 Mining 272,007 3,883,761 226,205 2,682,268 3,466,579 5,651,044 107,237 186,597 Utilities 24,931 2,569 *31,629 1,746,769 738,248 930,226 570 86,907 Construction 46,103 61,151 3,726 1,177,938 1,822,412 271,699 541,503 4,288 Manufacturing 4,547,969 8,215,954 37,683 5,955,292 2,802,037 2,234,926 77,094 454,601 Wholesale trade 399,293 67,311 4,720 1,305,704 1,634,804 279,273 148,711 62,186 Retail trade 186,736 8,113 4,084 586,234 813,740 103,959 290,476 68,694 Transportation and warehousing [d] [d] *726 348,118 2,674,293 1,328,127 90,360 128,526 Information 711,363 1,646,426 437,915 1,785,538 1,392,468 355,145 71,307 740,135 Finance and insurance 129,124,829 6,510,427 65,632,633 593,615,760 32,548,243 286,509,816 4,188,976 943,568 Real estate and rental and leasing 10,914,345 5,914,124 2,405,131 62,686,569 163,721,116 7,881,815 142,772,307 4,541,813 Professional, scientific, and technical services 567,369 1,303,071 512,172 6,299,077 3,283,837 1,141,832 166,111 65,718 Management of companies (holding companies) 11,025,584 1,194,404 1,010,750 37,147,946 1,454,123 11,711,019 881,640 122,104 Administrative and support and waste management and remediation services 33,762 125,480 *8,536 1,228,630 625,809 448,302 25,415 10,916 Health care and social assistance [d] [d] *91,435 3,367,171 2,296,899 1,024,028 451,450 94,185 Arts, entertainment, and recreation 79,226 233,930 6,097 1,353,683 185,391 44,998 66,410 27,741 Accommodation and food services 114,089 71,112 *10,909 1,835,370 6,420,165 497,132 293,691 *6,146 Educational and Other services [2] 185,861 1,285 0 418,080 74,800 *4,638 49,285 *41,509 Nature of business not allocable 0 0 0 0 0 0 0 0
Table 7. All Partnerships: Total Receipts by Industrial Sector, Tax Year 2015—Continued
* Estimate should be used with caution because of the small number of sample returns on which it is based.[d] In order to avoid disclosure of information for specific partnerships, these data are not shown. However, they are included in the appropriate totals.[1] Farm net profit was combined with other income to prevent disclosure due to the small numbers of returns sampled in certain sectors.[2] The Educational and Other services sectors were combined to prevent disclosure due to the small numbers of returns sampled in certain sectors.NOTE: Detail may not add to totals because of rounding. For more information on "Total receipts," see Explanation of Selected Terms at the end of the article text.SOURCE: IRS, Statistics of Income Division, Partnerships, August 2017.
Other rental net income
Net section 1231 gain
(loss)
Otherincome
Rental real estate net
income
Portfolio income
29
Partnership Returns, Tax Year 2015
Spring 2018Statistics of Income Bulletin
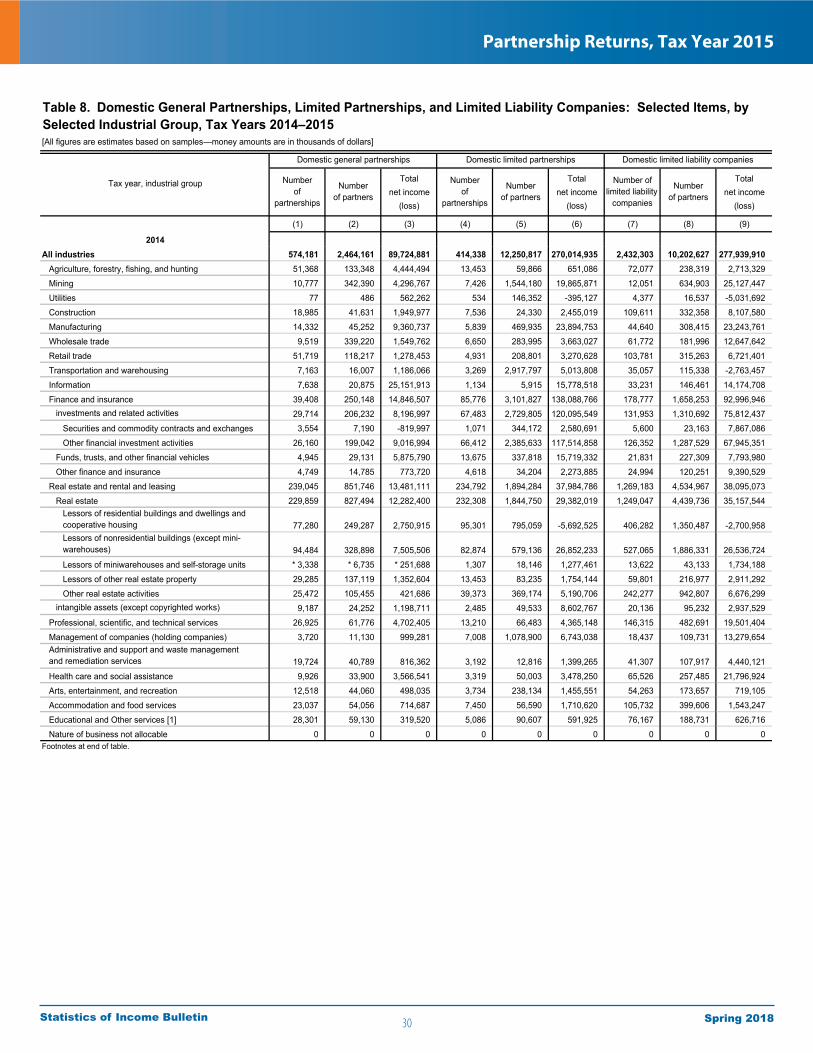
Total Total Totalnet income net income net income
(loss) (loss) (loss)
(1) (2) (3) (4) (5) (6) (7) (8) (9)
2014All industries 574,181 2,464,161 89,724,881 414,338 12,250,817 270,014,935 2,432,303 10,202,627 277,939,910 Agriculture, forestry, fishing, and hunting 51,368 133,348 4,444,494 13,453 59,866 651,086 72,077 238,319 2,713,329
Mining 10,777 342,390 4,296,767 7,426 1,544,180 19,865,871 12,051 634,903 25,127,447
Utilities 77 486 562,262 534 146,352 -395,127 4,377 16,537 -5,031,692
Construction 18,985 41,631 1,949,977 7,536 24,330 2,455,019 109,611 332,358 8,107,580
Manufacturing 14,332 45,252 9,360,737 5,839 469,935 23,894,753 44,640 308,415 23,243,761
Wholesale trade 9,519 339,220 1,549,762 6,650 283,995 3,663,027 61,772 181,996 12,647,642
Retail trade 51,719 118,217 1,278,453 4,931 208,801 3,270,628 103,781 315,263 6,721,401
Transportation and warehousing 7,163 16,007 1,186,066 3,269 2,917,797 5,013,808 35,057 115,338 -2,763,457
Information 7,638 20,875 25,151,913 1,134 5,915 15,778,518 33,231 146,461 14,174,708
Finance and insurance 39,408 250,148 14,846,507 85,776 3,101,827 138,088,766 178,777 1,658,253 92,996,946 y investments and related activities 29,714 206,232 8,196,997 67,483 2,729,805 120,095,549 131,953 1,310,692 75,812,437
Securities and commodity contracts and exchanges 3,554 7,190 -819,997 1,071 344,172 2,580,691 5,600 23,163 7,867,086
Other financial investment activities 26,160 199,042 9,016,994 66,412 2,385,633 117,514,858 126,352 1,287,529 67,945,351
Funds, trusts, and other financial vehicles 4,945 29,131 5,875,790 13,675 337,818 15,719,332 21,831 227,309 7,793,980
Other finance and insurance 4,749 14,785 773,720 4,618 34,204 2,273,885 24,994 120,251 9,390,529
Real estate and rental and leasing 239,045 851,746 13,481,111 234,792 1,894,284 37,984,786 1,269,183 4,534,967 38,095,073
Real estate 229,859 827,494 12,282,400 232,308 1,844,750 29,382,019 1,249,047 4,439,736 35,157,544 Lessors of residential buildings and dwellings and cooperative housing 77,280 249,287 2,750,915 95,301 795,059 -5,692,525 406,282 1,350,487 -2,700,958 Lessors of nonresidential buildings (except mini- warehouses) 94,484 328,898 7,505,506 82,874 579,136 26,852,233 527,065 1,886,331 26,536,724
Lessors of miniwarehouses and self-storage units * 3,338 * 6,735 * 251,688 1,307 18,146 1,277,461 13,622 43,133 1,734,188
Lessors of other real estate property 29,285 137,119 1,352,604 13,453 83,235 1,754,144 59,801 216,977 2,911,292
Other real estate activities 25,472 105,455 421,686 39,373 369,174 5,190,706 242,277 942,807 6,676,299 g intangible assets (except copyrighted works) 9,187 24,252 1,198,711 2,485 49,533 8,602,767 20,136 95,232 2,937,529
Professional, scientific, and technical services 26,925 61,776 4,702,405 13,210 66,483 4,365,148 146,315 482,691 19,501,404
Management of companies (holding companies) 3,720 11,130 999,281 7,008 1,078,900 6,743,038 18,437 109,731 13,279,654 Administrative and support and waste management and remediation services 19,724 40,789 816,362 3,192 12,816 1,399,265 41,307 107,917 4,440,121
Health care and social assistance 9,926 33,900 3,566,541 3,319 50,003 3,478,250 65,526 257,485 21,796,924
Arts, entertainment, and recreation 12,518 44,060 498,035 3,734 238,134 1,455,551 54,263 173,657 719,105
Accommodation and food services 23,037 54,056 714,687 7,450 56,590 1,710,620 105,732 399,606 1,543,247
Educational and Other services [1] 28,301 59,130 319,520 5,086 90,607 591,925 76,167 188,731 626,716
Nature of business not allocable 0 0 0 0 0 0 0 0 0 Footnotes at end of table.
Table 8. Domestic General Partnerships, Limited Partnerships, and Limited Liability Companies: Selected Items, by Selected Industrial Group, Tax Years 2014–2015
Domestic general partnerships Domestic limited partnerships Domestic limited liability companies
Tax year, industrial group
[All figures are estimates based on samples—money amounts are in thousands of dollars]
Numberof
partnerships
Numberof partners
Numberof
partnerships
Numberof partners
Number of limited liability
companies
Numberof partners
30
Partnership Returns, Tax Year 2015
Spring 2018Statistics of Income Bulletin
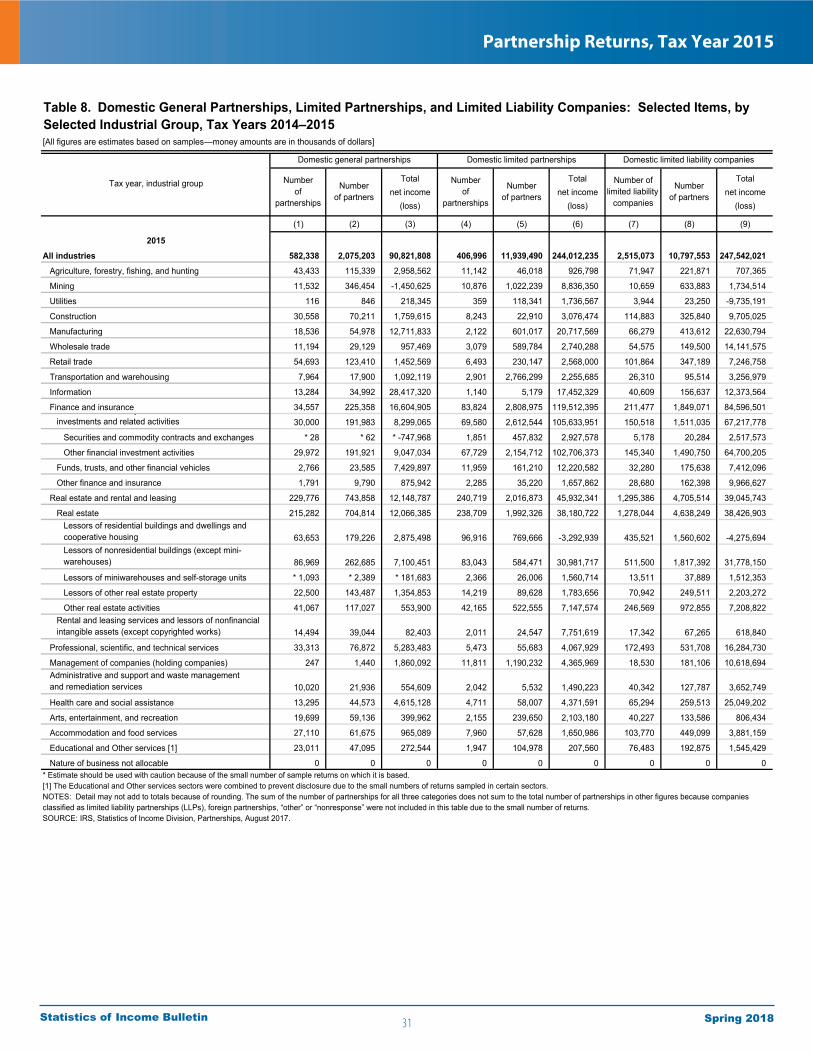
Total Total Totalnet income net income net income
(loss) (loss) (loss)
(1) (2) (3) (4) (5) (6) (7) (8) (9)
2015All industries 582,338 2,075,203 90,821,808 406,996 11,939,490 244,012,235 2,515,073 10,797,553 247,542,021 Agriculture, forestry, fishing, and hunting 43,433 115,339 2,958,562 11,142 46,018 926,798 71,947 221,871 707,365
Mining 11,532 346,454 -1,450,625 10,876 1,022,239 8,836,350 10,659 633,883 1,734,514
Utilities 116 846 218,345 359 118,341 1,736,567 3,944 23,250 -9,735,191
Construction 30,558 70,211 1,759,615 8,243 22,910 3,076,474 114,883 325,840 9,705,025
Manufacturing 18,536 54,978 12,711,833 2,122 601,017 20,717,569 66,279 413,612 22,630,794
Wholesale trade 11,194 29,129 957,469 3,079 589,784 2,740,288 54,575 149,500 14,141,575
Retail trade 54,693 123,410 1,452,569 6,493 230,147 2,568,000 101,864 347,189 7,246,758
Transportation and warehousing 7,964 17,900 1,092,119 2,901 2,766,299 2,255,685 26,310 95,514 3,256,979
Information 13,284 34,992 28,417,320 1,140 5,179 17,452,329 40,609 156,637 12,373,564
Finance and insurance 34,557 225,358 16,604,905 83,824 2,808,975 119,512,395 211,477 1,849,071 84,596,501 , y , investments and related activities 30,000 191,983 8,299,065 69,580 2,612,544 105,633,951 150,518 1,511,035 67,217,778
Securities and commodity contracts and exchanges * 28 * 62 * -747,968 1,851 457,832 2,927,578 5,178 20,284 2,517,573
Other financial investment activities 29,972 191,921 9,047,034 67,729 2,154,712 102,706,373 145,340 1,490,750 64,700,205
Funds, trusts, and other financial vehicles 2,766 23,585 7,429,897 11,959 161,210 12,220,582 32,280 175,638 7,412,096
Other finance and insurance 1,791 9,790 875,942 2,285 35,220 1,657,862 28,680 162,398 9,966,627
Real estate and rental and leasing 229,776 743,858 12,148,787 240,719 2,016,873 45,932,341 1,295,386 4,705,514 39,045,743
Real estate 215,282 704,814 12,066,385 238,709 1,992,326 38,180,722 1,278,044 4,638,249 38,426,903 Lessors of residential buildings and dwellings and cooperative housing 63,653 179,226 2,875,498 96,916 769,666 -3,292,939 435,521 1,560,602 -4,275,694 Lessors of nonresidential buildings (except mini- warehouses) 86,969 262,685 7,100,451 83,043 584,471 30,981,717 511,500 1,817,392 31,778,150
Lessors of miniwarehouses and self-storage units * 1,093 * 2,389 * 181,683 2,366 26,006 1,560,714 13,511 37,889 1,512,353
Lessors of other real estate property 22,500 143,487 1,354,853 14,219 89,628 1,783,656 70,942 249,511 2,203,272
Other real estate activities 41,067 117,027 553,900 42,165 522,555 7,147,574 246,569 972,855 7,208,822 Rental and leasing services and lessors of nonfinancial intangible assets (except copyrighted works) 14,494 39,044 82,403 2,011 24,547 7,751,619 17,342 67,265 618,840
Professional, scientific, and technical services 33,313 76,872 5,283,483 5,473 55,683 4,067,929 172,493 531,708 16,284,730
Management of companies (holding companies) 247 1,440 1,860,092 11,811 1,190,232 4,365,969 18,530 181,106 10,618,694 Administrative and support and waste management and remediation services 10,020 21,936 554,609 2,042 5,532 1,490,223 40,342 127,787 3,652,749
Health care and social assistance 13,295 44,573 4,615,128 4,711 58,007 4,371,591 65,294 259,513 25,049,202
Arts, entertainment, and recreation 19,699 59,136 399,962 2,155 239,650 2,103,180 40,227 133,586 806,434
Accommodation and food services 27,110 61,675 965,089 7,960 57,628 1,650,986 103,770 449,099 3,881,159
Educational and Other services [1] 23,011 47,095 272,544 1,947 104,978 207,560 76,483 192,875 1,545,429
Nature of business not allocable 0 0 0 0 0 0 0 0 0
Table 8. Domestic General Partnerships, Limited Partnerships, and Limited Liability Companies: Selected Items, by Selected Industrial Group, Tax Years 2014–2015[All figures are estimates based on samples—money amounts are in thousands of dollars]
Domestic general partnerships Domestic limited partnerships Domestic limited liability companies
Number of limited liability
companies
Numberof partners
* Estimate should be used with caution because of the small number of sample returns on which it is based.[1] The Educational and Other services sectors were combined to prevent disclosure due to the small numbers of returns sampled in certain sectors.NOTES: Detail may not add to totals because of rounding. The sum of the number of partnerships for all three categories does not sum to the total number of partnerships in other figures because companies classified as limited liability partnerships (LLPs), foreign partnerships, “other” or “nonresponse” were not included in this table due to the small number of returns. SOURCE: IRS, Statistics of Income Division, Partnerships, August 2017.
Tax year, industrial group Numberof
partnerships
Numberof partners
Numberof
partnerships
Numberof partners
31
Partnership Returns, Tax Year 2015
Spring 2018Statistics of Income Bulletin
(1) (2) (3) (4) (5) (6) (7) (8) (9) (10) (11) (12) (13)
2006 2,947 465 253 264 169 793 837 67 42 4 3 30 20
2007 3,096 450 244 252 174 873 946 60 50 6 2 17 23
2008 3,146 413 257 241 171 869 1,029 68 54 7 4 11 22
2009 3,169 390 234 221 176 912 1,057 60 58 7 5 18 30
2010 3,248 339 251 209 166 980 1,110 82 60 8 5 16 22 2011 3,285 341 245 235 159 1,045 1,066 87 61 7 7 10 22
2012 3,389 350 233 253 154 1,162 1,050 85 44 7 9 12 31
2013 3,461 366 197 263 153 1,199 1,087 80 54 12 3 25 23
2014 3,613 351 224 247 167 1,307 1,126 81 59 10 7 23 11
2015 3,715 387 195 256 151 1,395 1,120 81 56 12 19 21 22
Domestic limited liability companies
Domesticlimited liability partnerships
Netincome
Loss Netincome
Loss Netincome
[1] Other partnerships are those which checked the "other" box, Form 1065, Schedule B, line 1, Type of Entity, or did not check a box.NOTES: Detail may not add to totals because of rounding. Domestic limited liability companies, domestic limited liability partnerships, and foreign partnerships are discussed in the Explanation of Selected Terms section. Net income or loss refers to "total net income or loss." Breakeven returns are included in the "loss" columns.SOURCE: IRS, Statistics of Income Division, Partnerships, August 2017.
Table 9a. Numbers of Partnerships, by Type of Entity and Profit Status, Tax Years 2006–2015[Numbers of partnerships is in thousands]
Netincome
Loss Netincome
Loss
Foreignpartnerships
Other [1]
Loss Netincome
Loss
Taxyear
Total number of
partnerships
Domestic general partnerships
Domestic limited partnerships
[Money amounts are in billions of dollars]
(1) (2) (3) (4) (5) (6) (7) (8) (9) (10) (11) (12) (13)
2006 666.7 105.6 17.7 272.3 50.7 331.7 126.4 59.2 4.4 59.8 2.7 42.5 2.4
2007 683.4 118.0 21.0 278.8 68.1 383.4 191.3 63.8 4.9 80.0 4.0 51.9 3.2
2008 458.2 105.8 25.3 276.8 98.5 359.9 305.2 64.5 8.0 80.6 25.6 41.7 8.5
2009 409.9 89.5 27.4 238.4 99.1 323.3 234.4 58.8 4.8 60.1 16.6 25.9 3.7
2010 593.7 94.4 18.7 272.5 77.9 359.3 201.8 65.2 5.2 87.2 3.8 25.8 3.2 2011 580.9 94.5 21.2 274.3 85.9 360.3 210.7 66.0 5.6 91.8 5.3 26.2 3.5
2012 777.9 113.0 17.7 326.6 66.7 436.3 193.9 74.3 3.6 89.9 4.3 27.9 4.0
2013 768.8 106.8 18.3 318.5 69.6 452.5 210.6 72.6 4.1 103.2 4.3 25.9 3.9
2014 837.4 108.1 18.4 344.7 74.7 490.5 212.6 78.1 5.0 103.0 4.2 31.7 3.8
2015 780.5 108.0 17.1 323.8 79.8 492.5 245.0 83.0 4.8 102.4 5.8 27.8 4.5
Domesticlimited liabilitypartnerships
Netincome
Loss Netincome
Loss Netincome
Table 9b. Partnership Total Net Income or Loss, by Type of Entity and Profit Status, Tax Years 2006–2015
[1] Other partnerships are those which checked the "other" box, Form 1065, Schedule B, line 1, Type of Entity, or did not check a box.NOTES: Detail may not add to totals because of rounding. Domestic limited liability companies, domestic limited liability partnerships, and foreign partnerships are discussed in the Explanation of Selected Terms section. Net income or loss refers to "total net income or loss." Breakeven returns are included in the "loss" columns.SOURCE: IRS, Statistics of Income Division, Partnerships, August 2017.
Netincome
Loss Netincome
Loss
Foreignpartnerships
Other [1]
Loss Netincome
Loss
Taxyear
Total net income(loss)
Domestic general partnerships
Domestic limited partnerships
Domestic limited liability companies
(1) (2) (3) (4) (5) (6) (7) (8) (9) (10) (11) (12) (13)
2006 16,728 1,723 943 5,054 1,685 3,157 3,205 350 138 110 71 231 61
2007 18,516 1,674 866 5,881 1,636 3,643 3,442 316 172 163 133 530 60
2008 19,300 1,706 917 4,997 2,058 3,671 3,853 333 205 392 145 854 169
2009 21,142 1,509 717 4,651 3,363 4,110 4,126 302 179 309 139 1,646 92
2010 22,428 1,400 775 5,730 3,132 4,394 4,008 357 185 292 327 1,749 80
2011 24,390 1,198 693 5,668 4,394 4,725 3,978 375 214 392 448 2,204 101
2012 25,334 1,500 686 6,804 3,949 5,283 3,955 383 138 440 112 1,952 129
2013 27,491 1,388 677 7,737 4,697 5,455 4,272 492 158 611 140 1,780 83
2014 27,714 1,631 833 8,301 3,949 5,942 4,261 478 186 565 133 1,382 54
2015 27,093 1,559 516 6,942 4,998 6,227 4,571 500 168 490 114 900 109
Domestic limited liability companies
Domesticlimited liability partnerships
Netincome
Loss Netincome
Loss Netincome
[1] Other partnerships are those which checked the "other" box, Form 1065, Schedule B, line 1, Type of Entity, or did not check a box.NOTES: Detail may not add to totals because of rounding. Domestic limited liability companies, domestic limited liability partnerships, and foreign partnerships are discussed in the Explanation of Selected Terms section. Net income or loss refers to "total net income or loss." Breakeven returns are included in the "loss" columns.SOURCE: IRS, Statistics of Income Division, Partnerships, August 2017.
Table 9c. Numbers of Partners, by Type of Entity and Profit Status, Tax Years 2006–2015[Numbers of partners is in thousands]
Netincome
Loss Netincome
Loss
Foreignpartnerships
Other [1]
Loss Netincome
Loss
Taxyear
Totalnumber of partners
Domestic general partnerships
Domestic limited partnerships
32
Partnership Returns, Tax Year 2015
Spring 2018Statistics of Income Bulletin
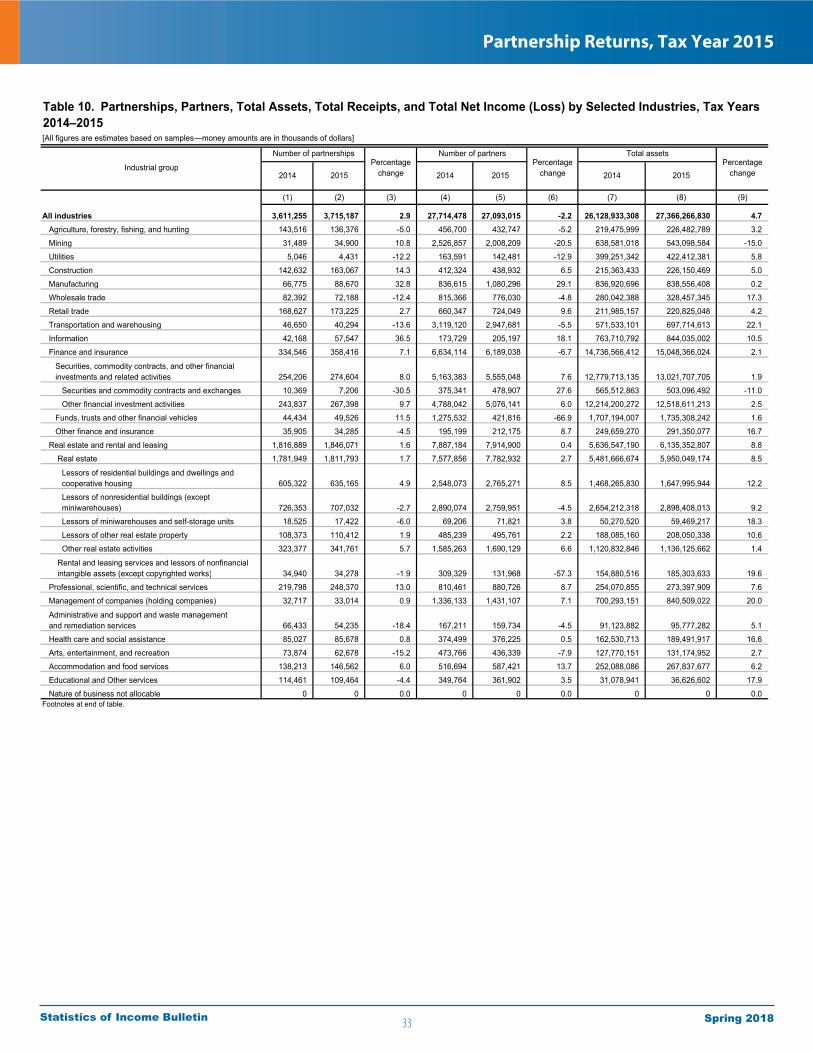
(1) (2) (3) (4) (5) (6) (7) (8) (9)
All industries 3,611,255 3,715,187 2.9 27,714,478 27,093,015 -2.2 26,128,933,308 27,366,266,830 4.7 Agriculture, forestry, fishing, and hunting 143,516 136,376 -5.0 456,700 432,747 -5.2 219,475,999 226,482,789 3.2
Mining 31,489 34,900 10.8 2,526,857 2,008,209 -20.5 638,581,018 543,098,584 -15.0
Utilities 5,046 4,431 -12.2 163,591 142,481 -12.9 399,251,342 422,412,381 5.8
Construction 142,632 163,067 14.3 412,324 438,932 6.5 215,363,433 226,150,469 5.0
Manufacturing 66,775 88,670 32.8 836,615 1,080,296 29.1 836,920,696 838,556,408 0.2
Wholesale trade 82,392 72,188 -12.4 815,366 776,030 -4.8 280,042,388 328,457,345 17.3
Retail trade 168,627 173,225 2.7 660,347 724,049 9.6 211,985,157 220,825,048 4.2
Transportation and warehousing 46,650 40,294 -13.6 3,119,120 2,947,681 -5.5 571,533,101 697,714,613 22.1
Information 42,168 57,547 36.5 173,729 205,197 18.1 763,710,792 844,035,002 10.5
Finance and insurance 334,546 358,416 7.1 6,634,114 6,189,038 -6.7 14,736,566,412 15,048,366,024 2.1
Securities, commodity contracts, and other financial investments and related activities 254,206 274,604 8.0 5,163,383 5,555,048 7.6 12,779,713,135 13,021,707,705 1.9
Securities and commodity contracts and exchanges 10,369 7,206 -30.5 375,341 478,907 27.6 565,512,863 503,096,492 -11.0
Other financial investment activities 243,837 267,398 9.7 4,788,042 5,076,141 6.0 12,214,200,272 12,518,611,213 2.5
Funds, trusts and other financial vehicles 44,434 49,526 11.5 1,275,532 421,816 -66.9 1,707,194,007 1,735,308,242 1.6
Other finance and insurance 35,905 34,285 -4.5 195,199 212,175 8.7 249,659,270 291,350,077 16.7
Real estate and rental and leasing 1,816,889 1,846,071 1.6 7,887,184 7,914,900 0.4 5,636,547,190 6,135,352,807 8.8
Real estate 1,781,949 1,811,793 1.7 7,577,856 7,782,932 2.7 5,481,666,674 5,950,049,174 8.5
Lessors of residential buildings and dwellings and cooperative housing 605,322 635,165 4.9 2,548,073 2,765,271 8.5 1,468,265,830 1,647,995,944 12.2
Lessors of nonresidential buildings (except miniwarehouses) 726,353 707,032 -2.7 2,890,074 2,759,951 -4.5 2,654,212,318 2,898,408,013 9.2
Lessors of miniwarehouses and self-storage units 18,525 17,422 -6.0 69,206 71,821 3.8 50,270,520 59,469,217 18.3
Lessors of other real estate property 108,373 110,412 1.9 485,239 495,761 2.2 188,085,160 208,050,338 10.6
Other real estate activities 323,377 341,761 5.7 1,585,263 1,690,129 6.6 1,120,832,846 1,136,125,662 1.4
Rental and leasing services and lessors of nonfinancial intangible assets (except copyrighted works) 34,940 34,278 -1.9 309,329 131,968 -57.3 154,880,516 185,303,633 19.6
Professional, scientific, and technical services 219,798 248,370 13.0 810,461 880,726 8.7 254,070,855 273,397,909 7.6
Management of companies (holding companies) 32,717 33,014 0.9 1,336,133 1,431,107 7.1 700,293,151 840,509,022 20.0
Administrative and support and waste management and remediation services 66,433 54,235 -18.4 167,211 159,734 -4.5 91,123,882 95,777,282 5.1
Health care and social assistance 85,027 85,678 0.8 374,499 376,225 0.5 162,530,713 189,491,917 16.6
Arts, entertainment, and recreation 73,874 62,678 -15.2 473,766 436,339 -7.9 127,770,151 131,174,952 2.7
Accommodation and food services 138,213 146,562 6.0 516,694 587,421 13.7 252,088,086 267,837,677 6.2
Educational and Other services 114,461 109,464 -4.4 349,764 361,902 3.5 31,078,941 36,626,602 17.9
Nature of business not allocable 0 0 0.0 0 0 0.0 0 0 0.0
2015
Number of partnershipsPercentage
change
Number of partnersPercentage
change
Total assets
2014 2015 2014 2015 2014
Footnotes at end of table.
Industrial group
Table 10. Partnerships, Partners, Total Assets, Total Receipts, and Total Net Income (Loss) by Selected Industries, Tax Years 2014–2015[All figures are estimates based on samples—money amounts are in thousands of dollars]
Percentagechange
33
Partnership Returns, Tax Year 2015
Spring 2018Statistics of Income Bulletin
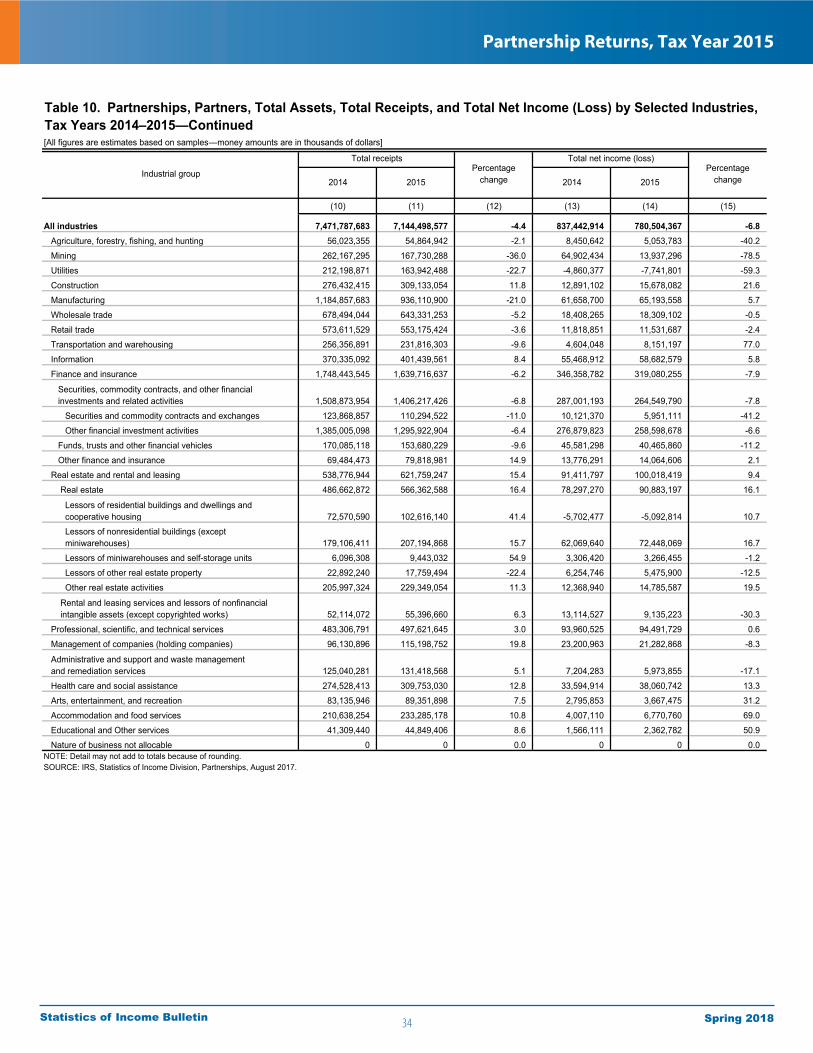
[All figures are estimates based on samples—money amounts are in thousands of dollars]
(10) (11) (12) (13) (14) (15)
All industries 7,471,787,683 7,144,498,577 -4.4 837,442,914 780,504,367 -6.8 Agriculture, forestry, fishing, and hunting 56,023,355 54,864,942 -2.1 8,450,642 5,053,783 -40.2
Mining 262,167,295 167,730,288 -36.0 64,902,434 13,937,296 -78.5
Utilities 212,198,871 163,942,488 -22.7 -4,860,377 -7,741,801 -59.3
Construction 276,432,415 309,133,054 11.8 12,891,102 15,678,082 21.6
Manufacturing 1,184,857,683 936,110,900 -21.0 61,658,700 65,193,558 5.7
Wholesale trade 678,494,044 643,331,253 -5.2 18,408,265 18,309,102 -0.5
Retail trade 573,611,529 553,175,424 -3.6 11,818,851 11,531,687 -2.4
Transportation and warehousing 256,356,891 231,816,303 -9.6 4,604,048 8,151,197 77.0
Information 370,335,092 401,439,561 8.4 55,468,912 58,682,579 5.8
Finance and insurance 1,748,443,545 1,639,716,637 -6.2 346,358,782 319,080,255 -7.9
Securities, commodity contracts, and other financial investments and related activities 1,508,873,954 1,406,217,426 -6.8 287,001,193 264,549,790 -7.8
Securities and commodity contracts and exchanges 123,868,857 110,294,522 -11.0 10,121,370 5,951,111 -41.2
Other financial investment activities 1,385,005,098 1,295,922,904 -6.4 276,879,823 258,598,678 -6.6
Funds, trusts and other financial vehicles 170,085,118 153,680,229 -9.6 45,581,298 40,465,860 -11.2
Other finance and insurance 69,484,473 79,818,981 14.9 13,776,291 14,064,606 2.1
Real estate and rental and leasing 538,776,944 621,759,247 15.4 91,411,797 100,018,419 9.4
Real estate 486,662,872 566,362,588 16.4 78,297,270 90,883,197 16.1
Lessors of residential buildings and dwellings and cooperative housing 72,570,590 102,616,140 41.4 -5,702,477 -5,092,814 10.7
Lessors of nonresidential buildings (except miniwarehouses) 179,106,411 207,194,868 15.7 62,069,640 72,448,069 16.7
Lessors of miniwarehouses and self-storage units 6,096,308 9,443,032 54.9 3,306,420 3,266,455 -1.2
Lessors of other real estate property 22,892,240 17,759,494 -22.4 6,254,746 5,475,900 -12.5
Other real estate activities 205,997,324 229,349,054 11.3 12,368,940 14,785,587 19.5
Rental and leasing services and lessors of nonfinancial intangible assets (except copyrighted works) 52,114,072 55,396,660 6.3 13,114,527 9,135,223 -30.3
Professional, scientific, and technical services 483,306,791 497,621,645 3.0 93,960,525 94,491,729 0.6
Management of companies (holding companies) 96,130,896 115,198,752 19.8 23,200,963 21,282,868 -8.3
Administrative and support and waste management and remediation services 125,040,281 131,418,568 5.1 7,204,283 5,973,855 -17.1
Health care and social assistance 274,528,413 309,753,030 12.8 33,594,914 38,060,742 13.3
Arts, entertainment, and recreation 83,135,946 89,351,898 7.5 2,795,853 3,667,475 31.2
Accommodation and food services 210,638,254 233,285,178 10.8 4,007,110 6,770,760 69.0
Educational and Other services 41,309,440 44,849,406 8.6 1,566,111 2,362,782 50.9
Nature of business not allocable 0 0 0.0 0 0 0.0 NOTE: Detail may not add to totals because of rounding.SOURCE: IRS, Statistics of Income Division, Partnerships, August 2017.
Industrial group
Table 10. Partnerships, Partners, Total Assets, Total Receipts, and Total Net Income (Loss) by Selected Industries, Tax Years 2014–2015—Continued
2014 2015 2014 2015
Total receiptsPercentage
change
Total net income (loss)Percentage
change
34
Partnership Returns, Tax Year 2015
Spring 2018Statistics of Income Bulletin