Embed Size (px)
Citation preview

Partnering with clients: delivering on the vision.
C O G N I Z A N T
2 0 0 6
A N N U A L
R E P O R T
World Headquarters
Glenpointe Centre West
500 Frank W. Burr Blvd.
Teaneck, New Jersey 07666
phone: 201.801.0233
fax: 201.801.0243
toll free: 888.937.3277
www.cognizant.com
61748 Covers 4/19/07 2:14 PM Page 1

Cognizant Technology Solutions (NASDAQ:CTSH) is a leading provider of informationtechnology and business process out-sourcing services, with a sharp focus ondelivering information technology-enabledsolutions that generate ever-increasingbusiness value to our clients. We view eachclient relationship as a true partnership –our unique on-site/offshore model allowsour teams to be aligned with a client’sorganization. Together, we strive to achievea shared vision of performance that yieldstangible returns in terms of innovation,growth and increased efficiencies.
From its founding, Cognizantwas built with a global mindset.Today, this heritage has providedCognizant with a significant marketadvantage. Because customerssee globalization as a key elementfor their future success, theyseek partners who can help themsucceed in this journey. Cognizantis a uniquely qualified partner forthese organizations.
Corporate Information
Transfer AgentAmerican Stock Transfer & Trust Co.59 Maiden LaneNew York, NY 100381.800.937.5449
Independent Registered PublicAccounting FirmPricewaterhouseCoopers LLP400 Campus DriveFlorham Park, NJ 07932
Form 10-KThe Company has filed its Annual Reporton Form 10-K with the Securities andExchange Commission. Many of the SEC’s10-K information requirements aresatisfied by this 2006 Annual Report toStockholders. However, a copy of the Form10-K is available without charge uponrequest by contacting Investor Relationsat the address or phone number listedbelow.
Common Stock InformationThe Company’s Class A common stock(CTSH) is listed on the Nasdaq NationalMarket.
Trading for the Company’s Class Acommon stock began June 19, 1998. Asof March 31, 2007, there were approxi-mately 226 holders of record of theCompany’s Class A common stock and42,475 beneficial holders of theCompany’s Class A common stock.
The Company has never paid dividends onits Class A common stock and does notanticipate paying any cash dividends inthe foreseeable future. The following tablesets forth the high and low sales price forthe Company’s Class A common stock forthe calendar periods indicated.
Executive OfficesGlenpointe Centre West500 Frank W. Burr Blvd.Teaneck, NJ 07666Phone: 201.801.0233Fax: 201.801.0243
Annual MeetingThe Company’s annual meetingfor stockholders will be held at9:30 am on June 7, 2007 atthe Company’s headquarters,Glenpointe Centre West,500 Frank W. Burr Blvd.,Teaneck, New Jersey 07666.
Legal CounselMorgan, Lewis and Bockius, LLP502 Carnegie CenterPrinceton, NJ 08540
InternetAdditional company information isavailable on the World Wide Web:http://www.cognizant.com.
Investor RelationsRequests for financial informationshould be sent to:Gordon J. CoburnChief Financial and Operating OfficerCognizant Technology SolutionsGlenpointe Centre West500 Frank W. Burr Blvd.Teaneck, NJ 07666Phone: 201.801.0233
Fiscal 2006 High Low1st Quarter $ 60.16 $ 49.202nd Quarter $ 69.01 $ 56.883rd Quarter $ 75.06 $ 61.054th Quarter $ 82.21 $ 72.63
Fiscal 2005 High Low1st Quarter $ 48.62 $ 35.862nd Quarter $ 50.17 $ 39.943rd Quarter $ 50.05 $ 44.004th Quarter $ 52.25 $ 43.00
Directors
John E. Klein (1) (2) (3)
Chairman of the BoardCognizant,President andChief Executive OfficerPolarex, Inc.
Lakshmi NarayananVice ChairmanCognizant
Robert W. Howe (1) (2) (3)
ChairmanADS Financial Services Solutions
Robert E. Weissman (1) (3)
ChairmanShelburne Investments
Thomas M. Wendel (2) (3)
Former Chief Executive OfficerBridge Information Systems
Francisco D’SouzaPresident andChief Executive OfficerCognizant
Board Committees:
(1) Compensation Committee
(2) Audit Committee
(3) Nominating and Corporate
Governance Committee
Executive Officers
Lakshmi NarayananVice Chairman
Francisco D’SouzaPresident andChief Executive Officer
Gordon J. CoburnChief Financial andOperating Officer,Secretary and Treasurer
Ramakrishnan ChandrasekaranPresident and Managing Director,Global Delivery
Rajeev MehtaChief Operating Officer,Global Client Services
galp
erin
des
ign
, in
c., n
yc
61748 Covers 4/19/07 2:14 PM Page 2
To Our Stockholders:
2006 WAS A STRONG YEAR FOR COGNIZANT, as we again generatedindustry-leading growth, driving significant increases in revenue andnet income. Just as important, we demonstrated the ability to scale ouroperations to support our rapid growth — maintaining our track record ofexcellence in execution for clients; adding new associates to our base oftalented and highly motivated team members; and expanding the breadthand depth of our services, industry expertise and geographic reach.
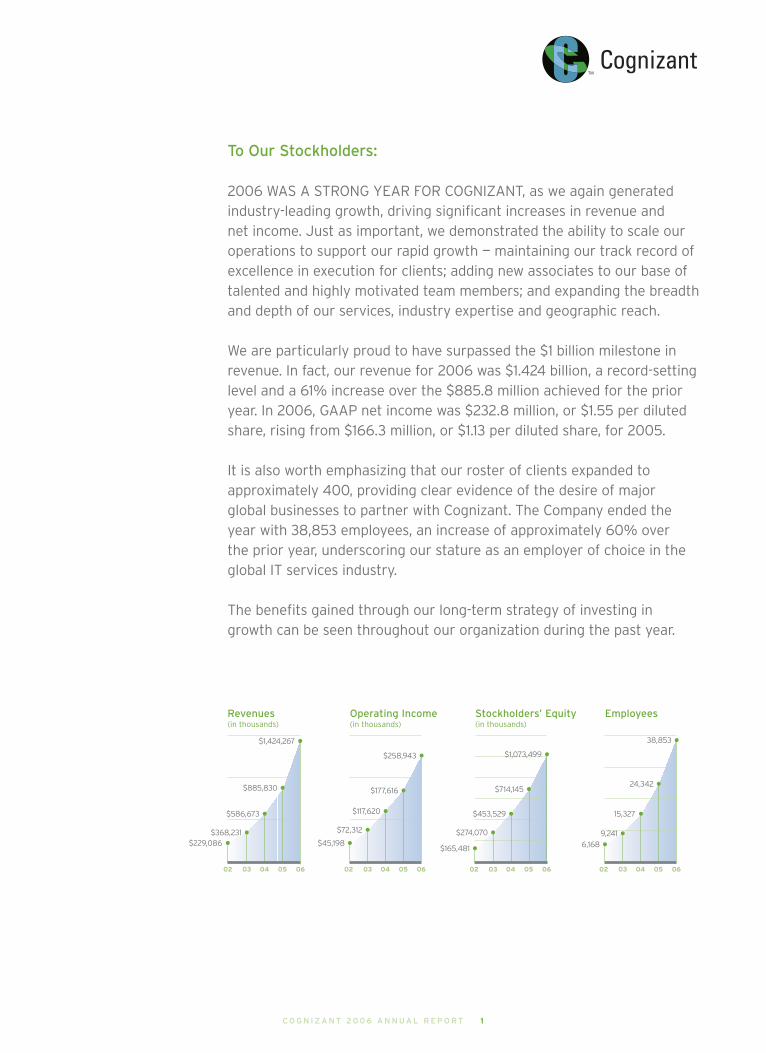
We are particularly proud to have surpassed the $1 billion milestone inrevenue. In fact, our revenue for 2006 was $1.424 billion, a record-settinglevel and a 61% increase over the $885.8 million achieved for the prioryear. In 2006, GAAP net income was $232.8 million, or $1.55 per dilutedshare, rising from $166.3 million, or $1.13 per diluted share, for 2005.
It is also worth emphasizing that our roster of clients expanded toapproximately 400, providing clear evidence of the desire of majorglobal businesses to partner with Cognizant. The Company ended theyear with 38,853 employees, an increase of approximately 60% overthe prior year, underscoring our stature as an employer of choice in theglobal IT services industry.
The benefits gained through our long-term strategy of investing ingrowth can be seen throughout our organization during the past year.
Revenues(in thousands)
02 03 04 05 06
Operating Income(in thousands)
02 03 04 05 06
Stockholders’ Equity(in thousands)
02 03 04 05 06
Employees
02 03 04 05 06
24,342•
15,327 •
6,168•9,241 •
38,853•
$177,616•$117,620•
$45,198•$72,312•
$258,943•
$885,830•$586,673•
$229,086 •$368,231 •
$714,145•$453,529•
$165,481 •$274,070•
$1,073,499•
C O G N I Z A N T 2 0 0 6 A N N U A L R E P O R T 1
$1,424,267•
61748 Editorial 4/20/07 8:21 AM Page 1

Growth in Vertical Business Segments
We continued to build and expand market-leading positions in key vertical sectors by deepening
our domain expertise and further strengthening our range of IT solutions. Our financial services
practice experienced 54% revenue growth in 2006, as we introduced new services and thus gained
wallet share with clients in banking, insurance, asset and wealth management, and investment
banking. Revenue in our healthcare and life sciences group rose 88% over the prior year, as we
maintained a leadership position in the pharmaceutical sector and contin-
ued our strong performance with healthcare payors seeking to manage
the increasing complexities and costs of reimbursement systems. Another
key growth segment is the field of communications, information services,
media and entertainment, where we have made a concerted effort to
build domain knowledge in critical areas, such as rich media distribution
and digital asset management. We nearly doubled our revenue in this
segment last year, and now serve several of the top companies in
publishing, broadcasting and advertising. In retail, manufacturing and
logistics, revenue increased 37%, driven by particular strength in our ERP solutions, as many
retail, manufacturing and logistics clients were looking to further leverage and transform their
ERP backbones to drive ever increasing business value.
Expanding Global Footprint
The fact that we have been a global organization since our inception is one of the key factors in
our ability to serve major multi-national clients. Throughout 2006, we continued to build our global
delivery capacity. In Europe, where we see exciting long-term opportunities, we have enhanced our
infrastructure by establishing regional management teams across the continent, with a mix of tal-
ented local employees and seasoned veterans from elsewhere in Cognizant’s network. We also
made healthy strides in China in the past year, where our team now serves more than a dozen
clients, and we have begun a campus recruiting effort at top-tier Chinese universities to meet our
long-term needs and those of our clients.
We have continued to invest significant resources to grow our infrastructure in India and now have
facilities in eight cities, most recently Kochi, which opened in the fourth quarter. In a major invest-
ment designed to meet our clients’ future needs, we have committed over $200 million to develop
and expand state-of-the-art techno-complexes in the cities of Chennai, Coimbatore, Hyderabad,
Kolkata and Pune. These new techno-complexes will add more than three million square feet with
capacity for up to 30,000 new employees. Additionally, we continue to expand our capacity and
capabilities in Bangalore, Kochi and Mumbai.
2 0 0 6
S t o c k h o l d e r
L e t t e r
We continued to build andexpand market-leadingpositions in key verticalsectors by deepening ourdomain expertise.
2 C O G N I Z A N T 2 0 0 6 A N N U A L R E P O R T
61748 Editorial 4/20/07 8:21 AM Page 2

Enhancing Technology Solutions
During 2006, we continued to stay at the forefront of technology trends, broadening our range
of solutions to bolster our ability to add value to our clients’ businesses. One key area of focus
is Service-Oriented Architecture (SOA), which enhances the ability of software and systems to
function in a flexible manner, and where we have invested in people, processes and technology
to assist clients in adopting SOA frameworks. We have also enriched our services in the area of
Business Process Outsourcing (BPO), which helps clients manage end-to-end business processes.
And we have continued to build upon our deep capabilities in SAP®, Microsoft and Oracle applica-
tions, providing a full range of product development, testing, implementation, maintenance,
support and upgrade services.
To expand our IT Infrastructure Services business, we acquired AimNet Solutions, Inc. in
September 2006. AimNet has established itself as a trusted partner in managing client infra-
structures in such areas as WAN and LAN networks, Security, Internet Packet (IP) Telephony,
Server and Application support, and many others. The acquisition is expected to accelerate
our growth in this high-potential area, through the addition of AimNet’s world-class Network
Operations Center in Massachusetts, the adoption of the company’s proven software platform,
and its extremely capable management team.
Capability and Culture
We are proud of our success over the years in attracting the best and brightest to join the
Cognizant team. Our ability to compete for highly qualified personnel reflects the strong
appeal of our unique culture – a culture that empowers employees to make decisions in the
best interests of our clients, values the sharing of knowledge across the organization, rewards
performance, and provides ample career development opportunities.
As we continue to grow our business at a rapid pace, we have redoubled our efforts to recruit
and retain the talent we will need now and in the future. Last year, we added over 14,500 net
employees. In addition to engineers and other technically skilled staff, we added individuals with
extensive domain expertise to support our growing vertical practices. We also hired a record
number of MBAs from premier business schools in 2006.
To prepare team members for successful careers, we have invested in expanding the educational
programs offered by our Cognizant Academy and delivered over 3.5 million hours of training.
We have also formed an alliance with a finishing school in India to provide training for students
in areas such as teamwork and communications, augmenting their technical skills. It is common
practice in India for companies to make job offers to students as they complete the third year
of a four-year academic program. To help these prospective employees make the transition to
Cognizant and client work, we offer an on-campus training program during their final year of study.
C O G N I Z A N T 2 0 0 6 A N N U A L R E P O R T 3
2006 Awards
The Wall Street Journal names
Cognizant as one of the best
5-year stock performers in its
“Shareholder Scorecard.”
February
Institutional Investor magazine
selects Cognizant as one of
the most shareholder-friendly
companies in America.
February
BusinessWeek names Cognizant
#16 among its annual list of 100
Hot Growth Companies, the fifth
year that Cognizant has been
included.
June
Cognizant is named to Fortune’s list
of 100 Fastest-Growing Companies
for the fourth consecutive year.
September
Standard & Poor’s adds Cognizant
to its prestigious S&P 500 Index.
November
BusinessWeek ranks Cognizant #6
in its Tech Top 50 list.
December
FORTUNE
61748 Editorial 4/20/07 8:21 AM Page 3

Recognizing Results
Our ability to deliver solutions for our clients – and value for our
stockholders – has been recognized by respected independent
sources. In late 2006, Cognizant was added to the S&P 500 Index.
We are honored to join this prestigious roster of leading publicly-
traded companies in the U.S., many of which we count among our
clients. The Company also was cited by The Wall Street Journal
as one of the Best 5-Year Performers in its February 2006
“Shareholder Scorecard.” Institutional Investor magazine included
Cognizant in its listing of the top shareholder-friendly U.S. compa-
nies. We also were named to Fortune
magazine’s list of “100 Fastest Growing Companies” for the fourth
consecutive year, and in the BusinessWeek ranking of “100 Hot Growth
Companies.”
These accolades – and our track record of industry-leading growth – would
not have been possible without the confidence placed in Cognizant by
our clients, the talent and drive of our employees, and the loyalty of our
stockholders. I also wish to thank Lakshmi Narayanan, whom I succeeded
as President and CEO on January 1, 2007, for his tireless efforts over the
years to build our Company and our leadership team. In his new role as
Vice Chairman of our Board, Lakshmi will be an effective advocate for
the Company in industry affairs and education issues. We are grateful for his contributions to our
success and for his future guidance.
In 2007, we will continue our efforts to advance the globalization of our business; attract, retain
and cultivate talented team members; and invest in the industry expertise, services and solutions
that deliver value to our clients. We thank all of you for your support, and look forward to sharing
the results of these efforts with you in the future.
Sincerely,
Francisco D’Souza
President and Chief Executive Officer
4 C O G N I Z A N T 2 0 0 6 A N N U A L R E P O R T
Our ability to deliversolutions for our clients –and value for ourstockholders – has beenrecognized by respectedindependent sources.
Francisco D’Souza
President and
Chief Executive Officer
2 0 0 6
S t o c k h o l d e r
L e t t e r
61748 Editorial 4/20/07 8:21 AM Page 4

Partnering with clients: delivering on the vision.
61748 Editorial 4/20/07 8:21 AM Page 5

Partnering with Clients
At Cognizant, we strive to build valuable partnerships with our clients, in which our shared
purpose and commitment is to make their business stronger and more competitive. We believe this
partnership approach is a key to our distinct value proposition – yielding superior results and an
exceptional client experience.
Our ability to form such partnerships is a function of our unique on-site/offshore model. This model
is constructed around teams that include relationship managers and consultants with strong indus-
try skills embedded at the client’s place of business, along with an equally capable delivery group
based in one or more of our technology centers. Through this approach, we deliver deep domain
expertise, as well as functionally rich technology offerings to our clients.
Importantly, the on-site and offshore members of the team are completely aligned in support of the
client’s mission, goals and objectives. Both parts of the team are equally accountable for delivering
results based on the client’s needs, and empowered to make decisions in the best interests of that
client. This ensures a consistent global process, rapid time-to-market due to the integrated team
structure, and high levels of client satisfaction.
Driving Return on Outsourcing
At Cognizant, we believe the true measure of success in outsourcing is not cost savings alone, but
rather the ability to help our clients transform their businesses. Therefore, we have structured our
processes to deliver superior total Return on Outsourcing for each client – not simply delivering the
desired economies in the transaction area, but also enabling a company to innovate, expand and,
ultimately, profit from additional revenue-generation opportunities.
The key to driving Return on Outsourcing is to ensure that our approach to service delivery is
closely aligned with the client’s overall IT agenda. This enables Cognizant to add the maximum
value – beginning with the desired operational efficiencies of outsourcing, but then moving on to
process effectiveness and, ultimately, technology-driven business innovation. We think of this as
a process of Transforming while Performing TM.
Recognizing our commitment to deliver a significant Return on Outsourcing, clients are increasingly
willing to entrust more sophisticated services to us. By expanding the range of solutions we
provide, Cognizant is able to move up the “value chain,” making our services even more valuable
to clients and driving our continued growth.
Our progressive approach to Return on Outsourcing emerged from a growing recognition that our
vast accumulation of technology savvy and domain expertise could help clients accelerate business
process improvements that drive increased market competitiveness. Through our close partner-
ships with clients, we have already demonstrated how the outsourcing of IT services delivery can
contribute significant costs savings and facilitate improved operational flexibility and business
agility. Clients are now asking us to take these contributions to another level by providing action-
able insights that illustrate how to reinvest resources freed up from outsourcing to further advance
their business objectives.
2 0 0 6
O p e r a t i o n s
R e v i e w
6 C O G N I Z A N T 2 0 0 6 A N N U A L R E P O R T
Team PlayersMembers of the Cognizant
team are completely aligned in
support of the client’s mission,
goals and objectives.
61748 Editorial 4/20/07 8:21 AM Page 6

We strive tobuild valuable partnerships
with our clients.
61748 Editorial 4/20/07 8:21 AM Page 7

We are committed tomaintaining a
global delivery model.
61748 Editorial 4/20/07 8:21 AM Page 8
Leveraging Global Delivery
Cognizant was born global. We are committed to maintaining a global delivery model to serve a
multi-national client base, and to accessing the best pools of talent wherever they are available.
Our global services delivery and development network today encompasses 34 locations in India,
Asia, North America, Europe and Latin America. We currently operate out of 21 regional sales
and business development offices, and further expansion is under way.
Our efforts to build our China operations offer a clear example of Cognizant’s approach to global
delivery. We established a foothold in China nearly two years ago, and our team there now
numbers nearly 300. As we scale the China operation, we have taken steps to ensure that its
process infrastructure is fully aligned with our other global delivery operations. We have trans-
ferred senior managers from India to enhance our abilities to instill our business practices in
China. As we expand our global footprint into areas such as Latin America and Eastern Europe,
we will continue our dedication to consistent, superior global delivery.
In today’s market-driven global economy, knowledge pertaining to IT services can be easily
transferred via technical universities, the Internet and other broadcast media, across national
borders, breaking down geographic barriers that previously confined these activities to specific
locales. Realizing this, Cognizant has elevated its outsourcing value proposition to transcend
mere labor arbitrage and the related cost savings. Using intellectual arbitrage, Cognizant can
now deliver IT services and IT-enabled specialized knowledge processes by tapping the most
capable skilled resources distributed across the globe.
This has enabled us to move to the forefront of IT service providers and to become “atomically
global,” that is, able to divide client tasks into small components that can be executed in multiple
locations worldwide depending on where they can best be performed. These tasks are then
reassembled for delivery to the end-user. To do this successfully takes a great deal of operational
discipline, technical acumen and codified development practices consistently applied at each
Cognizant location.
2 0 0 6
O p e r a t i o n s
R e v i e w
C O G N I Z A N T 2 0 0 6 A N N U A L R E P O R T 9
Atomically GlobalWe divide client tasks into
small components that can be
executed in multiple locations
worldwide and reassembled
for delivery to the end-user.
61748 Editorial 4/20/07 8:21 AM Page 9

Nurturing Talent
We continue to focus intensively on attracting and cultivating talent – the chief asset we rely upon
to serve our clients’ needs. Our investment in recruitment and professional development is design-
ed to attract the best brains in our industry, provide the training necessary to make our people
more valuable to clients, and foster a culture that rewards performance and professionalism.
To recruit the best talent available, we maintain extensive partnerships with numerous leading
educational institutions. Not only are we active in campus recruiting, but Cognizant associates also
are active in teaching at schools and colleges, which allows us to educate prospective employees
about the Company and the industry. This process has been ongoing for several years in India,
North America and Europe, and we have now begun campus recruiting in China, as well.
Enhancing the training available to our employees, we have recently begun investing in programs
in tandem with a leading finishing school in India. These programs are designed to provide the
additional education needed to transition recent university graduates to the workforce. In addition,
we are intensifying the programs available through Cognizant Academy, offering continuous
education through e-learning, and creating a satellite-based system of courses to give employees
at multiple locations access to our faculty.
2 0 0 6
O p e r a t i o n s
R e v i e w
Campus RecruitmentTo recruit the best talent
available, we maintain
extensive partnerships
with numerous leading
educational institutions.
10 C O G N I Z A N T 2 0 0 6 A N N U A L R E P O R T
61748 Editorial 4/20/07 8:21 AM Page 10

We continue to focusintently on attracting
and cultivating talent.
61748 Editorial 4/20/07 8:21 AM Page 11

How has Cognizant been able to manage
the dramatic pace of growth while main-
taining superior quality service?
That is really the most important question – and
an accomplishment of which we are truly proud.
Our ability to grow while sustaining excellence
in execution is a function of several factors.
First, our business model is scalable, consisting
of a strong front-end team that collaborates
with the client, and is fully aligned with a solid
back-end team focused exclusively on execution.
Secondly, we have always invested in talent,
adding employees ahead of need and working
continuously to enhance their skills. Thirdly, a
few years ago we organized ourselves around
vertically-oriented business units in order to
more closely align with our clients and also
scale our business with continued quality. And
we also have added managerial bandwidth, with
strong managers who are empowered to run
their businesses in a way that is highly respon-
sive to client requirements.
Last, but not least, we never forget that our
culture is based on teammates helping each
other to serve clients; our employees can
draw on talent and expertise anywhere in the
Cognizant organization to find solutions. It is
important for us to know that, no matter how
quickly we grow, we are maintaining our culture
of transparency, empowerment, meritocracy
and motivation.
What are some of the competitive
advantages that differentiate Cognizant
from other IT services firms?
First and foremost, we truly believe our culture
is a competitive advantage. We encourage
employees to be as responsible as possible to
the client and empower them to make decisions
in the clients’ best interests. Our collective
mantra is “client first” and in our annual cus-
tomer satisfaction survey this attribute is often
cited by our clients as a distinctive part of the
Cognizant experience.
Another competitive strength is our approach
to partnering with clients. We aim to give our
clients an experience different from other IT
services firms by placing our team members
on-site at client locations, where they become
closely aligned with the client’s organization and
gain a first-hand understanding of their issues
and needs. In our industry, the ability to deliver
offshore services is a requirement, but the
capacity to provide business solutions is a
competitive distinction.
Finally, much of our competitive advantage
comes down to our commitment to long-term
growth – whether that means investing deeply
in our industry and domain capabilities and
knowledge, building three million square feet of
techno-complexes in India, making acquisitions
in important new service areas, increasing
our resources in China and Europe or hiring
relatively more MBAs than most companies in
our industry. We always want to be sure that we
have the capacity and capability to continually
delight our clients.
How is the Company evolving its global
delivery model to meet the demands of
clients?
As we continue to build our global network, we
consider both demand and supply – locating in
geographies where we see rising client demand,
while also building capacity in regions where
there is a supply of talent. On the demand side,
global delivery originally meant that the client
wanted to outsource some operations to a
service provider located in a place such as India.
Then, it evolved so that different client process-
es could be distributed to different locations.
Going forward, the complexity of clients’ needs
will require that a single project be broken up
into many separate components, distributed
around the world and reassembled.
To prepare for this environment, we are moving
toward a multi-tiered model. We will have large-
scale operations in countries such as India and
China. But we also are developing a presence in
2 0 0 6
C o g n i z a n t
F o r u m
12 C O G N I Z A N T 2 0 0 6 A N N U A L R E P O R T
61748 Editorial 4/20/07 8:21 AM Page 12

regional centers where the talent pool can
support smaller teams and stand in convenient
proximity to our client base, for example
Phoenix, Toronto or Buenos Aires. Finally, we
will operate smaller in-country facilities as
needed to serve specific clients that require a
local presence.
What makes Cognizant a great company
to work for?
Our industry-leading growth makes Cognizant
a fast-paced, dynamic environment that is
extremely attractive to employees. We also
are a meritocracy, dedicated to providing
opportunities as soon as a team member is
ready to advance. The Company offers many
avenues for professional growth – whether a
person wants a technology-oriented career, or
wishes to focus on a particular domain, or to
move into relationship management, there is a
well-defined career path.
Our “positive ecosystem” encourages employ-
ees to unleash their powers of innovation –
with an open, transparent culture in which any
associate can feel free to offer a better solution
to a client’s needs. The success of our efforts to
build a rewarding work environment is clearly
reflected in employee satisfaction scores, which
have remained very strong during this phase of
dramatic growth.
What are some examples of Cognizant’s
commitment to deliver innovation for
clients?
We are continually creating new vertical and
horizontal offerings. For example, we invested
resources to help the information, media and
entertainment sector meet the challenges
of delivering digital content, and have won
substantial business in that area. Within our
existing vertical sectors, we created processes
Partnering with clients: delivering on the vision.
C O G N I Z A N T 2 0 0 6 A N N U A L R E P O R T 13
to help financial institutions manage the inter-
national capital and reporting requirements of
BASEL II or MiFID in Europe, and assist pharma-
ceutical companies in addressing the cost
pressures of their industry, such as product
development and IP protections processes.
Another way that we extend the benefits of
innovation to our clients is by developing
reusable components that can quickly be
applied to a variety of business needs, reducing
time-to-market. For example, from our work
with insurers, we developed a competency in
policy enrollment processes. Our solutions in
this area are now incorporated in the Cognizant
Application Framework (CAFE), and can be
adapted to future needs by clients in this
industry segment or beyond.
We also developed an innovative knowledge
culture. We took the radical approach of creat-
ing an entire “knowledge community.” Rather
Executive Team
(counter clockwise,
starting lower left)
Francisco D’Souza
President and
Chief Executive Officer
Lakshmi Narayanan
Vice-Chairman
Gordon Coburn
Chief Financial and
Operating Officer
Rajeev Mehta
Chief Operating Officer,
Global Client Services
Chandra Sekaran
President and Managing
Director, Global Delivery
pho
to c
redi
t so
urc
e: B
usi
nes
swo
rld,
ph
oto
grap
her
: R. A
. Ch
andr
oo
61748 Editorial 4/20/07 8:21 AM Page 13

14 C O G N I Z A N T 2 0 0 6 A N N U A L R E P O R T
than try to collect key learnings in a central
repository, we continually identify pockets of
expertise throughout our organization, and have
established a Web portal framework to give all
associates ease of access to information across
the enterprise.
How have you developed Cognizant’s
approach to delivering Return on
Outsourcing?
Our approach came about because we were
moving beyond cost-driven transactions and
toward activities that drive business transforma-
tion. In other words, while clients initially come
on board to take advantage of the cost-savings
from outsourcing, they stay to enjoy the fruits
of additional value and innovation.
That realization has led us to develop a method
of measuring Return on Outsourcing that values
not only the cost-saving aspect of a client
engagement, but also the revenue benefits and
profit growth opportunities generated through
breakthrough initiatives.
61748 Editorial 4/20/07 8:21 AM Page 14

C O G N I Z A N T 2 0 0 6 A N N U A L R E P O R T 15
Management’s Discussion and Analysis of
Financial Condition and Results of Operations 16
Report of Management 30
Report of Independent Registered
Public Accounting Firm 31
Consolidated Statements of Financial Position
as of December 31, 2006 and 2005 32
Consolidated Statements of Operations and
Comprehensive Income for the years ended
December 31, 2006, 2005, and 2004 33
Consolidated Statements of Stockholders’ Equity for
the years ended December 31, 2006, 2005, and 2004 34
Consolidated Statements of Cash Flows for the
years ended December 31, 2006, 2005, and 2004 35
Notes to Consolidated Financial Statements 36
Selected Consolidated Financial Data 49
Performance Graph 50
Corporate Information 51
Index to Financial Review
61748 Financials 4/19/07 4:14 PM Page 1

EXECUTIVE SUMMARY
In 2006, our revenues increased to $1,424.3 million compared to $885.8 million in 2005. Net income increased to $232.8 million or
$1.55 per diluted share, including stock-based compensation expense, net of tax, equal to $0.16 per diluted share, during 2006. This
is compared to $166.3 million or $1.13 per diluted share in 2005, which excludes stock-based compensation expense. In the fourth
quarter of 2005, we completed the repatriation of $60 million of Indian earnings pursuant to the American Jobs Creation Act of
2004 (the Act), leading to a one-time tax benefit, included in our 2005 results, of approximately $12.4 million or $0.08 per diluted
share. Excluding this one-time tax benefit, net income was $153.9 million or $1.05 per diluted share in 2005. The key drivers of our
revenue growth in 2006 were as follows:
• strong performance of our Healthcare segment, which had year-over-year revenue growth of approximately 88%, and our Other
segment which had year-over-year revenue growth of approximately 75%;
• expansion of our service offerings, which enabled us to cross-sell new services to our customers and meet the rapidly growing
demand for complex large-scale outsourcing solutions;
• increased penetration at existing customers, including strategic customers. Specifically, 96% of our 2006 revenues were derived
from customers who had been using our services at the end of 2005; and
• greater penetration of the European market.
During 2006, we saw increasing demand from our customers for a broad range of IT solutions, particularly high-performance web
development initiatives and complex systems development engagements, testing, customer relationship management, or CRM,
enterprise resource planning, or ERP, and data warehousing and business intelligence. We finished the year with approximately
400 active clients compared to 250 in 2005 and added 20 strategic clients in 2006 bringing the total number of our strategic
clients to 87. We define a strategic client as one offering the potential to generate between $5 million and $40 million or more in
annual revenues at maturity. Our top five and top ten customers accounted for approximately 29% and 39%, respectively, of our
total revenues in 2006 as compared to approximately 34% and 46%, respectively, for the year ended December 31, 2005. As we
continue to add new customers and increase our penetration at existing customers, we expect the percentage of revenues from our
top five and top ten customers to continue to decline over time.
In Europe, we continue to experience strong growth. During 2006, our revenue from European customers increased by approxi-
mately 77.3% to approximately $183.9 million compared to approximately $103.7 million in 2005. In 2006, revenue from Europe,
excluding the UK, increased by approximately $26.1 million or approximately 114.0% from approximately $22.9 million in 2005 to
approximately $48.9 million in 2006. Europe will continue to be an area of heavy investment for us in 2007 as we see this region
as a growth opportunity for the long term.
Our revenue growth is also attributed to increasing market acceptance of, and strong demand for, offshore IT services. Recent
NASSCOM (India’s National Association of Software and Services Companies) reports state that India’s IT services export industry
grew by 33% in the 12-month period ended March 31, 2006, and IT and IT Enabled export services are projected to grow 27% to
30% in the 12-month period ending March 31, 2007.
In 2006, our operating margin decreased to approximately 18.2% compared to 20.1% in 2005. Excluding stock-based compensation
costs of approximately $29.9 million, operating margin in 2006 was approximately 20.3%. This was slightly above our historic tar-
geted operating margin range, excluding stock-based compensation costs, of 19% to 20% of total revenues. Historically, we have
invested the profitability above the 19% to 20% operating margin level, which excludes stock-based compensation, back into our
business, which we believe is a significant contributing factor to our strong revenue growth. This investment is primarily focused in
the areas of: (i) hiring client partners and relationship personnel with specific industry experience or domain expertise; (ii) training
our technical staff in a broader range of IT service offerings; (iii) strengthening our business analytic capabilities; (iv) strengthening
and expanding our portfolio of services; (v) continuing to expand our geographic presence for both sales and delivery, and (vi) rec-
ognizing and rewarding exceptional performance by our employees. In addition, we maintain a deep bench of resources, trained in a
broad range of service offerings, in order to be well positioned to respond to our customer requests to take on additional projects.
This also has an effect of reducing our operating margins and lowering our utilization levels. For 2007, we expect to continue to
invest amounts in excess of our historic targeted operating margin levels back into the business.
Management’s Discussion and Analysisof Financial Condition and Results of Operations
16 C O G N I Z A N T 2 0 0 6 A N N U A L R E P O R T
61748 Financials 4/19/07 4:14 PM Page 2

We finished the year with a total headcount of approximately 38,800, an increase of approximately 14,500 over the prior year end.
The increase in the number of our technical personnel and related infrastructure costs, to meet the demand for our services, are
the primary drivers of the increase in our operating expenses in 2006. Annualized turnover, including both voluntary and involun-
tary, was approximately 15.7% for 2006. The majority of our turnover occurs in India. As a result, annualized attrition rates on-site
at clients are below our global attrition rate. In addition, attrition is weighted toward the more junior members of our staff. We have
experienced wage inflation in India, which may continue in the future; however, this has not had a material impact on our results of
operations as Indian wages represent less than 20% of our total operating expenses.
We are continuing with our strategy of moving from leased facilities to owned facilities as a way of reducing overall operating costs.
In November 2006, we announced the expansion of our existing India real estate development program to include over three mil-
lion square feet of new space, which is inclusive of the 900,000 square feet of space that we added to our planned construction
program in February 2006. The expanded program includes the expenditure of approximately $200 million through the end of
2008 on land acquisition, facilities construction and furnishings to build new fully-owned state-of-the-art development centers in
regions primarily designated as Special Economic Zones located in Chennai, Pune, Kolkata, Hyderabad and Coimbatore, India.
In September 2006, we acquired AimNet Solutions, Inc. (AimNet), a U.S.-based managed infrastructure and professional services
firm for initial net cash consideration of approximately $14.8 million. We completed this acquisition to strengthen our IT infrastruc-
ture management capabilities. We will continue to look for acquisitions that will strengthen our presence in a particular geographic
area and increase our capabilities in a specific technology or industry.
At December 31, 2006, we had cash and cash equivalents and short-term investments of $648.2 million, an increase of approxi-
mately $224.2 million compared to December 31, 2005. Further, we had no third party debt and working capital of approximately
$790.9 million at the end of 2006; accordingly, we do not anticipate any near-term liquidity issues.
Effective January 1, 2006, we adopted Statement of Financial Accounting Standards (SFAS) No. 123R, “Share-Based Payments”
(SFAS No. 123R), utilizing the modified prospective method. SFAS No. 123R requires the recognition of stock-based compensation
expense in the consolidated financial statements for awards of equity instruments to employees and non-employee directors based
on the grant-date fair value of those awards. Under the modified prospective method, the provisions of SFAS No. 123R apply to all
awards granted or modified after the date of adoption. In addition, the unrecognized expense of awards not yet vested at the date
of adoption, determined under the original provisions of SFAS No. 123, “Accounting for Stock-Based Compensation” (“SFAS No.
123”), are recognized in net income in the periods after the date of adoption. Pre-tax stock-based compensation costs of $29.9 mil-
lion were recorded for the year ended December 31, 2006. As of December 31, 2006, the total remaining unrecognized stock-based
compensation cost related to non-vested stock options expected to vest amounted to approximately $56.2 million, which will be
amortized over the weighted-average remaining requisite service period of 1.97 years. Prior to the adoption of SFAS No. 123R, we
followed the intrinsic value method to account for our employee stock option plans and employee stock purchase plan in accor-
dance with the recognition and measurement principles of Accounting Principles Board Opinion (APB) No. 25, “Accounting for Stock
Issued to Employees” and Related Interpretations (APB No. 25), as allowed by SFAS No. 123 and as amended by SFAS No. 148,
“Accounting for Stock-Based Compensation – Transition and Disclosure.” Accordingly, no stock-based employee compensation cost
was recognized, as all options granted under those plans had an exercise price equal to the market value of the underlying common
stock on the date of grant and, with respect to the employee stock purchase plan, the discount did not exceed 15 percent. In accor-
dance with the modified prospective method of adoption under SFAS No. 123R, prior period financial statements have not been
restated to reflect stock-based compensation costs.
SFAS No. 123R also requires the benefits of tax deductions in excess of recognized compensation expense to be reported as a
financing cash flow, rather than as an operating cash flow as prescribed under the prior accounting rules. This requirement reduces
net operating cash flow and increases net financing cash flows in periods after adoption. Total cash flow remains unchanged from
what would have been reported under the prior accounting rules.
Management’s Discussion and Analysisof Financial Condition and Results of Operations
C O G N I Z A N T 2 0 0 6 A N N U A L R E P O R T 17
61748 Financials 4/19/07 4:14 PM Page 3
CRITICAL ACCOUNTING ESTIMATES AND RISKS
Management’s discussion and analysis of our financial condition and results of operations is based on our consolidated financial
statements that have been prepared in accordance with accounting principles generally accepted in the United States of America.
The preparation of these financial statements requires management to make estimates and assumptions that affect the amounts
reported for assets and liabilities, including the recoverability of tangible and intangible assets, disclosure of contingent assets and
liabilities as of the date of the financial statements, and the reported amounts of revenues and expenses during the reported peri-
od. On an on-going basis, we evaluate our estimates. The most significant estimates relate to the recognition of revenue and profits
based on the percentage of completion method of accounting for certain fixed-bid contracts, the allowance for doubtful accounts,
income taxes, valuation of goodwill and other long-lived assets, assumptions used in valuing stock-based compensation arrange-
ments, contingencies and litigation. We base our estimates on historical experience and on various other assumptions that are
believed to be reasonable under the circumstances, the results of which form the basis for making judgments about the carrying
values of assets and liabilities that are not readily apparent from other sources. The actual amounts may differ from the estimates
used in the preparation of the accompanying consolidated financial statements. Our significant accounting policies are described in
Note 1 to the consolidated financial statements.
We believe the following critical accounting policies require a higher level of management judgments and estimates than others in
preparing the consolidated financial statements:
Revenue Recognition. Revenues related to our fixed-price contracts are recognized as the service is performed using the percent-
age of completion method of accounting, under which the total contract revenue during the term of an agreement is recognized on
the basis of the percentage that each contract’s cost to date bears to the total estimated cost (cost to cost method). Estimates of
total contract revenues and costs are continuously monitored during the term of the contract, and recorded revenues and costs are
subject to revision as the contract progresses. Such revisions may result in increases or decreases to revenues and income and are
reflected in the consolidated financial statements in the periods in which they are first identified.
Stock-Based Compensation. Effective January 1, 2006, we were required to account for stock-based awards in accordance with the
fair value recognition provisions of SFAS No. 123R. Under the fair value recognition provisions of SFAS No. 123R, stock-based com-
pensation cost is measured at the grant date based on the value of the award and is recognized as expense over the vesting period.
Determining the fair value of stock-based awards at the grant date requires judgment, including estimating the expected term of
stock options and the expected volatility of our stock. In addition, judgment is also required in estimating the income tax benefits
related to the stock-based awards and the amount of stock-based awards that are expected to be forfeited. If actual results differ
significantly from our estimates, stock-based compensation expense and our results of operations could be materially impacted.
Allowance for Doubtful Accounts. We maintain an allowance for doubtful accounts for estimated losses resulting from the inability
of our customers to make required payments. The allowance for doubtful accounts is determined by evaluating the relative credit-
worthiness of each customer, historical collections experience and other information, including the aging of the receivables. If the
financial condition of our customers were to deteriorate, resulting in an impairment of their ability to make payments, additional
allowances may be required.
Income Taxes. Determining the consolidated provision for income tax expense, deferred tax assets and liabilities, and related valua-
tion allowance, if any, involves judgment. As a global company, we are required to calculate and provide for income taxes in each of
the jurisdictions where we operate. This involves estimating current tax exposures in each jurisdiction as well as making judgments
regarding the recoverability of deferred tax assets. Tax exposures can involve complex issues and may require an extended period
to resolve. In the period of resolution, adjustments may need to be recorded that result in increases or decreases to income.
Changes in the geographic mix or estimated level of annual pre-tax income, as well as newly enacted tax legislation in each of the
jurisdictions where we operate can also affect the overall effective income tax rate.
On an on-going basis, we evaluate whether a valuation allowance is needed to reduce our deferred tax assets to the amount that is
more likely than not to be realized. While we have considered future taxable income and on-going prudent and feasible tax planning
strategies in assessing the need for the valuation allowance, in the event we determine that we will be able to realize deferred tax
assets in the future in excess of the net recorded amount, an adjustment to the deferred tax asset would increase income in the
Management’s Discussion and Analysisof Financial Condition and Results of Operations
18 C O G N I Z A N T 2 0 0 6 A N N U A L R E P O R T
61748 Financials 4/19/07 4:14 PM Page 4

period such determination was made. Likewise, should we determine that we will not be able to realize all or part of the net
deferred tax asset in the future, we would increase or establish the valuation allowance, which would decrease income in the period
such determination is made. In order for us to realize our deferred tax assets we must be able to generate sufficient taxable income
in the tax jurisdictions in which the deferred tax assets are located.
Our Indian subsidiary, Cognizant India, is an export-oriented company, which, under the Indian Income Tax Act of 1961, is entitled to
claim tax holidays for a period of ten consecutive years for each Software Technology Park (STP) with respect to export profits for
each STP. Substantially all of the earnings of Cognizant India are attributable to export profits. The majority of the Company’s STPs
in India are currently entitled to a 100% exemption from Indian income tax. Under current law, these tax holidays will be completely
phased out by March 2009. On March 31, 2006, the tax holiday expired for a second STP; however, the incremental Indian taxes due
on the operating profits of this STP did not have a significant effect on our 2006 effective income tax rate as the percentage of
Indian earnings subject to the tax holiday in India increased as a percentage of total Indian earnings in 2006. In anticipation of the
complete phase out of the tax holidays in March 2009, we expect to locate a portion of our new development centers in areas des-
ignated as Special Economic Zones (SEZ). Development centers operating in SEZ will be entitled to certain income tax incentives
for periods up to 15 years. Under current Indian tax law, export profits after March 31, 2009 from our existing STPs will be fully tax-
able at the Indian statutory rate (currently 33.66%) in effect at such time.
Prior to 2002, it was management’s intent to repatriate all accumulated earnings from India to the United States; accordingly, we
provided for deferred income taxes on all such undistributed earnings through December 31, 2001. During the first quarter of 2002,
we made a strategic decision to pursue an international strategy that includes expanded infrastructure investments in India and
geographic expansion in Europe and Asia. As a component of this strategy, beginning in 2002, we intend to use Indian earnings to
expand operations outside of the United States instead of repatriating these earnings to the United States. Accordingly, effective
January 1, 2002, pursuant to Accounting Principles Board Opinion No. 23, we no longer accrue incremental U.S. taxes on Indian
earnings as these earnings are considered to be indefinitely reinvested outside of the United States. As of December 31, 2006, the
amount of unrepatriated Indian earnings and total foreign earnings, including unrepatriated Indian earnings, upon which no incre-
mental U.S. taxes have been recorded is approximately $434.8 million and $457.6 million, respectively. If such post-2002 earnings
are repatriated in the future or are no longer deemed to be indefinitely reinvested, we will accrue the applicable amount of taxes
associated with such earnings and pay taxes at a rate substantially higher than our overall effective income tax rate in 2006. Due
to the various methods by which such earnings could be repatriated in the future, it is not currently practicable to determine the
amount of applicable taxes that would result from such repatriation or whether the amount of previously accrued deferred taxes on
Indian earnings recognized prior to 2002 would require adjustment.
Goodwill. We evaluate goodwill for impairment at least annually, or as circumstances warrant. When determining the fair value of
our reporting units, we utilize various assumptions, including projections of future cash flows. Any adverse changes in key assump-
tions about our businesses and their prospects or an adverse change in market conditions may cause a change in the estimation
of fair value and could result in an impairment charge. As of December 31, 2006, our goodwill balance was approximately $27.2
million.
Long-Lived Assets. In accordance with SFAS No. 144, “Accounting for the Impairment or Disposal of Long-Lived Assets”, we review
long-lived assets and certain identifiable intangibles for impairment whenever events or changes in circumstances indicate that the
carrying amount of an asset may not be recoverable. In general, we will recognize an impairment loss when the sum of undiscount-
ed expected future cash flows is less than the carrying amount of such asset. The measurement for such an impairment loss is then
based on the fair value of the asset. If such assets were determined to be impaired, it could have a material adverse effect on our
business, results of operations and financial condition.
Risks. Most of our IT development centers, including a majority of our employees, are located in India. Additionally, we operate in
various countries in Europe and Asia. As a result, we may be subject to certain risks associated with international operations,
including risks associated with foreign currency exchange rate fluctuations and risks associated with the application and imposition
of protective legislation and regulations relating to import and export or otherwise resulting from foreign policy or the variability
of foreign economic or political conditions. Additional risks associated with international operations include difficulties in enforcing
intellectual property rights, the burdens of complying with a wide variety of foreign laws, potential geo-political and other risks
associated with terrorist activities and local and cross border conflicts, potentially adverse tax consequences, tariffs, quotas and
Management’s Discussion and Analysisof Financial Condition and Results of Operations
C O G N I Z A N T 2 0 0 6 A N N U A L R E P O R T 19
61748 Financials 4/19/07 4:14 PM Page 5

other barriers. We are also subject to risks associated with our overall compliance with Section 404 of the Sarbanes-Oxley Act of
2002. The inability of our management and independent auditor to provide us with an unqualified report as to the adequacy and
effectiveness of our internal controls over financial reporting for future year ends could result in adverse consequences to us,
including, but not limited to, a loss of investor confidence in the reliability of our financial statements, which could cause the market
price of our stock to decline. See Item 1A, “Risk factors” in our Annual Report on Form 10-K for the year ended December 31, 2006
for discussion of additional risks that may affect our business, opertions or financial results.
RESULTS OF OPERATIONS
The following table sets forth, for the periods indicated, certain financial data expressed for the three years ended December 31,
2006:
Management’s Discussion and Analysisof Financial Condition and Results of Operations
Revenues $1,424,267 100.0% $885,830 100.0% $586,673 100.0% $538,437 $299,157Cost of revenues (1) 787,923 55.3 479,915 54.2 319,810 54.5 308,008 160,105Selling, general and administrative (2) 343,238 24.1 206,899 23.3 132,796 22.7 136,339 74,103Depreciation and amortization 34,163 2.4 21,400 2.4 16,447 2.8 12,763 4,953Income from operations 258,943 18.2 177,616 20.1 117,620 20.0 81,327 59,996Other income (expense), net 18,868 7,656 4,475 11,212 3,181Provision for income taxes (3) 45,016 19,006 21,852 26,010 (2,846)Net income $232,795 16.3 $166,266 18.8 $100,243 17.1 66,529 66,023
(Dollars in thousands) % of % of % of Increase (Decrease)2006 Revenues 2005 Revenues 2004 Revenues 2006 2005
The following tables include certain non-GAAP financial measures, namely income from operations on a non-GAAP basis, excluding
the impact of stock-based compensation resulting from the adoption of SFAS No. 123R, and net income on a non-GAAP basis,
excluding the impact of a one-time tax benefit related to the repatriation of Indian earnings under the Act. These tables also
include reconciliations of income from operations and net income presented in accordance with U.S. generally accepted accounting
principles to these non-GAAP measures. For its internal management reporting and budgeting purposes, management uses finan-
cial statements that do not include stock-based compensation expense related to employee stock options and employee stock pur-
chases, and exclude the income tax benefit related to the repatriation of Indian earnings for: financial and operational decision
making, to evaluate period-to-period comparisons and for making comparisons of our operating results to that of our competitors.
Further, management believes that the presentation of these non-GAAP financial measures provides useful information to investors
because our consolidated statement of operations: (i) for the years ended December 31, 2005 and 2004 did not reflect the impact
of the adoption of SFAS No. 123R and (ii) for the year ended December 31, 2005 included a one-time tax benefit of approximately
$12.4 million related to the repatriation of $60 million of Indian earnings under the Act, and, therefore, the presentation of the non-
GAAP financial measures enhances investors’ ability to make period-to-period comparisons of our operating results. A reconciliation
of income from operations as reported and non-GAAP income from operations excluding stock-based compensation expense is as
follows for the year ended December 31:
(1) Includes stock-based compensation expense for the year ended December 31, 2006 of $13,400 and is exclusive of depreciation and amortization expense.
(2)Includes stock-based compensation expense for the year ended December 31, 2006 of $16,534 and is exclusive of depreciation and amortization expense.
(3)Provision for income taxes for the year ended December 31, 2005 includes a one-time tax benefit of $12,411 in 2005 related to the repatriation of
$60,000 of Indian earnings under the Act.
Income from operations, as reported $ 258,943 18.2 %Add: Stock-based compensation expense 29,934 2.1Non-GAAP income from operations, excluding stock-based compensation expense $ 288,877 20.3 %
(Dollars in thousands) % of2006 Revenues
A reconciliation of net income as reported and net income on a non-GAAP basis, excluding the impact of a one-time tax benefit
related to the repatriation of Indian earnings under the Act, is as follows for the year ended December 31:
Net income, as reported $ 166,266 18.8 %Less: Income tax benefit related to the repatriation of Indian earnings 12,411 1.4Non-GAAP net income, excluding income tax benefit related to the repatriation of Indian earnings $ 153,855 17.4 %
(Dollars in thousands) % of2005 Revenues
20 C O G N I Z A N T 2 0 0 6 A N N U A L R E P O R T
61748 Financials 4/19/07 4:14 PM Page 6
Management’s Discussion and Analysisof Financial Condition and Results of Operations
Year Ended December 31, 2006 Compared to Year Ended December 31, 2005
Revenue. Revenue increased by 60.8%, or approximately $538.4 million, from approximately $885.8 million during 2005 to
approximately $1,424.3 million in 2006. This increase is primarily attributed to greater acceptance of the on-site/offshore delivery
model among an increasing number of industries, continued strength in our customers’ discretionary spending and greater pene-
tration in the European market. Revenue from customers existing as of December 31, 2005 increased by approximately $477.3
million and revenue from new customers added since December 31, 2005 was approximately $61.1 million or approximately 4.3%
of total revenues for the year ended December 31, 2006. In addition, revenue from European customers increased by $80.2 million
during 2006. We had approximately 400 active clients as of December 31, 2006 as compared to approximately 250 active clients
as of December 31, 2005. In addition, we experienced strong demand across all of our business segments for an increasingly broad
range of services. Our Financial Services and Healthcare business segments accounted for approximately $238.9 million and $154.8
million, respectively, of the $538.4 million increase in revenue. Our IT consulting and technology services and IT outsourcing rev-
enues increased by approximately 61.4% and 60.2%, respectively, compared to 2005 and represented approximately 48.8% and
51.2%, respectively, of total revenues in 2006. No customer accounted for sales in excess of 10% of revenues in 2006 or 2005.
Cost of Revenues (Exclusive of Depreciation and Amortization Expense). Our cost of revenues consists primarily of the cost of
salaries, stock-based compensation expense, payroll taxes, benefits, immigration and project-related travel for technical personnel,
the cost of subcontracting and the cost of sales commissions related to revenues. Our cost of revenues increased by 64.2% or
approximately $308.0 million, from approximately $479.9 million during 2005 to approximately $787.9 million in 2006. The
increase was due to higher compensation and benefits costs of approximately $242.4 million and the inclusion in 2006 of stock-
based compensation expense of approximately $13.4 million.
Selling, General and Administrative Expenses. Selling, general and administrative expenses consist primarily of salaries, stock-
based compensation expense, employee benefits, travel, promotion, communications, management, finance, administrative and
occupancy costs as well as depreciation and amortization expense. Selling, general and administrative expenses, including deprecia-
tion and amortization, increased by 65.3%, or approximately $149.1 million, from approximately $228.3 million during 2005 to
approximately $377.4 million during 2006, and increased as a percentage of revenue from approximately 25.8% in 2005 to approx-
imately 26.5% in 2006. The percentage increase in such expenses was due to stock-based compensation expense of approximately
$16.5 million or 1.2% of revenues partially offset by the increased leverage achieved from increased revenues that resulted from
our expanded sales and marketing activities in the current and prior years and the depreciation of the Indian Rupee versus the U.S.
dollar.
Income from Operations. Income from operations increased 45.8%, or approximately $81.3 million, from approximately $177.6 mil-
lion during 2005 to approximately $258.9 million during 2006, representing operating margins of approximately 18.2% of revenues
in 2006 and 20.1% of revenues in 2005. The decrease in operating margin was due to stock-based compensation expense of
approximately $29.9 million, or 2.1% of revenues, recorded in the year ended December 31, 2006. Excluding stock-based compensa-
tion expense, operating margin for the year ended December 31, 2006 was 20.3% of revenues.
Other Income/Expense, Net. Other income/expense, net consists primarily of interest income and foreign currency gains or losses.
The increase in other income/expense, net of $11.2 million is attributed to an increase in interest income of $8.6 million from
approximately $9.0 million in 2005 to approximately $17.6 million in 2006 plus a period-over-period increase of approximately $2.6
million in income due to the remeasurement of certain balance sheet accounts for movements in foreign currency exchange rates.
The increase in interest income is due to higher invested global cash balances and an increase in short-term interest rates.
Provision for Income Taxes. The provision for income taxes increased from approximately $19.0 million in 2005 to approximately
$45.0 million in 2006. The effective income tax rate increased from 10.3% in 2005 to 16.2% in 2006. The increase in the effective
income tax rate in 2006 is primarily attributed to the one-time benefit of approximately $12.4 million recorded in the fourth quarter
of 2005 in connection with the repatriation of $60.0 million of Indian earnings under the Act. The effective income tax rate in 2005
excluding the one-time benefit was 17.0%, which decreased in 2006 primarily due to the overall growth in our business which
resulted in a greater percentage of our Indian earnings falling under the income tax holiday.
C O G N I Z A N T 2 0 0 6 A N N U A L R E P O R T 21
61748 Financials 4/19/07 4:14 PM Page 7

Management’s Discussion and Analysisof Financial Condition and Results of Operations
22 C O G N I Z A N T 2 0 0 6 A N N U A L R E P O R T
Net Income. Net income increased from approximately $166.3 million in 2005 to approximately $232.8 million in 2006, represent-
ing 18.8% and 16.3% of revenues in 2005 and 2006, respectively. The decrease in net income as a percentage of revenues as com-
pared to the prior year was primarily due to stock-based compensation expense recorded in 2006, representing 2.1% of revenues
and the repatriation of Indian earnings in the fourth quarter of 2005, representing 1.4% of revenues, offset by the decrease in the
overall effective income tax rate, excluding the effect of the repatriation, in 2006 equal to 0.2% of revenues and an increase in
other income/expense, net, equal to 0.8% of revenues.
Year Ended December 31, 2005 Compared to Year Ended December 31, 2004
Revenue. Revenue increased by 51.0%, or approximately $299.2 million, from approximately $586.7 million during 2004 to approxi-
mately $885.8 million in 2005. This increase is primarily attributed to greater acceptance of the on-site/offshore delivery model,
our expanding range of service offerings which allowed us to access a larger share of our customers’ IT budgets, continued
strength in our customers’ discretionary spending, increased revenue from existing customers and revenue from new customers
added since December 31, 2004, including customers added from the acquisition of Fathom Solutions LLC (Fathom). Revenue from
customers existing as of December 31, 2004 increased by approximately $228.0 million and revenue from new customers added
since December 31, 2004 was approximately $71.2 million or approximately 8.0% of total revenues for the year ended December 31,
2005. We had approximately 250 active clients as of December 31, 2005 as compared to approximately 233 active clients as of
December 31, 2004. In addition, we experienced strong demand across all of our business segments for an increasingly broad range
of services. Our Financial Services segment accounted for approximately half of our year-over-year increase in revenue or approxi-
mately $150.5 million. Our IT consulting and technology services and IT outsourcing revenues increased by approximately 59% and
44%, respectively, compared to 2004 and represented approximately 49% and 51%, respectively, of total revenues in 2005. No
customer accounted for sales in excess of 10% of revenues in 2005. JPMorgan Chase accounted for 13.7% of our revenues in 2004.
Cost of Revenues (Exclusive of Depreciation and Amortization Expense). Our cost of revenues consists primarily of the cost of
salaries, payroll taxes, benefits, immigration, relocation and project-related travel for technical personnel, the cost of subcontracting
and the cost of sales commissions related to revenues. Our cost of revenues increased by 50.1% or approximately $160.1 million,
from approximately $319.8 million during 2004 to approximately $479.9 million in 2005. The increase was due to higher compensa-
tion and benefits costs of approximately $132.5 million.
Selling, General and Administrative Expenses. Selling, general and administrative expenses consist primarily of salaries, employee
benefits, travel, promotion, communications, management, finance, administrative and occupancy costs as well as depreciation and
amortization expense. Selling, general and administrative expenses, including depreciation and amortization, increased by 53.0%,
or approximately $79.1 million, from approximately $149.2 million during 2004 to approximately $228.3 million during 2005, and
increased as a percentage of revenue from approximately 25.4% in 2004 to approximately 25.8% in 2005. The increase in such
expenses in absolute dollars and as a percentage of revenues was due primarily to expenses incurred to expand our sales and mar-
keting activities and increased infrastructure expenses to support our growth.
Income from Operations. Income from operations increased 51.0%, or approximately $60.0 million, from approximately $117.6 mil-
lion during 2004 to approximately $177.6 million during 2005, representing essentially unchanged operating margins of approxi-
mately 20.1% of revenues in 2005 and 20.0% of revenues in 2004.
Other Income/Expense, Net. Other income/expense, net consists primarily of interest income and foreign currency gains or losses.
The increase in other income/expense, net of $3.2 million is attributed to an increase in interest income of $4.6 million from approx-
imately $4.4 million during 2004 to approximately $9.0 million during 2005 partially offset by a $1.4 million year-over-year reduc-
tion in other income due to the remeasurement of certain balance sheet accounts for movements in foreign currency exchange
rates. The increase in interest income is due primarily to higher invested balances and an increase in short-term interest rates.
Provision for Income Taxes. The provision for income taxes decreased from approximately $21.9 million in 2004 to approximately
$19.0 million in 2005. The effective income tax rate decreased from 17.9% in 2004 to 10.3% in 2005. The decrease in the effective
income tax rate in 2005 is primarily attributed to the one-time benefit of approximately $12.4 million recorded in the fourth quarter
of 2005 in connection with the repatriation of $60.0 million of Indian earnings under the Act. The effective income tax rate in
2005, excluding the one-time benefit was 17.0%, which decreased from the prior year primarily due to the overall growth in our
business which resulted in a greater percentage of our Indian earnings falling under the income tax holiday.
61748 Financials 4/19/07 4:14 PM Page 8

Year Ended December 31, 2006 Compared to Year Ended December 31, 2005
Financial Services Segment
Revenue. Revenue increased by 54.2%, or approximately $238.9 million, from approximately $441.0 million during 2005 to approxi-
mately $679.9 million in 2006. The increase in revenue was primarily driven by continued expansion of existing customer relation-
ships as well as revenue contributed by new customers. The increase in revenue from customers existing as of December 31, 2005
and customers added since such date was approximately $220.7 million and approximately $18.2 million, respectively. Within the
segment, growth was particularly strong among our insurance customers, where revenue increased approximately $109.3 million
Management’s Discussion and Analysisof Financial Condition and Results of Operations
Net Income. Net income increased from approximately $100.2 million in 2004 to approximately $166.3 million in 2005, represent-
ing 17.1% and 18.8% of revenues in 2004 and 2005, respectively. The increase in net income as a percentage of revenues as com-
pared to the prior year was primarily due to the one-time tax benefit resulting from the repatriation of Indian earnings in the fourth
quarter of 2005. Net income as a percentage of revenues excluding the one-time benefit was 17.4%.
RESULTS BY BUSINESS SEGMENT
Our reportable segments are: Financial Services, which includes customers providing banking/transaction processing, capital
markets and insurance services; Healthcare, which includes healthcare providers and payers as well as life sciences customers;
Manufacturing/Retail/Logistics, which includes manufacturers, retailers, travel and other hospitality customers, as well as cus-
tomers providing logistics services; and Other, which is an aggregation of industry operating segments which, individually, are less
than 10% of consolidated revenues and segment operating profit. The Other reportable segment includes media and information
services, telecommunications, and high technology operating segments. Our sales managers, account executives, account man-
agers and project teams are aligned in accordance with the specific industries they serve.
The Company’s chief operating decision maker evaluates Cognizant’s performance and allocates resources based on segment
revenues and operating profit. Segment operating profit is defined as income from operations before unallocated costs. Generally,
operating expenses for each operating segment have similar characteristics and are subject to the same factors, pressures and
challenges. However, the economic environment and its effects on industries served by our operating groups may affect revenue
and operating expenses to differing degrees. Expenses included in segment operating profit consist principally of direct selling and
delivery costs as well as a per seat charge for use of the development centers. Certain expenses, such as general and administra-
tive, and a portion of depreciation and amortization, are not specifically allocated to specific segments as management does not
believe it is practical to allocate such costs to individual segments because they are not directly attributable to any specific seg-
ment. Further, stock-based compensation expense is not allocated to individual segments in internal management reports used by
the chief operating decision maker. Accordingly, these expenses are separately disclosed as “unallocated” and adjusted only against
the total income from operations.
Revenues from external customers and segment operating profit, before unallocated expenses, for the Financial Services,
Healthcare, Manufacturing/Retail/Logistics and Other reportable segments for the years ended December 31, 2006, 2005 and
2004 are as follows:
C O G N I Z A N T 2 0 0 6 A N N U A L R E P O R T 23
Revenues:Financial services $679,901 $440,958 $290,432 $238,943 54.2% $150,526 51.8%Healthcare 330,860 176,102 116,370 154,758 87.9 59,732 51.3Manufacturing/retail/logistics 209,703 152,536 105,328 57,167 37.5 47,208 44.8Other 203,803 116,234 74,543 87,569 75.3 41,691 55.9
Total revenues $1,424,267 $885,830 $586,673 $538,437 60.8 $299,157 51.0Segment Operating Profit:Financial services $254,115 $153,542 $104,074 $100,573 65.5% $49,468 47.5%Healthcare 135,374 71,226 47,294 64,148 90.1 23,932 50.6Manufacturing/retail/logistics 73,443 46,210 38,842 27,233 58.9 7,368 19.0Other 63,657 39,100 30,820 24,557 62.8 8,280 26.9
Total segment operating profit $526,589 $310,078 $221,030 $216,511 69.8 $89,048 40.3
(Dollars in thousands) 2006 20052006 2005 2004 Increase % Increase %
61748 Financials 4/19/07 4:14 PM Page 9

Management’s Discussion and Analysisof Financial Condition and Results of Operations
24 C O G N I Z A N T 2 0 0 6 A N N U A L R E P O R T
over the prior year. The increase can also be attributed to leveraging sales and marketing investments in this business segment as
well as greater acceptance of the on-site/offshore IT services delivery model.
Segment Operating Profit. Segment operating profit increased by 65.5%, or approximately $100.6 million, from approximately
$153.5 million during 2005 to approximately $254.1 million during 2006. The increase in segment operating profit was attributable
primarily to increased revenues and achieving operating efficiencies, including continued leverage on prior sales and marketing
investments.
Healthcare Segment
Revenue. Revenue increased by 87.9%, or approximately $154.8 million, from approximately $176.1 million during 2005 to approxi-
mately $330.9 million in 2006. The increase in revenue was primarily driven by continued expansion of existing customer relation-
ships as well as revenue contributed by new customers. The increase in revenue from customers existing as of December 31, 2005
and customers added since such date was approximately $140.6 million and approximately $14.2 million, respectively. Within the
segment, growth was particularly strong among our life sciences customers, where revenue increased by approximately $74.1 mil-
lion over the prior year. The increase can also be attributed to leveraging sales and marketing investments in this business segment
as well as greater acceptance of the on-site/offshore IT services delivery model.
Segment Operating Profit. Segment operating profit increased 90.1%, or approximately $64.1 million, from approximately $71.2
million during 2005 to approximately $135.4 million during 2006. The increase in segment operating profit was attributable
primarily to increased revenues.
Manufacturing/Retail/Logistics Segment
Revenue. Revenue increased by 37.5%, or approximately $57.2 million, from approximately $152.5 million during 2005 to approxi-
mately $209.7 million in 2006. The increase in revenue within the manufacturing, logistics and retail groups was primarily driven by
continued expansion of existing customer relationships as well as revenue contributed by new customers. The increase in revenue
from customers existing as of December 31, 2005 and customers added since such date was approximately $48.9 million and
approximately $8.3 million, respectively. The increase can also be attributed to leveraging sales and marketing investments in this
business segment as well as greater acceptance of the on-site/offshore IT services delivery model.
Segment Operating Profit. Segment operating profit increased 58.9%, or approximately $27.2 million, from approximately $46.2
million during 2005 to approximately $73.4 million during 2006. The increase in segment operating profit was attributable
primarily to increased revenues and achieving operating efficiencies, including continued leverage on prior sales and marketing
investments.
Other Segment
Revenue. Revenue increased by 75.3%, or approximately $87.6 million, from approximately $116.2 million in 2005 to approximately
$203.8 million in 2006. The increase in revenue was primarily driven by continued expansion of existing customer relationships
as well as revenue contributed by new customers. The increase in revenue from customers existing as of December 31, 2005 and
customers added since such date was approximately $67.2 million and approximately $20.4 million, respectively. Within the seg-
ment, growth was particularly strong among our media and information services customers, where revenue increased approximate-
ly $37.3 million over the prior year. The increase can also be attributed to leveraging sales and marketing investments in this
business segment as well as greater acceptance of the on-site/offshore IT services delivery model.
Segment Operating Profit. Segment operating profit increased 62.8%, or approximately $24.6 million from approximately $39.1
million in 2005 to approximately $63.7 million in 2006. The increase in segment operating profit was attributable primarily to
increased revenues partially offset by continued investment in sales and marketing.
Year Ended December 31, 2005 Compared to Year Ended December 31, 2004
Financial Services Segment
Revenue. Revenue increased by 51.8%, or approximately $150.5 million, from approximately $290.4 million during 2004 to approxi-
mately $441.0 million in 2005. The increase in revenue was primarily driven by continued expansion of existing customer relation-
ships as well as revenues from new customers. The increase in revenue from customers existing as of December 31, 2004 and
61748 Financials 4/19/07 4:14 PM Page 10

Management’s Discussion and Analysisof Financial Condition and Results of Operations
customers added during 2005 was approximately $123.4 million and approximately $27.1 million, respectively. Within the segment,
growth was particularly strong among our insurance customers, where revenue increased approximately $61.9 million over the prior
year. The increase can also be attributed to leveraging sales and marketing investments in this business segment as well as greater
acceptance of the on-site/offshore IT services delivery model.
Segment Operating Profit. Segment operating profit increased by 47.5%, or approximately $49.5 million, from approximately
$104.1 million during 2004 to approximately $153.5 million during 2005. The increase in segment operating profit was attributable
primarily to increased revenues partially offset by continuing investment in sales and marketing.
Healthcare Segment
Revenue. Revenue increased by 51.3%, or approximately $59.7 million, from approximately $116.4 million during 2004 to approxi-
mately $176.1 million in 2005. The increase in revenue was primarily driven by continued expansion of existing customer relation-
ships as well as revenues from new customers. The increase in revenue from customers existing as of December 31, 2004 and
customers added during 2005 was approximately $50.5 million and approximately $9.2 million, respectively. Within the segment,
growth was particularly strong among our healthcare customers, where revenue increased by approximately $42.2 million over the
prior year. The increase can also be attributed to leveraging sales and marketing investments in this business segment as well as
greater acceptance of the on-site/offshore IT services delivery model.
Segment Operating Profit. Segment operating profit increased 50.6%, or approximately $23.9 million, from approximately $47.3
million during 2004 to approximately $71.2 million during 2005. The increase in segment operating profit was attributable primarily
to increased revenues partially offset by continuing investment in sales and marketing.
Manufacturing/Retail/Logistics Segment
Revenue. Revenue increased by 44.8%, or approximately $47.2 million, from approximately $105.3 million during 2004 to approxi-
mately $152.5 million in 2005. The increase in revenue within the manufacturing, logistics and retail groups was primarily driven by
continued expansion of existing customer relationships as well as revenues from new customers. The increase in revenue from cus-
tomers existing as of December 31, 2004 and customers added during 2005 was approximately $39.2 million and approximately
$8.0 million, respectively. The increase can also be attributed to leveraging sales and marketing investments in this business seg-
ment as well as greater acceptance of the on-site/offshore IT services delivery model.
Segment Operating Profit. Segment operating profit increased 19.0%, or approximately $7.4 million, from approximately $38.8
million during 2004 to approximately $46.2 million during 2005. The increase in segment operating profit was attributable
primarily to increased revenues largely offset by significant investments in sales and marketing, client relationship and program
management personnel, and program development to accelerate the acquisition and growth of new and existing clients.
Other Segment
Revenue. Revenue increased by 55.9%, or approximately $41.7 million, from approximately $74.5 million in 2004 to approximately
$116.2 million in 2005. The increase in revenue was primarily driven by continued expansion of existing customer relationships as
well as revenue contributed by new customers. The increase in revenue from customers existing as of December 31, 2004 and cus-
tomers added during 2005 was approximately $14.8 million and approximately $26.9 million, respectively. The increase can also be
attributed to leveraging sales and marketing investments in this business segment as well as greater acceptance of the on-site/off-
shore IT services delivery model.
Segment Operating Profit. Segment operating profit increased 26.9%, or approximately $8.3 million from approximately $30.8 mil-
lion in 2004 to approximately $39.1 million in 2005. The increase in segment operating profit was attributable primarily to increased
revenues largely offset by significant investments in sales and marketing, client relationship and program management personnel,
and program development to accelerate the acquisition and growth of new and existing clients.
LIQUIDITY AND CAPITAL RESOURCES
At December 31, 2006, we had cash and cash equivalents and short-term investments of $648.2 million. We have used, and plan to
use, such cash for: (i) expansion of existing operations, including our offshore IT development centers; (ii) continued development of
new service lines; (iii) possible acquisitions of related businesses; (iv) formation of joint ventures; and (v) general corporate
C O G N I Z A N T 2 0 0 6 A N N U A L R E P O R T 25
61748 Financials 4/19/07 4:14 PM Page 11

Management’s Discussion and Analysisof Financial Condition and Results of Operations
26 C O G N I Z A N T 2 0 0 6 A N N U A L R E P O R T
purposes, including working capital. As of December 31, 2006, we had no third-party debt and had working capital of approximately
$790.9 million as compared to working capital of approximately $509.6 million, with no third-party debt as of December 31, 2005.
Accordingly, we do not anticipate any near-term liquidity issues.
Net cash provided by operating activities was approximately $252.9 million for the year ended December 31, 2006, $159.8 million
for the year ended December 31, 2005 and $127.3 million for the year ended December 31, 2004. The increase in 2006 as compared
to the prior year is primarily attributed to the increase in our net income in 2006 and the timing of payment of accrued expenses,
offset, in part, by slower collections of receivables and the timing of billings of fixed-price contracts. Trade accounts receivable
increased from approximately $96.4 million at December 31, 2004 to approximately $154.0 million at December 31, 2005 and to
$259.2 million at December 31, 2006. Unbilled accounts receivable increased from approximately $14.2 million at December 31,
2004 to approximately $22.7 million at December 31, 2005 and to approximately $39.3 at December 31, 2006. The increase in
trade accounts receivable during 2006 was due primarily to increased revenues and a higher number of days of sales outstanding.
Unbilled receivables increased primarily due to increased revenue and the timing of milestone billings for certain fixed-price con-
tracts. We monitor turnover, aging and the collection of accounts receivable through the use of management reports that are pre-
pared on a customer basis and evaluated by our finance staff. At December 31, 2006, our days’ sales outstanding, including unbilled
receivables, was approximately 65 days as compared to 63 days as of December 31, 2005 and 59 days as of December 31, 2004.
Our investing activities used net cash of approximately $272.3 million for the year ended December 31, 2006, $204.5 million for the
year ended December 31, 2005 and $112.7 million for the year ended December 31, 2004. The increase in each year was primarily
related to increased investment of excess cash generated from operations in short-term investments to achieve a higher return on
invested balances and greater investment to expand our offshore IT development centers.
Our financing activities provided net cash of approximately $82.9 million for the year ended December 31, 2006, $47.5 million
for the year ended December 31, 2005 and $36.8 million for the year ended December 31, 2004. The increase in 2006 relates to
the classification in 2006 of excess tax benefits on employee stock option exercises of approximately $33.2 million in financing
activities as required by SFAS No. 123R. The increase in 2005 as compared to 2004 primarily related to a higher level of cash
proceeds received from the exercise of stock options and employee purchases of stock.
We believe that our available funds and the cash flows expected to be generated from operations will be adequate to satisfy our
current and planned operations and needs for at least the next 12 months. Our ability to expand and grow our business in
accordance with current plans, to make acquisitions and form joint ventures and to meet our long-term capital requirements
beyond this 12-month period will depend on many factors, including the rate, if any, at which our cash flow increases, our ability and
willingness to accomplish acquisitions and joint ventures with capital stock, our continued intent not to repatriate earnings from
India, our ability not to breach the Distribution Agreement with IMS Health, especially as it relates to our tax indemnities, and the
availability of public and private debt and equity financing. We cannot be certain that additional financing, if required, will be
available on terms favorable to us, if at all.
During July 2004, we entered into a foreign currency forward contract, with a six-month term and notional amount of $12.5 million,
to sell the Indian Rupee for United States dollars, that was settled in January 2005. We entered into this forward contract to
manage a portion of our foreign currency risk related to Indian Rupee denominated asset balances, primarily cash investments,
at our Indian subsidiary, Cognizant India. Movement in the exchange rate for the Indian Rupee results in foreign currency gains
or losses upon remeasurement of Cognizant India’s financial statements into its functional currency, the United States dollar. Our
objective was to reduce foreign currency exposure to appreciation or depreciation in the value of the Indian Rupee by offsetting
a portion of such exposure with gains or losses on the forward contract, referred to above. The forward contract was marked to
market and recorded at fair value with unrealized gains and losses reported along with foreign currency gains or losses in the
caption “other income (expense), net” on our consolidated statements of operations and comprehensive income.
Other than the aforementioned forward contract, we have not engaged in hedging activities nor have we entered into off-balance
sheet transactions, arrangements or other relationships with unconsolidated entities or other persons that are likely to affect
liquidity or the availability of or requirements for capital resources.
61748 Financials 4/19/07 4:14 PM Page 12

Management’s Discussion and Analysisof Financial Condition and Results of Operations
In connection with the acquisition of substantially all the assets of Fathom, additional purchase price, not to exceed $16.0 million,
payable in 2007, is contingent on Fathom achieving certain financial and operating targets over the two years ended April 30, 2007.
We will fund such payment, if any, from operating cash flow.
Contingent purchase price payments relating to acquisitions are recorded when the contingencies are resolved. The contingent
consideration, if paid, will be recorded as an additional element of the cost of the acquired company. Any additional payments relat-
ing to the achievement of post-acquisition financial and operating targets are expected to be funded by cash flows from operations.
We are involved in various claims and legal actions arising in the ordinary course of business. In the opinion of management, the
outcome of such claims and legal actions, if decided adversely, is not expected to have a material adverse effect on our quarterly or
annual operating results, cash flows, or consolidated financial position. Additionally, many of our engagements involve projects that
are critical to the operations of our customers’ business and provide benefits that are difficult to quantify. Any failure in a cus-
tomer’s computer system could result in a claim for substantial damages against us, regardless of our responsibility for such failure.
Although we attempt to contractually limit our liability for damages arising from negligent acts, errors, mistakes, or omissions in
rendering our application design, development and maintenance services, there can be no assurance that the limitations of liability
set forth in our contracts will be enforceable in all instances or will otherwise protect us from liability for damages. Although we
have general liability insurance coverage, including coverage for errors or omissions, there can be no assurance that such coverage
will continue to be available on reasonable terms or will be available in sufficient amounts to cover one or more large claims, or
that the insurer will not disclaim coverage as to any future claim. The successful assertion of one or more large claims against us
that exceed available insurance coverage or changes in our insurance policies, including premium increases or the imposition of
large deductible or co-insurance requirements, could have a material adverse effect on our quarterly and annual operating results,
financial position and cash flows.
In connection with our split-off from IMS Health, we entered into a Distribution Agreement, dated January 7, 2003, with IMS Health,
referred to as the Distribution Agreement. The Distribution Agreement provides, among other things, that IMS Health and we will
comply with, and not take any action during the relevant time period that is inconsistent with, the representations made to and
relied upon by McDermott, Will & Emery in connection with rendering its opinion regarding the U.S. federal income tax conse-
quences of the exchange offer. In addition, pursuant to the Distribution Agreement, we indemnified IMS Health for any tax liability
to which they may be subject as a result of the exchange offer but only to the extent that such tax liability resulted solely from
a breach in the representations we made to and were relied upon by McDermott, Will & Emery in connection with rendering its
COMMITMENTS AND CONTINGENCIES
In November 2006, we announced the expansion of our existing India real estate development program to include over three
million square feet of new space, which is inclusive of the 900,000 square feet of space that we added to our planned construction
program in February 2006. The expanded program will include the expenditure of approximately $200 million through the end of
2008 on land acquisition, facilities construction and furnishings to build new fully-owned state-of-the-art development centers in
regions primarily designated as Special Economic Zones located in Chennai, Pune, Kolkata, Hyderabad and Coimbatore, India. As
of December 31, 2006, we had outstanding fixed capital commitments of approximately $57.7 million related to our existing India
development center expansion program.
As of December 31, 2006, we had the following obligations and commitments to make future payments under contractual
obligations and commercial commitments:
C O G N I Z A N T 2 0 0 6 A N N U A L R E P O R T 27
(1) Relates to India IT development center expansion program.
(2) Other purchase commitments include, among other things, information technology, software support and maintenance obligations, as well as other
obligations in the ordinary course of business that we cannot cancel or where we would be required to pay a termination fee in the event of cancellation.
Operating leases $ 113,970 $ 24,361 $ 46,776 $ 35,359 $ 7,474Fixed capital commitments (1) 57,695 57,695 – – –Other purchase commitments (2) 8,488 8,488 – – –
Total $ 180,153 $ 90,544 $ 46,776 $ 35,359 $ 7,474
(in thousands) Payments due by periodLess than More than
Total 1 year 1-3 years 3-5 years 5 years
61748 Financials 4/19/07 4:14 PM Page 13

Management’s Discussion and Analysisof Financial Condition and Results of Operations
28 C O G N I Z A N T 2 0 0 6 A N N U A L R E P O R T
opinion regarding the U.S. federal income tax consequences of the exchange offer. If we breach any of our representations in
connection with the Distribution Agreement, the related indemnification liability could be material to our quarterly and annual
operating results, financial position and cash flows.
FOREIGN CURRENCY TRANSLATION
Overall, we believe that we are not exposed to significant revenue risk resulting from movement in foreign exchange rates as
approximately 86% of our revenues are generated from customers located in the United States. However, a portion of our costs in
India are denominated in local currency and subject to foreign exchange rate fluctuations, which has an impact on our results of
operations. In addition, a portion of our balance sheet is exposed to foreign exchange rate fluctuations, which results in non-operat-
ing foreign exchange gains and losses. On an ongoing basis we manage a portion of this risk by limiting our net monetary asset
exposure to the Indian Rupee in our Indian subsidiary.
EFFECTS OF INFLATION
Our most significant costs are the salaries and related benefits for our programming staff and other professionals. Competition in
India, the United States and Europe for professionals with advanced technical skills necessary to perform our services offered have
caused wages to increase at a rate greater than the general rate of inflation. As with other IT service providers, we must adequately
anticipate wage increases, particularly on our fixed-price contracts. There can be no assurance that we will be able to recover cost
increases through increases in the prices that we charge for our services in the United States and elsewhere. We have experienced
wage inflation in India; however, this has not had a material impact on our results of operations as Indian wages represent less than
20% of our total operating expenses.
RECENT ACCOUNTING PRONOUNCEMENTS
In September 2006, the SEC issued SAB 108, “Considering the Effects of Prior Year Misstatements when Quantifying Misstatements
in Current Year Financial Statements” (“SAB 108”). SAB 108 provides interpretive guidance on how the effects of the carryover or
reversal of prior year misstatements should be considered in quantifying a current year misstatement. The pronouncement pre-
scribes an approach whereby the effect of all unrecorded identified errors should be considered on all of the financial statements
rather than just either the effect on the balance sheet or the income statement. We adopted the provisions of SAB 108 as of
December 31, 2006. The adoption of SAB 108 did not have a material impact on our consolidated financial statements.
On July 13, 2006, the Financial Accounting Standards Board (“FASB”) issued Interpretation No. 48, “Accounting for Uncertainty
in Income Taxes — an interpretation of FASB Statement No. 109” (“FIN 48”), which clarifies the accounting for uncertainty in tax
positions. FIN 48 requires recognition in the financial statements of the impact of a tax position, if that position is more likely than
not of being sustained on audit, based on the technical merits of the position. The provisions are effective for our first quarter
2007 financial statements with the cumulative effect, if any, of the change in accounting principle recorded as an adjustment to
the opening balance of retained earnings. We are currently evaluating the impact of adopting FIN 48 on our consolidated financial
statements.
In September 2006, the FASB issued SFAS No. 157, “Fair Value Measurements” (“SFAS No. 157”). SFAS No. 157 defines fair value,
establishes a framework for measuring fair value and expands disclosures about fair value measurements. SFAS No. 157 is effective
for financial statements issued for fiscal years beginning after November 15, 2007 and interim periods within those fiscal years. We
are currently evaluating the impact that SFAS No. 157 will have on our consolidated financial statements.
QUANTITATIVE AND QUALITATIVE DISCLOSURES ABOUT MARKET RISK
We are exposed to foreign currency exchange rate risk in the ordinary course of doing business as we transact or hold a portion of
our funds in foreign currencies, particularly the Indian Rupee. Accordingly, we periodically evaluate the need for hedging strategies
to mitigate the effect of foreign currency fluctuations. During July 2004, we entered into a foreign currency forward contract, with
a six-month term and notional amount of $12.5 million, to sell the Indian Rupee for U.S. dollars, which was settled in January 2005.
We may continue to enter into such instruments in the future to reduce foreign currency exposure to appreciation or depreciation
61748 Financials 4/19/07 4:14 PM Page 14

Management’s Discussion and Analysisof Financial Condition and Results of Operations
in the value of certain foreign currencies. Other than the aforementioned forward contract, we have not engaged in hedging
activities nor have we entered into off-balance sheet transactions, arrangements or other relationships with unconsolidated entities
or other persons that are likely to affect liquidity or the availability of or requirements for capital resources.
We do not believe we are exposed to material direct risks associated with changes in interest rates other than with our cash and
cash equivalents and short-term investments. As of December 31, 2006, we had $648.2 million of cash and cash equivalents and
short-term investments which are impacted almost immediately by changes in short-term interest rates. We limit our credit risk by
investing in primarily AAA rated securities as rated by Moody’s, Standard & Poor’s and Fitch rating services and restricting amounts
that can be invested with any single issuer.
FORWARD LOOKING STATEMENTS
The statements contained in this Annual Report that are not historical facts are forward-looking statements (within the meaning of
Section 21E of the Securities Exchange Act of 1934, as amended) that involve risks and uncertainties. Such forward-looking state-
ments may be identified by, among other things, the use of forward-looking terminology such as “believes”, “expects”, “may”,
“will”, “should” or “anticipates” or the negative thereof or other variations thereon or comparable terminology, or by discussions of
strategy that involve risks and uncertainties. From time to time, we or our representatives have made or may make forward-looking
statements, orally or in writing. Such forward-looking statements may be included in various filings made by us with the SEC, or
press releases or oral statements made by or with the approval of one of our authorized executive officers. These forward-looking
statements, such as statements regarding anticipated future revenues or operating margins, contract percentage completions,
capital expenditures, and other statements regarding matters that are not historical facts, involve predictions. Our actual results,
performance or achievements could differ materially from the results expressed in, or implied by, these forward-looking statements.
There are a number of important factors that could cause our results to differ materially from those indicated by such forward-look-
ing statements which include general economic conditions and factors discussed in our most recent Annual Report on Form 10-K
for the year ended December 31, 2006 and other filings with the Securities and Exchange Commission. We undertake no obligation
to update or revise any forward-looking statements, whether as a result of new information, future events or otherwise.
C O G N I Z A N T 2 0 0 6 A N N U A L R E P O R T 29
61748 Financials 4/19/07 4:14 PM Page 15

Management’s Responsibility for Financial Statements
Our management is responsible for the integrity and objectivity
of all information presented in this annual report. The consoli-
dated financial statements were prepared in conformity with
accounting principles generally accepted in the United States
of America and include amounts based on management’s best
estimates and judgments. Management believes the consolidat-
ed financial statements fairly reflect the form and substance of
transactions and that the financial statements fairly represent
the Company’s financial position and results of operations.
The Audit Committee of the Board of Directors, which is com-
posed solely of independent directors, meets regularly with the
Company’s independent registered public accounting firm and
representatives of management to review accounting, financial
reporting, internal control and audit matters, as well as the
nature and extent of the audit effort. The Audit Committee is
responsible for the engagement of the independent registered
public accounting firm. The independent registered public
accounting firm has free access to the Audit Committee.
Management’s Report on Internal Control Over
Financial Reporting
Our management is responsible for establishing and maintain-
ing adequate internal control over financial reporting. Internal
control over financial reporting is defined in Rule 13a-15(f) or
15d-15(f) promulgated under the Exchange Act and is a process
designed by, or under the supervision of, our principal executive
and principal financial officers and effected by our board of
directors, management and other personnel, to provide reason-
able assurance regarding the reliability of financial reporting
and the preparation of financial statements for external purpos-
es in accordance with generally accepted accounting principles
and includes those policies and procedures that:
• Pertain to the maintenance of records that in reasonable
detail accurately and fairly reflect the transactions and
dispositions of our assets;
• Provide reasonable assurance that transactions are recorded
as necessary to permit preparation of financial statements in
accordance with generally accepted accounting principles,
and that receipts and expenditures of the company are being
made only in accordance with authorizations of our manage-
ment and directors; and
• Provide reasonable assurance regarding prevention or timely
detection of unauthorized acquisition, use or disposition of
the company’s assets that could have a material effect on the
financial statements.
Because of its inherent limitations, internal control over finan-
cial reporting may not prevent or detect misstatements.
Projections of any evaluation of effectiveness to future periods
are subject to the risk that controls may become inadequate
because of changes in conditions, or that the degree of compli-
ance with the policies or procedures may deteriorate.
Our management assessed the effectiveness of the company’s
internal control over financial reporting as of December 31,
2006. In making this assessment, the company’s management
used the criteria set forth by the Committee of Sponsoring
Organizations of the Treadway Commission (COSO) in Internal
Control-Integrated Framework.
Based on its evaluation, our management has concluded that,
as of December 31, 2006, our internal control over financial
reporting was effective. Our management’s assessment of
the effectiveness of our internal control over financial
reporting as of December 31, 2006 has been audited by
PricewaterhouseCoopers LLP, an independent registered public
accounting firm, as stated in their report which is included on
page 31.
Francisco D’Souza
President and Chief Executive Officer
February 16, 2007
Gordon Coburn
Chief Financial and Operating Officer
February 16, 2007
Report of Management
30 C O G N I Z A N T 2 0 0 6 A N N U A L R E P O R T
61748 Financials 4/19/07 4:14 PM Page 16

To the Board of Directors and Stockholders of Cognizant
Technology Solutions Corporation:
We have completed integrated audits of Cognizant Technology
Solutions Corporation’s consolidated financial statements and
of its internal control over financial reporting as of December
31, 2006, in accordance with the standards of the Public
Company Accounting Oversight Board (United States). Our
opinions, based on our audits, are presented below.
Consolidated financial statements
In our opinion, the accompanying consolidated balance sheets
and related consolidated statements of operations and compre-
hensive income, stockholders’ equity and cash flows present
fairly, in all material respects, the financial position of Cognizant
Technology Solutions Corporation and its subsidiaries (the
“Company”) at December 31, 2006 and 2005, and the results of
their operations and their cash flows for each of the three years
in the period ended December 31, 2006 in conformity with
accounting principles generally accepted in the United States of
America. These financial statements are the responsibility of
the Company’s management. Our responsibility is to express an
opinion on these financial statements based on our audits. We
conducted our audits of these statements in accordance with
the standards of the Public Company Accounting Oversight
Board (United States). Those standards require that we plan and
perform the audit to obtain reasonable assurance about
whether the financial statements are free of material misstate-
ment. An audit of financial statements includes examining, on a
test basis, evidence supporting the amounts and disclosures in
the financial statements, assessing the accounting principles
used and significant estimates made by management, and eval-
uating the overall financial statement presentation. We believe
that our audits provide a reasonable basis for our opinion.
As discussed in Note 1 to the consolidated financial statements,
the Company changed the manner in which it accounts for
share-based compensation in 2006.
Internal control over financial reporting
Also, in our opinion, management’s assessment, included in
“Management’s Report on Internal Control Over Financial
Reporting”, that the Company maintained effective internal
control over financial reporting as of December 31, 2006
based on criteria established in Internal Control - Integrated
Framework issued by the Committee of Sponsoring
Organizations of the Treadway Commission (COSO), is fairly
stated, in all material respects, based on those criteria.
Furthermore, in our opinion, the Company maintained, in all
material respects, effective internal control over financial
reporting as of December 31, 2006, based on criteria estab-
lished in Internal Control - Integrated Framework issued by the
COSO. The Company’s management is responsible for maintain-
ing effective internal control over financial reporting and for its
assessment of the effectiveness of internal control over finan-
cial reporting. Our responsibility is to express opinions on
management’s assessment and on the effectiveness of the
Company’s internal control over financial reporting based on
our audit. We conducted our audit of internal control over finan-
cial reporting in accordance with the standards of the Public
Company Accounting Oversight Board (United States). Those
standards require that we plan and perform the audit to obtain
reasonable assurance about whether effective internal control
over financial reporting was maintained in all material respects.
An audit of internal control over financial reporting includes
obtaining an understanding of internal control over financial
reporting, evaluating management’s assessment, testing and
evaluating the design and operating effectiveness of internal
control, and performing such other procedures as we consider
necessary in the circumstances. We believe that our audit pro-
vides a reasonable basis for our opinions.
A company’s internal control over financial reporting is a
process designed to provide reasonable assurance regarding
the reliability of financial reporting and the preparation of finan-
cial statements for external purposes in accordance with gener-
ally accepted accounting principles. A company’s internal
control over financial reporting includes those policies and
procedures that (i) pertain to the maintenance of records that,
in reasonable detail, accurately and fairly reflect the transac-
tions and dispositions of the assets of the company; (ii) provide
reasonable assurance that transactions are recorded as
necessary to permit preparation of financial statements in
accordance with generally accepted accounting principles, and
that receipts and expenditures of the company are being made
only in accordance with authorizations of management and
directors of the company; and (iii) provide reasonable assurance
regarding prevention or timely detection of unauthorized acqui-
sition, use, or disposition of the company’s assets that could
have a material effect on the financial statements.
Because of its inherent limitations, internal control over finan-
cial reporting may not prevent or detect misstatements. Also,
projections of any evaluation of effectiveness to future periods
are subject to the risk that controls may become inadequate
because of changes in conditions, or that the degree of
compliance with the policies or procedures may deteriorate.
PricewaterhouseCoopers LLP
Florham Park, New Jersey
February 15, 2007
Report of Independent Registered PublicAccounting Firm
C O G N I Z A N T 2 0 0 6 A N N U A L R E P O R T 31
61748 Financials 4/19/07 4:14 PM Page 17

AssetsCurrent assets:Cash and cash equivalents $ 265,937 $ 196,938Short-term investments 382,222 227,063Trade accounts receivable, net of allowances of
$3,719 and $2,325, respectively 259,210 153,971Unbilled accounts receivable 39,265 22,725Deferred income tax assets 61,257 42,752Other current assets 32,500 19,974
Total current assets 1,040,391 663,423Property and equipment, net of accumulated depreciation
of $95,539 and $64,736, respectively 220,154 146,982Goodwill 27,190 18,223Intangible assets, net 20,463 16,277Deferred income tax assets, net 1,024 17,247Other assets 16,759 7,741
Total assets $ 1,325,981 $ 869,893
Liabilities and Stockholders’ EquityCurrent liabilities:Accounts payable $ 27,839 $ 16,420Deferred revenue 19,401 14,707Accrued expenses and other liabilities 202,263 122,668
Total current liabilities 249,503 153,795Other noncurrent liabilities 2,979 1,953
Total liabilities 252,482 155,748
Commitments and contingencies (See Notes 11 and 12)
Stockholders’ equity:Preferred stock, $.10 par value, 15,000 shares authorized, none issued – –Class A common stock, $.01 par value, 500,000 and 325,000 shares
authorized, 142,513 and 139,346 shares issued and outstandingat December 31, 2006 and 2005, respectively 1,425 1,393
Additional paid-in capital 410,019 293,149Retained earnings 650,277 417,482Accumulated other comprehensive income 11,778 2,121
Total stockholders’ equity 1,073,499 714,145Total liabilities and stockholders’ equity $ 1,325,981 $ 869,893
The accompanying notes are an integral part of the consolidated financial statements.
Consolidated Statements of Financial Position(in thousands, except par values)
At December 31,2006 2005
32 C O G N I Z A N T 2 0 0 6 A N N U A L R E P O R T
61748 Financials 4/19/07 4:14 PM Page 18

Revenues $ 1,424,267 $ 885,830 $ 586,673Operating expenses:Cost of revenues (exclusive of depreciation and
amortization expense shown separately below) 787,923 479,915 319,810Selling, general and administrative expenses 343,238 206,899 132,796Depreciation and amortization expense 34,163 21,400 16,447Income from operations 258,943 177,616 117,620Other income (expense), net:
Interest income 17,615 8,982 4,389Other income (expense), net 1,253 (1,326) 86
Total other income (expense), net 18,868 7,656 4,475Income before provision for income taxes 277,811 185,272 122,095Provision for income taxes 45,016 19,006 21,852Net income $ 232,795 $ 166,266 $ 100,243Basic earnings per share $ 1.65 $ 1.22 $ 0.77Diluted earnings per share $ 1.55 $ 1.13 $ 0.70Weighted average number of
common shares outstanding – Basic 140,858 136,494 130,990Dilutive effect of shares issuable as of
period-end under stock option plans 9,704 10,401 11,566Weighted average number of
common shares outstanding – Diluted 150,562 146,895 142,556Comprehensive income:Net income $ 232,795 $ 166,266 $ 100,243Foreign currency translation adjustments 9,657 (7,528) 5,649Total comprehensive income $ 242,452 $ 158,738 $ 105,892
The accompanying notes are an integral part of the consolidated financial statements.
Consolidated Statements ofOperations and Comprehensive Income(in thousands, except per share data)
Year Ended December 31,2006 2005 2004
C O G N I Z A N T 2 0 0 6 A N N U A L R E P O R T 33
61748 Financials 4/19/07 4:14 PM Page 19
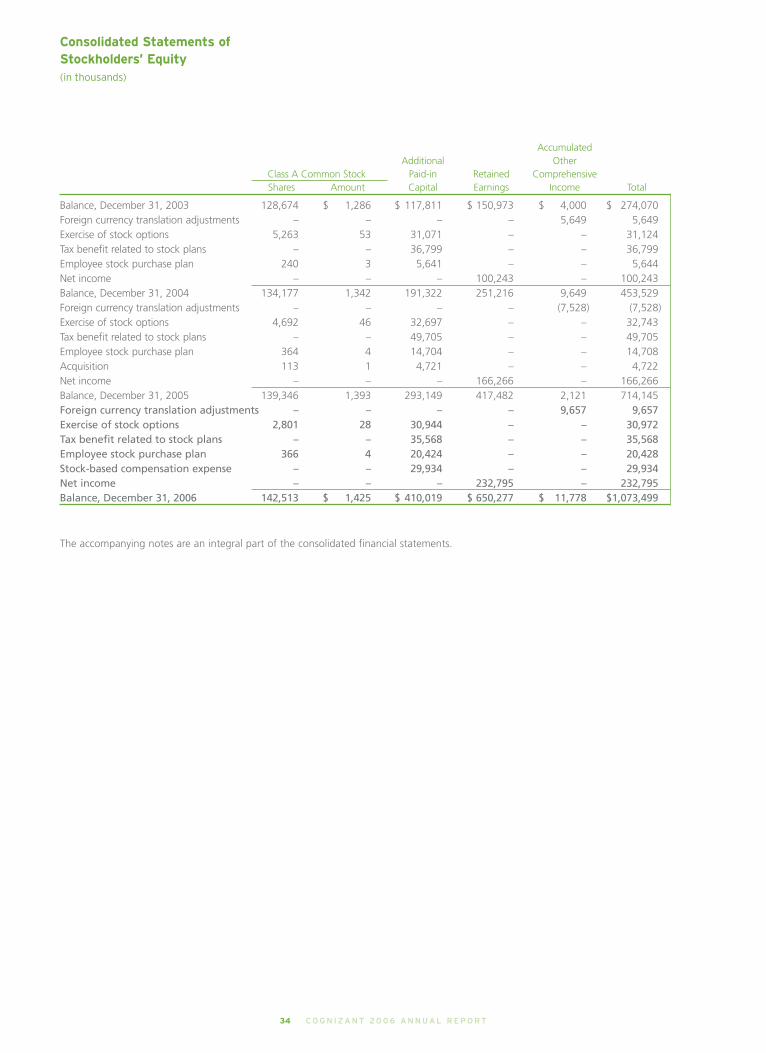
Balance, December 31, 2003 128,674 $ 1,286 $ 117,811 $ 150,973 $ 4,000 $ 274,070Foreign currency translation adjustments – – – – 5,649 5,649Exercise of stock options 5,263 53 31,071 – – 31,124Tax benefit related to stock plans – – 36,799 – – 36,799Employee stock purchase plan 240 3 5,641 – – 5,644Net income – – – 100,243 – 100,243Balance, December 31, 2004 134,177 1,342 191,322 251,216 9,649 453,529Foreign currency translation adjustments – – – – (7,528) (7,528)Exercise of stock options 4,692 46 32,697 – – 32,743Tax benefit related to stock plans – – 49,705 – – 49,705Employee stock purchase plan 364 4 14,704 – – 14,708Acquisition 113 1 4,721 – – 4,722Net income – – – 166,266 – 166,266Balance, December 31, 2005 139,346 1,393 293,149 417,482 2,121 714,145Foreign currency translation adjustments – – – – 9,657 9,657Exercise of stock options 2,801 28 30,944 – – 30,972Tax benefit related to stock plans – – 35,568 – – 35,568Employee stock purchase plan 366 4 20,424 – – 20,428Stock-based compensation expense – – 29,934 – – 29,934Net income – – – 232,795 – 232,795Balance, December 31, 2006 142,513 $ 1,425 $ 410,019 $ 650,277 $ 11,778 $1,073,499
The accompanying notes are an integral part of the consolidated financial statements.
Consolidated Statements ofStockholders’ Equity(in thousands)
AccumulatedAdditional Other
Class A Common Stock Paid-in Retained ComprehensiveShares Amount Capital Earnings Income Total
34 C O G N I Z A N T 2 0 0 6 A N N U A L R E P O R T
61748 Financials 4/19/07 4:14 PM Page 20

Cash flows from operating activities:Net income $ 232,795 $ 166,266 $ 100,243Adjustments to reconcile net income to
net cash provided by operating activities:Depreciation and amortization 34,163 21,400 16,447Provision for doubtful accounts 1,507 1,626 527Deferred income taxes (2,282) (47,340) (22,326)Stock-based compensation expense 29,934 – –Tax benefit related to stock option exercises 35,568 49,705 36,799Excess tax benefit on stock option exercises (33,249) – –
Changes in assets and liabilities:Trade accounts receivable (102,334) (55,827) (42,739)Other current assets (26,849) (15,339) (8,293)Other assets (8,419) (1,294) (3,495)Accounts payable 10,817 2,208 1,546Other current liabilities 81,225 38,355 48,624
Net cash provided by operating activities 252,876 159,760 127,333
Cash flows used in investing activities:Purchases of property and equipment (104,734) (71,770) (46,581)Purchases of short-term investments (488,161) (625,792) (175,331)Proceeds from maturity or sale of short-term investments 335,330 512,827 110,713Acquisitions, net of cash acquired (14,773) (19,811) (1,495)Net cash used in investing activities (272,338) (204,546) (112,694)
Cash flows from financing activities:Proceeds from issued shares 51,400 47,451 36,768Excess tax benefit on stock option exercises 33,249 – –Repayment of acquired credit line and notes payable (1,754) – –Net cash provided by financing activities 82,895 47,451 36,768Effect of currency translation on cash
and cash equivalents 5,566 (5,023) 3,518Increase (decrease) in cash and cash equivalents 68,999 (2,358) 54,925Cash and cash equivalents, at beginning of year 196,938 199,296 144,371Cash and cash equivalents, at end of year $ 265,937 $ 196,938 $ 199,296Supplemental information:
Cash paid for income taxes during the year $ 14,103 $ 17,354 $ 9,608
The accompanying notes are an integral part of the consolidated financial statements.
Consolidated Statements of Cash Flows(in thousands)
Year Ended December 31,2006 2005 2004
C O G N I Z A N T 2 0 0 6 A N N U A L R E P O R T 35
61748 Financials 4/19/07 4:14 PM Page 21
Notes to Consolidated Financial Statements(in thousands, except share and per share data)
1. Summary of Significant Accounting Policies
Description of Business. Cognizant Technology Solutions
Corporation (“Cognizant” or the “Company”) is a leading
provider of custom Information Technology (“IT”) consulting and
technology services as well as outsourcing services for Global
2000 Business companies located in North America, Europe and
Asia. Cognizant’s core competencies include Technology
Strategy Consulting, Complex Systems Development, Enterprise
Software Package Implementation, Data Warehousing & Business
Intelligence, Application Testing, Application Maintenance,
Infrastracture Management and Vertically-Oriented Business
Process Outsourcing. The Company tailors its services to specific
industries, and utilizes an integrated on-site/offshore business
model. This seamless on-site/offshore business model combines
technical and account management teams located on-site at the
customer location and offshore at dedicated development
centers located primarily in India.
Principles of Consolidation. The consolidated financial state-
ments reflect the consolidated financial position, results of
operations and cash flows of the Company and its consolidated
subsidiaries for all periods presented. All intercompany balances
and transactions have been eliminated in consolidation.
Cash and Cash Equivalents. The Company considers all highly
liquid instruments with a maturity of three months or less at the
time of purchase to be cash equivalents. Cash and cash equiva-
lents included time deposits of $5,914 at December 31, 2006 and
$37,229 at December 31, 2005.
Short-Term Investments. The Company’s short-term investments
consist of time deposits which mature in less than one year,
valued at cost, which approximates fair value and available-for-
sale securities valued at fair value. Interest and amortization of
premiums and discounts for debt securities are included in
interest income. Available-for-sale securities consist primarily
of auction-rate securities with auction rate reset periods of less
than three months. The Company’s investment in auction-rate
securities consists of investment grade municipal and corporate
debt securities.
Allowance for Doubtful Accounts. The Company maintains an
allowance for doubtful accounts for estimated losses resulting
from the inability of its customers to make required payments.
The allowance for doubtful accounts is determined by evaluating
the relative credit-worthiness of each customer, historical
collections experience and other information, including the
aging of the receivables.
Unbilled Accounts Receivable. Unbilled accounts receivable
represent revenues on contracts to be billed, in subsequent
periods, as per the terms of the related contracts.
Short-Term Financial Assets and Liabilities. Cash and cash
equivalents, trade receivables, accounts payable and other
accrued liabilities are short-term in nature and, accordingly,
their carrying values approximate fair value.
Property and Equipment. Property and equipment are stated at
cost, net of accumulated depreciation. Depreciation is calculated
on the straight-line basis over the estimated useful lives of the
assets. Leasehold improvements are amortized on a straight-line
basis over the shorter of the term of the lease or the estimated
useful life of the improvement. Maintenance and repairs are
expensed as incurred, while renewals and betterments are
capitalized. Deposits paid towards acquisition of long-lived assets
and the cost of assets not put in use before the balance sheet
date are disclosed under the caption “capital work-in-progress”
in Note 4.
Internal Use Software. Expenditures for major software
purchases and software developed or obtained for internal use
are capitalized, including the salaries and benefits of employees
that are directly involved in the installation of such software. The
capitalized costs are amortized on a straight-line method over
the lesser of three years or its useful life. Costs associated with
preliminary project stage activities, training, maintenance and all
other post-implementation stage activities are expensed as
incurred.
Goodwill and Other Intangibles. The Company does not
amortize goodwill, but instead tests goodwill at the reporting
unit level for impairment at least annually or as circumstances
warrant. If an impairment is indicated, a write-down to fair value
(normally measured by discounting estimated future cash flows)
is recorded. Other intangibles represent primarily customer rela-
tionships, assembled workforce and developed technology which
are being amortized on a straight-line basis over their estimated
useful lives.
Long-Lived Assets. The Company reviews for impairment of
long-lived assets and certain identifiable intangibles whenever
events or changes in circumstances indicate that the carrying
amount of an asset may not be recoverable. In general, the
Company will recognize an impairment loss when the sum of
undiscounted expected future cash flows is less than the carry-
ing amount of such assets. The impairment loss would equal the
amount by which the carrying amount of the asset exceeds the
fair value of the asset.
Revenue Recognition. The Company’s services are entered into
on either a time-and-materials or fixed-price basis. Revenues
related to time-and-material contracts are recognized as the
service is performed. Revenues related to fixed-price contracts
36 C O G N I Z A N T 2 0 0 6 A N N U A L R E P O R T
61748 Financials 4/19/07 4:14 PM Page 22

Notes to Consolidated Financial Statements(in thousands, except share and per share data)
that provide for highly complex information technology
application development services are recognized as the service
is performed using the percentage of completion method of
accounting, under which the total value of revenue is recognized
on the basis of the percentage that each contract’s cost to date
bears to the total estimated cost (cost to cost method). Revenues
related to fixed-priced contracts that provide solely for applica-
tion maintenance services are recognized on a straight-line
basis or as services are rendered or transactions processed in
accordance with contractual terms. Expenses are recorded as
incurred over the contract period. Volume discounts, if any, are
recorded as a reduction of revenue over the contract period as
services are provided.
Effective July 1, 2003, the Company adopted Emerging Issues
Task Force (“EITF”) Consensus 00-21, “Revenue Arrangements
with Multiple Deliverables” (“EITF 00-21”). For contracts with
multiple deliverables, the Company evaluates at the inception
of each new contract all deliverables in an arrangement to
determine whether they represent separate units of accounting.
For arrangements with multiple units of accounting, primarily
fixed-price contracts that provide both application maintenance
and application development services and certain application
maintenance contracts, arrangement consideration is allocated
among the units of accounting, where separable, based on their
relative fair values and revenue is recognized for each unit of
accounting based on the Company’s revenue recognition policy
described above.
Fixed-price contracts are cancelable subject to a specified notice
period. All services provided by the Company through the date
of cancellation are due and payable under the contract terms.
The Company issues invoices related to fixed-price contracts
based upon achievement of milestones during a project or other
contractual terms. Differences between the timing of billings,
based upon contract milestones or other contractual terms,
and the recognition of revenue, based upon the percentage-of-
completion method of accounting, are recognized as either
unbilled or deferred revenue. Estimates of certain fixed-price
contracts are subject to adjustment as a project progresses to
reflect changes in expected completion costs. The cumulative
impact of any revision in estimates is reflected in the financial
reporting period in which the change in estimate becomes
known and any anticipated losses on contracts are recognized
immediately. Warranty provisions generally exist under such
contracts for a period of ninety days past contract completion
and costs related to such provisions are accrued at the time the
related revenues are recorded.
For all services, revenue is recognized when, and if, evidence of
an arrangement is obtained and the other criteria to support
revenue recognition are met, including the price is fixed or
determinable, services have been rendered and collectibility
is assured. Revenues related to services performed without a
signed agreement or work order are not recognized until there is
evidence of an arrangement, such as when agreements or work
orders are signed or payment is received; however, the cost
related to the performance of such work is recognized in the
period the services are rendered.
The Company accounts for reimbursement of out-of-pocket
expenses as revenues. Subcontractor costs are included in cost
of services as they are incurred.
Accounting for Stock-Based Employee Compensation Plans.
Effective January 1, 2006, the Company adopted Statement of
Financial Accounting Standard (“SFAS”) No. 123R, “Share-Based
Payment,” utilizing the modified prospective method. SFAS No.
123R requires the recognition of stock-based compensation
expense in the consolidated financial statements for awards of
equity instruments to employees and non-employee directors
based on the grant-date fair value of those awards, estimated
in accordance with the provisions of SFAS 123R. The Company
recognizes these compensation costs on a straight-line basis
over the requisite service period of the award, which is generally
the option vesting term of four years. Under the modified
prospective method, the provisions of SFAS No. 123R apply to all
awards granted or modified after the date of adoption. In addi-
tion, the unrecognized expense of awards not yet vested at the
date of adoption, determined under the original provisions of
SFAS No. 123, “Accounting for Stock-Based Compensation”
(“SFAS No. 123”), are recognized in net income in the periods
after the date of adoption. SFAS No. 123R also requires the
benefits of tax deductions in excess of recognized compensation
expense to be reported as a financing cash flow, rather than as
an operating cash flow as prescribed under the prior accounting
rules. This requirement reduces net operating cash flow and
increases net financing cash flows in periods after adoption.
Total cash flow remains unchanged from what would have been
reported under the prior accounting rules.
Prior to the adoption of SFAS No. 123R, the Company followed
the intrinsic value method to account for its employee stock
option plans and employee stock purchase plan in accordance
with the recognition and measurement principles of Accounting
Principles Board Opinion (“APB”) No. 25, “Accounting for Stock
Issued to Employees” and Related Interpretations (“APB No.
25”), as allowed by SFAS No. 123 and as amended by SFAS No.
148, “Accounting for Stock-Based Compensation – Transition and
Disclosure”. Accordingly, no stock-based employee compensation
C O G N I Z A N T 2 0 0 6 A N N U A L R E P O R T 37
61748 Financials 4/19/07 4:14 PM Page 23

Notes to Consolidated Financial Statements(in thousands, except share and per share data)
Foreign Currency Forward Contract. During July 2004, the
Company entered into a foreign currency forward contract, with
a six-month term and notional amount of $12,500, to sell the
Indian Rupee for United States dollars that was settled in
January 2005. The Company entered into this forward contract
to manage a portion of its foreign currency risk related to Indian
Rupee-denominated asset balances, primarily cash investments,
at our Indian subsidiary, Cognizant India. Movement in the
exchange rate for the Indian Rupee results in foreign currency
gains or losses upon remeasurement of Cognizant India’s finan-
cial statements into its functional currency, the U.S. dollar. The
Company’s objective was to reduce foreign currency exposure to
appreciation or depreciation in the value of the Indian Rupee by
offsetting a portion of such exposure with gains or losses on the
forward contract, referred to above.
The Company accounted for this financial derivative in accor-
dance with SFAS No. 133, “Accounting for Derivative Instruments
and Hedging Activities,” as amended. This foreign currency
contract did not qualify for hedge accounting under SFAS No.
133. Accordingly, the foreign currency forward contract was
marked-to-market and recorded at fair value with unrealized
gains and losses reported along with foreign currency gains or
losses in the caption “other income (expense), net” on the
Company’s consolidated statements of operations and compre-
hensive income. The Company recorded a realized gain/(loss) on
the foreign currency forward contract of $162 and $(989) for the
years ended December 31, 2005 and 2004, respectively.
Use of Estimates. The preparation of financial statements in
accordance with generally accepted accounting principles in
the United States of America requires management to make
estimates and assumptions that affect the reported amounts of
assets and liabilities, including the recoverability of tangible and
intangible assets, disclosure of contingent assets and liabilities
as of the date of the financial statements, and the reported
amounts of revenues and expenses during the reported period.
On an on-going basis, management reevaluates these estimates.
The most significant estimates relate to the recognition of
revenue and profits based on the percentage of completion
method of accounting for certain fixed-bid contracts, the
allowance for doubtful accounts, income taxes and related
deferred tax assets and liabilities, valuation of goodwill and
other long-lived assets, assumptions used in determining the
fair value of stock option awards, contingencies and litigation.
Management bases its estimates on historical experience and
on various other assumptions that are believed to be reasonable
under the circumstances. The actual amounts may vary from
the estimates used in the preparation of the accompanying
consolidated financial statements.
cost was recognized, as all options granted under those plans
had an exercise price equal to the market value of the underlying
common stock on the date of grant and, with respect to the
employee stock purchase plan, the discount did not exceed 15
percent. In accordance with the transitional provisions of SFAS
123R, operating results for 2005 and 2004 have not been restat-
ed. The Company historically reported pro forma results under
the disclosure-only provisions of SFAS No. 123.
In November 2005, the Financial Accounting Standards Board
(“FASB”) issued FASB Staff Position (“FSP”) No. FAS 123(R)-3,
“Transition Election Related to Accounting for Tax Effects of
Share-Based Payment Awards” (“FSP 123R-3”). The Company has
elected to adopt the alternative transition (“short-cut”) method
provided in the FSP 123R-3 for calculating the tax effects of
stock-based compensation pursuant to SFAS 123R. The alterna-
tive transition method includes simplified methods to establish
the beginning balance of the additional paid-in capital pool
(“APIC pool”) related to the tax effects of employee stock-based
compensation and to determine the subsequent impact on the
APIC pool of the tax effects of employee stock-based compensa-
tion awards that are outstanding upon adoption of SFAS 123R.
See Note 10 for additional information relating to the Company’s
stock plans and the adoption of SFAS 123R.
Foreign Currency Translation. The assets and liabilities of the
Company’s subsidiaries other than the Company’s Indian
subsidiary (“Cognizant India”), are translated into U.S. dollars
from local currencies at current exchange rates and revenues
and expenses are translated from local currencies at average
monthly exchange rates. The resulting translation adjustments
are recorded in a separate component of stockholders’ equity.
For Cognizant India, the functional currency is the U.S. dollar,
since its sales are made primarily in the United States, the sales
price is predominantly in U.S. dollars and there is a high volume
of intercompany transactions denominated in U.S. dollars
between Cognizant India and its U.S. affiliates. Non-monetary
assets and liabilities are translated at historical exchange rates,
while monetary assets and liabilities are translated at current
exchange rates. The resulting gain (loss) is included in the
caption “other income (expense), net” on the Company’s
consolidated statements of operations and comprehensive
income. Foreign currency transaction gains/(losses), which are
included in the results of operations, totaled $1,202, $(1,339) and
$73 for the years ended December 31, 2006, 2005 and 2004,
respectively. Gains and losses from balance sheet translation are
included in accumulated other comprehensive income on the
consolidated statements of financial position and represents the
only item included in such caption.
38 C O G N I Z A N T 2 0 0 6 A N N U A L R E P O R T
61748 Financials 4/19/07 4:14 PM Page 24

Notes to Consolidated Financial Statements(in thousands, except share and per share data)
standing for the period. Diluted EPS includes all potential dilutive
common stock in the weighted average shares outstanding.
Reclassifications. Certain prior-year amounts have been
reclassified to conform to the 2006 presentation.
New Accounting Standards
In September 2006, the SEC issued SAB 108, “Considering the
Effects of Prior Year Misstatements when Quantifying
Misstatements in Current Year Financial Statements” (“SAB
108”). SAB 108 provides interpretive guidance on how the effects
of the carryover or reversal of prior year misstatements should
be considered in quantifying a current year misstatement. The
pronouncement prescribes an approach whereby the effect of all
unrecorded identified errors should be considered on all of the
financial statements rather than just either the effect on the
balance sheet or the income statement. The Company adopted
the provisions of SAB 108 as of December 31, 2006. The adop-
tion of SAB 108 did not have a material impact on the Company’s
consolidated financial statements.
On July 13, 2006, the FASB issued Interpretation No. 48,
“Accounting for Uncertainty in Income Taxes — an interpretation
of FASB Statement No. 109” (“FIN 48”), which clarifies the
accounting for uncertainty in tax positions. FIN 48 requires
recognition in the financial statements of the impact of a tax
position, if that position is more likely than not of being sus-
tained on audit, based on the technical merits of the position.
The provisions are effective for the Company beginning in the
first quarter of 2007 with the cumulative effect, if any, of the
change in accounting principle recorded as an adjustment to the
opening balance of retained earnings. The Company is currently
evaluating the impact of adopting FIN 48 on its consolidated
financial statements.
In September 2006, the FASB issued SFAS No. 157, “Fair Value
Measurements” (SFAS No. 157). SFAS No. 157 defines fair value,
establishes a framework for measuring fair value and expands
disclosures about fair value measurements. SFAS No. 157 is
effective for financial statements issued for fiscal years begin-
ning after November 15, 2007 and interim periods within those
fiscal years. The Company is currently evaluating the impact that
SFAS No. 157 will have on its consolidated financial statements.
2. Acquisitions
In September 2006, the Company acquired AimNet Solutions,
Inc. (“AimNet”), a U.S.-based managed infrastructure and profes-
sional services firm for initial net cash consideration of approxi-
mately $14,773 (net of cash acquired of $971, and including
assumed debt of $1,754 and deal fees). The Company completed
this acquisition to strengthen its IT infrastructure management-
capabilities.
Risks and Uncertainties. Principally, all of the Company’s IT
development centers, including a majority of its employees, are
located in India. As a result, the Company may be subject to cer-
tain risks associated with international operations, including risks
associated with foreign currency exchange rate fluctuations and
risks associated with the application and imposition of protective
legislation and regulations relating to import and export or oth-
erwise resulting from foreign policy or the variability of foreign
economic or political conditions. From time to time, the Company
will engage in hedging transactions to mitigate its risks relating
to foreign currency exchange rate fluctuations. Additional risks
associated with international operations include difficulties in
enforcing intellectual property rights, the burdens of complying
with a wide variety of foreign laws, potential geo-political and
other risks associated with terrorist activities and local or cross
border conflicts, potentially adverse tax consequences, tariffs,
quotas and other barriers.
Concentration of Credit Risk. Financial instruments that poten-
tially subject the Company to significant concentrations of credit
risk consist primarily of cash and cash equivalents, time deposits,
investments in short-term securities and trade accounts receiv-
able. The Company maintains its cash and cash equivalents and
short-term investments with high credit quality financial institu-
tions, invests in investment-grade short-term debt securities and
limits the amount of credit exposure to any one commercial
issuer. Trade accounts receivables are dispersed across many
customers operating in different industries; therefore, concentra-
tion of credit risk is limited.
Income Taxes. The Company provides for income taxes utilizing
the asset and liability method of accounting for income taxes.
Under this method, deferred income taxes are recorded to
reflect the tax consequences in future years of differences
between the tax basis of assets and liabilities and their financial
reporting amounts at each balance sheet date, based on enacted
tax laws and statutory tax rates applicable to the periods in
which the differences are expected to affect taxable income. If it
is determined that it is more likely than not that future tax bene-
fits associated with a deferred tax asset will not be realized, a
valuation allowance is provided. The effect on deferred tax
assets and liabilities of a change in the tax rates is recognized
in income in the period that includes the enactment date. Tax
benefits earned on exercise of employee stock options in excess
of compensation charged to income are credited to additional
paid-in capital.
Earnings Per Share (“EPS”). Basic EPS excludes dilution and is
computed by dividing earnings available to common stockhold-
ers by the weighted-average number of common shares out-
C O G N I Z A N T 2 0 0 6 A N N U A L R E P O R T 39
61748 Financials 4/19/07 4:14 PM Page 25

Notes to Consolidated Financial Statements(in thousands, except share and per share data)
September 5, 2006, April 16, 2005 and February 27, 2004,
respectively. The acquisitions in 2006, 2005 and 2004 were not
material to the Company’s operations, financial position or cash
flows.
3. Short-Term Investments
The following is a summary of short-term investments:
The carrying value of our short-term investments as of
December 31, 2006 and 2005 approximated fair value. Realized
gains or losses, if any, on these investments were insignificant
for the years ended December 31, 2006, 2005 and 2004.
Contractual maturities of available-for-sale securities at
December 31, 2006 are as follows: $13,092 in 2007, $2,800 in
2008, $0 in 2009, $4,000 in 2010, $4,050 in 2011 and $319,470
maturing after 2019. The Company’s investments in auction-rate
securities generally have contractual maturities in excess of one
year; however, they provide liquidity to the Company every
ninety days or less when interest rates are reset through a
“Dutch” auction process. The Company invests in investment
grade auction-rate securities and, to date, has not participated
in any failed auctions.
4. Property and Equipment, net
Property and equipment consist of the following:
Company receives final information, including the appraisal and
other analyses. As part of the preliminary allocation of the pur-
chase price, the Company recorded approximately $8,534 of tax
deductible goodwill and $6,750 of intangible assets, principally
customer relationships and developed technology. Amortization
of $496 related to amortizable intangible assets has been
included in depreciation and amortization in the accompanying
consolidated statements of income and comprehensive income
for year ended December 31, 2006. The intangible assets are
being amortized over a weighted average life of 4.6 years.
In April 2005, the Company acquired substantially all the assets
of Fathom Solutions, LLC (“Fathom”), a U.S.-based company
specializing in IT consulting in the telecommunications and
financial services industries, for initial consideration of approxi-
mately $23,300 (including deal fees and consideration for
delivery by sellers of net assets above the contractual target) in
cash and stock. The Company made cash payments of approxi-
mately $18,600 and issued 113,225 shares of Class A common
stock valued at $4,722 related to the acquisition. Additional
purchase price, not to exceed $16,000, payable in 2007, is contin-
gent on Fathom achieving certain financial and operating targets
over the two years ended April 30, 2007 and will be recorded
when the contingency is resolved. The Company completed this
acquisition primarily to strengthen its service capabilities in the
telecommunications industry. In accordance with the provisions
of SFAS No. 142, “Goodwill and Other Intangible Assets,” the
Company has allocated the purchase price to the tangible and
intangible assets and liabilities acquired based on their fair
values, including approximately $9,100 to goodwill and $6,750
to intangible assets, principally customer relationships. The
intangible assets are being amortized over a weighted average
life of 9.8 years.
On February 27, 2004, the Company acquired Ygyan Consulting
Private Ltd. (“Ygyan”), an India-based SAP services provider, for
$1,676. Ygyan was acquired to increase the Company’s SAP
service capabilities.
The Company has accounted for the acquisitions of AimNet,
Fathom and Ygyan as business combinations under the provi-
sions of SFAS No. 141, “Business Combinations”. The operating
results of AimNet, Fathom and Ygyan have been included in the
consolidated financial statements of the Company, effective
Available-for-sale securities:Auction-rate securities $330,275 $219,425Asset-backed securities 2,983 1,869Agency discount notes 1,109 1,954Commercial paper 8,044 797Corporate bonds 1,001 3,018
Total available-for-sale securities 343,412 227,063Time deposits 38,810 –Total short-term investments $382,222 $227,063
December 31,2006 2005
Buildings 30 $ 56,907 $ 20,162Computer equipment and
purchased software 3 96,986 66,685Furniture and equipment 5 – 9 50,042 27,949Land 9,004 9,004Leasehold land 1,880 1,788Capital work-in-progress 36,382 53,827Leasehold improvements Over shorter
of lease termor life of asset 64,492 32,303
Sub-total 315,693 211,718Accumulated depreciation
and amortization (95,539) (64,736)Property and equipment - net $220,154 $ 146,982
EstimatedUseful Life December 31,
(Years) 2006 2005
40 C O G N I Z A N T 2 0 0 6 A N N U A L R E P O R T
information concerning asset and liability valuations.
Accordingly, the allocations are subject to revision when the
In accordance with the provisions of SFAS No. 142, the Company
has made a preliminary allocation of the purchase price to the
tangible and intangible assets and liabilities acquired, pending
the completion of an appraisal, which will provide additional
61748 Financials 4/19/07 4:14 PM Page 26

Notes to Consolidated Financial Statements(in thousands, except share and per share data)
Depreciation and amortization expense related to property and
equipment was $31,503, $19,311 and $14,442, for the years ended
December 31, 2006, 2005 and 2004, respectively.
Leasehold land is leased by the Company from the government
of India with lease terms ranging from 90 to 99 years. Lease
payments are made at the inception of the lease agreement and
amortized over the lease term. Amortization expense of lease-
hold land is immaterial for the periods presented and is included
in depreciation and amortization expense in the Company’s con-
solidated statements of operations and comprehensive income.
5. Goodwill and Intangible Assets, net
Changes in goodwill for the years ended December 31, 2006 and
2005 are as follows:
In 2006, the increase in goodwill relates to the acquisition of
AimNet. In 2005, the increase in goodwill relates to the acquisi-
tion of Fathom. No impairment losses were recognized during
the three years ended December 31, 2006.
Components of intangibles assets are as follows:
Balance beginning of year $ 18,223 $ 9,701Acquisitions 8,534 9,078Cumulative translation adjustments 433 (556)Balance end of year $ 27,190 $ 18,223
2006 2005
All of the intangible assets have finite lives and as such are
subject to amortization. Amortization of intangibles totaled
$2,660 for 2006, $2,089 for 2005 and $2,005 for 2004.
Estimated amortization expenses of the Company’s existing
intangible assets for the next five years are as follows:
Customer relationships $ 24,971 $ 20,823 9.2 yearsDeveloped technology 2,803 48 4.0 yearsOther 1,044 1,044 7.3 years
28,818 21,915Accumulated amortization (8,355) (5,638)Intangible assets, net $ 20,463 $ 16,277
December 31, Weighted2006 2005 Average Life
6. Accrued Expenses and Other Liabilities
Accrued expenses and other liabilities consist of the following:
2007 $ 3,7492008 $ 3,7142009 $ 3,6982010 $ 3,4562011 $ 2,605
Year Amount
Accrued compensation and benefits $ 122,419 $ 77,182Accrued taxes 1,725 3,374Accrued professional fees 12,221 8,806Accrued vacation 23,874 12,012Accrued travel and entertainment 12,177 7,513Other 29,847 13,781Total $ 202,263 $122,668
December 31,2006 2005
7. Employee Benefits
The Company has a 401(k) Savings Plan which allows eligible U.S.
employees of the Company to contribute a percentage of their
compensation into the plan and the Company matches up to
50.0% of the eligible employee’s contribution. The amount
charged to expense for the matching contribution was $3,655,
$1,577 and $1,046 for the years ended December 31, 2006, 2005
and 2004, respectively. The Company recorded an expense of
$5,700 in the year ended December 31, 2006 relating to an oper-
ational failure in the administration of the 401(k) Savings Plan.
Of such amount, approximately $1,400 related to 2006 and is
included in the 2006 matching contribution and approximately
$4,300 related to periods prior to 2006. Certain of the
Company’s employees participate in a defined contribution plan
in the United Kingdom and Ireland sponsored by the Company.
The costs to the Company related to these plans were not mate-
rial to the Company’s results of operations or financial position
for the years presented.
Cognizant India maintains employee benefit plans that cover
substantially all India-based employees. The employees’
provident fund, pension and family pension plans are statutory
defined contribution retirement benefit plans. Under the plans,
employees contribute up to 12% of their base compensation,
which is matched by an equal contribution by Cognizant India.
Contribution expense recognized was $6,265, $3,758 and $2,254
for the years ended December 31, 2006, 2005 and 2004,
respectively.
Cognizant India also maintains a statutory gratuity plan that is a
statutory post-employment benefit plan providing defined lump
sum benefits. Cognizant India makes annual contributions to an
employees’ gratuity fund established with a government-owned
insurance corporation to fund a portion of the estimated obliga-
tion. The Company accounts for the gratuity plan in accordance
with the provisions of EITF 88-1, “Determination of Vested
Benefit Obligation for a Defined Benefit Pension Plan”.
C O G N I Z A N T 2 0 0 6 A N N U A L R E P O R T 41
61748 Financials 4/19/07 4:14 PM Page 27

The provision of income taxes consists for the following compo-
nents for the years ended December 31:At December 31, 2006, Cognizant has estimated net operating
loss carryforwards for U.S. tax purposes of approximately
$97,000. For Federal purposes, these losses have expiration
dates ranging from December 31, 2022 through December 31,
2025. For State purposes, the date of expiration varies but will
generally be less than or equal to the Federal expiration period.
The Company has foreign net operating loss carryforwards of
approximately $13,000, of which approximately $6,300 relates to
pre-acquisition net operating losses. The Company has recorded
a full valuation allowance on the foreign net operating loss carry-
forwards. If tax benefits are recognized through reduction of the
valuation allowance, approximately $1,900 of such benefits will
reduce goodwill.
Cognizant’s Indian subsidiary, Cognizant India, is an export-
oriented company, which, under the Indian Income Tax Act of
1961 is entitled to claim tax holidays for a period of ten consecu-
tive years for each Software Technology Park (“STP”) with
respect to export profits for each STP. Substantially all of the
earnings of Cognizant India are attributable to export profits.
The majority of the Company’s STPs in India are currently enti-
tled to a 100% exemption from Indian income tax. Under current
law, these tax holidays will be completely phased out by March
2009. On March 31, 2006, the tax holiday expired for a second
STP. The incremental Indian taxes related to the taxable STPs
have been incorporated into the Company’s effective income tax
rate for 2006. For the years ended December 31, 2006, 2005
and 2004, the effect of the income tax holiday was to reduce the
overall income tax provision and increase net income by approxi-
mately $51,345, $34,664 and $24,208, respectively, and increase
diluted EPS by $0.34, $0.24 and $0.17, respectively.
United States $ 92,157 $ 59,386 $ 33,688Foreign 185,654 125,886 88,407Total $ 277,811 $ 185,272 $ 122,095
2006 2005 2004
Current:Federal and state $ 48,256 $ 26,218 $ 13,829Foreign 14,121 15,437 9,100
Total current 62,377 41,655 22,929Deferred:
Federal and state (14,387) (15,059) (338)Foreign (2,974) (7,590) (739)
Total deferred (17,361) (22,649) (1,077)Total provision $ 45,016 $ 19,006 $ 21,852
2006 2005 2004
Tax expense, atU.S. Federalstatutory rate $97,234 35.0 $64,845 35.0 $ 42,733 35.0
State and localincome taxes, netof Federal benefit 5,048 1.8 3,262 1.8 2,146 1.8
Rate differentialon foreignearnings (55,465) (20.0) (36,964) (19.9) (21,989)(18.1)
Repatriation ofpreviouslyundistributedIndian earnings – – (12,411) (6.7) – –
Other (1,801) (0.6) 274 0.1 (1,038) (0.8)Total income taxes $45,016 16.2 $19,006 10.3 $ 21,852 17.9
2006 % 2005 % 2004 %
A reconciliation between the Company’s effective income tax
rate and the U.S. Federal statutory rate is as follows:
The Company’s deferred income tax assets and liabilities are
comprised of the following at December 31:
Notes to Consolidated Financial Statements(in thousands, except share and per share data)
Accordingly, the Company’s liability for the gratuity plan reflects
the undiscounted benefit obligation payable as of the balance
sheet date which was based upon the employees’ salary and
years of service. As of December 31, 2006 and 2005, the amount
accrued under the gratuity plan was $8,552 and $7,535, respec-
tively. Expense recognized by the Company was $4,548, $3,477
and $2,752 for the years ended December 31, 2006, 2005 and
2004, respectively.
8. Income Taxes
Income before provision for income taxes shown below is based
on the geographic location to which such income is attributed
for years ended December 31:
Deferred income tax assets:Net operating losses $ 43,905 $ 58,010Revenue recognition 184 –Compensation and benefits 23,637 15,761Stock-based compensation 5,283 –Depreciation and amortization 1,821 332Other 2,240 1,466
77,070 75,569Less valuation allowance 3,989 3,016Deferred tax assets, net 73,081 72,553
Deferred income tax liabilities:Undistributed Indian income 6,080 6,103Revenue recognition – 1,732Other 4,720 4,719Deferred income tax liabilities 10,800 12,554
Net deferred income tax asset $ 62,281 $ 59,999
2006 2005
42 C O G N I Z A N T 2 0 0 6 A N N U A L R E P O R T
61748 Financials 4/19/07 4:14 PM Page 28

Notes to Consolidated Financial Statements(in thousands, except share and per share data)
Prior to January 1, 2002, it was the Company’s intent to repatri-
ate all accumulated earnings from India to the United States.
Accordingly, Cognizant provided deferred income taxes on such
pre–2002 undistributed earnings. During the first quarter of
2002, Cognizant made a strategic decision to pursue an interna-
tional strategy that includes expanded infrastructure invest-
ments in India and geographic expansion in Europe and Asia.
As a component of this strategy, Cognizant intends to use 2002
and future Indian earnings to expand operations outside of the
United States instead of repatriating these earnings to the
United States. Accordingly, effective January 1, 2002, pursuant
to APB No. 23, Cognizant no longer accrues incremental U.S.
taxes on all Indian earnings recognized in 2002 and subsequent
periods as these earnings are considered to be indefinitely rein-
vested outside of the United States. As of December 31, 2006,
the amount of unrepatriated Indian earnings and total foreign
earnings, including unrepatriated Indian earnings, upon which
no incremental U.S. taxes have been recorded is approximately
$434,841 and $457,580, respectively. If such earnings are
repatriated in the future, or no longer deemed to be indefinitely
reinvested, Cognizant will accrue the applicable amount of taxes
associated with such earnings. Due to the various methods by
which such earnings could be repatriated in the future, it is not
currently practicable to determine the amount of applicable
taxes that would result from such repatriation.
On October 22, 2004, the American Jobs Creation Act of 2004
(the “Act”) was enacted into law. The Act created a temporary
incentive for U.S. corporations to repatriate accumulated income
earned abroad by providing an 85% dividends received deduc-
tion for certain dividends from controlled foreign corporations.
Under the provisions of the Act, in December 2005, the
Company repatriated $60,000 of undistributed Indian earnings
that were not considered permanently reinvested under APB No.
23 and recorded a net income tax benefit of $12,411, consisting of
a reversal of deferred income tax liabilities of $22,939 partially
offset by current U.S. and Indian income taxes of $10,528. The
U.S. income tax benefit was attributed to the fact that U.S. taxes
due under the Act were substantially less than the amount the
Company previously accrued, based on the U.S. federal statutory
rate of 35%, on such undistributed Indian earnings. The repatria-
tion reduced the Company’s effective tax rate for the year ended
December 31, 2005 from 17.0% to 10.3% and increased basic and
diluted EPS by $0.09 and $0.08, respectively. As of December 31,
2006, the Company has an accrual of approximately $6,100
on remaining pre-2002 undistributed Indian earnings that the
Company intends to repatriate in the future.
The Company will continue to assert permanent reinvestment
of all Indian earnings after December 31, 2001. Deferred U.S.
income taxes on unremitted earnings from other foreign entities
have not been provided for as such earnings are deemed to be
permanently reinvested.
9. Capital Stock
On June 13, 2006, the Company’s stockholders approved amend-
ments to: (1) the Restated Certificate of Incorporation to increase
the maximum number of authorized shares of the Company’s
capital stock, all classes, from 340,000,000 shares, consisting
of (i) 325,000,000 shares of Class A common stock, and (ii)
15,000,000 shares of preferred stock, to 515,000,000 shares,
consisting of (x) 500,000,000 shares of Class A common stock,
and (y) 15,000,000 shares of preferred stock and (2) the 1999
Incentive Compensation Plan, as amended (the “Incentive Plan”)
and the Key Employees’ Stock Option Plan, as amended (the
“Key Employees Plan”) to (i) increase the maximum number of
shares of Class A common stock reserved for issuance under the
Incentive Plan from 37,500,000 to 38,261,580 shares and there-
by reserve an additional 761,580 shares of Class A common
stock for issuance and (ii) decrease the maximum number of
shares of Class A common stock reserved for issuance under the
Key Employees Plan by 761,580 from 8,385,000 to 7,623,420
shares.
As a result of the aforementioned amendments to the Incentive
Plan and Key Employees Plan, the total number of shares
available for issuance under the Company’s stock-based
compensation plans remains unchanged and there are no more
shares available for future grants under the Key Employees Plan.
10. Employee Stock-Based Compensation Plans
The Company has three stock option plans (“Option Plans”):
• The Incentive Plan provides for grants up to 38,261,580 shares
to eligible employees and non-employee directors. All options
granted under the Incentive Plan are exercisable into one (1)
share of the Company’s Class A common stock, have a life of
ten years, vest proportionally over four years, unless specified
otherwise, and have an exercise price equal to the fair market
value of the common stock on the date of grant. Stock-based
compensation expense for Incentive Plan grants is recognized
on a straight-line basis over the requisite service period.
• The Key Employees Plan provides for the grant of up to
7,623,420 stock options (each option exercisable into one (1)
share of the Company’s Class A common stock) to eligible
employees. Options granted under this plan may not be grant-
C O G N I Z A N T 2 0 0 6 A N N U A L R E P O R T 43
61748 Financials 4/19/07 4:14 PM Page 29

A summary of changes in the Option Plans for the year ended
December 31, 2006 is as follows:
Notes to Consolidated Financial Statements(in thousands, except share and per share data)
ed at an exercise price less than the fair market value of the
underlying shares on the date of grant. These options have a
life of ten years, vest proportionally over four years and have
an exercise price equal to the fair market value of the common
stock on the grant date. Stock-based compensation expense for
Key Employees Plan grants is recognized on a straight-line
basis over the requisite service period. Effective June 13, 2006,
there are no shares available for future grant and as such no
further grants will be made under the Key Employees Plan.
• The Non-Employee Directors’ Stock Option Plan (the “Non-
Employee Directors’ Plan”) provides for the grant of up to
858,000 stock options (each option exercisable into one (1)
share of the Company’s Class A common stock) to eligible
directors. Options granted under this plan may not be granted
at an exercise price less than fair market value of the underly-
ing shares on the date of grant. These options have a life of ten
years, vest proportionally over two years and have an exercise
price equal to the fair market value of the common stock on
the grant date. Stock-based compensation expense for Non-
Employee Directors’ Plan grants is recognized on a straight-line
basis over the requisite service period.
In addition to the Option Plans, the Company maintains the
2004 Employee Stock Purchase Plan (the “Purchase Plan”) that
provides for the issuance of up to 3,000,000 shares of Class A
common stock to eligible employees. The Purchase Plan provides
for eligible employees to purchase whole shares of Class A com-
mon stock at a price of 90% of the lesser of: (a) the fair market
value of a share of Class A common stock on the first date of the
purchase period or (b) the fair market value of a share of Class
A common stock on the last date of the purchase period. Stock-
based compensation expense for the Purchase Plan is recog-
nized over the vesting period of three months on a straight-line
basis. No employee can purchase more than $25 worth of stock
annually, and no stock can be purchased by any person which
would result in the purchaser owning more than five percent or
more of the total combined voting power or value of all classes
of stock of the Company.
The Company currently utilizes authorized, available shares to
satisfy stock option exercises under its Option Plans and
issuances under its Purchase Plan. During the year ended
December 31, 2006, stock-based compensation expense and
The effect of adopting SFAS No. 123R on selected reported items
as compared to amounts that would have been reported under
APB No. 25, including income tax benefits of $3,915 after
considering changes to the geographic mix of taxable income
attributed to the adoption of SFAS No. 123R, is presented in the
following table:
related income tax benefits reflected in the Company’s operating
results were $29,934, and $5,943, respectively. The allocation of
stock-based compensation expense between cost of revenues
and selling, general and administrative expenses was as follows:
44 C O G N I Z A N T 2 0 0 6 A N N U A L R E P O R T
Cost of revenues $ 13,400Selling, general and administrative expenses 16,534Total stock-based compensation expense $ 29,934
For theYear Ended
December 31,2006
Income before provision for income taxes $ (29,934)Net income $ (26,019)Net cash provided by operating activities $ (33,249)Net cash provided by financing activities $ 33,249Basic earnings per share $ (0.18)Diluted earnings per share $ (0.17)
For theYear Ended
December 31,2006
(Decrease) Increase
Outstanding atJanuary 1, 2006 15,557,055 $ 13.29
Granted 2,072,650 $ 63.67Exercised (2,800,689) $ 11.06Cancelled (377,783) $ 28.82Expired (3,875) $ 34.78Outstanding atDecember 31, 2006 14,447,358 $ 20.55 6.12 $ 816,842
Vested andexpected to vest atDecember 31, 2006 13,721,277 $ 19.22 6.00 $ 795,894
Exercisable atDecember 31, 2006 9,172,363 $ 9.84 4.98 $ 617,458
WeightedWeighted Average AggregateAverage Remaining Intrinsic
Number of Exercise Price Life ValueOptions (in dollars) (in years) (in thousands)
61748 Financials 4/19/07 4:14 PM Page 30

Notes to Consolidated Financial Statements(in thousands, except share and per share data)
During August 2006, the Company granted 500,000 option
shares under the 1999 Incentive Plan to four executive officers.
In December 2006, the Company recorded a net expense of
$293 relating to the modification of stock option awards of a
non-employee director. As of December 31, 2006, the total
remaining unrecognized stock-based compensation cost related
to non-vested stock options expected to vest amounted to
$56,233, which will be amortized over the weighted-average
remaining requisite service period of 1.97 years. The total
intrinsic value of options exercised was $156,580, $186,118 and
$119,014 for the years ended December 31, 2006, 2005 and
2004, respectively. As of December 31, 2006, the Company has
1,573,123 and 2,030,038 shares available for future stock option
grants and issuances under the Option Plans and Purchase Plan,
respectively.
The following table illustrates the effect on net income and
earnings per share if the Company had applied the fair value
recognition provisions of SFAS No. 123 to stock-based employee
compensation for years ended December 31, 2005 and 2004.
C O G N I Z A N T 2 0 0 6 A N N U A L R E P O R T 45
The fair value of each stock option was estimated on the date of
grant using a Black-Scholes option-pricing model. For the year
ended December 31, 2006, expected volatility was calculated
using implied market volatilities. In addition, the expected term,
which represents the period of time, measured from the grant
date, that vested options are expected to be outstanding, was
derived by incorporating exercise and post-vest termination
Net income, as reported $ 166,266 $ 100,243Add: Stock-based employee
compensation expense included inreported net earnings, net ofrelated tax effects – –
Deduct: Total stock-based employeecompensation determined using thefair value-based method for all awards,net of related tax effects 17,990 15,193
Pro forma net income $ 148,276 $ 85,050
Earning per share:Basic – as reported $ 1.22 $ 0.77Basic – pro forma $ 1.09 $ 0.65Diluted – as reported $ 1.13 $ 0.70Diluted – pro forma $ 1.01 $ 0.60
2005 2004
Dividend yield 0 % 0% 0%Weighted average volatility factor:
Option plans 36.05 % 44.20% 46.00%Purchase plan 34.70 % 43.77% 46.00%
Weighted average expected life (in years):Option plans 5.23 4.00 4.00Purchase plan 0.25 0.25 0.25
Weighted average risk-free interest rate:Option plans 4.79 % 3.77% 3.11%Purchase plan 4.71 % 2.81% 1.26%
Weighted average fair value:Option plans $ 25.87 $ 16.52 $ 10.06Purchase plan $ 10.79 $ 8.51 $ 5.03
For the Year EndedDecember 31,
2006 2005 2004
assumptions, based on historical data, in a Monte Carlo simula-
tion model. For years ended December 31, 2005 and 2004,
expected volatility was based on historical volatility of the
Company’s Class A common stock and the expected term was
based on historical employee exercise behavior. The risk-free rate
is derived from the U.S. Treasury yield curve in effect at the time
of grant. The Black-Scholes model also incorporates forfeiture
assumptions based on an analysis of historical data. The
Company does not pay dividends.
The fair values of option grants, including the Purchase Plan,
were estimated at the date of grant with the following
assumptions:
During the year ended December 31, 2006, the Company issued
365,827 shares of Class A common stock under the Purchase
Plan with a total vested fair value of approximately $3,946.
61748 Financials 4/19/07 4:14 PM Page 31
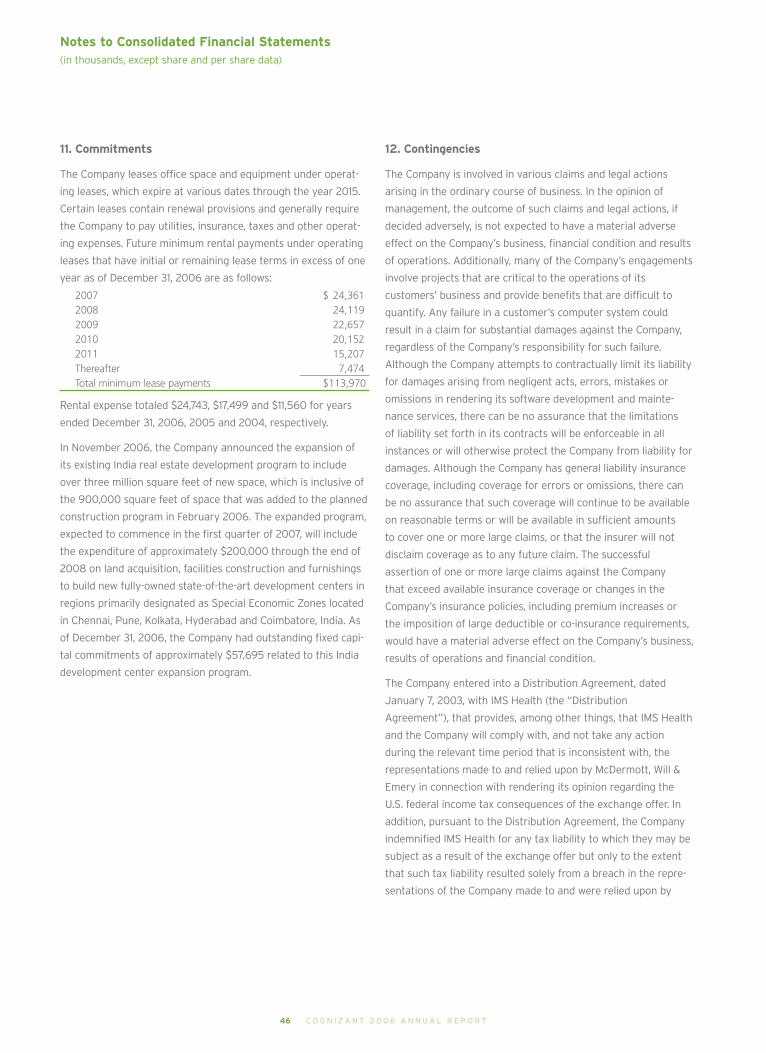
Notes to Consolidated Financial Statements(in thousands, except share and per share data)
46 C O G N I Z A N T 2 0 0 6 A N N U A L R E P O R T
12. Contingencies
The Company is involved in various claims and legal actions
arising in the ordinary course of business. In the opinion of
management, the outcome of such claims and legal actions, if
decided adversely, is not expected to have a material adverse
effect on the Company’s business, financial condition and results
of operations. Additionally, many of the Company’s engagements
involve projects that are critical to the operations of its
customers’ business and provide benefits that are difficult to
quantify. Any failure in a customer’s computer system could
result in a claim for substantial damages against the Company,
regardless of the Company’s responsibility for such failure.
Although the Company attempts to contractually limit its liability
for damages arising from negligent acts, errors, mistakes or
omissions in rendering its software development and mainte-
nance services, there can be no assurance that the limitations
of liability set forth in its contracts will be enforceable in all
instances or will otherwise protect the Company from liability for
damages. Although the Company has general liability insurance
coverage, including coverage for errors or omissions, there can
be no assurance that such coverage will continue to be available
on reasonable terms or will be available in sufficient amounts
to cover one or more large claims, or that the insurer will not
disclaim coverage as to any future claim. The successful
assertion of one or more large claims against the Company
that exceed available insurance coverage or changes in the
Company’s insurance policies, including premium increases or
the imposition of large deductible or co-insurance requirements,
would have a material adverse effect on the Company’s business,
results of operations and financial condition.
The Company entered into a Distribution Agreement, dated
January 7, 2003, with IMS Health (the “Distribution
Agreement”), that provides, among other things, that IMS Health
and the Company will comply with, and not take any action
during the relevant time period that is inconsistent with, the
representations made to and relied upon by McDermott, Will &
Emery in connection with rendering its opinion regarding the
U.S. federal income tax consequences of the exchange offer. In
addition, pursuant to the Distribution Agreement, the Company
indemnified IMS Health for any tax liability to which they may be
subject as a result of the exchange offer but only to the extent
that such tax liability resulted solely from a breach in the repre-
sentations of the Company made to and were relied upon by
2007 $ 24,3612008 24,1192009 22,6572010 20,1522011 15,207Thereafter 7,474Total minimum lease payments $113,970
Rental expense totaled $24,743, $17,499 and $11,560 for years
ended December 31, 2006, 2005 and 2004, respectively.
In November 2006, the Company announced the expansion of
its existing India real estate development program to include
over three million square feet of new space, which is inclusive of
the 900,000 square feet of space that was added to the planned
construction program in February 2006. The expanded program,
expected to commence in the first quarter of 2007, will include
the expenditure of approximately $200,000 through the end of
2008 on land acquisition, facilities construction and furnishings
to build new fully-owned state-of-the-art development centers in
regions primarily designated as Special Economic Zones located
in Chennai, Pune, Kolkata, Hyderabad and Coimbatore, India. As
of December 31, 2006, the Company had outstanding fixed capi-
tal commitments of approximately $57,695 related to this India
development center expansion program.
11. Commitments
The Company leases office space and equipment under operat-
ing leases, which expire at various dates through the year 2015.
Certain leases contain renewal provisions and generally require
the Company to pay utilities, insurance, taxes and other operat-
ing expenses. Future minimum rental payments under operating
leases that have initial or remaining lease terms in excess of one
year as of December 31, 2006 are as follows:
61748 Financials 4/19/07 4:14 PM Page 32
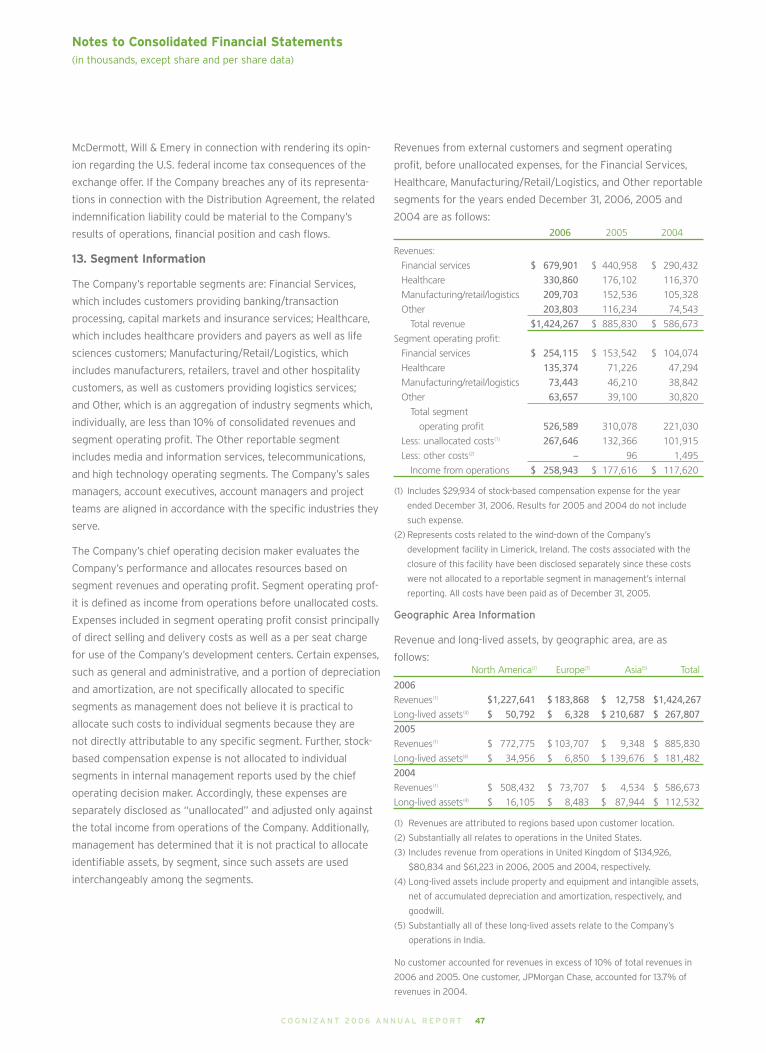
Notes to Consolidated Financial Statements(in thousands, except share and per share data)
Revenues:
Financial services $ 679,901 $ 440,958 $ 290,432
Healthcare 330,860 176,102 116,370
Manufacturing/retail/logistics 209,703 152,536 105,328
Other 203,803 116,234 74,543
Total revenue $1,424,267 $ 885,830 $ 586,673
Segment operating profit:
Financial services $ 254,115 $ 153,542 $ 104,074
Healthcare 135,374 71,226 47,294
Manufacturing/retail/logistics 73,443 46,210 38,842
Other 63,657 39,100 30,820
Total segment
operating profit 526,589 310,078 221,030
Less: unallocated costs(1) 267,646 132,366 101,915
Less: other costs(2) – 96 1,495
Income from operations $ 258,943 $ 177,616 $ 117,620
2006 2005 2004
(1) Includes $29,934 of stock-based compensation expense for the year
ended December 31, 2006. Results for 2005 and 2004 do not include
such expense.
(2) Represents costs related to the wind-down of the Company’s
development facility in Limerick, Ireland. The costs associated with the
closure of this facility have been disclosed separately since these costs
were not allocated to a reportable segment in management’s internal
reporting. All costs have been paid as of December 31, 2005.
C O G N I Z A N T 2 0 0 6 A N N U A L R E P O R T 47
McDermott, Will & Emery in connection with rendering its opin-
ion regarding the U.S. federal income tax consequences of the
exchange offer. If the Company breaches any of its representa-
tions in connection with the Distribution Agreement, the related
indemnification liability could be material to the Company’s
results of operations, financial position and cash flows.
13. Segment Information
The Company’s reportable segments are: Financial Services,
which includes customers providing banking/transaction
processing, capital markets and insurance services; Healthcare,
which includes healthcare providers and payers as well as life
sciences customers; Manufacturing/Retail/Logistics, which
includes manufacturers, retailers, travel and other hospitality
customers, as well as customers providing logistics services;
and Other, which is an aggregation of industry segments which,
individually, are less than 10% of consolidated revenues and
segment operating profit. The Other reportable segment
includes media and information services, telecommunications,
and high technology operating segments. The Company’s sales
managers, account executives, account managers and project
teams are aligned in accordance with the specific industries they
serve.
The Company’s chief operating decision maker evaluates the
Company’s performance and allocates resources based on
segment revenues and operating profit. Segment operating prof-
it is defined as income from operations before unallocated costs.
Expenses included in segment operating profit consist principally
of direct selling and delivery costs as well as a per seat charge
for use of the Company’s development centers. Certain expenses,
such as general and administrative, and a portion of depreciation
and amortization, are not specifically allocated to specific
segments as management does not believe it is practical to
allocate such costs to individual segments because they are
not directly attributable to any specific segment. Further, stock-
based compensation expense is not allocated to individual
segments in internal management reports used by the chief
operating decision maker. Accordingly, these expenses are
separately disclosed as “unallocated” and adjusted only against
the total income from operations of the Company. Additionally,
management has determined that it is not practical to allocate
identifiable assets, by segment, since such assets are used
interchangeably among the segments.
Revenues from external customers and segment operating
profit, before unallocated expenses, for the Financial Services,
Healthcare, Manufacturing/Retail/Logistics, and Other reportable
segments for the years ended December 31, 2006, 2005 and
2004 are as follows:
Geographic Area Information
Revenue and long-lived assets, by geographic area, are as
follows:
2006Revenues(1) $1,227,641 $ 183,868 $ 12,758 $1,424,267Long-lived assets(4) $ 50,792 $ 6,328 $ 210,687 $ 267,8072005Revenues(1) $ 772,775 $ 103,707 $ 9,348 $ 885,830
Long-lived assets(4) $ 34,956 $ 6,850 $ 139,676 $ 181,482
2004Revenues(1) $ 508,432 $ 73,707 $ 4,534 $ 586,673
Long-lived assets(4) $ 16,105 $ 8,483 $ 87,944 $ 112,532
North America(2) Europe(3) Asia(5) Total
(1) Revenues are attributed to regions based upon customer location.
(2) Substantially all relates to operations in the United States.
(3) Includes revenue from operations in United Kingdom of $134,926,
$80,834 and $61,223 in 2006, 2005 and 2004, respectively.
(4) Long-lived assets include property and equipment and intangible assets,
net of accumulated depreciation and amortization, respectively, and
goodwill.
(5) Substantially all of these long-lived assets relate to the Company’s
operations in India.
No customer accounted for revenues in excess of 10% of total revenues in
2006 and 2005. One customer, JPMorgan Chase, accounted for 13.7% of
revenues in 2004.
61748 Financials 4/19/07 4:14 PM Page 33

48 C O G N I Z A N T 2 0 0 6 A N N U A L R E P O R T
14. Quarterly Financial Data (Unaudited)
Summarized quarterly results for the two years ended December
31, 2006 are as follows:
Operating revenue $285,479 $336,836 $377,522 $424,430 $1,424,267
Income from
operations (1) $ 53,156 $ 60,671 $ 68,764 $ 76,352 $ 258,943
Net income(1) $ 47,164 $ 55,071 $ 61,027 $ 69,533 $ 232,795
Basic EPS(1) $ 0.34 $ 0.39 $ 0.43 $ 0.49 $ 1.65
Diluted EPS(1) $ 0.32 $ 0.37 $ 0.40 $ 0.46 $ 1.55
Three Months Ended
2006 March 31 June 30 September 30 December 31 Full Year
(1) Includes the effect of the adoption of SFAS 123R. For additional
information, refer to Note 10.
(2) EPS for each quarter is computed using the weighted-average number
of shares outstanding during that quarter, while EPS for the year is
computed using the weighted-average number of shares outstanding
during the year. Thus, the sum of the EPS for each of the four quarters
may not equal the EPS for the year.
(3) Includes one-time tax benefit of $12,411, or $0.09 per basic EPS and
$0.08 per diluted EPS, related to the repatriation of $60,000 of Indian
earnings under the Act. For additional information, refer to Note 8.
Operating revenue $181,681 $211,711 $ 235,536 $256,902 $885,830
Income from
operations $ 37,187 $ 42,368 $ 47,021 $ 51,040 $177,616
Net income $ 31,978 $ 36,032 $ 40,583 $ 57,673(3) $166,266(3)
Basic EPS $ 0.24 $ 0.27 $ 0.30 $ 0.42(3) $ 1.22(2)(3)
Diluted EPS $ 0.22 $ 0.25 $ 0.28 $ 0.39(3) $ 1.13(2)(3)
Three Months Ended
2005 March 31 June 30 September 30 December 31 Full Year
Notes to Consolidated Financial Statements(in thousands, except share and per share data)
61748 Financials 4/19/07 4:14 PM Page 34

Consolidated Statement of Operations Data:Revenues $1,424,267 $ 885,830 $ 586,673 $ 365,656 $ 208,657Revenues - related party – – – 2,575 20,429
Total revenues 1,424,267 885,830 586,673 368,231 229,086Cost of revenues (exclusive of depreciation and amortization
expense shown separately below) 787,923 479,915 319,810 199,724 122,701Selling, general and administrative expenses 343,238 206,899 132,796 84,259 53,345Depreciation and amortization expense 34,163 21,400 16,447 11,936 7,842Income from operations 258,943 177,616 117,620 72,312 45,198Other income (expense), net:
Interest income 17,615 8,982 4,389 2,128 1,808Split-off costs – – – (2,010) (1,680)Other income (expense) – net 1,253 (1,326) 86 (199) (235)
Total other income (expense), net 18,868 7,656 4,475 (81) (107)Income before provision for income taxes 277,811 185,272 122,095 72,231 45,091Provision for income taxes 45,016 19,006 21,852 14,866 10,529Net income $ 232,795 $ 166,266 $ 100,243 $ 57,365 $ 34,562Basic earnings per share $ 1.65 $ 1.22 $ 0.77 $ 0.46 $ 0.29Diluted earnings per share $ 1.55 $ 1.13 $ 0.70 $ 0.42 $ 0.27Weighted average number of common shares outstanding – Basic 140,858 136,494 130,990 125,011 118,479Weighted average number of common shares outstanding – Diluted 150,562 146,895 142,556 135,814 127,387Consolidated Statement of Financial Position Data:Cash and cash equivalents $ 265,937 $ 196,938 $ 199,296 $ 144,371 $ 69,111Working capital 790,888 509,628 340,189 220,873 135,121Total assets 1,325,981 869,893 572,745 365,300 231,903Stockholders’ equity 1,073,499 714,145 453,529 274,070 165,481
The following table sets forth our selected consolidated historical financial data as of the dates and for the periods indicated. Our
selected consolidated financial data set forth below as of December 31, 2006 and 2005 and for each of the three years in the period
ended December 31, 2006 has been derived from the audited financial statements included elsewhere herein. Our selected consoli-
dated financial data set forth below as of December 31, 2004, 2003 and 2002 and for each of the years ended December 31, 2003
and 2002 are derived from the audited financial statements not included elsewhere herein. Our selected consolidated financial
information for 2006, 2005 and 2004 should be read in conjunction with the Consolidated Financial Statements and the Notes,
and Management’s Discussion and Analysis of Financial Condition and Results of Operations which are included elsewhere in this
Annual Report.
Year Ended December 31,
2006 (1) 2005(2) 2004 2003 2002
(in thousands, except per share data)
(1) Includes the impact of our adoption of SFAS No. 123R effective January 1, 2006. For additional information, refer to Note 10 (Employee Stock-Based
Compensation Plans) to our consolidated financial statements which are included elsewhere herein.
(2) For the year ended December 31, 2005, our consolidated statement of operations data includes the reduction of income tax expense (one-time income tax
benefit) of $12,411, $0.09 per basic earnings per share and $0.08 per diluted earnings per share related to the repatriation of $60,000 of Indian earnings
pursuant to the American Jobs Creation Act of 2004.
Selected Consolidated Financial Data
C O G N I Z A N T 2 0 0 6 A N N U A L R E P O R T 49
61748 Financials 4/19/07 4:14 PM Page 35

50 C O G N I Z A N T 2 0 0 6 A N N U A L R E P O R T
Performance Graph
The following graph compares the cumulative total stockholder return on our Class A Common Stock with the cumulative total
return of companies in the NASDAQ 100 Index, S&P MidCap 400 Index, S&P 500 Index and a Peer Group Index(1) (capitalization
weighted) for the five years ended December 31, 2006. We were added to the S&P 500 Index after the close of trading on November
16, 2006. Accordingly, we are including both the S&P MidCap 400 Index, which we used as our equity market index for the fiscal
year ended December 31, 2005, and the S&P 500 Index. The graph assumes $100 investment on December 31, 2001 in our Class A
Common Stock, the NASDAQ 100 Index, the S&P MidCap 400 Index, the S&P 500 Index and the Peer Group Index(1) (capitalization
weighted) and assumes reinvestment of all dividends. The stock performance shown on the graph below is not indicative of future
price performance.
Cognizant Technology Solutions 100 176.26 334.11 619.77 736.02 1129.72S&P Midcap 400 Index 100 85.49 115.94 135.05 152.00 167.69S&P 500 Index 100 77.90 100.25 111.15 116.61 135.03NASDAQ 100 100 62.42 93.08 102.79 104.32 111.40Peer Group(1) 100 87.33 132.19 166.67 182.11 243.71
Base Years Ending
Period
Company/Index 12/31/01 12/31/02 12/31/03 12/31/04 12/31/05 12/31/06
(1) We have constructed a Peer Group Index of other information technology consulting firms consisting of Accenture Ltd., Computer Horizons Corp., Computer
Task Group, Inc., Covansys Corporation, Diamond Cluster International, Inc., iGate Corp., Infosys Technologies Ltd., Keane, Inc., Sapient Corp., Satyam Computer
Services Ltd., Syntel, Inc. and Wipro Ltd. We believe that these companies most closely resemble our business mix and that their performance is representative of
our industry.
$1,200
$1,100
$1,000
$900
$800
$700
$600
$500
$400
$300
$200
$100
$0
Comparison of Cumulative Total Return
Comparison of Five Year Cumulative Return Among Cognizant, the NASDAQ 100 Index, the S&P MidCap 400 Index, the S&P 500
Index and a Peer Group Index(1) (Capitalization Weighted)
12/31/01 12/31/02 12/31/03 12/31/04 12/31/05 12/31/06
••
•
••
•
61748 Financials 4/19/07 4:14 PM Page 36
Cognizant Technology Solutions (NASDAQ:CTSH) is a leading provider of informationtechnology and business process out-sourcing services, with a sharp focus ondelivering information technology-enabledsolutions that generate ever-increasingbusiness value to our clients. We view eachclient relationship as a true partnership –our unique on-site/offshore model allowsour teams to be aligned with a client’sorganization. Together, we strive to achievea shared vision of performance that yieldstangible returns in terms of innovation,growth and increased efficiencies.
From its founding, Cognizantwas built with a global mindset.Today, this heritage has providedCognizant with a significant marketadvantage. Because customerssee globalization as a key elementfor their future success, theyseek partners who can help themsucceed in this journey. Cognizantis a uniquely qualified partner forthese organizations.
Corporate Information
Transfer AgentAmerican Stock Transfer & Trust Co.59 Maiden LaneNew York, NY 100381.800.937.5449
Independent Registered PublicAccounting FirmPricewaterhouseCoopers LLP400 Campus DriveFlorham Park, NJ 07932
Form 10-KThe Company has filed its Annual Reporton Form 10-K with the Securities andExchange Commission. Many of the SEC’s10-K information requirements aresatisfied by this 2006 Annual Report toStockholders. However, a copy of the Form10-K is available without charge uponrequest by contacting Investor Relationsat the address or phone number listedbelow.
Common Stock InformationThe Company’s Class A common stock(CTSH) is listed on the Nasdaq NationalMarket.
Trading for the Company’s Class Acommon stock began June 19, 1998. Asof March 31, 2007, there were approxi-mately 226 holders of record of theCompany’s Class A common stock and42,475 beneficial holders of theCompany’s Class A common stock.
The Company has never paid dividends onits Class A common stock and does notanticipate paying any cash dividends inthe foreseeable future. The following tablesets forth the high and low sales price forthe Company’s Class A common stock forthe calendar periods indicated.
Executive OfficesGlenpointe Centre West500 Frank W. Burr Blvd.Teaneck, NJ 07666Phone: 201.801.0233Fax: 201.801.0243
Annual MeetingThe Company’s annual meetingfor stockholders will be held at9:30 am on June 7, 2007 atthe Company’s headquarters,Glenpointe Centre West,500 Frank W. Burr Blvd.,Teaneck, New Jersey 07666.
Legal CounselMorgan, Lewis and Bockius, LLP502 Carnegie CenterPrinceton, NJ 08540
InternetAdditional company information isavailable on the World Wide Web:http://www.cognizant.com.
Investor RelationsRequests for financial informationshould be sent to:Gordon J. CoburnChief Financial and Operating OfficerCognizant Technology SolutionsGlenpointe Centre West500 Frank W. Burr Blvd.Teaneck, NJ 07666Phone: 201.801.0233
Fiscal 2006 High Low1st Quarter $ 60.16 $ 49.202nd Quarter $ 69.01 $ 56.883rd Quarter $ 75.06 $ 61.054th Quarter $ 82.21 $ 72.63
Fiscal 2005 High Low1st Quarter $ 48.62 $ 35.862nd Quarter $ 50.17 $ 39.943rd Quarter $ 50.05 $ 44.004th Quarter $ 52.25 $ 43.00
Directors
John E. Klein (1) (2) (3)
Chairman of the BoardCognizant,President andChief Executive OfficerPolarex, Inc.
Lakshmi NarayananVice ChairmanCognizant
Robert W. Howe (1) (2) (3)
ChairmanADS Financial Services Solutions
Robert E. Weissman (1) (3)
ChairmanShelburne Investments
Thomas M. Wendel (2) (3)
Former Chief Executive OfficerBridge Information Systems
Francisco D’SouzaPresident andChief Executive OfficerCognizant
Board Committees:
(1) Compensation Committee
(2) Audit Committee
(3) Nominating and Corporate
Governance Committee
Executive Officers
Lakshmi NarayananVice Chairman
Francisco D’SouzaPresident andChief Executive Officer
Gordon J. CoburnChief Financial andOperating Officer,Secretary and Treasurer
Ramakrishnan ChandrasekaranPresident and Managing Director,Global Delivery
Rajeev MehtaChief Operating Officer,Global Client Services
galp
erin
des
ign
, in
c., n
yc
61748 Covers 4/19/07 2:14 PM Page 2

Partnering with clients: delivering on the vision.
C O G N I Z A N T
2 0 0 6
A N N U A L
R E P O R T
World Headquarters
Glenpointe Centre West
500 Frank W. Burr Blvd.
Teaneck, New Jersey 07666
phone: 201.801.0233
fax: 201.801.0243
toll free: 888.937.3277
www.cognizant.com
61748 Covers 4/19/07 2:14 PM Page 1


![DELIVERING DIAMOND RESULTS -- THE PROCESS BEHIND HOW SQUARE 2 MARKETING RETAINS 90%+ OF THEIR CLIENTS [INBOUND 2014]](https://img.dokumen.tips/doc/110x75/55d56cdcbb61eb750b8b4624/delivering-diamond-results-the-process-behind-how-square-2-marketing-retains.jpg)


