Embed Size (px)
Citation preview

Partitioning of phenotypic covariance among life-
history traits in the great tit Parus major
B.C. Sheldon1*, R.A. Pettifor2, W.J. Browne3,4, J. Rasbash3 & R.H. McCleery1
1. Edward Grey Institute, Department of Zoology, University of Oxford, UK
2. Institute of Zoology, Zoological Society of London, UK
3. Multilevel Models Project, Mathematical Sciences, Institute of Education, London, UK
4. Mathematical Sciences, University of Nottingham, Nottingham, UK
*To whom correspondence should be addressed at:
EGI, Department of Zoology, University of Oxford, Oxford OX1 3PS
Tel: +44 1865 281069
Fax: +44 1865 271168
E-mail: [email protected]
Abstract
Studies of variation in individual reproductive fitness in natural populations have been
important in the development of life-history biology, in particular for our
understanding of the evolution of reproductive scheduling, reproductive effort and the
individual optimisation of fitness. Most long-term studies of marked individuals are
characterised by complex data sets, where repeated observations of individuals,
distributed over a range of environments, make the determination of the important
sources of variation between individuals difficult. In addition, many traits measured in
individuals show strong phenotypic covariance, which can arise for numerous
reasons; distinguishing between these explanations is difficult without
experimentation. In this paper we apply Bayesian cross-classified multivariate models
to data from a long-term study of the great tit Parus major to partition the covariance
between different reproductive parameters (life history traits) within and between
differing sources of variance. Our analyses provide evidence for the importance of the
environment in structuring patterns of phenotypic covariance between pairs of life-
history traits. Additionally, these analyses reveal patterns of antagonistic covariance
at different levels of the analysis, which seem to reflect the opposing influence of (i)
individual variation (particularly among females) in acquisition of resources and (ii)
trade-offs between life-history traits. We argue that the multi-level partitioning of
covariance offers some alternative perspectives as a means of causal analysis of life-
history variation, and suggest some additional approaches that could be taken using
this method.
Keywords: fitness, life history, multivariate mixed model, optimisation, trade-off,
variance decomposition
Introduction
Explaining variation between individuals in reproductive traits relating to fitness, such
as their timing of reproduction, the number of offspring they produce, and the number
of descendents they leave remains a long-term goal of evolutionary ecology. Many
approaches have been used to answer these questions, ranging through development
of theoretical models, comparative analyses, laboratory selection experiments,
quantitative genetics and experimentation in the field (reviewed in: Stearns 1992;
Bennett & Owens 2002; Roff 2002). Many of the observations that led to the initial
development of modern life-history biology were derived from observations of
animals and plants in natural populations (e.g. Lack 1954, 1966). In terms of
understanding the sources of variation in traits, observational studies have a number
of well-known weaknesses when compared to experimental approaches, foremost
among which are the difficulty in assigning causality to observed relationships, and
the possibility that covariance at different levels obscures underlying relationships of
interest (Reznick et al. 2000). For example, it is commonly observed that traits that
might be expected to be negatively correlated, such as fecundity and mortality, or
clutch size and egg size, are in fact positively correlated at the level of the phenotype
in natural populations. This covariance can be explained as resulting from variation
across individuals in the extent to which they possess, or can acquire, limiting
resources (e.g. van Noordwijk & de Jong, 1986; Bernardo 1996; Reznick et al 2000;
Roff 2002).
Despite these well-known limitations, observational studies also offer some
advantages over other methods. Foremost among these are the larger sample sizes,
3

and longer time series, that are often available for study. If selection on life-history
traits is weak, then very large sample sizes may be needed to detect it (Kingsolver et
al. 2001), and it may require sample sizes in the order of thousands to make confident
statements about the presence or absence of selection on a character. In addition, if
environments fluctuate, then long time series of data may be needed in order to detect
effects that have important consequences for explaining characteristics of populations
(e.g. Sinervo & Lively 1996; Grant & Grant 2002). Also, in many cases the
environmental sources of variation that are of interest fluctuate at an annual scale
(Tinbergen et al. 1985; Boyce & Perrins 1987), in which case a data set collected over
many years is required. A further advantage of long-term studies of unmanipulated
populations is that many such studies have already been running for decades, meaning
that large amounts of data are already available for analysis. Retrospective analyses of
such data have provided some important examples of ecological and evolutionary
phenomena in action in natural populations (e.g. Keller et al. 1994; Kruuk et al. 1999;
Coulson et al. 2001; Merilä et al. 2001; Veen et al. 2001; Grant & Grant 2002).
Our aim in this paper is to present analyses, using a novel statistical method applied to
a long-term study of a marked population, which circumvent some of the difficulties
associated with covariance among different levels of data, while making use of the
large amount of data that are available. In this paper we partition the covariance
between different traits at a number of different levels. A companion paper (Pettifor et
al. MS) provides additional background information, and addresses the partitioning of
variance among different levels of the same data set.
4
Partitioning covariance: rationale
Our aim in this section is to explain the rationale behind our seeking to partition
covariance between traits at different levels. We illustrate this with two hypothetical
examples, both of which are closely related to the analyses reported below.
A common finding in studies of life-history variation in the wild is that two traits
covary (e.g. Bérubé et al. 1999; Reid et al. 2003). For example, in many species of
birds, breeding time and clutch size are negatively correlated, with late-breeding birds
laying smaller clutches than earlier breeding birds (Fig. 1a). This negative covariance
is usually explained as reflecting a decline in the food available for rearing offspring
over the course of the avian breeding cycle, with the result that the optimum clutch
size is smaller for birds that breed later (e.g. Perrins 1970; Daan et al. 1989). In that
sense, the observed negative covariance between laying date and clutch size is an
example of adaptive phenotypic plasticity. An alternative explanation might be that
only females in prime condition are able to breed early, and that such females are able
to lay larger clutches because they are in better condition (c.f. Price et al. 1988), in
which case the association between clutch size and laying date would be incidental.
Both explanations would be consistent with the negative phenotypic covariance
between clutch size and laying date, and would require careful experimentation to
distinguish them; such experiments may in fact be very difficult to perform (Sheldon
et al. 2003). However, the two hypotheses make different predictions about how the
covariance between these traits will be partitioned between different levels of a
structured data set (Fig 1a).
5

If the covariance between these two traits were largely the result of adaptive
phenotypic plasticity, then we would expect a relatively large proportion of the
covariance to be attributable to specific environmental effects. These effects might
reflect differences between individual nest-boxes (e.g. if some territories are
consistently associated with early breeding, then we would expect clutch size to be
adjusted in response), or effects at the level of individual observation (e.g. stochastic
effects specific to individual breeding attempts cause a female to lay late, and clutch
size is adjusted in response to timing). Alternatively, if the covariance were largely
due to variation in the properties of individual females, we would expect a relatively
large proportion of the covariance to be due to differences between individual
females. Similar scenarios could be constructed to explain covariance between
combinations of traits at other levels.
A second insight that can be obtained from partitioning covariance at different levels,
concerns the ability to detect covariances of opposite sign at different levels that tend
to cancel each other out when combined at the level of the simple, gross phenotypic
correlation (Fig 1b). Life-history theory predicts that some life-history traits should
show negative covariances, reflecting optimal trade-offs between fitness components
that cannot simultaneously be maximized (Stearns 1992; Roff 2002). For example, a
trade-off between investment in current reproduction and investment in future
reproduction is one of the two major kinds of trade-off that are thought to structure
the evolution of life-histories (Williams 1966; Lessells 1991; Stearns 1992; Roff
2002). Such a trade-off might be sought as a negative correlation between clutch size
(current reproduction) and subsequent parental survival (future reproduction). It is
well known that raw phenotypic correlations tend to give results that are hard to
6

interpret, with more positive covariances among traits predicted to show negative
covariances than expected (Bernardo 1996; Glazier 1999). In fact, such positive
covariances are expected if individuals differ in the amount of resources they have
available to allocate to competing functions (van Noordwijk & de Jong 1986; Fig 1b).
The realisation that individual variation can mask underlying trade-offs is part of the
rationale behind experimental approaches to studying life-history trade-offs in natural
populations, where the individual variation is assumed to be controlled for by random
allocation to experimental treatments. Hence, a field experiment to test the idea that
current and future reproduction trade-off against each other might take the form of
manipulating brood size and measuring the subsequent survival of parents rearing
manipulated broods (Pettifor et al. 1988, Doligez et al. 2002).
Brood manipulation experiments conducted in the field, such as that described above,
have a number of difficulties, foremost amongst which is the likelihood that the
expected effects may be small, and easily swamped by environmental sources of
variation. This may then necessitate impractically large sample sizes in order to
statistically detect an effect. Multi-level partitioning of covariance offers an
alternative way to approach trade-offs between life-history traits. If the positive
covariance between traits that are expected to show a negative covariance were due to
variation between individuals in resource availability, then we would expect to find
differing patterns of covariance at different levels of the analysis. At the level of
differences between individual females, the covariance should be positive: some
females are able to lay large clutches and are inherently more likely to survive to the
following breeding season. However, at the lowest level (i.e. at the unit of
observation, namely between breeding attempts), we may expect to see a negative
7
covariance. That is, once the effect of variation between individuals is removed, we
might expect that we are able to detect the antagonistic effects of investment in two
competing life-history traits (see Fig 1b). In this case, the experimental and the
analytical approach aim to determine the same quantity: the sign of the relationship,
holding individual variation constant, between two life-history traits.
Materials and Methods
Data
The data analysed here were collected as part of a long-term population study of the
great tit Parus major, breeding in nest-boxes in Wytham Wood, near Oxford, UK.
More details concerning the general methods and traits considered are given in the
companion paper (Pettifor et al. MS), and in references therein; only brief details are
given here.
Great tits were studied breeding in nest-boxes (>1000) erected throughout the wood;
the position of the nest-boxes has remained unchanged over the course of the study
period analysed here (1964 – 1997, although wooden boxes were replaced by concrete
ones in 1974-76 due to heavy predation by weasels Mustela nivalis). Birds were
identified from ring numbers applied either as nestlings, or when trapped as adults.
Recruitment was determined through the recapture of birds, previously ringed as
nestlings, as breeding adults. Six traits, and their covariance, are analysed here:
(i) Clutch size: the number of eggs laid in each completed clutch.
(ii) Laying date: the date on which the first egg of the clutch was laid.
(iii) Mean nestling mass: the mean mass of nestlings per brood.
8

(iv) Nest success: a binary variable with the value of either 0 or 1 depending
on whether any ringed young from that breeding attempt were recaptured
as breeding adults in subsequent years (0 = none recaptured).
(v) Female survival: a binary variable with the value of either 0 or 1
depending on whether an individual female was recaptured in subsequent
years (0 = not recaptured).
(vi) Male survival: a binary variable with the value of either 0 or 1 depending
on whether an individual male was recaptured in subsequent years (0 = not
recaptured).
We chose five classifications with which to partition the covariance among these
traits:
(1) Year of breeding attempt
(2) Individual nest-box (the position of each was fixed over the course of
the study)
(3) Individual female
(4) Individual male
(5) Individual breeding attempt.
A total of 4165 observations had complete records for each of the six response
variables - see the companion paper for more details (Pettifor et al. MS; nests subject
to experimental manipulation were excluded). The choice of these particular
classifications is self-explanatory, with the possible exception of nest-box. Our aim in
choosing this classification was to have a fine-grained measure of the specific
environment in which individual breeding attempts occurred, although other spatial
9

scales could have been chosen. However, our reason for choosing the level of
individual next-box was an expectation on our part that quite small-scale effects
might be rather important in contributing to variation in life-history traits. For
example, the suitability of a particular nestbox for rearing young might be determined
by the phenology of trees growing in the immediate vicinity of the box. Tits generally
forage for food for their young quite close to the nest-site (90% of foraging within
45m of the nest: Naef-Daenzer & Keller 1999), and individual trees often show highly
repeatable phonologies between years (Mopper et al. 2000). In general there has long
been an expectation that ‘territory quality’ effects may be important in explaining
variation between individuals in breeding success. As we had no information about
the exact boundaries of territories in this study, we chose nest-box as likely to
represent roughly the same information. It is likely, of course, that there are other
environmental effects that are not captured by our classification. For example, we
may expect individual nest-boxes that are close to one another to share more similar
environments than those that are far apart. At present, this source of potential
covariance between characters is not explored by our analyses, but determining the
spatial scale which results in environmentally-induced covariances between traits is
beyond the scope of this study.
Statistical Analysis
In the companion paper (Pettifor et al. MS), we used Markov chain Monte Carlo
(MCMC) estimation of cross-classified multivariate models to quantify the variance
present in life-history traits of known pairs of great tits Parus major, into that
attributable to five separate random effects. In these data, the individual observations
10
consist of six responses (clutch-size, lay-date, nestling mass, successful recruitment
per nest and parental [mother and father] annual survival) for each individual breeding
attempt. Each of these breeding attempts is nested within four separate higher
classifications (male parent identity (i.d.), female parent i.d., nestbox i.d. and year)
which do not themselves exhibit any nesting structure, resulting in a four-way cross-
classified structure at level 2, alongside the level 1 residual error.
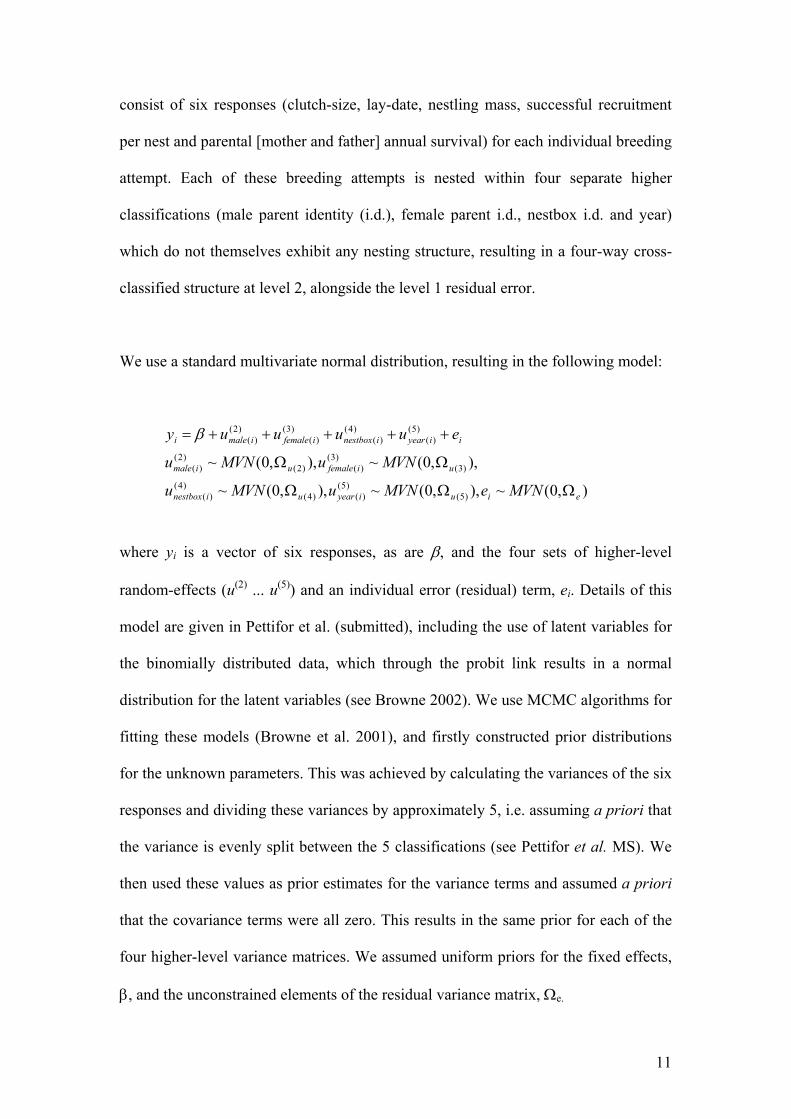
We use a standard multivariate normal distribution, resulting in the following model:
),0(~),,0(~),,0(~
),,0(~),,0(~
)5()5(
)()4()4(
)(
)3()3(
)()2()2(
)(
)5()(
)4()(
)3()(
)2()(
eiuiyearuinestbox
uifemaleuimale
iiyearinestboxifemaleimalei
MVNeMVNuMVNu
MVNuMVNu
euuuuy
ΩΩΩ
ΩΩ
+++++= β
where yi is a vector of six responses, as are β, and the four sets of higher-level
random-effects (u(2) ... u(5)) and an individual error (residual) term, ei. Details of this
model are given in Pettifor et al. (submitted), including the use of latent variables for
the binomially distributed data, which through the probit link results in a normal
distribution for the latent variables (see Browne 2002). We use MCMC algorithms for
fitting these models (Browne et al. 2001), and firstly constructed prior distributions
for the unknown parameters. This was achieved by calculating the variances of the six
responses and dividing these variances by approximately 5, i.e. assuming a priori that
the variance is evenly split between the 5 classifications (see Pettifor et al. MS). We
then used these values as prior estimates for the variance terms and assumed a priori
that the covariance terms were all zero. This results in the same prior for each of the
four higher-level variance matrices. We assumed uniform priors for the fixed effects,
β, and the unconstrained elements of the residual variance matrix, Ωe.
11
Having constrained the variances of the binary response variables at level 1 to equal
1.0 (i.e. the diagonal cell values of the residual variance matrix Ωe), we are able to use
MCMC sampling to fit the model (implemented in a beta version of the MLwiN
software package – Rasbash et al. 2000; Browne 2002). The MCMC algorithm works
by first splitting the unknown parameters into several sets; in the case of our model
we have 5 variance matrices, 4 sets of higher level residuals and 1 set of fixed effects
making 10 sets in total. We allocate ‘starting values’ for all the parameters and then
consider each of the ten sets of unknown parameters in turn assuming that our current
values for all the other parameters are correct. We are able to then calculate the
conditional posterior distribution of each set of unknown parameters and take a
random draw from this conditional posterior distribution. This random updating
procedure is repeated for each of the 10 sets and once all parameters have been
updated we repeat the same procedure many times over to produce chains of
parameter estimates. After discarding a suitable ‘burn-in’ period where we allow the
chains to converge to the underlying posterior distributions we subsequently have a
sample of draws from each parameter’s posterior distribution that we can use for
statistical inference of the model.
In reality in our model we also include latent variables for the binary responses in the
model which can be treated as an additional set of unknown parameters making 11
sets in total. Full details of the MCMC algorithm will be given in Browne et al. (in
preparation). Models were run on both the raw data and with the continuous traits
standardised to zero mean and unit variance prior to analysis, with the phenotypic
correlations subsequently calculated as
12

),(),(),(),(
yyVarxxVaryxCoVyxr
×=
or as
)0.1()0.1(),(
×yxCoV
for the raw and standardised values respectively. Note that the correlations and
covariances are equivalent with standardised data.
Results
Single-level covariances
As a first step we investigated the simple covariances between the different traits that
we have analysed here (Table 1; Fig 2a) – in other words, we ignored the multilevel
structure within the data, and simply determined the gross correlations between the
life-history traits using a single-level model. These phenotypic correlations show a
fairly typical pattern for these traits in wild bird populations (e.g. Stearns 1992).
While the covariances are generally quite low (absolute values do not exceed 0.29),
the majority (13/15) achieve individual statistical significance. We found relatively
strong negative covariance between clutch size and laying date, and between laying
date and the probability of successful recruitment, but strong positive covariance
between nestling mass and the probability of successful recruitment, and between
clutch size and the probability of successful recruitment (Table 1; Fig. 2a). These
inter-relationships between traits are commonly found in populations of temperate-
13
zone breeding birds: birds that breed early lay larger clutches, and large, early,
clutches are more likely to be successful in producing surviving nestlings, as are
broods with heavier nestlings than average.
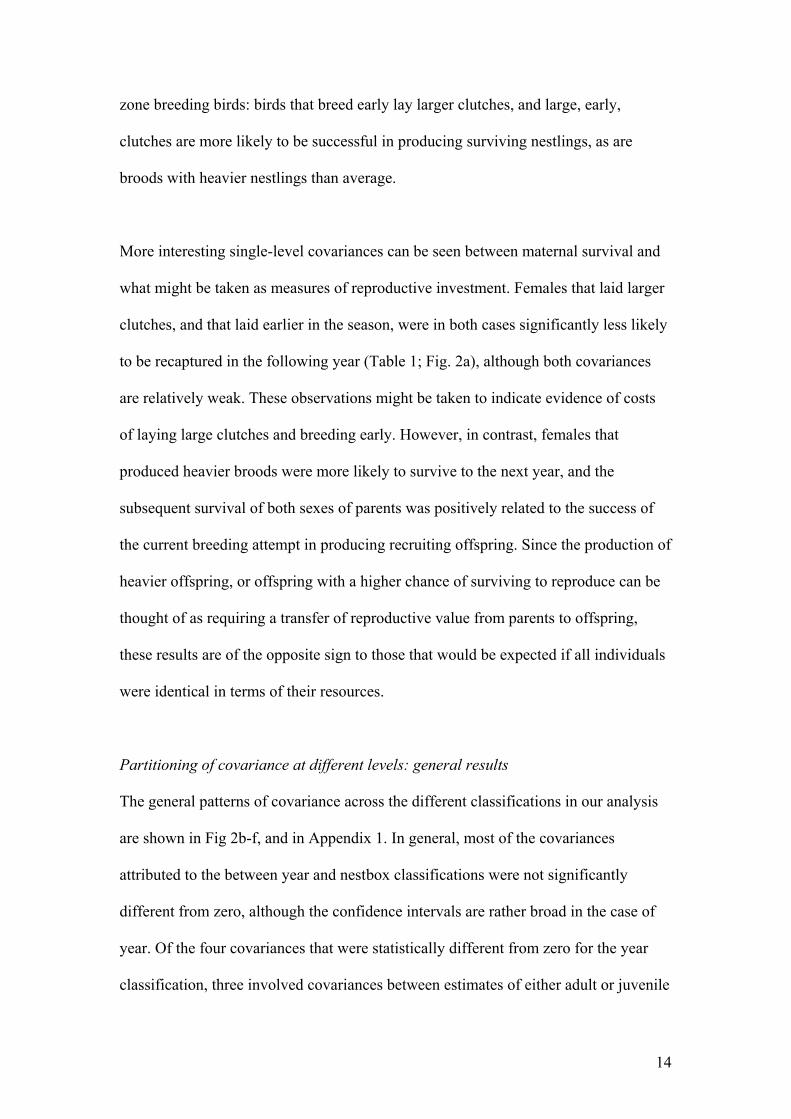
More interesting single-level covariances can be seen between maternal survival and
what might be taken as measures of reproductive investment. Females that laid larger
clutches, and that laid earlier in the season, were in both cases significantly less likely
to be recaptured in the following year (Table 1; Fig. 2a), although both covariances
are relatively weak. These observations might be taken to indicate evidence of costs
of laying large clutches and breeding early. However, in contrast, females that
produced heavier broods were more likely to survive to the next year, and the
subsequent survival of both sexes of parents was positively related to the success of
the current breeding attempt in producing recruiting offspring. Since the production of
heavier offspring, or offspring with a higher chance of surviving to reproduce can be
thought of as requiring a transfer of reproductive value from parents to offspring,
these results are of the opposite sign to those that would be expected if all individuals
were identical in terms of their resources.
Partitioning of covariance at different levels: general results
The general patterns of covariance across the different classifications in our analysis
are shown in Fig 2b-f, and in Appendix 1. In general, most of the covariances
attributed to the between year and nestbox classifications were not significantly
different from zero, although the confidence intervals are rather broad in the case of
year. Of the four covariances that were statistically different from zero for the year
classification, three involved covariances between estimates of either adult or juvenile
14
survival to the following year. These positive covariances might reflect two
processes: (i) the effect of annual variation in success in capturing adults, since this
would affect the survival rate of both parents and offspring similarly, and (ii)
environmental differences between years (e.g. beech mast crop, winter weather)
affecting both adult and juvenile survival. The other significant covariance due to the
effect of differences between years was between clutch size and the probability of
successful recruitment of offspring. Across years, larger clutches were associated with
higher recruitment of offspring from those clutches. This positive covariance might
represent the influence of density-dependent adjustment of clutch size: clutch sizes
are larger during years of low population density, which also allows high recruitment
of juveniles in the following year due to more territory vacancies.
At the classification of the individual nest-box there was again little evidence of
significant covariance between characters; in fact only 3/15 estimates reached
statistical significance (Appendix 1). Two of these cases were between laying date
and clutch size, and between laying date and the probability of successful recruitment;
both were negative. Hence, this suggests that part of the covariance between laying
date and clutch size in the single-level analysis is due to specific effects of territories:
some territories are associated with later breeding and smaller clutch sizes. Some
territories are also associated with higher recruitment and earlier breeding. This
suggests that the relationship between breeding date and recruitment success can
partly be attributed to differences between territories.
Differences in patterns of covariance at different levels
15

We attempted to adjust for the differing degree of statistical confidence in the
covariances estimated among the different classifications in the analysis by asking
what the correlations were between the estimated mean covariances at the different
levels (Table 2). This showed that the patterns of covariance detected due to
differences among years, nest-boxes, and observations were all rather similar to each
other, and to the covariance at the gross phenotypic level (r between 0.588 and 0.778).
These three classifications (year, nest-box, observation) might all be considered to be
aspects of the environment experienced by great tits (though operating at different
spatial and temporal scales). Hence, this analysis suggests that different
environmental scales have rather similar effects on the covariances between traits, and
that their overall effect is detectable at the level of the raw phenotypic correlations
between traits.
A different pattern was observed when the covariances at the level of individual male
and female were correlated with those at the other levels (Table 2). Here there was
little evidence of similarity in the covariance among different traits, suggesting that
the processes affecting covariance among traits at the level of individuals are quite
different from those at the level of environmental influences. In the case of males, the
lack of concordance is not surprising, since there was very little evidence that
differences between males contribute to the covariance between traits (or to their
variance: Pettifor et al. MS). However, there were several significant covariances at
the level of individual female; similarly, reasonable amounts of the variance in these
traits could be partitioned to differences between individual females (Pettifor et al.
MS).
16
Antagonistic patterns of covariance
In addition to the cases described above, there were several cases where the
covariance was of opposite sign at different levels; these are summarised in Table 3.
For example, there was significant positive covariance between clutch size and female
survival at the between female classification (Fig 2e, Appendix 1), but significant
negative covariance between clutch size and female survival at the lowest level (Fig
2f, Appendix 1); the covariance between these traits in the single level analysis was
weakly (but significantly) negative. Hence, when individual females are considered,
laying a large clutch is associated with elevated survival, while at the level of
individual nesting attempts laying a large clutch is associated with reduced survival.
These effects will tend to cancel each other when the covariance between characters is
assessed for all of the data combined.
Similarly antagonistic covariances (i.e. significant covariances of opposite sign) were
seen for several other combinations of traits (Table 3). Nestling mass and laying date
were negatively related at the level of observation, but positively related at the level
of individual females (weakly negative in the single-level analysis). In contrast, laying
date and female survival were positively related at the level of observation, but
strongly negatively related at the level of individual females; again, the single-level
covariance agreed with that at the level of observation.
Discussion
By partitioning the covariance among a series of life-history traits to a number of
different sources, we detected several interesting patterns, which provide significant
17
insights into the relationships between life-history traits in this population. First, while
the simple phenotypic correlations between traits exhibited some familiar patterns (for
example, higher success of early breeding females which laid large clutches, and
which produced heavy nestlings), these patterns were not present for all of the
classifications across which we partitioned the data. In general, the patterns of
covariance at levels that could reflect the action of environmental factors were rather
similar to those seen in the single level unpartitioned phenotypic data. In contrast, the
pattern of covariance among traits between individual males and females was, for
some key combination of traits, quite different from that in the unpartitioned data.
While there was no evidence of effects of males on covariance among these life-
history traits, there were some strong covariances due to the effects of individual
females. Perhaps most interesting was the existence of antagonistic patterns of
covariance at different levels of the analysis. These all took a rather similar form:
pairs of traits were related in the opposite direction when differences between
individual females were considered relative to the level of individual breeding
attempts (i.e. within female differences), and to their relationship in the unpartitioned
phenotypic data. We discuss some implications of these results below.
Environmental effects on life-history covariances
Although we found little evidence of significant covariance among life-history traits
at two of the three different environmental classifications (year and nest-box), this
conclusion is tempered by large confidence intervals in the case of year. When we
compared the estimated covariances among classifications irrespective of their
statistical significance, rather similar patterns of covariance were found to result from
the effects of differences between years, nest-boxes and observations. In turn, these
18
patterns of covariance were rather similar to those found in the single-level analyses
(i.e. the overall phenotypic correlations). Our interpretation of these patterns is that a
substantial part of the general pattern of covariance among these life-history traits
results from the influence of the environment.
Year, and nest-box clearly represent two kinds of environmental variable, although
with rather differing expected pathways by which they could affect life-history traits
in these birds. Many studies have demonstrated the effects of similar sorts of
environmental variable on the variance among life-history traits (reviewed in Newton
1998). In the present population, previous work suggests that important differences
among years are in: (i) spring temperature (McCleery & Perrins 1998), with birds
laying earlier clutches in warmer springs; (ii) the extent of the previous autumn’s
beech mast crop (Lack 1966; Perrins 1966) and (iii) the population density of both
great tits and their congener, the blue tit Parus caeruleus, with which they compete
for breeding sites (Minot & Perrins 1986). There is also evidence of important spatial
effects on life-history traits. For example, van der Jeugd & McCleery (2002) showed,
for this population, that the resemblance between female great tits and their offspring
is higher if both individuals nest relatively close together within the study plot.
The pattern of covariance among traits at the level of observation was also similar to
that at the level of nest-box and year; it is likely that this reflects a third source of
environmental variation. For example, changes in vegetation structure over time,
stochastic variation in local phenology of trees, presence of competitors, are all
factors that might influence the life-history traits analysed at the level of each
19

individual breeding attempt, and the influence of these characters will be captured at
the ‘observation’ level (see Pettifor et al. MS for further discussion).
Influences of males and females on life-history covariances
Variation between individual parents is important for the pattern of covariance of
some characters, but statistical significance was established only in the case of
females. This pattern is very similar to the case for the analyses of variances in these
life-history traits (Pettifor et al. MS), where males only influenced relative nestling
mass (which may be due to males contributing genes to offspring that determine mass
and or size, or to consistent differences among males in the rate at which they
provision their offspring). As for the analyses partitioning variance in these life-
history traits to different levels, there are potential mechanisms by which males could
influence the covariance between pairs of life-history traits that might, at first sight,
appear to be obviously determined by the female. For example, if territories differ in
quality, males compete to possess territories of high quality, males differ in their
ability to sequester high quality territories, and variation in habitat quality affects the
optimal combination of pairs of life-history traits, then males might have a direct
influence on the covariance between pairs of characters. Alternatively, a number of
experimental studies, including of birds, suggest that females adjust their reproductive
investment in response to the perceived quality of their mate (reviewed in Sheldon
2000), for example by breeding earlier, laying larger clutches, or providing more
parental care to offspring. Such differential allocation might influence the covariance
between life-history traits. Our analyses provide no evidence that either process is
important in this population.
20

There are several potential sources of covariance at the level of females. For example,
genetic covariance between pairs of life-history traits (e.g. clutch size and laying date)
will be detected as covariance due to differences between females. In addition,
however, sources of individual variation in allocation to life-history characters will
also be captured by the between individual female term. In general, we found
evidence to suggest that variation in females is an important determinant in the pattern
of covariance of life-history traits.
Detecting individual variation and life-history trade-offs
We found several cases where the covariance between pairs of life-history traits
differed in sign at different levels of the analysis. The general pattern was that the sign
of the covariance at the level of individual females was opposite to that at levels that
capture variation in the environment (year, nest-box and particularly individual
observation). For example, annual parental survival and clutch size covaried
positively at the level of females, but negatively at the level of observation (and also
weakly negatively in the single-level analyses). Our interpretation of these
antagonistic covariances is that partitioning the covariance among these traits at
different levels allows us to detect different processes operating. High female survival
associated with laying a large, early clutch, when other sources of covariance between
these traits are held constant may reflect detection of variation in condition, or quality,
across females. In contrast, at the level of observation, we detect the cost of laying a
large, early, clutch in terms of reduced female survival. It is notable that while the
covariance between survival and clutch size was relatively weak in the single-level
analyses (-0.067), the ‘antagonistic’ covariances are much stronger (+0.45 across
individual females; -0.20 at the level of observation). Hence, it appears that variation
21
among females exerts a substantial influence on the way in which survival and clutch
size, and survival and breeding time, covary.
Many studies have attempted to reveal phenotypic trade-offs between current and
future reproduction by manipulating clutch or brood size in birds, and analysing
subsequent survival of females; there are relatively few cases in which such trans-
generational trade-offs have been detected due to experimental manipulations (Møller
& Lindén 1989; Roff 2002). Our analyses suggest that such trade-offs do occur, and
can be detected, because when we analyse the relationship between clutch size and
survival at the level of individual nesting attempts (i.e. controlling for major
environmental sources of variation and, more importantly, for variation among
individual females) we detect quite strong negative covariance between these traits.
Given the strong covariance in the opposite direction at the level of females, and also
fluctuating survival probabilities between years (Pettifor 1993a,b), and the
confounding of parental survival with dispersal (Doligez et al. 2002) any effect of
experimental manipulations of individual effort may be very hard to detect. In
addition, the sample sizes available for the type of analysis we have performed are an
order of magnitude larger than the most extensive experimental studies. These results
are, therefore, what we would expect if within this population individual females were
optimising reproductive decisions in order to maximise their fitness (Pettifor et al.
1988; 2001).
Conclusions
Covariance, at both phenotypic and genetic levels, among pairs of life-history traits is
important in determining the joint evolutionary trajectories of these traits (Roff 2002).
22

However, understanding why particular pairs of traits show particular patterns of
covariance is difficult, but fundamental to our understanding of life-history variation
within and across species. We have shown here how an ability to partition the
covariance among traits to its different sources offers some interesting insights into
the causes of the patterns of covariance. In some instances, these analyses could be
used to suggest experimental manipulations that would provide tests of the underlying
causal structure. In other cases, experiments will be very difficult, and detailed
analyses of large, already-existing, data sets may provide the most fruitful means of
making further progress in understanding.
Acknowledgements
BCS is a Royal Society University Research Fellow.
23

Literature cited
Bernardo, J. 1996. The particular maternal pattern of propagule size, especially egg
size: patterns, models, quality of evidence and interpretation. Amer. Zool. 36, 216-
236.
Bérubé, C.H., Festa-Bianchet, M. & Jorgenson, J.T. 1999. Individual differences,
longevity, and reproductive senescence in bighorn ewes. Ecology 80, 2555-2565.
Browne, W.J. 2002. MCMC Estimation in MlwiN. London, Institute of Education.
Browne, W.J., Goldstein, H. & Rasbash, J. (2001) Multiple membership multiple
classification (MMMC) models. Statistical Modelling 1, 103-124.
Coulson, T.N., Catchpole, E.A., Albon, S.D. Morgan, B.J.T., Pemberton, J.M.,
Clutton-Brock, T.H., Crawley, M.J. & Grenfell, B.T. 2001. Age, sex, density,
winter-weather, and population crashes in Soay sheep. Science 292, 1528-1531.
Daan, S., Dijkstra, C., Drent, R.H. & Meijer, T. 1989. Food supply and the annual
timing of avian reproduction. Pp. 392-407 in: Acta XIX Congressus Internationalis
Ornithologici, Ottawa, 1986 (H. Ouellet, ed.).
Doligez, B., Clobert, J., Pettifor, R.A., Rowcliffe, J.M., Gustafsson, L., Perrins, C.M.
& McCleery, R.H. 2002. Costs of reproduction: assessing responses to
clutch/brood size manipulation on life-history and behavioural traits using multi-
state capture-recapture models. J. Appl. Stats. 29, 407-423.
Glazier, D.S. 1999. Trade-offs between reproductive and somatic (storage) investment
in animals: a comparative test of the van Noordwijk & de Jong model. Evol. Ecol.
13, 539-555.
Grant, P.R. & Grant, B.R. 2002. Unpredictable evolution in a 30-year study of
Darwin’s finches. Science 296, 707-711.
25

Keller, L.F, Arcese, P., Smith, J.N.M., Hochachka, P.W. & Stearns, S.C. 1994.
Selection against inbred song sparrows during a natural population bottleneck.
Nature 372, 356-357.
Kingsolver, J.G., H.E. Hoekstra, J.M. Hoekstra, D. Berrigan, S.N. Vignieri, C.E. Hill,
A. Hoang, P. Gibert, & P. Beerli, 2001. The strength of phenotypic selection in
natural populations. Amer. Nat. 157, 245-261.
Kruuk, L.E.B., Clutton-Brock, T.H., Albon, S.D., Pemberton, J.M. & Guinness, F.E.
1999. Population density affects sex ratio variation in red deer. Nature 399, 459-
461.
Lack, D. 1954. The Natural Regulation of Animal Numbers. Clarendon Press, Oxford.
Lack, D. 1966. Population Studies of Birds. Clarendon Press, Oxford.
Lessells, C.M. 1991. The evolution of life histories. Pp 33-68. In: Krebs, J.R. & N.B.
Davies. (Eds). Behavioural Ecology – An Evolutionary Approach. 3rd Edn.
Blackwells, Oxford.
Lindén, M. & Møller, A.P. 1989 Trends Ecol. Evol. 4, 367-371.
McCleery, R.H. & C.M. Perrins, 1998 ... temperature and egg-laying trends. Nature
391, 30-31.
Merilä, J., L.E.B. Kruuk and B.C. Sheldon. 2001. Cryptic evolution in a wild bird
population. Nature 412: 76-79.
Minot, E.O. & Perrins, C.M. 1986. Intraspecific interference competition – nest sites
for blue tits and great tits. J. Anim. Ecol. 55, 331-350.
Mopper, S., Stiling, P., Landau, K., Simberloff, D. & van Zandt, P. 2000.
Spatiotemporal variation in leafminer population structure and adaptation to
individual oak trees. Ecology 81, 1577-1587.
26

Naef-Daenzer, B. & Keller, L.F. 1999. The foraging performance of great and blue
tits (Parus major and P. caeruleus) in relation to caterpillar development, and its
consequences for nestling growth and fledging weight. J. Anim. Ecol 68, 708-718.
Newton, I. 1998. Population limitation in birds. Academic Press, San Diego,
Calfornia.
Perrins, C.M. 1966. The effect of beech crops on great tit populations and
movements. British Birds 59, 417-432.
Perrins, C.M. 1970. The timing of birds’ breeding seasons. Ibis 112, 242-255.
Pettifor, R.A. 1993a. Brood manipulation experiments. I. The number of offspring
surviving per nest in blue tits (Parus caeruleus). J. Anim. Ecol. 62, 131-144.
Pettifor, R.A. 1993b. Brood manipulation experiments. II. A cost of reproduction in
blue tits (Parus caeruleus)? J. Anim. Ecol. 62, 145-159.
Pettifor, R. A., Perrins, C.M. & McCleery, R.H. 1988. Variation in clutch size in great
tits: evidence for the individual optimisation hypothesis. Nature 336, 160-162.
Pettifor, R. A., Perrins, C.M. & McCleery, R.H. 2001. The individual optimization of
fitness: variation in reproductive output, including clutch size, mean nestling mass
and offspring recruitment, in manipulated broods of great tits Parus major. J.
Anim. Ecol. 70, 62-79.
Pettifor, R.A., Sheldon, B.C., Browne, W., Rasbash, J. & McCleery, R.H. MS.
Partitioning of phenotypic covariance among life-history traits in the great tit
Parus major. Submitted MS (companion to this MS).
Price, T., M. Kirkpatrick and S.J. Arnold. 1988. Directional selection and the
evolution of breeding date in birds. Science 240, 798-799.
27

Rasbash, J., Browne, W.J., Goldstein, H., et al. 2000. A User’s guide to MlwiN, 2nd
Edition. London, Institute of Education.
Reid, J.M., Bignal, E.M., Bignal, S., McCracken, D.I. & Monaghan, P. 2003.
Environmental variability, life-history covariation and cohort effects in the red-
billed chough Pyrrhocorax pyrrhocorax. J. Anim. Ecol. 72, 36-46.
Reznick, D., Nunney, L. & Tessier, A. 2000. Big houses, big cars, superfleas and the
costs of reproduction. Trends Ecol. Evol. 15, 421-425.
Roff, D.A. 2002. Life History Evolution. Sinauer, Sunderland, Mass.
Sheldon, B.C. 2000. Differential allocation: tests, mechanisms and implications.
Trends Ecol. Evol. 15, 397-402.
Sheldon, B.C., Kruuk, L.E.B. & Merilä, J. 2003. Natural selection and inheritance of
breeding time and clutch size in the collared flycatcher. Evolution 57, 406-420.
Sinervo, B. & Lively, C.M. 1996. The rock-paper-scissors game and the evolution of
alternative male strategies. Nature 380, 240-243.
Stearns, S.C. 1992. The Evolution of Life Histories. Oxford University Press.
Tinbergen, J.M., van Balen, J.H. & van Eck, H.M. 1985. Density-dependent survival
in an isolated great tit population: Kluyver’s data reanalysed. Ardea 73, 38-48.
van der Jeugd, H.P. & McCleery, R.H. 2002. Effects of spatial autocorrelation, natal
philopatry, and phenotypic plasticity on the heritability of laying date. J. evol. Biol.
15, 380-387.
Van Noordwijk, A.J. & de Jong, G. 1986. Acquisition and allocation of resources:
their influence on variation in life-history tactics. Amer. Nat. 128: 137-142.
28

Veen, T., Borge, T., Griffith, S.C., Sætre, G.-P., Bures, S., Gustafsson, L. & Sheldon,
B.C. 2001. Hybridization and adaptive mate choice in flycatchers. Nature 411, 45-
50.
Williams, G. C. (1966) Natural selection, the costs of reproduction and a refinement
of Lack's principle. American Naturalist, 100, 687 - 690.
29

Table 1 Covariances among life-history traits based on single-level models using
standardised data; values in parentheses are 95% confidence intervals; underlined
covariances are significantly different from zero.
Trait Clutch Size Laying Date Mean Nestling Mass Successful
Recruitment
Male Survival
Laying Date -0.291
(-0.330 – -0.254)
Mean Nestl.
Mass
-0.105
(-0.143 – -0.068)
-0.040
(-0.078 – -0.003)
Successful
Recruitment
0.186
(0.140 – 0.232)
-0.184
(-0.229 – -0.138)
0.146
(0.099 – 0.192)
Male Surv. -0.024
(-0.070 – 0.023)
0.065
(0.019 – 0.111)
0.030
(-0.016 – 0.076)
0.058
(0.000 – 0.115)
Female Surv. -0.067
(-0.113 – -0.020)
0.067
(0.021 – 0.113)
0.049
(0.003 – 0.100)
0.076
(0.018 – 0.133)
-0.060
(-0.118 – -0.002)
30

Table 2 Correlations between covariances estimated for each classification from 105
iterations of the five-level cross-classified multivariate MCMC model and a single
level MCMC model, with the trait values standardised to zero mean and unit variance.
Values in bold with an asterisk are significantly different from zero.
Level year nestbox male female observation Single-level
year 1.000
nestbox 0.778* 1.000
male -0.045 0.307 1.000
female 0.570* 0.474 0.016 1.000
observation 0.622* 0.588* -0.209 -0.025 1.000
Single-level 0.693* 0.658* -0.220 0.355 0.730* 1.000
31

Table 3 Pairs of antagonistic covariances at different classifications
Pair of traits Classification Estimated
covariance
95% CI
(1) Laydate &
nestling mass
Female 0.222 0.02 – 0.041
Observation -0.188 -0.25 - -0.13
(2) Clutch size and
female survival
Female 0.447 0.264 – 0.614
Observation -0.199 -0.271 - -0.125
(3) Laydate and
female survival
Female -0.695 -0.806 - -0.560
Observation 0.114 0.052 – 0.188
32

Appendix 1. Phenotypic covariances obtained from the multivariate cross-classified models of the six life-history traits in great tits. The traits were standardised to zero mean and unit variance before analysis; values are means (95% confidence intervals). Estimates that are significantly different from zero are marked with an asterisk.
Trait Random
Effect Lay-date Mean Nestl.
Mass Successful
Recruitment Male
Survival Female Survival
Clutch-size Year -0.317 (-0.589 - 0.026)
0.218 (-0.145 - 0.529)
0.592 (0.307 - 0.781)*
0.068 (-0.309 - 0.431)
0.019 (-0.349 - 0.386)
Clutch-size Nbox -0.455 (-0.607 - -0.267)*
0.112 (-0.154 - 0.365)
0.236 (-0.070 - 0.500)
0.305 (0.027 - 0.545)*
0.075 (-0.209 - 0.367)
Clutch-size Male -0.158 (-0.427 - 0.104)
0.090 (-0.280 - 0.376)
-0.135 (-0.464 - 0.280)
0.240 (-0.056 - 0.514)
-0.025 (-0.547 - 0.354)
Clutch-size Female -0.443 (-0.547 - -0.339)*
-0.319 (-0.461 - -0.174)*
0.355 (0.127 - 0.591)*
0.065 (-0.162 - 0.306)
0.447 (0.264 - 0.614)*
Clutch-size Obs -0.21 (-0.280 - -0.155)*
-0.127 (-0.196 - -0.055)*
0.071 (-0.009 - 0.147)
-0.057 (-0.121 - 0.012)
-0.199 (-0.271 - -0.125)*
Lay-date Year 0.135
(-0.214 - 0.461) -0.231
(-0.533 - 0.125) -0.013
(-0.384 - 0.361) 0.071
(-0.303 - 0.420) Lay-date Nbox -0.129
(-0.357 - 0.118) -0.394
(-0.596 - -0.148)* -0.215
(-0.472 - 0.071) 0.040
(-0.225 - 0.303) Lay-date Male -0.056
(-0.328 - 0.225) 0.187
(-0.132 - 0.516) -0.333
(-0.546 - 0.003) -0.076
(-0.367 - 0.295) Lay-date Female 0.222
(0.022 - 0.407)* -0.495
(-0.687 - -0.264)* -0.149
(-0.425 - 0.200) -0.695
(-0.806 - -0.560)* Lay-date Obs -0.188
(-0.249 - -0.127)* -0.194
(-0.267 - -0.119)* 0.054
(-0.015 - 0.118) 0.114
(0.052 - 0.188)* Mean Nestl. Mass
Year 0.298 (-0.076 - 0.595)
0.033 (-0.359 - 0.416)
0.140 (-0.260 - 0.493)
Mean Nestl. Mass
Nbox 0.182 (-0.133 - 0.440)
0.085 (-0.231 - 0.398)
0.174 (-0.131 - 0.459)
Mean Nestl. Mass
Male -0.125 (-0.454 - 0.230)
0.039 (-0.252 - 0.349)
0.188 (-0.261 - 0.454)
Mean Nestl. Mass
Female -0.230 (-0.515 - 0.112)
-0.202 (-0.504 - 0.217)
-0.071 (-0.330 - 0.184)
Mean Nestl. Mass
Obs 0.236 (0.152 - 0.319)*
0.060 (-0.011 - 0.122)
0.0419 (-0.028 - 0.109)
Successful Recruitment
Year 0.409 (0.023 - 0.683)*
0.374 (-0.009 - 0.657)
Successful Recruitment
Nbox 0.102 (-0.237 - 0.417)
0.159 (-0.215 - 0.476)
Successful Recruitment
Male -0.061 (-0.468 - 0.358)
0.078 (-0.308 - 0.473)
Successful Recruitment
Female 0.235 (-0.273 - 0.548)
0.387 (0.016 - 0.641)*
Successful Recruitment
Obs 0.020 (-0.055 - 0.096)
0.024 (-0.052 - 0.101)
Male Survival
Year 0.501 (0.146 - 0.737)*
Male Survival
Nbox 0.238 (-0.116 - 0.516)
Male Survival
Male 0.013 (-0.298 - 0.332)
Male Survival
Female 0.052 (-0.287 - 0.416)
Male Survival
Obs 0.203 (0.139 - 0.266)*
33

Figure Legends
Figure 1: Illustration of partitioning among levels of covariance between two
phenotypic traits. (a) Clutch Size and Laying Date: Two models exist to explain a
decline in clutch size with laying date: (i) a causal effect of the environment, where
declining prospects for young produced late in the season reduce the optimal clutch
size, and (ii), a female condition effect, where females that are in good condition are
able to breed earliest, and to lay the largest clutch sizes, producing a negative
correlation between clutch size and laying date. The two models make different
predictions about how the two phenotypic traits will covary at different levels. If the
covariance is due to a causal effect of the environment, then negative covariance
should be seen at the level of territory (for each territory, optimal clutch size declines
as date progresses), and individual observation (stochastic processes will influence
each individual breeding attempt, delaying or advancing it, and hence changing the
optimal clutch size). In contrast, variation among females should not affect the
covariance between clutch size and date, because the covariance results from the
action of the environment (each female is assumed to experience this in the same
way). In contrast, if the phenotypic covariance is due to the effect of variation in the
condition of individual females, variation in the environment should have little effect
on the covariance between clutch size and laying date, and negative covariance should
exist at the level of females. Two different scenarios could be constructed for the
expectation of the covariance at the level of individual breeding attempt under this
hypothesis. If variation in female condition is largely determined early in life, then
annual differences within females will be unimportant and there will be little or no
covariance at the level of observation. Alternatively, if there are large fluctuations in
34
condition within females between years, there may be (b) Survival and Fecundity:
The simple expectation from life-history theory is that increased fecundity will result
in reduced survival. However, at the level of the raw phenotypic correlation, other
patterns are often observed; in this case no relationship between the two characters.
This absence of effect can be explained if individuals differ in the resources they have
available to invest into these two traits. However, within individuals, we would still
expect high levels of investment to be associated with reduced survival. Partitioning
covariance between and within females allows the detection of both processes.
Figure 2: Correlations between the six life-history traits derived from the variance-
covariance matrices of the (a) single-level model, and (b-f) the separate classifications
of the multi-level MCMC multivariate model.
35

Figure 1
a
L a y i n g d a t e
Cl
ut
ch
Raw phenotypic correlation
(1) Causal environmental effect
(2) Female condition effect
[partitioning ofcovariance
at different levels]
Laying date
Clu
tch
Size
(i) Territory
(ii) Female
(iii) Observation
Laying date
Clu
tch
Size
Laying date
Clu
tch
Size
Laying date
Clu
tch
Size
Laying date
Clu
tch
Size
Laying date
Clu
tch
Size
b
F e c u n d i t y
Sur
viva
l
partitioning ofcovariance atdifferent levels
Raw phenotypic correlation
Fecundity
Sur
viva
lFecundity
Sur
viva
l
(i) Female
(ii) Observation
36

Figure 2
cs*ld
cs*n
mcs
*nsu
cccs
*msu
rvcs
*fsur
vld
*nm
ld*n
succ
ld*m
surv
ld*fs
urv
nm*n
succ
nm*m
surv
nm*fs
urv
nsuc
c*m
surv
nsuc
c*fs
urv
msu
rv*fs
urv
-1.0
-0.5
0.0
0.5
1.0
Single level
cs*ld
cs*n
mcs
*nsu
cccs
*msu
rvcs
*fsur
vld
*nm
ld*n
succ
ld*m
surv
ld*fs
urv
nm*n
succ
nm*m
surv
nm*fs
urv
nsuc
c*m
surv
nsuc
c*fs
urv
msu
rv*fs
urv
-1.0
-0.5
0.0
0.5
1.0
Year
cs*ld
cs*n
mcs
*nsu
cccs
*msu
rvcs
*fsu
rvld
*nm
ld*n
succ
ld*m
surv
ld*fs
urv
nm*n
succ
nm*m
surv
nm*f
surv
nsuc
c*m
surv
nsuc
c*fs
urv
msu
rv*fs
urv
-1.0
-0.5
0.0
0.5
1.0
Cor
rela
tion
(mea
n +/
- 95%
ci)
Nestbox
cs*ld
cs*n
mcs
*nsu
cccs
*msu
rvcs
*fsu
rvld
*nm
ld*n
succ
ld*m
surv
ld*fs
urv
nm*n
succ
nm*m
surv
nm*f
surv
nsuc
c*m
surv
nsuc
c*fs
urv
msu
rv*fs
urv
-1.0
-0.5
0.0
0.5
1.0
Male
cs*ld
cs*n
mcs
*nsu
cccs
*msu
rvcs
*fsur
vld
*nm
ld*n
succ
ld*m
surv
ld*fs
urv
nm*n
succ
nm*m
surv
nm*fs
urv
nsuc
c*m
surv
nsuc
c*fs
urv
msu
rv*fs
urv
-1.0
-0.5
0.0
0.5
1.0
Female-1.0
-0.5
0.0
0.5
1.0
cs*ld
cs*n
mcs
*nsu
cccs
*msu
rvcs
*fsur
vld
*nm
ld*n
succ
ld*m
surv
ld*f
surv
nm*n
succ
nm*m
surv
nm*fs
urv
nsuc
c*m
surv
nsuc
c*fs
urv
msu
rv*f
surv
Trait
Observation
a)
f)e)
d)c)
b)
37