Embed Size (px)
Citation preview

International Research Journal of Environment Sciences________________________________ ISSN 2319–1414
Vol. 3(10), 32-37, October (2014) Int. Res. J. Environment Sci.
International Science Congress Association 32
Particle Size Analysis of Soils and Its Interpolation using GIS Technique
from Sangamner Area, Maharashtra, India
Keshav K. Deshmukh1 and
Sainath P. Aher
2
1Department of Chemistry, S. N. Arts, D.J. Malpani Commerce and B.N. Sarda Science College, Sangamner, Dist. Ahmednagar, MS, INDIA 2 Department of Geography, S. N. Arts, D.J. Malpani Commerce and B.N. Sarda Science College, Sangamner, Dist. Ahmednagar, MS, INDIA
Available online at: www.isca.in, www.isca.me Received 23th July 2014, revised 31st August 2014, accepted 15th September 2014
Abstract
Soil is a substantial resource and displays adaptable physical, chemical, mineralogical, hydrological and geochemical
properties. Particle size of any soil determines the productivity of crops. The soil textural distribution information is important for
planning agriculture crop production, irrigation management, hydrological analysis and soil characteristics determination.
However, high resolution soil particle information obtaining through manually field survey is time consuming and expensive. In
view of this studies were carried out to know the particle size characteristics of soil in relation to soil textural and fertility status
of Sangamner area of Ahmednagar district in Maharashtra. For this purpose particle size analysis (PSA) was determined from
62 soil samples and interpolated in Geographic Information System (GIS) software using kriging method. It gave the micro level
particle size analysis information at enough and accurate scale. These information will become important in contribute to the
societal demands and sustainable soil management in study area.
Keywords: Particle size analysis (PSA), GIS, Interpolation, Kriging Method.
Introduction
The earth environment accomplish by soil which is considered as
the skin of the earth. It has interfaces with the lithosphere,
hydrosphere, atmosphere, and biosphere. The Particle size analysis
(PSA) is expressed in classes of which the relative properties can be
summed up in the form of triangular diagram enabling the texture
of a soil sample. Soil texture is one of the important properties of
soil maps and is defined as relative proportions of clay, sand and
silt contents. Soil texture has an extremely significant influence on
the physical and mechanical behaviours of the soil and on all the
properties related to water content and the movement of water1. Soil
texture directly affects the porosity of soil, which in turn,
determines its water-retention, flow characteristics, rate of water
intake, nutrient-holding capacity and long-term soil fertility2. It also
determines the soil erodibility and thus, affects the risk of soil
erosion. The interaction of soil clay with nutrient ions, water and
organic substances determines the soil fertility, which in turn
largely controlled by the quality and nature of minerals3. Land use
capability and soil management practices are also determined by
the texture. Spatial distribution and surface modeling of soil
properties has become a common topic in soil science research4. It
is a useful tool for soil characteristic property interpolation in
precision agriculture and soil management. Many researchers have
studied the soil textural characteristic and its interpolation using
GIS techniques5-9
.
The soils of Sangamner area mainly derived from the Deccan
basalt. As far as Sangamner area is concerned, it has unique
landforms configuration displaying prohibitive slopes along with
typical climatic condition characterised by scanty and low rainfall.
It forms typical semi-arid-arid ecosystem. Hence, it is more fragile
and prone to degradation even with slight mismanagement. In
general, the soil from the study area shows the presence of calcrete
(both nodular as well as powdery), the mixture of clay, sand and silt
besides the fragments of weathered basalt10
. The area is also
suffering the problem of salinization, alkalization, water logging
etc. due to over irrigation, excess use of chemical fertilizer and
intensive cultivation11
. There is few published literature available
on the PSA and its interpolation feature of Sangamner area. In view
of this, it was decided to study PSA of soils and its interpolation
using GIS techniques for pedological, hydrological and
agronomical interpretation of soil in study area.
The Study Area: Geographically present area located in
Sangamner Tehsil of Maharashtra around the Pravara river bank.
The extent of study area is 19° 26' 02.67" to 19° 39' 51.59" north
latitude and 74° 03' 14.49" to 74° 23' 17.60" east longitude (Fig.1).
The area is drained by the Pravara River which originates in the
mountainous region of Ratangarh and flows into low-lying fertile
alluvial plain in the downstream part (mature stage)12
. The study
area is located close to the Western Ghats Escarpment (WGE). This
area has moderate relief and the soil formed from weathering
process of basalt. The basalt flows are nearly flat-lying (the
sequence has a regional southerly dip of 0.5°– 1°) and mainly
belong to the Thakurvadi Formation (Fm.) of the Kalsubai
subgroup. Extensive colluvio-alluvial deposits (locally up to 30 m.
thick) of the late quaternary Pravara formation overlie the basalts
along the Pravara River and its tributaries13
. The textural variation
in the study area is due to the wide-ranging physiographic
dissimilarity, which is responsible to differentiates soils
characteristics.

International Research Journal of Environment
Vol. 3(10), 32-37, October (2014)
International Science Congress Association
Material and Methods
For the analysis of particle size of soils field soil survey was
carried out with geographical earth coordinates points for 62
soil samples. The surface soil samples (0-20cm) were colle
(Fig 2) in cloth bags as per the standard procedure
samples are from irrigated and 13 from non
Quartering technique was used for preparation of soil samples.
The samples were dried in air and passed through 2 mm sieve
and stored in cloth bags. The textural analysis was done by
using International Pipette Method16,17
. The PSA data obtained
is presented in Table 1. The soil classification information
related to study area is extracted from soil sheet of Maharashtra
using digitization method in GIS software. The
characteristics information of samples was processed in GIS
software using kriging method. Kriging is
gridding method that produces visually appealing maps from
irregularly spaced data18
. The Kriging method is based on
statistical models that include autocorrelation (the statistical
relationship among the measured points)
Analyst uses sample points taken at different locations in a
landscape and interpolates a continuous surface. Kriging is an
advanced, computationally intensive, geostatistical estimation
method that generates an estimated surface from a scattered set
of points with z-values20
. Continues textural analysis maps
(Fig.3) of study area were prepared using kinging's smoothing
interpolator and default linear variogram function in GIS
software.
Results and Discussion
Particle size analysis of soils: The clay co
9.51 to 53.61 %which is shown in Table No. 1. The downstream
part and in Ojhar weir area (S1, S2, S3, S4, S5, S8, S9, S10,
Environment Sciences________________________________________
International Science Congress Association
Figure-1
Location map of study area
For the analysis of particle size of soils field soil survey was
carried out with geographical earth coordinates points for 62
20cm) were collected
cloth bags as per the standard procedure14,15
. 49
samples are from irrigated and 13 from non-irrigated areas.
Quartering technique was used for preparation of soil samples.
The samples were dried in air and passed through 2 mm sieve
The textural analysis was done by
. The PSA data obtained
soil classification information
related to study area is extracted from soil sheet of Maharashtra
using digitization method in GIS software. The textural
characteristics information of samples was processed in GIS
is a geostatistical
gridding method that produces visually appealing maps from
Kriging method is based on
statistical models that include autocorrelation (the statistical
relationship among the measured points)19
. Geostatistical
Analyst uses sample points taken at different locations in a
landscape and interpolates a continuous surface. Kriging is an
advanced, computationally intensive, geostatistical estimation
method that generates an estimated surface from a scattered set
. Continues textural analysis maps
(Fig.3) of study area were prepared using kinging's smoothing
interpolator and default linear variogram function in GIS
The clay content varies from
9.51 to 53.61 %which is shown in Table No. 1. The downstream
part and in Ojhar weir area (S1, S2, S3, S4, S5, S8, S9, S10,
S12, S14, S15, S16 and S33) belong to predominant clay and
clay loam type of soil. This may be due to inadequate d
and unsuitable geography and siltation at Ojhar weir (
In addition to this, higher clay content may be owing to the
presence of alluvial deposits showing low infiltration. The silt
content of the soils varies from 10.8 to 33%. It was als
observed that the irrigated and low elevation area (S6, S9, S12,
S13, S14 and S16) showed higher silt content. The fine sand and
coarse sand ranged from 6.1 to 59.24% and 3.70 to 33.31%
respectively. In the downstream part of Ojhar weir (S21, S23,
S24, S29, S39, S43 and S60) were noticed with higher content
of these sands. However, low values were observed in the part
of plain topography, which is characterized by alluvial
lithology. Similar results were also obtained by the
researchers21,22
for the soils from the area which is in close
vicinity to the present area. This observation is also evidenced
by cation exchange capacity values of the study area
The distribution of particle size influences the moisture
retention and transmission properties of so
that, coarse textured soils have low moisture retention and high
permeability whereas fine textured soils have high moisture
retention and low permeability23
summarize that the soils which having high clay cont
S3, S4, S5, S7, S8, S9, S10, S16 and S20) will show low
permeability. The clay fraction contains larger alumino
and has higher content of humus. Therefore, the properties of
soils are affected by clay content rather than silt and sand
particle. The clay content is also characterized by a higher
charge density per unit surface24
. One of the important factors
affecting the chemical properties of soils in the study area may
be due to higher proportion of the clay content
_______________________________ ISSN 2319–1414
Int. Res. J. Environment Sci.
33
S12, S14, S15, S16 and S33) belong to predominant clay and
clay loam type of soil. This may be due to inadequate drainage
and unsuitable geography and siltation at Ojhar weir (figure-1).
In addition to this, higher clay content may be owing to the
presence of alluvial deposits showing low infiltration. The silt
content of the soils varies from 10.8 to 33%. It was also
observed that the irrigated and low elevation area (S6, S9, S12,
S13, S14 and S16) showed higher silt content. The fine sand and
coarse sand ranged from 6.1 to 59.24% and 3.70 to 33.31%
respectively. In the downstream part of Ojhar weir (S21, S23,
29, S39, S43 and S60) were noticed with higher content
of these sands. However, low values were observed in the part
of plain topography, which is characterized by alluvial
lithology. Similar results were also obtained by the
from the area which is in close
vicinity to the present area. This observation is also evidenced
by cation exchange capacity values of the study area11
.
The distribution of particle size influences the moisture
retention and transmission properties of soils. This is to say
that, coarse textured soils have low moisture retention and high
permeability whereas fine textured soils have high moisture 23
. In view of this, it can
summarize that the soils which having high clay content (S2,
S3, S4, S5, S7, S8, S9, S10, S16 and S20) will show low
permeability. The clay fraction contains larger alumino–silicates
and has higher content of humus. Therefore, the properties of
soils are affected by clay content rather than silt and sand
article. The clay content is also characterized by a higher
. One of the important factors
affecting the chemical properties of soils in the study area may
be due to higher proportion of the clay content11
.
International Research Journal of Environment Sciences______________________________________________ ISSN 2319–1414
Vol. 3(10), 32-37, October (2014) Int. Res. J. Environment Sci.
International Science Congress Association 34
Table-1
Particle size analysis of the soils from the study area
Soil
Sample Latitude (Degree decimal)
Longitude (Degree
decimal)
Particle size distribution (%) Soil Class
Coarse sand Fine sand Silt Clay
S1 19.5541 74.2542 6.08 24.92 21.6 46.75 Clay
S2 19.5531 74.2605 8.48 29.92 15.35 45.73 Clay
S3 19.5516 74.2651 13.28 28.4 12.2 40.53 Clay
S4 19.5441 74.2664 19.88 13.22 21.1 39.48 Clay loam
S5 19.5477 74.2715 14.32 10.86 25.17 43.93 Clay
S6 19.5465 74.2918 9.48 20.88 32.15 31.98 Clay loam
S7 19.5510 74.2846 18.21 23.12 15 42.18 Clay
S8 19.5541 74.2925 16.52 17.97 22.07 37.43 Clay loam
S9 19.5599 74.2847 7.29 16.17 29.08 41.33 Clay
S10 19.5660 74.2801 28.08 6.07 20.87 39.83 Clay loam
S11 19.5446 74.2993 5.01 14.33 31.15 43.53 Clay
S12 19.5578 74.3138 14.62 25.54 30.15 28.06 Clay loam
S13 19.5618 74.3074 3.52 12.05 26.82 50.23 Clay
S14 19.5511 74.3129 9.51 22.24 26.37 35.68 Clay loam
S15 19.5663 74.2691 31.65 9.81 18.22 37.16 Clay loam
S16 19.5741 74.2775 11.21 27.93 33.3 29.51 Clay loam
S17 19.5750 74.2852 6.57 14.11 21.17 51.03 Clay
S18 19.5290 74.3053 5.48 15.52 26.6 44.93 Clay
S19 19.5368 74.3116 12.45 33.62 15.72 43.18 Clay
S20 19.5429 74.3324 2.15 15.75 23.42 52.33 Clay
S21 19.5305 74.3225 32.68 36.81 13.73 13.51 Sandy loam
S22 19.5255 74.3729 27.67 16.6 19.35 31.71 Sandy clay loam
S23 19.5284 74.3858 15.52 42.76 16.65 20.58 Sandy clay loam
S24 19.5104 74.3464 22.02 42.79 12.42 18.11 Sandy loam
S25 19.5252 74.3596 7.31 16.35 20.12 49.71 Clay
S26 19.5268 74.3455 5.30 15.55 23.35 51.03 Clay
S27 19.5140 74.3302 33.31 27.67 13.35 21.04 Sandy clay loam
S28 19.5053 74.3053 18.25 28.51 19 29.09 Sandy clay loam
S29 19.4801 74.2834 21.26 40.13 14.55 19.38 Sandy loam
S30 19.5146 74.2672 32.78 20.06 12.65 29.26 Sandy clay loam
S31 19.5235 74.2544 17.08 22.62 14.52 39.31 Sandy clay
S32 19.5206 74.2245 6.292 19.91 23.4 42.61 Clay
S33 19.5606 74.2333 7.127 11.35 20.65 53.16 Clay
S34 19.5464 74.2361 3.22 22.71 28.15 37.56 Clay loam
S35 19.5353 74.2518 10.17 19.6 10.67 51.57 Clay
S36 19.5485 74.2201 13.28 33.29 24.4 32.73 Clay loam
S37 19.5376 74.2124 6.647 23.56 15.57 48.06 Clay
S38 19.5548 74.2122 11.67 34.88 21.97 27.03 Clay loam
S39 19.5099 74.1908 25.104 41.25 12.12 17.78 Sandy loam
S40 19.4927 74.1849 19.086 33.56 18.35 22.91 Sandy clay loam
S41 19.5052 74.2058 19.094 31.54 14.27 26.81 Sandy clay loam
S42 19.5405 74.1841 9.935 37.28 23.426 24.61 Sandy clay loam
S43 19.5313 74.1450 7.317 41.96 11.87 33.11 Sandy clay loam
S44 19.5264 74.1279 11.983 32.76 14.87 34.93 Sandy clay loam
S45 19.4914 74.0922 4.143 34.75 11.22 41.56 Sandy clay
S46 19.5116 74.0879 7.559 53.32 22.07 12.28 Sandy loam
S47 19.4721 74.0923 9.139 51.83 16.15 18.01 Sandy loam
S48 19.5369 74.0912 6.592 35.87 20.15 32.11 Sandy clay loam

International Research Journal of Environment
Vol. 3(10), 32-37, October (2014)
International Science Congress Association
S49 19.5407
S50 19.5658
S51 19.5332
S52 19.5842
S53 19.5449
S54 19.5481
S55 19.5494
S56 19.5620
S57 19.5911
S58 19.5845
S59 19.6039
S60 19.5837
S61 19.5739
S62 19.5665
Types of soils and sampling points in the study area
GIS mapping of the soils: Soil classification information
related to study area was extracted from soil sheet of
Maharashtra (Sheet No. 1, scale: 1:50000). It has
1996 by Survey of India (SOI)25
. This soil sheet was
Georeferanced in GIS software for the accurate predic
soil particle. Georefrancing is needed for the correction of
geometrically distorted image in applied form. The process of
Georefrancing is to transfers the distorted image co
the specific map projection. This could be thought of as
involving recovering the correct geometry and image to map
registration i.e. transforming the image coordinates system to a
particular map coordinates system26
. GIS is the powerful tool,
which offer to the data storing, manipulation, management
Environment Sciences________________________________________
International Science Congress Association
74.1020 12.846 36.87 16.05
74.0983 18.03 45.97 12.95
74.1176 4.33 19.39 22.52
74.1336 11.28 50.03 16.93
74.1392 21.12 41.34 16.1
74.1718 10.372 26.884 18.12
74.1511 3.696 29.51 23.87
74.1905 6.117 33.33 20.27
74.1744 4.23 31.55 12.37
74.2141 2.199 28.66 13.75
74.2422 4.777 28.35 10.87
74.3153 19.932 49.24 7.875
74.3145 11.266 34.59 10.8
74.3679 6.595 29.1515 12.2
Figure 2
Types of soils and sampling points in the study area
Soil classification information
related to study area was extracted from soil sheet of
Maharashtra (Sheet No. 1, scale: 1:50000). It has published in
. This soil sheet was
Georeferanced in GIS software for the accurate prediction of
soil particle. Georefrancing is needed for the correction of
geometrically distorted image in applied form. The process of
Georefrancing is to transfers the distorted image co-ordinates to
the specific map projection. This could be thought of as
volving recovering the correct geometry and image to map
registration i.e. transforming the image coordinates system to a
. GIS is the powerful tool,
which offer to the data storing, manipulation, management
displaying functions within minimum time. Therefore, any
spatial mapping, data analysis and base map preparation at
precise level became calmer due to GIS environment
the soil sheet information soil of plains and valley is observed
around the Pravara River banks, which has high deepness due to
river flood plain. Maximum samples of soils were collected
from these plains and valley types of clay soils, which show the
high salinity. The soils of undulating land belts slightly away
from river bank; shows slightly deepness and moderate textural
structure. The soils of plains is generally loamy soils on gently
sloping plain with moderate erosion, which is located in the
northern part of area at the eastern slope of hilly region. The
soils of undulating lands with mesas
_______________________________ ISSN 2319–1414
Int. Res. J. Environment Sci.
35
28.36 Sandy clay loam
19.73 Sandy loam
48.58 Clay
17.91 Sandy loam
17.86 Sandy loam
40.36 Clay loam
38.68 Clay loam
33.68 Clay loam
45.26 Clay
46.93 Clay
46.56 Clay
19.51 Sandy loam
35.51 Sandy clay
44.56 Clay
nctions within minimum time. Therefore, any
spatial mapping, data analysis and base map preparation at
precise level became calmer due to GIS environment27
. From
soil of plains and valley is observed
s, which has high deepness due to
river flood plain. Maximum samples of soils were collected
from these plains and valley types of clay soils, which show the
oils of undulating land belts slightly away
epness and moderate textural
structure. The soils of plains is generally loamy soils on gently
sloping plain with moderate erosion, which is located in the
northern part of area at the eastern slope of hilly region. The
soils of undulating lands with mesas and buttes observed the
International Research Journal of Environment Sciences______________________________________________ ISSN 2319–1414
Vol. 3(10), 32-37, October (2014) Int. Res. J. Environment Sci.
International Science Congress Association 36
low water holding capacity due to courses and nature, which
showed low salinity and sodicity (figure-2).
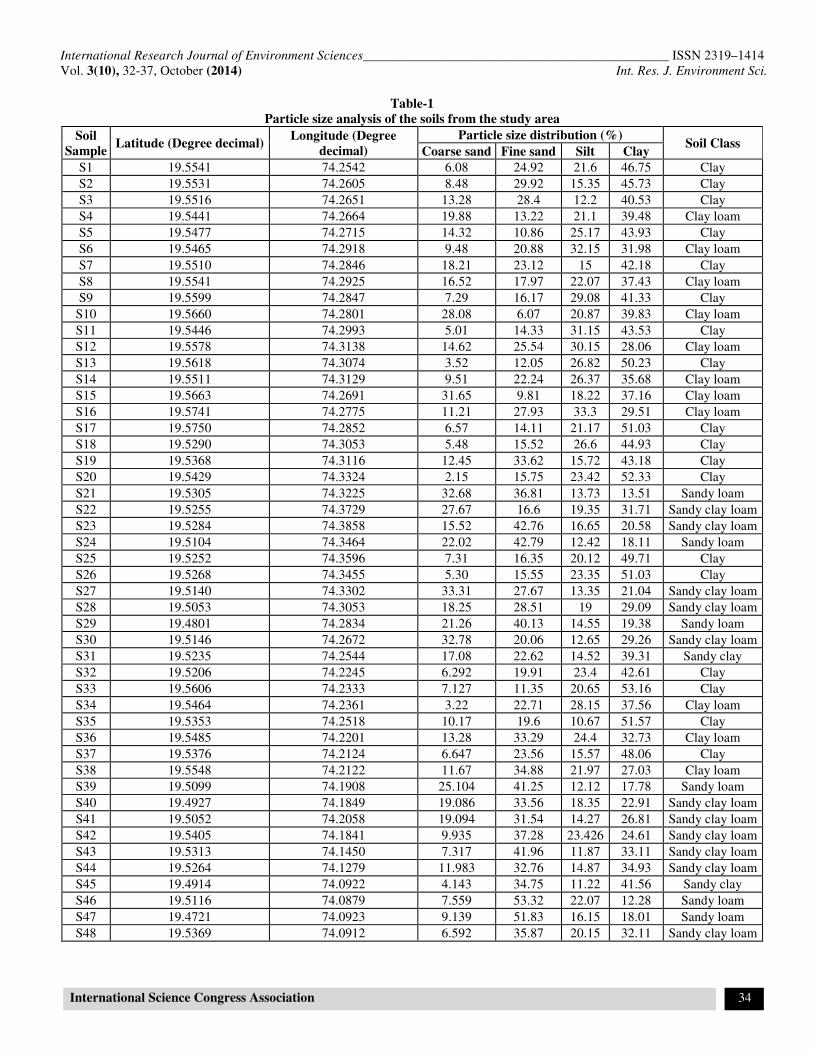
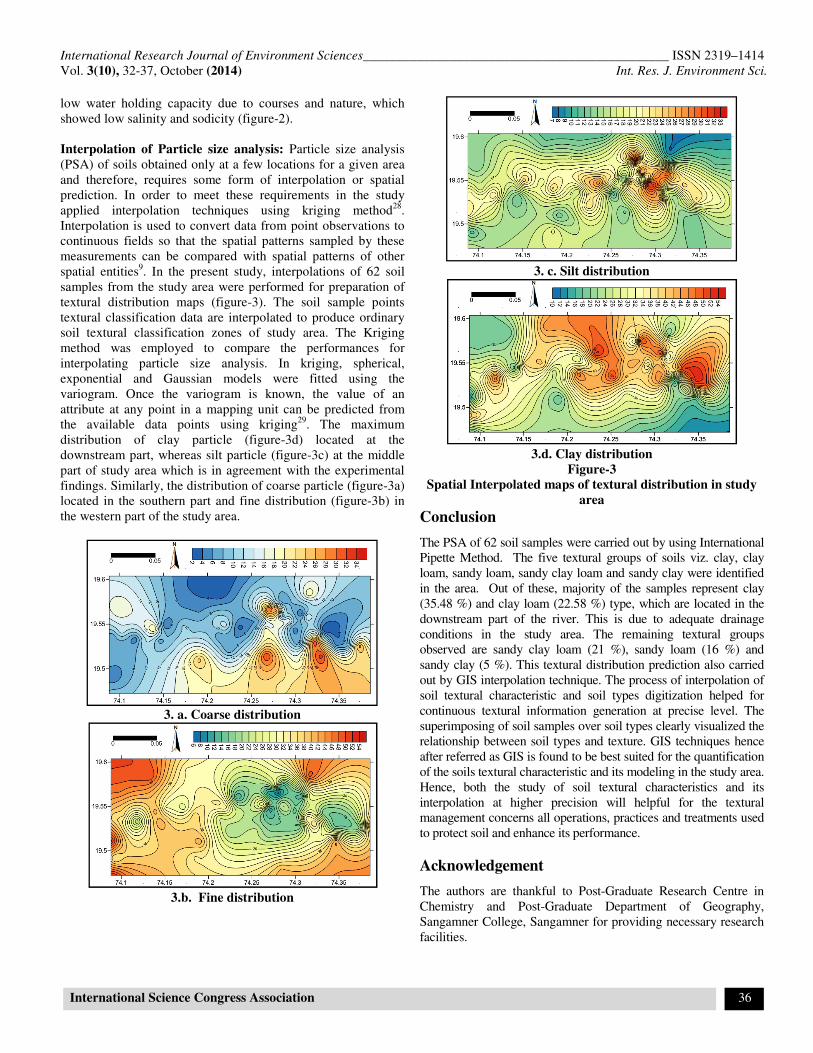
Interpolation of Particle size analysis: Particle size analysis
(PSA) of soils obtained only at a few locations for a given area
and therefore, requires some form of interpolation or spatial
prediction. In order to meet these requirements in the study
applied interpolation techniques using kriging method28
.
Interpolation is used to convert data from point observations to
continuous fields so that the spatial patterns sampled by these
measurements can be compared with spatial patterns of other
spatial entities9. In the present study, interpolations of 62 soil
samples from the study area were performed for preparation of
textural distribution maps (figure-3). The soil sample points
textural classification data are interpolated to produce ordinary
soil textural classification zones of study area. The Kriging
method was employed to compare the performances for
interpolating particle size analysis. In kriging, spherical,
exponential and Gaussian models were fitted using the
variogram. Once the variogram is known, the value of an
attribute at any point in a mapping unit can be predicted from
the available data points using kriging29
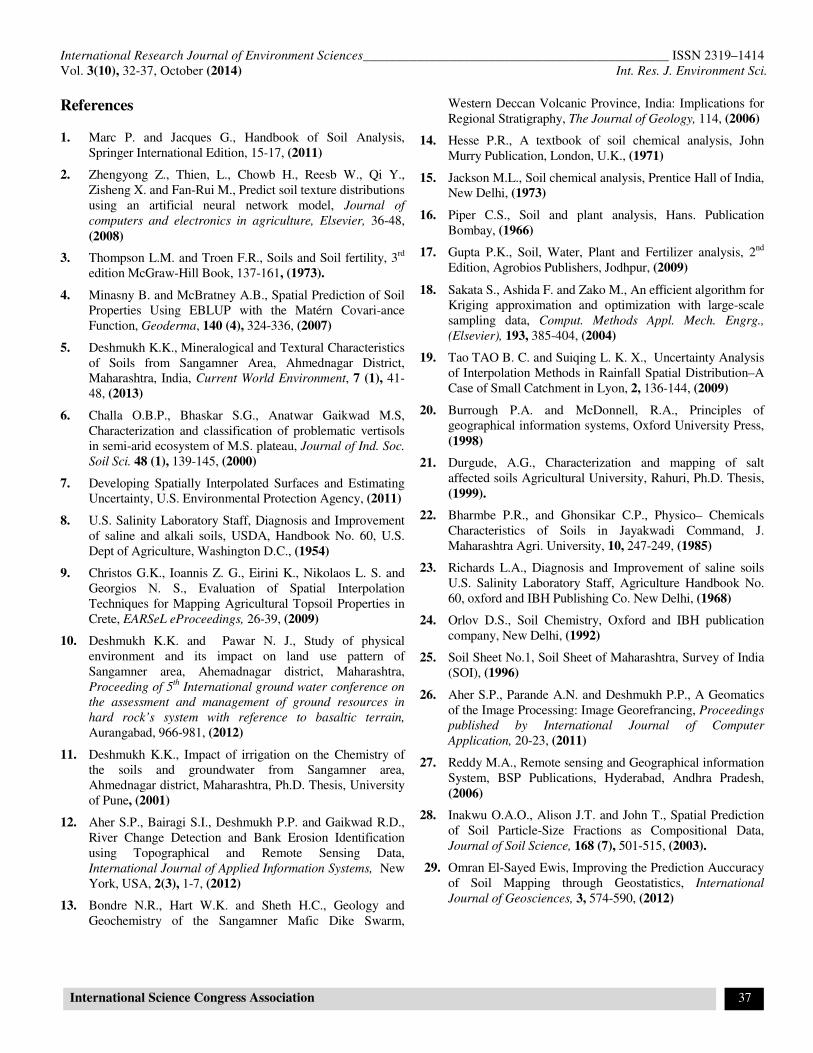
. The maximum
distribution of clay particle (figure-3d) located at the
downstream part, whereas silt particle (figure-3c) at the middle
part of study area which is in agreement with the experimental
findings. Similarly, the distribution of coarse particle (figure-3a)
located in the southern part and fine distribution (figure-3b) in
the western part of the study area.
3. a. Coarse distribution
3.b. Fine distribution
3. c. Silt distribution
3.d. Clay distribution
Figure-3
Spatial Interpolated maps of textural distribution in study
area
Conclusion
The PSA of 62 soil samples were carried out by using International
Pipette Method. The five textural groups of soils viz. clay, clay
loam, sandy loam, sandy clay loam and sandy clay were identified
in the area. Out of these, majority of the samples represent clay
(35.48 %) and clay loam (22.58 %) type, which are located in the
downstream part of the river. This is due to adequate drainage
conditions in the study area. The remaining textural groups
observed are sandy clay loam (21 %), sandy loam (16 %) and
sandy clay (5 %). This textural distribution prediction also carried
out by GIS interpolation technique. The process of interpolation of
soil textural characteristic and soil types digitization helped for
continuous textural information generation at precise level. The
superimposing of soil samples over soil types clearly visualized the
relationship between soil types and texture. GIS techniques hence
after referred as GIS is found to be best suited for the quantification
of the soils textural characteristic and its modeling in the study area.
Hence, both the study of soil textural characteristics and its
interpolation at higher precision will helpful for the textural
management concerns all operations, practices and treatments used
to protect soil and enhance its performance.
Acknowledgement
The authors are thankful to Post-Graduate Research Centre in
Chemistry and Post-Graduate Department of Geography,
Sangamner College, Sangamner for providing necessary research
facilities.
International Research Journal of Environment Sciences______________________________________________ ISSN 2319–1414
Vol. 3(10), 32-37, October (2014) Int. Res. J. Environment Sci.
International Science Congress Association 37
References
1. Marc P. and Jacques G., Handbook of Soil Analysis,
Springer International Edition, 15-17, (2011)
2. Zhengyong Z., Thien, L., Chowb H., Reesb W., Qi Y.,
Zisheng X. and Fan-Rui M., Predict soil texture distributions
using an artificial neural network model, Journal of
computers and electronics in agriculture, Elsevier, 36-48,
(2008)
3. Thompson L.M. and Troen F.R., Soils and Soil fertility, 3rd
edition McGraw-Hill Book, 137-161, (1973).
4. Minasny B. and McBratney A.B., Spatial Prediction of Soil
Properties Using EBLUP with the Matérn Covari-ance
Function, Geoderma, 140 (4), 324-336, (2007)
5. Deshmukh K.K., Mineralogical and Textural Characteristics
of Soils from Sangamner Area, Ahmednagar District,
Maharashtra, India, Current World Environment, 7 (1), 41-
48, (2013)
6. Challa O.B.P., Bhaskar S.G., Anatwar Gaikwad M.S,
Characterization and classification of problematic vertisols
in semi-arid ecosystem of M.S. plateau, Journal of Ind. Soc.
Soil Sci. 48 (1), 139-145, (2000)
7. Developing Spatially Interpolated Surfaces and Estimating
Uncertainty, U.S. Environmental Protection Agency, (2011)
8. U.S. Salinity Laboratory Staff, Diagnosis and Improvement
of saline and alkali soils, USDA, Handbook No. 60, U.S.
Dept of Agriculture, Washington D.C., (1954)
9. Christos G.K., Ioannis Z. G., Eirini K., Nikolaos L. S. and
Georgios Ν. S., Evaluation of Spatial Interpolation
Techniques for Mapping Agricultural Topsoil Properties in
Crete, EARSeL eProceedings, 26-39, (2009)
10. Deshmukh K.K. and Pawar N. J., Study of physical
environment and its impact on land use pattern of
Sangamner area, Ahemadnagar district, Maharashtra,
Proceeding of 5th International ground water conference on
the assessment and management of ground resources in
hard rock’s system with reference to basaltic terrain,
Aurangabad, 966-981, (2012)
11. Deshmukh K.K., Impact of irrigation on the Chemistry of
the soils and groundwater from Sangamner area,
Ahmednagar district, Maharashtra, Ph.D. Thesis, University
of Pune, (2001)
12. Aher S.P., Bairagi S.I., Deshmukh P.P. and Gaikwad R.D.,
River Change Detection and Bank Erosion Identification
using Topographical and Remote Sensing Data,
International Journal of Applied Information Systems, New
York, USA, 2(3), 1-7, (2012)
13. Bondre N.R., Hart W.K. and Sheth H.C., Geology and
Geochemistry of the Sangamner Mafic Dike Swarm,
Western Deccan Volcanic Province, India: Implications for
Regional Stratigraphy, The Journal of Geology, 114, (2006)
14. Hesse P.R., A textbook of soil chemical analysis, John
Murry Publication, London, U.K., (1971)
15. Jackson M.L., Soil chemical analysis, Prentice Hall of India,
New Delhi, (1973)
16. Piper C.S., Soil and plant analysis, Hans. Publication
Bombay, (1966)
17. Gupta P.K., Soil, Water, Plant and Fertilizer analysis, 2nd
Edition, Agrobios Publishers, Jodhpur, (2009)
18. Sakata S., Ashida F. and Zako M., An efficient algorithm for
Kriging approximation and optimization with large-scale
sampling data, Comput. Methods Appl. Mech. Engrg.,
(Elsevier), 193, 385-404, (2004)
19. Tao TAO B. C. and Suiqing L. K. X., Uncertainty Analysis
of Interpolation Methods in Rainfall Spatial Distribution–A
Case of Small Catchment in Lyon, 2, 136-144, (2009)
20. Burrough P.A. and McDonnell, R.A., Principles of
geographical information systems, Oxford University Press,
(1998)
21. Durgude, A.G., Characterization and mapping of salt
affected soils Agricultural University, Rahuri, Ph.D. Thesis,
(1999).
22. Bharmbe P.R., and Ghonsikar C.P., Physico– Chemicals
Characteristics of Soils in Jayakwadi Command, J.
Maharashtra Agri. University, 10, 247-249, (1985)
23. Richards L.A., Diagnosis and Improvement of saline soils
U.S. Salinity Laboratory Staff, Agriculture Handbook No.
60, oxford and IBH Publishing Co. New Delhi, (1968)
24. Orlov D.S., Soil Chemistry, Oxford and IBH publication
company, New Delhi, (1992)
25. Soil Sheet No.1, Soil Sheet of Maharashtra, Survey of India
(SOI), (1996)
26. Aher S.P., Parande A.N. and Deshmukh P.P., A Geomatics
of the Image Processing: Image Georefrancing, Proceedings
published by International Journal of Computer
Application, 20-23, (2011)
27. Reddy M.A., Remote sensing and Geographical information
System, BSP Publications, Hyderabad, Andhra Pradesh,
(2006)
28. Inakwu O.A.O., Alison J.T. and John T., Spatial Prediction
of Soil Particle-Size Fractions as Compositional Data,
Journal of Soil Science, 168 (7), 501-515, (2003).
29. Omran El-Sayed Ewis, Improving the Prediction Auccuracy
of Soil Mapping through Geostatistics, International
Journal of Geosciences, 3, 574-590, (2012)