Embed Size (px)
Citation preview
Ministry of Lands and Natural Resources The Republic of Ghana
Participatory Forest Resource Management Project in the Transitional Zone
(PAFORM)
Participatory Approaches for
Forest Reserve Management
PAFORM Approach and toward its Wide-use
ANNEX 3
How to Solve the Difficulties to Harmonize Items on Manual of Procedures Forest Resource Management Planning and Real Strategic Forest Management Planning in Case of Trial on Tain I Forest Reserve
January 2009
JAPAN INTERNATIONAL COOPERATION AGENCY Sanyu Consultants Inc.
GNO
CR(10)
08-018
No.

0
Recommendations for
MoP
Records existed on Planted areas ( left from 2004 to 2007, right before 1990)
January 2009

1
Preface Ghanaian Forestry Commission made orders to all Regional and District Forest Offices to make Strategic and Operational Forest Management Plan by a forest reserve. The guide lines how to formulate the forest management plans as “Manual of Procedures Forest Resource Management Planning in the High Forest Zone had published on March 1998. The Technical cooperation project between Government of Ghana and Government of Japan on “Participatory Forest Resource Management Project in the Transitional Zone of the Republic Of Ghana (PAFORM)” implemented a activity for formulating a Strategic Forest Management Plan (SFMP) on Tain 1 Forest Reserve in Sunyani District, and requested to modify the Mop to meet real field planners capacity based on the lessen learned. The SFMP had tried to draft following the guide lines of MoP (A2.9.2 Structure of Part 1, A2.10.2 Structure of Part 2, and A2.112 Outline of the structure of part 3), nevertheless to some items of the contents listed on Mop were faced difficulties how to follow the significant meanings that is requested by the Mop. The suggested items on contents list, some cases are not explaining in detail, on some items faced difficulties to meet the requests, because of lacking significant data, therefore, the descriptions that were requested “Measurable objects” could not fulfilled the Mop request, and could only described narrative and general languages of the objectives. A JP expert and members of working Group 1 (Counterparts working group for drafting SFMP) evaluated the drafted SFMP and Mop, and discussed why the drafting team could not fulfill the requested substances and how to solve the difficult situations. In Ghanaian Forestry, Teak plantation had carried since 1930’, and recently Modified Taungya System had introduced to enforce recovering the forest cover on nation lands. Government spends national fund for plantation establishment, and ordered to plant trees with more than 80% of survival ratio. Forestry office allocated lands for community’s Taungya farmer / group and instructed some ha of Teak Planting. In general, many cases of Taungya was implemented by oral instructions made by Forest Officer to Community Taungya farmer’s group, then the group select their favorite sites, and start farming. After three years allowable term of farming, the officer expects that Teak plantation had to be established. The officer reported to district office that the plantation probably established, but no report the location concern had made. After several years passed, then another officer made oral instruction as same as previous officer, then same process were repeated on somewhere. Therefore, district forest office recognize the Teak plantation had established significant area as reported the first forest officer, plus second forest office even if the farmer choice the same place for farming. The recognized gaps between MoP requested and possible descriptions on SFMP linked to originally lack of the significant data, especially Teak planted history, harvested history without location data/map, and not evaluated the results (how many ha of planted areas are remained, and where).This report is trying to identify the background of these difficulties, then to make some advices how to improve. Some technical solutions are introduced through the project activities. Therefore, author expect the introduced techniques such as the measures on GPS for plantation boundary survey and mapping, GIS for aculeate mapping record making and data stocking are effective to improve the difficult situation. June 2008 Mr. Nobumitsu Miyazaki
JICA expert for PAFORM

2
Contents 1. Overview the Mop for strategic plan.. 3
1.1 Why Forest Management Plan is needed, explanation by the MoP 31.2 Purposes of the Forest Management Plan shows on MoP 31.3 How to describe measures for accomplishing the Goals show on MoP 41.4 How to describe measures for accomplishing the Goals show on Mop 41.5 How carry the planning works 41.6 Zoning is a key item for the Management Plan 41.7 Production zone 41.8 Provisional Identification the Beneficiaries of Forest Reserve Management
(A.2.4) 4
1.9 Supportive field investigation 51.10 Provisional management principles by each zone 51.11 Structure of the Strategic management Plan Part 1 61.12 Proposals for future management (Core part of the plan: Part 2) 61.13 Plan for implementation (part 3) 6
2. Evaluation the Draft Strategic Forest Management Plan on Tain 1 Forest
Reserve 7
2.1 Methodology for finding difficulties and proposed direction for solution (recommendation and advice)
7
2.2 Recommendations and Advices 82.2.1 How to grasp the latest situation (Forest Inventory Book making) 82.2.2 GPS and land survey on planting areas at plan and after implemented 29
2.3 How to set up measurable objectives for production and Indicative levels of production (plantation area and conversion area)
32
2.3.1 Over view the MoP requesting for SFMP about the “Measurable Objectives” 322.3.2 How to project the “Measurable Objectives” 332.3.3 How to make Yielding Table 342.3.4 How to project production quality at harvesting time 412.3.5 How to set assumption for log price 422.3.6 Latest Teak forest structure (areas, volume into Age class) 442.3.7 Projection 5 years (term2) past and decide temporal harvesting and planting size 472.3.8 Projection until 30 years future (9 terms) 492.3.9 Harmonize harvesting volume, planting size for stabile and sustainability
management 54
2.3.10 Find the “Measurable objectives” for the SFMP 542.4 What shall be “The Goal” of the SFMP 582.5 Institutional flame for strategic plan formation 592.6 Establish Record keeping principle and standards of Modified Taungya for
avoiding future conflicts 63
2.7 Recommendations for other matters 64 3. MoP Modification 66 Annex-1 Recommendation items identified on the attached evaluation sheet are follows 82Annex-2 Evaluation sheet on Manual of Forest Management Plan formulation 85 *Data DVD mentioned in this report was distributed consedrned FSD staff during of OJT.

3
1. Overview the MoP for Strategic Forest Management plan. Manual of Procedures Forest Resource Management Planning in The HFZ Section A - Strategic Planning (MoP) had published 1998. Since then, many strategic plans on deferent Provinces, districts of Forest Reserves had descried but not so many plans are approved by the higher authorities. The technical cooperation project “Participatory Forest Resource Management Project in the Transitional Zone of the Republic Of Ghana (PAFORM)” also tried to formulate the Strategic Plan for Tain 1 and Nsemere forest reserves based on the MoP. MoP consist three Parts these are Part A1 Introduction to Strategic Planning, A2 Forest Reserve Management Plans, and A3 District (And Regional) Forest Development Plans. Part A1 explaining why the Management Plan is needed for realizing the sustainable forest management. The MoP said “The Manual is a guide to forest officers for preparing and implementing forest resource plans” and “Forest resource management planning is a core activity at the very heart of our new Forest Service” Following paragraphs shows important descriptions how the plan shall be formulated. The MoP requests for the Management Plan drafting through explanation below, nevertheless, some data collection as described below are difficult in real field to collect, especially, latest situation analysis together with location maps. After overview and review the explanations on MoP, the author will point out the difficulties recognized. The difficulties is fund through real Management Plan drafting process, and many sections of the management Plan Tain 1 forest reserve could not decide measurable objectives, expecting forest products quantities (Volume or number of the thinning trees, areas for new planting, how many ha of new plantation shall be allocate for Modified Taungya, etc.. 1.1 Why Forest Management Plan is needed, explanation by the MoP In general, the forests defined as Forest Reserve, are very important asses of nation, therefore, sustain is the most important key word. Government have big interest to maintain the forest in sustainable condition. The management Planning and to get approvals process are key elements to assure the sustainability. Government can only control the forest reserve is managed in sustainable condition or not through approving process of each management plan. The government will not allow over harvest the woods, and NTFPs. The Government never allow the management regime of the forest reserve to threat the substantial flora, fauna, or special natural environment. Stand on General Forestry Science, Forest Management Plan shall be formulated based on the sustainable yielding. It means that the annual harvesting quantity is never exceeded annual growth increment in a management unit. Therefore, Forest management Plan have to explain and assure the planed harvest quantity is same revel of growth increment during the planning periods (for example 10 years) as well as more long times focus (at least one cycle of period of the main harvesting forest (If man made Teak forest is dominant the long term shall be more than 30 years, because, general felling age of planted Teak is 25 or more in transition zone of Ghana). 1.2 Purposes of the Forest Management Plan shows on MoP MoP emphasize that “Strategic planning sets the long term goals for the management of a resource and describes the sort of changes to be enacted in order to achieve the goals”, and “Operational planning defines work program to be undertaken in order to achieve the strategic objectives, especially ensuring that the resource requirements in terms of labor, transport, materials and funds are available at the right time”.

4
The MoP guide that the management plan have to make under the key objectives and guides on national economic development plan/ Forest sector development plan, Ghana national forestry plan etc. The MoP guided on A1.2 1.3 How to describe measures for accomplishing the Goals show on MoP How the planner keeps the national policy, The MoP explain on A.2.3. The explanations are list up the key elements of each national forestry related policy papers. 1.4 Procedures for securing to keep national forestry related policy on MoP MoP A.2.4.1 explains the planning process. Planning process is defining (a). to identify current situation, (b) to recognize the goal that means how to guide the forest to the ideal situation (management object is to manage the forest to a ideal situation to meet the needs of the forest), (c) how to realize benefit for who, (d) how to achieve (substantial measures). Planner shall first identify the reserve area boundary, second to divide the area into several zones such as protection of national and/or regional important natural environment, production for NTFP and woods, then third, to decide measures how to realize the zoned areas to meet the zone set purposes, so explained on MoP A.2.4.2 1.5 How carry the planning works MoP explains on A2.2.2, that planning works are implemented by team. From A.2.2.3 to 2.5 explains functions of the team. The team start the planning works on collecting data (A2.2.3) and list up the needed information including related maps on a table. The table shows that each data shall be prepared by nominated responsible office/officer. Then second to conduct field recognizance (A2.2.4). The field survey shall identify real difficulties such as illegal felling, encroachment, etc. and identify the existed and prepared data are not unreliable. 1.6 Zoning is a key item for the Management Plan Many kind of protection zone are mentioned on MoP, and said “It will be the responsibility of RMSC to produce a provisional zonation map indicating the extent of the timber production area, all the protected areas and any areas currently out of production (convalescence) (2.3.1.2 MoP)” and these map will be prepared using GIS techniques(2.3.1.4 MoP). Basically MoP said, the protection meaning zones are initially guided by the RMSC together with GIS map. MoP 2.3.3 explains each protection zone, definition, objectives, and management regime. 1.7 Production zone Production zone is divided into 5 categories, NTFPs area, Timber production area, Plantation area, Conversion area, and other (endorsed farm). A2.3.4 of MoP explains the each area, definition, and said “Plantation Areas: All major areas of plantations have been mapped and inventoried as part of the national assessment of plantations carried out in 1992-3. But not mapped after the inventory or not the major area. Therefore, MoP requests to the plan making team to conduct field survey and to hold the accurate area, and mapped. 1.8 Provisional Identification the Beneficiaries of Forest Reserve Management (A.2.4) MoP first requests, the planner shall identify the beneficiaries, and mentioned Stool(s) or skin(s), The Government, and Alienation Holders. The management plan is requested to realize their benefits, therefore, the plan have to

5
describe this matter in general principle (share of the revenue) and as well as the projected quantity (probably in means of returning the revenues from forest operation, log selling). On A.2.4.4 of the MoP, Benefit of the local habitants is included their domestic use of NTFPs. The plan also requested to mention (shows principles) the limits or conditions for domestic use of NTFPs If mining right or other land use right are recognized, MoP requested to mention these right, and how to harmonize to the forest operation plans and these permitted right 1.9 Supportive field investigation MoP says RMSC will provide Provincial Forest Classification Map. The planning team shall conduct field survey to harmonize the Forest classification map to the real field condition. (A2.5.3). The standards for convalescence area is “basal area consistently below 15m2/ha is convalescence and may need active assistance on enrichment planting where regeneration is inadequate”. And basal area is consistently below 5 m2/ha be considered as conversion areas. If there are good signs of natural regeneration taking place , the area should be convalescence. Plantation area is needed for verify. The MoP said “The extent of existing plantations are not always well known” and advising that the planner shall conduct field survey, or satellite data interpretation for fixing the latest situation of the planted area. 1.10 Provisional management principles by each zone The MoP explain on A2.6 for each Protection areas and semi-protection area (10 kinds protection areas, Convalescence forest), and A.2.7 also explain for Production zones (Timber production area, NTFP production area, Plantation production area, and Conversion area). MoP request the Management plan shows, (a) Measurable objectives, (b) Management Regimes, (c) Management Prescription, and (d) Right and Responsibility to meet the zone demarcated or setting purposes. The MoP shows principles how the plan have to write these items as (A2.6 Management planning: an over view) :
Measurable Objectives: A measurable objective is prepared to ensure progress and performance can be monitored. The objective should cover quality, quantity and time where applicable.
Management Regimes: The general method of treatment for this management zone. In particular the regime stipulates whether or not logging is permitted.
Management Prescriptions: The prescriptions recommend in more detail the silvicultural and other operations required in this zone to achieve the objective.
Rights and Responsibilities: Specify who has rights in this management zone and who has responsibilities
MoP made detail explanations for each protection zones and production zones. On miserable objectives at least to show, (a) the area(how many ha) with map, (b) how the timber harvest have to be controls. In the protection zone, Management Plan is requested to show the targets how to protect and to maintain the natural environment as the level of protection. It means some indicator and verification standards shall be written such as fauna and flora species diversification if possible. Generally, quality and quantity of the protection objectives are not so simple, therefore it is not easy to put a target situation with countable standards. In case of Production Forest, The plan have to make clear that how many ha of forest can harvest, how m^3 of logs can be harvested, how many ha shall be planted in quantity and quality (timber, pole, low log, others). Even for the NTFP area, at least harvestable size of each main product shall be mentioned in countable units based production size. The harvesting plan have to be mentioned the area, location on the map is basis for the evaluation or Inventory for the next term of management plan making.

6
MoP shows the important standard for log production area, (a) sustainable yielding principle, (b) stabilizing production size principle. Perpetual flow of log means assurance the sustainable production. Stabilizing harvesting will realize averaged revenue and assure the income to the beneficially. Forest management for Local people is explained on MoP A.2.8. In this context the measurable management objectives shall mention the amount of projected revenue, and expected revenue receivers. On management regime, MoP requested to writ the principles for the revenue distribution for the stakeholders especially log harvesting concern. The items requested to write on Local Peoples are listed on A.2.8.3 such as (a) domestic use of NTFP, (b) Commercial collection of NTFP. 1.11. Structure of the Strategic management Plan Part 1 MoP finally requests the items that shall be written on the Strategic Plan from section 1 to Section 9. The MoP said “The composition of Part 1 of the plan can be varied in accordance with local conditions, however the regional teams are strongly recommended to use the following framework where relevant. Notes explaining the content of some of the sections are given in italics” (A.2.9.2) based on the field recognizance and RMSC supported maps. The descriptions are assisted all the relevant information from the national inventories and providing the location maps for Part 1, together with the zonation maps that will be required for compilation of Part 2 MoP requested on Part 1 that the planner shall explain the general situations of the target Forest reserve in section 1 to 4. On section 5 to 7, the Plan shall explain the Past management regimes by divided zones (protection zones and production zones). 1.12 Proposals for future management (Core part of the plan: Part 2) Part 2 is core part of the strategic plan. Based on the latest forest condition that are described on part 1 (past management). The objectives of each zone have to be followed the past objectives, and if the objectives changed, the planner have to explain the changed part and reasons. MoP listed items of part 2 almost same topics (Measurable objectives, Management Regimes, Management prescriptions, and right and responsibility) for each zones (protection area, production area) and Management for local people. 1.13. Plan for implementation (part 3) Part 3 is prepared for implementing masers for the described plans on Part 2. MoP instructed to the planner to explain substantial methods in the scope of administration, and monitoring. It is requested to describe, needed infrastructure, administration organize, finance, and measures for monitoring.

7
2. Evaluation the Drafted Strategic Forest Management Plan on Tain 1 Forest Reserve 2.1 Methodology for finding difficulties and proposed direction for solution (recommendation and advice) PAFORM made a Strategic Forest Management Plan on Tain 1 Forest Reserve in Sunyani District. The Planning team discussed and drafted the descriptions. During these discussions, WG 1 (Drafting Group) could not answer the requirement that probably MoP requested in many sections of the planning items. The difficulties facing matters are mainly connected for drafting measurable objectives. Quantity (how many ha of planting is expected, how many ha of Teak Plantation can or need for thinning are difficult to calculate, and could not mentioned these target part on the Map. The latest Forest Conditions are not sure. Planted area may be the same meaning as annually planed target area, and not fix the area and locations on the coordination system defined map (shows the positions on the Globe) after the annual plan carried. More over, frequent bush fire destroyed some part of planted areas, but no places are recorded. Planting plan map/sketch is kept but remaining planted area now is unknown. The Strategic Forest Management Planning (SFMP) work is carried based on the broad knowledge of forest including forest management standards, ecological information for natural and planting species, socio-economical information of surrounding communities, and related data, that are including yielding prediction measures (yielding table of Teak), tree volume estimation standards (Teak stand volume table), general standards for harvesting, logging operation guideline, planting standards for ordinary planting or by Taungya, scientific information of natural tree species, flora and fauna for needed protection such as Red Book, geological and soil knowledge, etc. Un fortunately, in case for drafting the Tain 1 SFMP, expected data and information are not adequate, or not authorized, and many items related to the past management results, incidents results affected the forest condition such as wild fire, illegal felling, occupation, etc are complicated and not telling the real situation on the ground. Especially, these past management records are not shown on the coordination defined Maps. Fore evaluating the Drafted SFMP, first, examined the description of all items on SFMP to compeer with the MoP explanations item by item. Then second, author detected some descriptions are not full filled the MoP request. There are some gaps between SFMP Tain 1 and MoP; hence, third, discussed about, what the real reason that the SFMP writer could not made the quantitative explanations. Author recognized the real reasons on back ground conditions such as why they could not obtained data especially related to the past management results. The detail analyzed result is on the Annex-2 and 3 attached. Therefore, author proposed some technical measures to change the difficult situation on the next sections. Off cause, only technical solutions proposed may not enough for solving problems. There need many things to support the technicians to carry the expected jobs, to prepare suitable conditions to use the technical solutions to apply the real fields such as Governmental strong will, assign capable staff, prepare needed tools, and supply the needed budget for the stuff working. Even so, the author has a hope, that to recognize the real situation why the field staff did not produce suitable SFMP is the important first step. This report will give meaningful impacts to higher authorities concern, and they will move if they really believing that SFMP is the “Forest resource management planning is a core activity at the very heart of our new Forest Service” declared on the MoP.
8
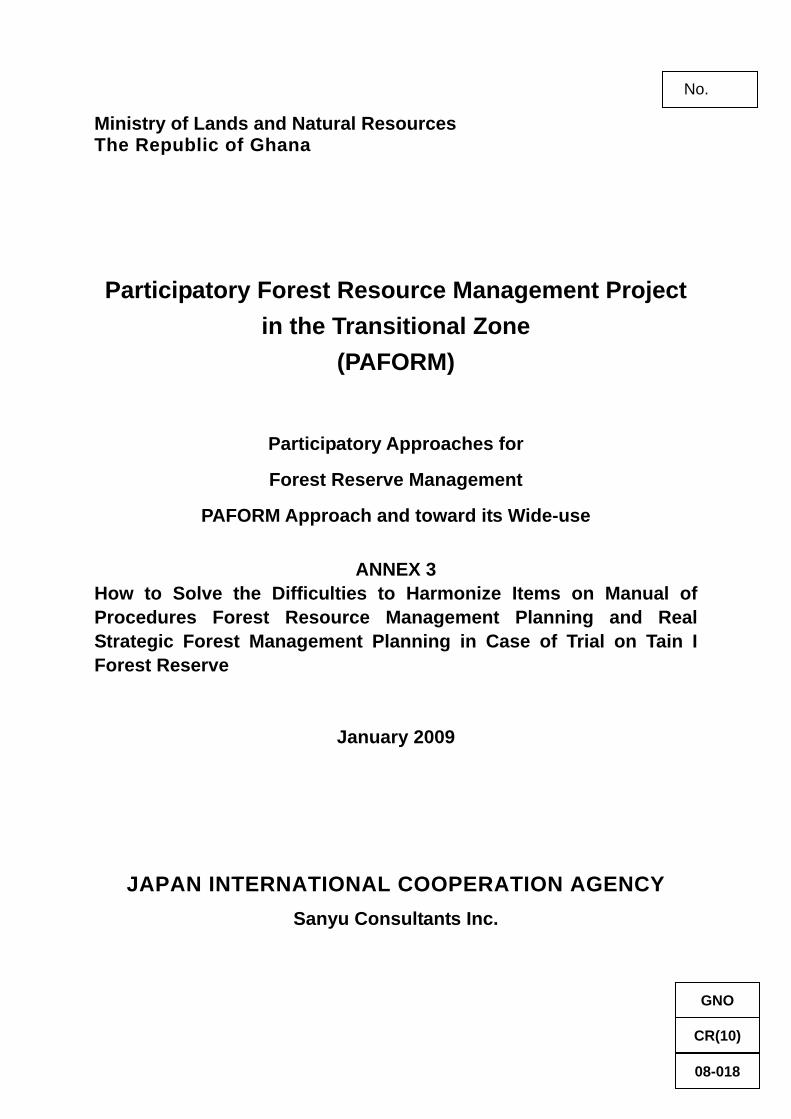
2.2. Recommendations and Advices 2.2.1 How to grasp the latest situation (Forest Inventory Book making) Author mentioned that existed data and information prepared by the District Forest Office are in adequate. In general, formulating a SFMP, planner starts to hold the latest situation of the target Forest Reserve. Planner exam/evaluate the existed forest inventory book that was made on the previous planning time. And grasp the changes occur by management operations, by natural disasters, by human errors, by un-predictable reason, etc. The new Forest Inventory Book will be made. Planner shall set up measurable management objectives, management regimes, and Management prescriptions based on the latest forest situation. In real fields in Ghana (In transition zone especially Teak plantation is the main management measured area) to conduct land survey for planting planed area, planted area, damaged area had not carried on in past more than 10 years, therefore, field officers could not identify the planted areas boundary locations on the map. The author’s experienced to face the difficulties to find exact location and area of the Tain 1. The Forest Reserve Tain 1 delineated on a geographic map (1/50,000) is not fit to the GPS readings of the boundary pillars positions. To grasp the latest situation of a reserve following works shall be implemented by the responsible organization such as RMSC. The substantial technical solutions are recommended. Following paragraphs shall try to introduce the measures. (1) Boundaries of the Forest Reserve For the SFMP formulating, MoP requested to write area location with map (surrounding towns, roads, administrative boundary shall be mentioned). The location and area with boundary line on the map is starting point to define the Forest Reserve. Fig-1-1 shows the location on the topographic map that was made land survey authority. The total area is reported 3056 ha. Figure 1.2 is plantation history map provided FSD. Above 2 maps show quite different shape of the boundary, distance to the national roads, angle of the figure, etc. Figure 2.2.1 Tain 1 on the Topographic map Figure 2.2.2 Tain 1 FSD sketch map

9
Which shape is collect? On the boundary of the Forest Reserve, stone pillars were mined. These pillars were set every corner of the direction changing, and the 800m point if the one direction of one side exceeds 800m. The land survey data of those pillars mining are not founded. A simple sketch map only presented. The MoP requested to show the location map, area map, but in the field situation, FSD office have no records of Boundary pillar location (coordination points under Longitude and Latitude or WGS-84 or Authorized Ghana County Coordination System), and no map shows the Reserve location by means of position on the grove.. For fixing the location, PAFORM conducted field survey using GPS and read/record the GPS (longitude and Latitude). The result sent to computer using a soft wear that are attached with the machine (Map source Garmin). The points so called “way points” are exported to Excel table, and recalculate the data from dd-mm-ss (60 unit system) to 10 unit (dd.xxxxxx) Degree. The 10 unit degree data of Latitude and Longitude inserted to GIS Map (What is GIS map shall explain later) to use one of the GIS software function. The existed pillars positions are drown on the Map. The boundary line was made to connect these pillar points, then the reserve’s location and area was fixed on the map. Area was calculated automatically by using one of the functions of the GIS. The results show on figure-1.4, 1.5 1.6 and 1.7 and are recorded on the Forest Inventory book as supplement data book (separate volume) of this report. The area territory of the reserve is defined to connect pillar position on the GIS Map; nevertheless, some pillars are missing; therefore, missing parts are filled taking in to account other maps shape and satellite imagery (outside of the reserve occupied by farm or grass is general, and inside of the reserve trees remaining boundary can project by the imagery). It tells, even the GPS survey conducted, some missing pillar parts are not defined as accurate. If
Figure 2.2.3 Boundary Pillar
Figure 2.2.4 Pillar positions on GIS Map Figure 2.2.5 shows Latitude and Longitude

10
you need more, you have to find boundary line and read the points compensate the missing pillars.
The location index map requested by MoP had also made using same data (GIS Map), and shows on the f orest inventory book as below figure 1.8
Figure 2.2.6 Tain 1 Forest Reserve Location and area Map by GIS
Figure 2.2.7 Comparison GIS map and Topographic map Tain 1 boundary
Boundary line based on the GPS data Boundary lines on Topographic Map

11
3.1.2 Compartment system
Figure 2.2.8 Tain 1 Forest Reserve Location Map produced by GIS
Figure 2.2.9 Tain 1 boundary pillar location data (Longitude and Latitude)
12
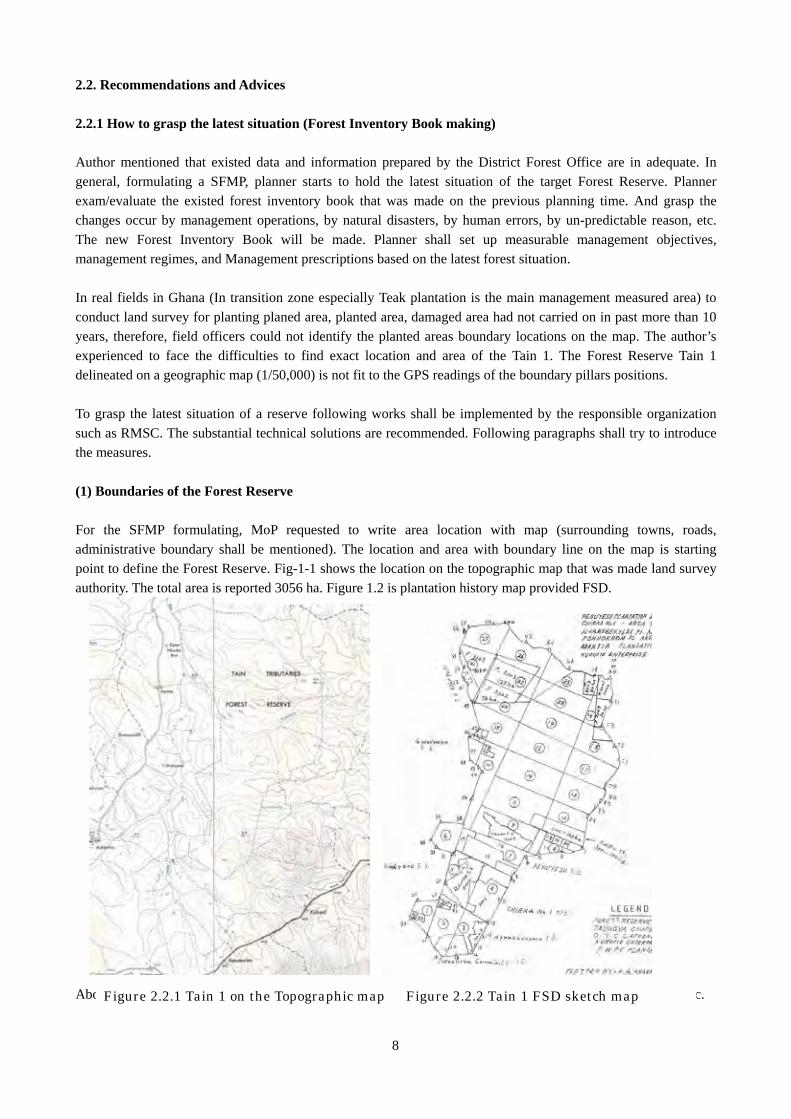
Note: The Soft were “Map Source” is standard one. This generally soled with Garmin GPS. The operation
measures are simple. You need to check the machine have I/O port to PC (using USB connecter is advisable). Way points list table can export as a text file, and the text file can read by Excel. On the Excel, the data arranged by degree (DD), minutes(MM), second(SS) for Latitude and Longitude. DD, MM,SS shall convert DD.xxxxx pattern DD + (MM/60) + (SS/60x60) = DD.xxxxx
Recommendation-1: Fix the reserved boundary on a digital Map Re survey boundary pillars by GPS and describe the position (Longitude and Latitude) on the Reserve Forest location Map which is defined coordination system. GIS Arc View Operation Techniques are obtained by the C/P, PAFORM provided 3 sets of said soft wear, and PAFORM also provided a Manual on GIS operation. Therefore, the author recommend to the authorities to apply this process gradually to other areas. The C/P(s) shall be assigned as the GIS instructor. The manual will be present as the annex book as separate one. Related pert on Mop Part 1: Current situation Section 1 Location and Extent 1.2 Area, perimeter
Figure 2.2.10 Image of Map Source. The GPS reading data shows rough map on Map source.
Way points No Way points Mark Way points Location GPS reading

13
Advice: Following map can make by GIS. The map shows longitude and latitude lines by 10 second unit, and compartment lines. If FSD provide this kind map and a GPS to the field officers, field officers can mark every his findings (illegal felling, Taungya farming, failed planted area by the private developers, etc) on the map with LL points (GPS readings) during his occasional patrol. FSD can grasp more clearly the real forest condition changes. If you have A0 size printer, you can print out the GIS map with defined scale.
(2) Compartment system MoP explains the general standards for compartment as “The standard compartment dimensions of 1 mile x 0.5 mile or 1,600 x 800 m approx. (equivalent to 128 ha). Changing compartment boundaries should be avoided because of the need to maintain a continuous record of operations carried out within a particular area and to ensure that any one area is not re-entered prior to the 40 year period. Compartments are demarcated by fixed pillar. (A.2.7.2.6.)”. Compartment is the base to identify the special part of forest. It is an address for each forest/stands. Therefore, MoP emphasize the boundary of the compartment shall not be moved by the occasional plan making. This principle is very general and forester’s common cense. The compartment is address, and field operators always instructed the place for operations are defined compartment number. It means, the forest operation implemented, workers, foresters need the sanding place is really belonging the compartment as ordered. Compartment boundary is needed for every body to recognize on the ground. Therefore, compartment boundary will be set on the topographic features such as hill top line, river line. To observe Tain 1 forest reserve, there are no fixed pillars for compartment, no notice mark on the ground. The compartment line on the sketch maps are different shapes showing. For identifying the compartment line, surveyor need to trace with mater tape and pocket compass, measuring length and directions from a existing boundary pillar.
Figuer 1.13 Longitude and latitude grid map on Tain 1 Forest Reserve Figure 2.2.11 Grid Map (Longitude and Latitude) of Tain1 Forest Reserve

14
Almost foresters can not identify the compartment boundary on the ground. In case of Tain 1, the reserve located on the gentle hill, and almost flat and covered tall grass, no typical view points to identify the standing point can see. The compartment boundary are on the map but not on the ground. The existing compartment system on Tain 1 forest reserve shows on figure 2.1 below. The line made automatically 1 mail x 0.5 mile to taking into account 128 ha averaged area kept. The compartment boundaries are not followed topographic feature, closing the river line, not fitting the direction of hill top line. In real ground of Tain 1, if the compartment line follows river line or hill top line written on the topographic map, it may difficult to find these river lines or hill top lines, because the area is very gentle hill and shallow river lines. Recently, GPS device become cheap and accurate can read the standing points by longitude and latitude. If the boundary line defined latitude and longitude, he/she can point the boundary lines on the ground, and can avoid misconduct the operation (thinning, felling, etc.), and easy to control the activities by the private companies really acting according to the contracts. Therefore, author proposes that the compartment shall be demarcated following principle even the compartment boundary shall not move for continuous data accumulation.
a. Compartment boundary shall set up along with natural landscape (clear river line and mountain ridge line on the ground.
b. If the target area is almost flat, and difficult to identify the clear land features, boundary line shall set on North-South and East –West line using Latitude and Longitude (30 second in Latitude, roughly 900m and 60 second in Longitude, roughly 1800m and area is roughly 160 ha).
c. Set compartment cross points guiding marks on the ground (mark on a nearest big tree) as far as possible. d. Latitude, Longitude system shall apply the areas that are not yet conducted detail land survey for Planting
and/or yielding places on map and the case that new measures on GPS / GIS for mapping introducing.

15
The new compartment system image shows on Figure 2.2 below. (3) Forest classification standards
Comp Area ha1 84.362 106.023 136.594 150.715 145.146 84.617 167.358 105.529 141.50
10 172.6511 167.4012 141.8213 87.0814 141.2215 168.5616 88.8717 111.4918 168.9619 117.8920 144.4221 167.9522 154.1323 67.8424 34.41
Total 3,056.49
Figure 2.2.13 New compartment system proposed for Tain 1 Forest Reserve (Areas of the compartment are expanded from 34 ha to 160 ha (in standards approximately 160 ha).
Recommendation -2 : Unfortunately, many Forest Reserves are not yet made the accurate and clearly defined location by the coordination system maps and not supplied, especially in the transmission zone except important and where old planted Teak existed. These Forest reserves probably have limited map based records are accumulating, Therefore, Providing the GIS maps and GPS tools for related forest offices, the compartment system shall be renewed gaudery, on by one. On high forest zone, on many places, GPS can not catch the satellite signal, therefore, this new system may not work. The proposed system will work well on poor forest reserve covered with much grass lands.

16
Generally, for the Forest Management Plan formation, holding the latest situation is indispensable. MoP also recognizing this and request that one section provided as Past Management. Forest Inventory is requested to invent the stock and growth inclement, yielded, damaged by natural disasters are the first step. Foresters have to decide the target forest are into several type of condition areas, parts within a compartment such as good natural forest, bad natural forest, poor regeneration area, man made forest, species distributing patterns, etc. How divide the area by means of management objectives. MoP mentioned Forest classification on production zone based on the high forest categorizing. MoP said, forest classification standards shall apply the RMSC made “Provisional Forest Classification Map” on A.2.5.3.1. Nevertheless, MoP not explained the details how classify into what kind of categories. The surveyor for forest inventory may worry; he needs some standards how the forest shall be categorized. Guide lines for the target areas into suitable Forest types are not sure, at least on the MoP. Provably, this matter is one of the reasons that the MoP is complicated and difficult to follow. The author recommend to the authorities to make technical standards for forest land classification by means of definition of the forest type and how to make record book, and map. General technical standard for forest land categorization shows following matters, and process.
a. Forest land shall define forest or non-forest ( Class 1) b. Forest land shall categorize into Dense stands area, Sparse stand area, Shrub area, Grass land, and bare land,
rocks land and the land used for facilities for forest management such as forest road, nursery, building, etc. (Class 2).
c. Non-forest land shall categorize into Farm Land, water surface, glazing grass land, non used land, others such as graveling, mining, factory, etc.
d. Danes stand area shall divide into areas dominant species growing in natural or man made forest (Class 3). e. Natural forest shall divide into density class (close, middle, space, open) and dominant species (Class 4). f. Manmade forest shall divide species and age/planted year classified 3-5 years rudder (Class 4).
Sample of the Forest Category classification on Transmission zone GH Class 1 Class 2 Class 3 Class 4
Category Land Category forest land Category stands Category species(Spp) and crown dencity (1) Forest area (1) Forest Stands (1)Natural forest Dominant Spp. A Dance Dominant Spp. B Middle Dominant Spp. C Space Open (2) Manmade forest Teak forest Planted Spp A Crown density Planted Spp A Planted Spp A (2) Shrub (3) Grass area (1) logged area (forest can grow) (2) burned area (3) Other Grass growing land but use for forestry purpose (4) Others (1) Nursery (2)forest road
17
(3) building (2) Non-Forest (1) Farm (2) Water surface (3) Grazing land (4) Non use land (5) Others
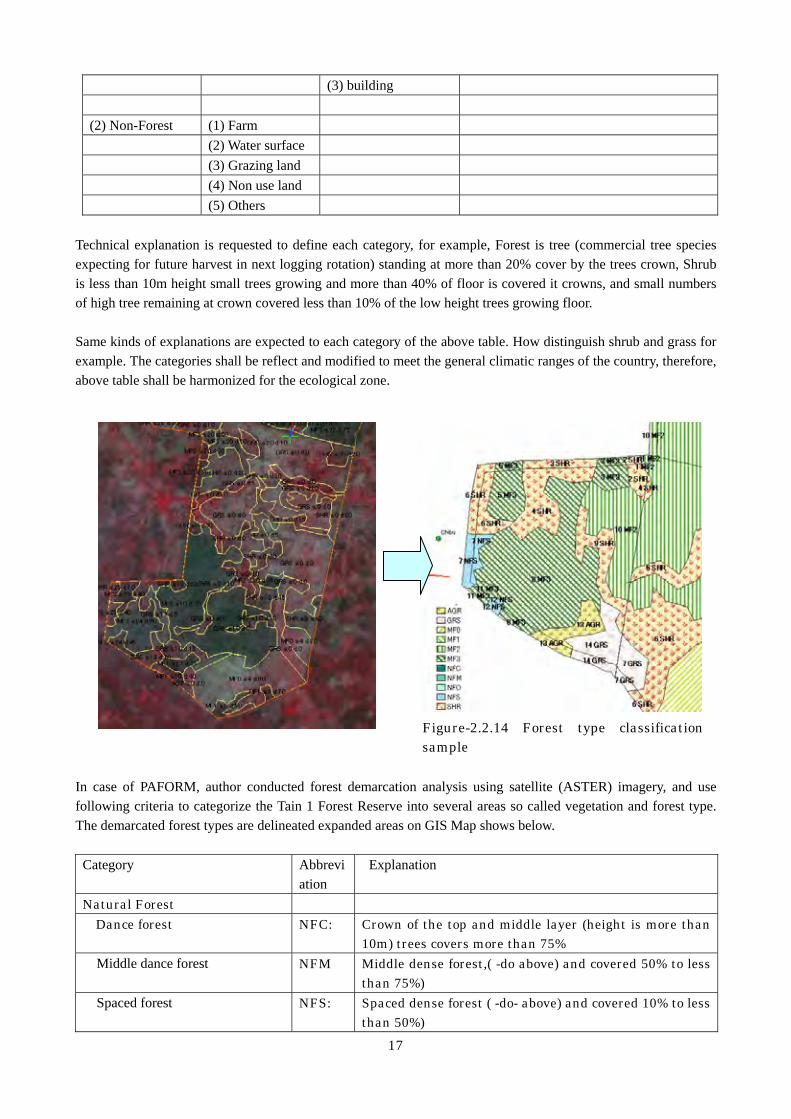
Technical explanation is requested to define each category, for example, Forest is tree (commercial tree species expecting for future harvest in next logging rotation) standing at more than 20% cover by the trees crown, Shrub is less than 10m height small trees growing and more than 40% of floor is covered it crowns, and small numbers of high tree remaining at crown covered less than 10% of the low height trees growing floor. Same kinds of explanations are expected to each category of the above table. How distinguish shrub and grass for example. The categories shall be reflect and modified to meet the general climatic ranges of the country, therefore, above table shall be harmonized for the ecological zone. In case of PAFORM, author conducted forest demarcation analysis using satellite (ASTER) imagery, and use following criteria to categorize the Tain 1 Forest Reserve into several areas so called vegetation and forest type. The demarcated forest types are delineated expanded areas on GIS Map shows below.
Category Abbreviation
Explanation
Natural Forest Dance forest NFC: Crown of the top and middle layer (height is more than
10m) trees covers more than 75% Middle dance forest NFM Middle dense forest,( -do above) and covered 50% to less
than 75%) Spaced forest NFS: Spaced dense forest ( -do- above) and covered 10% to less
than 50%)
Figure-2.2.14 Forest type classification sample

18
Open forest /Open wood land NFO Open wood land (-do- and covered less than 10%) Note: Less than 10 % crown covered big tree remaining area is
defined as forest. Small stands growing covering less than 10% is categorized in to shrub or grass land. This categorized view is that the remaining stand can be harvested at the next logging occasion (when the new planted tree harvesting).
Secondary forest NFY Forest grown by natural regeneration, stands average height reach more than 10m, crown density is more than 75% but dominant stand diameter is not exceed 20cm in DBH
Man made forest Teak plantation 1 MF 3: Age class 3 ( 20 or more, reaching to harvestable age ) MF2 : Age class 2 ( 15-19 reaching thinning age) MF 1: Age class 1 ( 6-14 reached to crown closed condition) MF 0: Age class 0 (1-5 just after planted then clowns are not
closed) Shrub SHR: Crowns of less than 10 m height trees covering ground
more than 50% of the delineated Grass land GRS: Grass covered, and crowns of high tree or shrub tree
covered less than 10% Farming Land AGF: Include fallows if users are recognized. (Taungya area is
defined as Man made forest (MF 0 )
Figure 2.2.15 Forest Map sample on Tain 1 forest reserve (Forest classification)

19
The above Map shows northern part of Tain 1. Green hatched parts are remaining Teak planted places. Brule colored areas are natural big trees are steal remain more than 10 % of crown density. Other areas are grass and shrub. This analysis was made by using satellite imagery interpretation. The Aster satellite imagery obtained 2003, therefore after 2003 planted, or burned area could not identify. Officially, FSD planted more than 1000 ha by private company/developer and Taungya. The places planted are not identified the location on map. In Ghanaian common scenes, the forest within a compartment is assumed occupied by the similar forests. Therefore, compartment is the general unit for classifying forest type. This concept is suitable for High Forest (Tropical rain forest). There are closed natural forest are continuing on broad area, to divide small parts is not applicable for selective cutting system. Nevertheless, in transmission zone, especially Teak Planting area, stands are not expanding large area, remaining natural stands are seen on patched area that occupying only small part of a compartment. Compartment is needed to divide sub-compartment to describe real situation, remaining or destroyed. On MoP A2.7 4.4 said that compartments of approximately 20- 50 ha are to be used. Where this mean making use of the standard natural forest compartment of 128 ha then it will be divided into four and numbered in accordance with the old compartment number but with an additional suffix ( i.e. 48/1, 48/2 etc.). The dividing compartment shall be defined as sub-compartment, named 14-1, 14-2 like above figure is advisable. The planted areas are not same size by each planted year, planted body (Taungya, private company, etc.), therefore, the sub-compartment shall define to adjust an area planted same year (age) and same planted body. This sub -compartment is base for future harvest for defining the location, volume, and as well as revenue projection. (4) Forest Inventory book arrangement The latest forest situation and management objectives by each parcel or sub-compartment by sub-compartment shall be recorded on a record book. We call as “Forest Inventory Book on xxxx (year)”. The book record name of compartment and sub-compartment (If compartment system needed to change the old compartment and sub-compartment names/numbers also recorded), forest type (Classification), management objectives (Zone name), dominant species, planted year/age, volume, average size of planted tree (height and diameter DBH), and other important information (Name of traditional authority, administration (Province, District, township, etc.). The records of the Forest Inventory Book are needed to reflect the position on a Map. The parcels, sub-compartment shall be defined the location on the map. The map shall delineate each parcel/sub-compartment.
Recommendation -3: Mop shall make additional technical standards for forest classification category and detail discussions how to judge the real forests divide into a nominated category on annex. The forest distribution of different forest type shall be demarcated within a compartment and gives name as sub compartment. Visitation/forest type map is needed. Use satellite imagery to divide the areas/compartment into forest type categories. Mop Sectin Related Part 1: Current situation Section 4 : State of the Forest Resource 4.2 Natural forest

20
This parcel/sub-compartment is the unit for forest operation such as harvesting, planting, thinning, NTFP collecting, etc. The forest operation conducted on the same places mast be carried on exactly on the same places of the nominated/planed sub-compartment map. Then the management plan works for its purposes to realize sustainable management. No management plan can work it’s function without the operations placed definition, who can control for field operations especially private developers and loggers. Author could not reach this kind of basic data book in case of the works for SFMP formulation on Tain1 as well as Nsemere forest reserve. This id the one of basic difficulty to make management plan to follow the MoP especially, quantitative based plan. MoP requests the management objectives shall describe in measurable indicators. Nevertheless, week capacity for land survey, map making, the planner could not decide/nominate a substantial part of the reserve (sub-compartment bases), because he/she can not identify where the target places (for logging, for planting) located. Field officers observed some operation in some place, surrounding farmers found strange logging, but they can not know that the operation is conducted based on the plan or illegal. To solve this situation, the planner shall conduct field recognizance, and record the observation result on Map and Forest Inventory book. Making Forest Inventory Book process are follows a. Field recognizance with satellite imagery to pick up typical forest type on the satellite image
b. Find keys for satellite t interpretation dividing the target area into forest type/ classification on satellite picture c. Make a map shows forest type. d. Overlay the compartment map and defined compartment number and boundary. e. Give sub-compartment number to each part of the classified areas/parts f. Calculate the area by each sub-compartment (GIS computer do it automatically) g. Give related information to each sub-compartment such as species dominant, natural or artificial made,
planted year/age, administration, traditional authority, etc. h. Make a table for Forest Inventory Book list up all the sub compartment as compartment order. i. Sum up and make tables, figures for the SFMP explanation or for SFMP annex data.
Following is a sample showing Map and Forest Inventory Book on some part of Tain 1 Forest Reserve, closely connecting the map delineated forest type (Classification) and the record on the Forest Inventory Book. Planted area shall be defined as a sub-compartment by planted year, main species and planted organization or category of national plan policy.

21
Recommendation -4: The forest distribution of different forest type shall be demarcated within a compartment and gives name as sub compartment. Visitation/forest type map is needed. Use satellite imagery to divide the areas/compartment into forest types categories. And the demarcated result shall be arrange on the Forest Inventory Book. The Forest Inventory Book data is the base for the SFMP substance such as measurable production level calculation. Related on MOP Part 1: Current situation Section 4 : State of the Forest Resource 4.2 Natural forest
Tain 1 Compartment 1
FID CompSub Area Ha F type Spp Age CD GBPL370 1 1 0.18 MF2 Teak 19 60 GB372 1 1 0.11 MF2 Teak 19 60 PL204 1 2 0.3 SHR Teak 16 20 GB417 1 2 1.15 SHR Teak 24 20 PL228 1 3 1.42 SHR Teak 26 30 GB333 1 3 0.52 MF3 Teak 24 60 GB444 1 3 1.74 MF3 Teak 24 60 PL421 1 4 6.06 SHR Teak 24 30 PL226 1 5 0.52 MF3 Teak 26 60 GB227 1 5 3.61 MF3 Teak 26 60 PL224 1 6 1.52 SHR Other 0 0 GB225 1 6 2.12 SHR Other 0 0 PL
6 1 7 1.06 NFS Teak 25 30 GB7 1 7 0.87 NFS Teak 25 30 PL
342 1 8 0.76 MF3 Teak 24 60 GB343 1 8 24.02 MF3 Teak 24 60 PL419 1 9 4.33 SHR Other 0 0 PL344 1 10 8.87 MF2 Teak 19 60 PL331 1 11 0.44 MF3 Teak 24 60 GB332 1 11 0.54 MF3 Teak 24 60 PL
2 1 12 0.28 NFS Teak 24 25 GB3 1 12 0.13 NFS Teak 24 25 PL
205 1 13 0.81 AGR 0 0 GB206 1 13 2.61 AGR 0 0 PL229 1 14 0.93 GRS 0 0 GB231 1 14 3.69 GRS 0 0 PL
Total 68.59
Figure 2.2.16 Forest Inventory Book and Forest type Map delineated into sub-compartment. Sub-compartment on Forest Inventory Book is directory connected on the forest type delineated Map

22
Total area by forest type calculated by GIS shows on the table below (grand total is 3055.95 ha) Man MadeForest Natural forest Grand
Comp MF3 MF2 MF0 Total NFC NFM NFS NFO Total SHR GRS AGR Total
1 32.15 9.16 41.31 2.34 2.34 16.9 4.62 3.42 68.59 2 43.05 23.95 67 0 21.67 3.24 91.91 3 14.84 16.35 31.19 4.94 4.94 20.2 18.95 75.28 4 12.13 0.14 12.27 0.89 0.89 30.59 99.61 143.36 5 19.91 20.71 40.62 0 42.3 59.47 142.39 6 15.34 15.34 0 20.38 33.66 69.38 7 66.22 66.22 0 66.45 4.97 137.64 8 31.47 31.47 0.58 8.33 8.91 4.9 27.43 72.71 9 11.73 1.52 13.25 6.69 5.99 2.06 14.74 63.17 44.92 136.08
10 5.43 15.91 21.34 6.37 6.37 17.78 41.91 87.4 11 6.61 6.61 40.22 22.85 26.77 89.84 3.02 63.69 163.16 12 13.06 13.06 18.58 16.27 3.31 38.16 13.62 73.7 2.24 140.78 13 0.9 0.9 5.24 0.7 77.35 83.29 7.69 41.38 133.26 14 0 8.66 9.22 31.57 21.59 71.04 65.83 1.37 138.24 15 0.85 2.34 3.19 11.18 23.19 0.57 34.94 12.99 41.18 3.07 95.37 16 0 8.71 15.47 20.87 23.95 69 62.28 0.63 131.91 17 0 8.46 14.19 53.82 76.47 2.81 34.19 14.02 127.49 18 0 3.62 4.34 23.39 31.72 63.07 38.07 8.29 109.43 19 0 7.66 43.29 15.83 66.78 61.65 128.43 20 18.98 18.98 24.36 26.52 50.88 24.8 24.1 118.76 21 26.76 26.76 6.99 13.73 20.72 16.53 37.4 3 104.41 22 0 7.12 9.27 16.39 20.29 60.04 96.72 23 0 15.9 12.88 28.78 78.37 1.15 108.3 24 1.24 1.24 21.91 21.91 53.79 13.2 90.14 25 6.88 6.88 12.1 9.67 21.77 3.22 68.62 9.33 109.82 26 0 46.54 2.59 49.13 57.86 8.53 115.52 27 0 10.07 67.53 77.6 41.87 119.47
Total 207.44 112.79 97.4 417.63 29.45 118.6 340.51 429.4 917.96 409.31 1242.8 68.25 3055.95
Recognized Teak forest areas total by satellite and grand verification is 417.63 ha
Figure 2.2.17 Compartment and sub-compartment setting sample on Tain 1
23
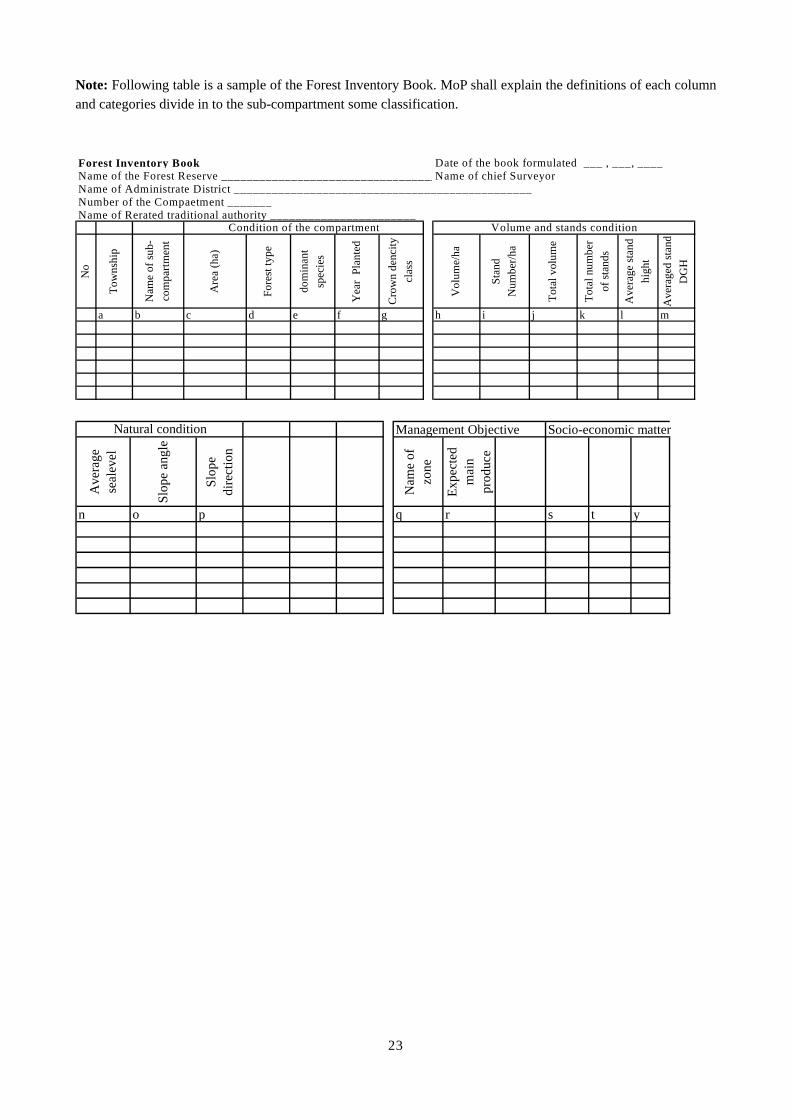
Note: Following table is a sample of the Forest Inventory Book. MoP shall explain the definitions of each column and categories divide in to the sub-compartment some classification. Forest Inventory Book Date of the book formulated ___ , ___, ____ Name of the Forest Reserve __________________________________Name of chief SurveyorName of Administrate District _______________________________________________Number of the Compaetment _______Name of Rerated traditional authority _______________________
No
Tow
nshi
p
Nam
e of
sub-
com
partm
ent
Are
a (h
a)
Fore
st ty
pe
dom
inan
tsp
ecie
s
Yea
r Pl
ante
d
Cro
wn
denc
itycl
ass
Vol
ume/
ha
Stan
dN
umbe
r/ha
Tota
l vol
ume
Tota
l num
ber
of st
ands
Ave
rage
stan
dhi
ght
Ave
rage
d st
and
DG
H
a b c d e f g h i j k l m
Condition of the compartment Volume and stands condition
Management Objective Socio-economic matter
Ave
rage
seal
evel
Slop
e an
gle
Slop
edi
rect
ion
Nam
e of
zone
Expe
cted
mai
npr
oduc
e
n o p q r s t y
Natural condition

24
(5) Plantation areas mapping The MoP said “The extent of existing plantations are not always well known, though the recent national inventory has provided detailed compartment maps for those areas sampled” The past planted areas were not exactly mapped (no land survey connected to the topographic map ) and evaluated the extent (damaged from fire, illegal logging, encroached farming, etc.). Even recent planted areas were also no record had made as location fixed basis as well. Therefore, now without conducting land survey based on each Taungya agreement, each private developer’s planting agreement, and FSD direct managed areas, the real remaining planted areas could not identified on the Forest management map. This means the Forest Management Planner could not define Conversion area and Plantation area on the bases of significant logic.
Planted area was examined by satellite imagery. At least closed Teak forest had recognized and delineated remaining old plantation on GIS Map. The comparison old day planted and existing shows figure 2.2.20 below.
Figure 2.2.18 Tain 1 Planted history sketch map by FSD (left old, right new)
Planted area Tain 1 Plant history record FSD (ha)1974 1976 1977 1978 1979 1980 1981 1982 2001 2002 2003 Total
FSD 61.68 51.09 91.82 8.40 11.50 17.55 3.34 7.46 252.84PD Kurufie 30.23 31.79 57.22 119.24PD OYCL 136.65 109.28 245.93TS Adan 97.31 97.31TS Chiraa 157.38 157.38TS Fuku 65.94 38.25 104.19TS Nyama 15.21 15.21Total 61.68 51.09 91.82 8.40 11.50 17.55 3.34 7.46 96.17 476.59 166.50 992.10
Table 2.1 FSD Planted history table

25
The right figure 2.2.19 shows planted history and figure 2.2.20 shows recognized remaining area. The map arranged some sketch map of planted history and satellite imagery interpretation plus field observation (for new planted from 2001 to 2003). Bright blue parts were planted from 1970’ to 2000. These planted areas can be identified by satellite, before the satellite shot 2003. Some areas on right green parts were planted 2002 to 2003 on the FSD plant history sketch map harmonized on GIS Map. Dark green areas are identified planted areas remain. The area calculated by GIS Map. Total old Teak forest planted (originally) areas descried on right blue areas are 253 ha. And 2001-2003 planted areas (right green) are 739 ha and in total 992 ha (1970’-2003) The remaining areas recognizing by satellite and field observations are 418 ha. Figure 2.2.20 shows remaining areas recognized by satellite and field observation (green hatch with pink outline part of figure 2.2.20). Some existing Teak forest areas are located outside of the original planted parts that the FSD sketch map shows. The sketch map kept by FSD may not confirm the locations by the grand traces. Nevertheless, planted area total is assumed quite collect. Remaining ratio (418 ha/992 ha) 42% may not in-adequate. The FSD record saying total 1125 ha had planted before 2003. The figure is not much the sketch map delineated area on GIS. It is unpredictable that which projection is near the real field situation. Author can only recommend that believe the new inventory using satellite.
Figure 2.2.19 Planted areas form 1970’ to 2003 in Tain 1
26
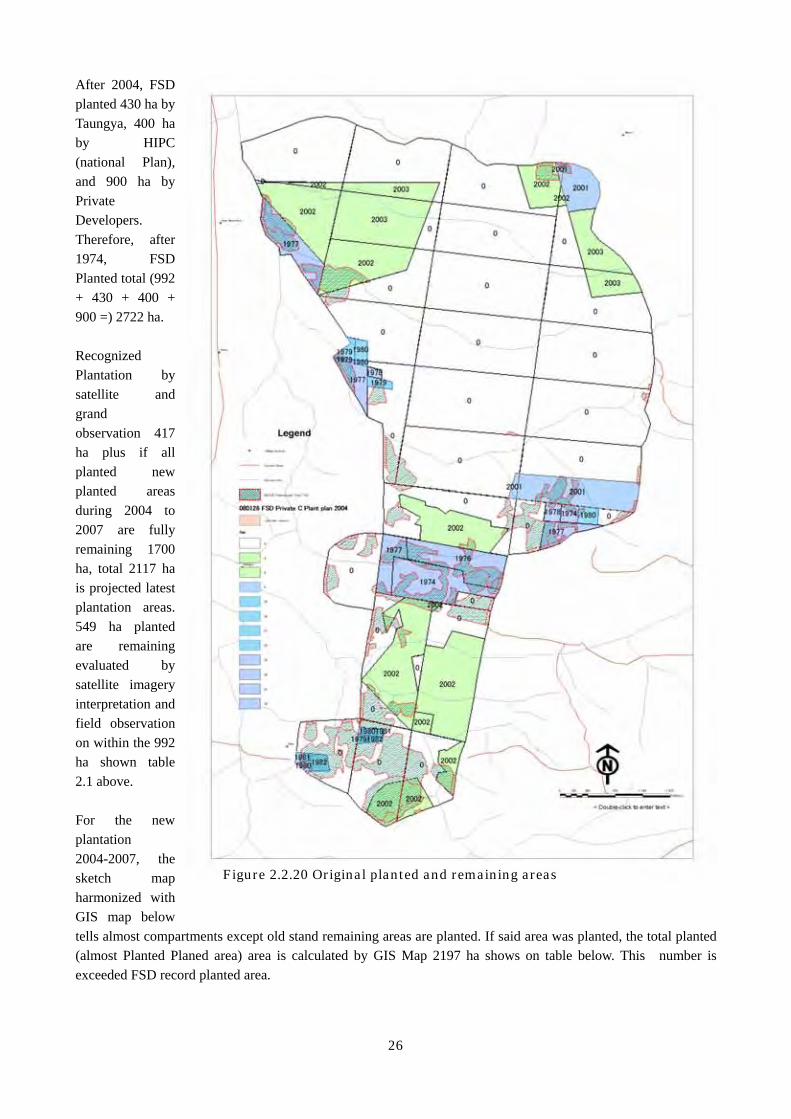
After 2004, FSD planted 430 ha by Taungya, 400 ha by HIPC (national Plan), and 900 ha by Private Developers. Therefore, after 1974, FSD Planted total (992 + 430 + 400 + 900 =) 2722 ha. Recognized Plantation by satellite and grand observation 417 ha plus if all planted new planted areas during 2004 to 2007 are fully remaining 1700 ha, total 2117 ha is projected latest plantation areas. 549 ha planted are remaining evaluated by satellite imagery interpretation and field observation on within the 992 ha shown table 2.1 above. For the new plantation 2004-2007, the sketch map harmonized with GIS map below tells almost compartments except old stand remaining areas are planted. If said area was planted, the total planted (almost Planted Planed area) area is calculated by GIS Map 2197 ha shows on table below. This number is exceeded FSD record planted area.
Figure 2.2.20 Original planted and remaining areas
27
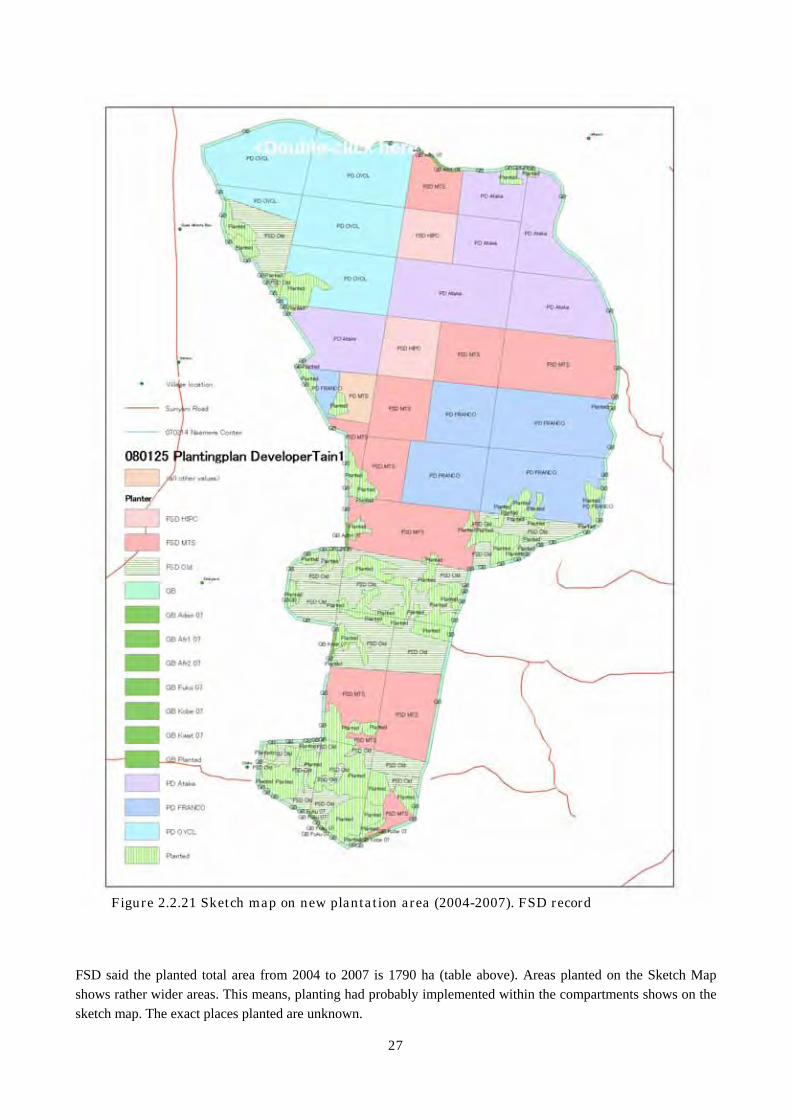
FSD said the planted total area from 2004 to 2007 is 1790 ha (table above). Areas planted on the Sketch Map shows rather wider areas. This means, planting had probably implemented within the compartments shows on the sketch map. The exact places planted are unknown.
Figure 2.2.21 Sketch map on new plantation area (2004-2007). FSD record
28
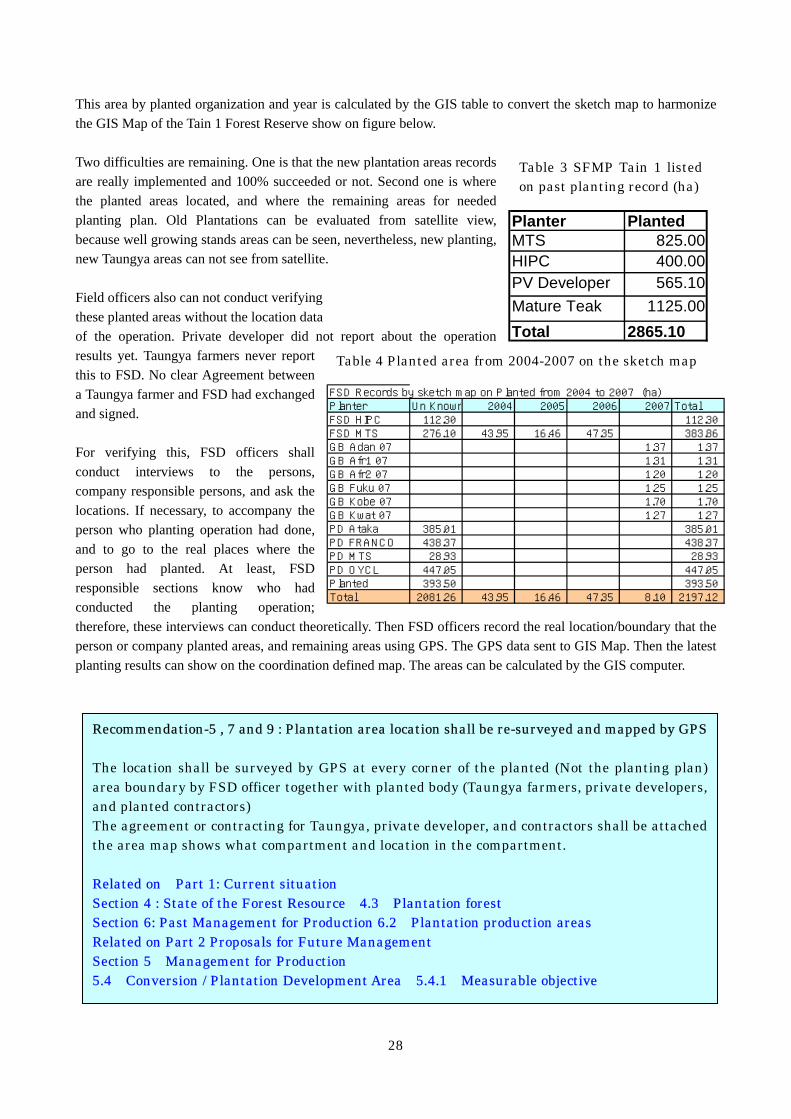
FSD Records by sketch map on Planted from 2004 to 2007 (ha)Planter Un Known 2004 2005 2006 2007 TotalFSD HIPC 112.30 112.30FSD MTS 276.10 43.95 16.46 47.35 383.86GB Adan 07 1.37 1.37GB Afr1 07 1.31 1.31GB Afr2 07 1.20 1.20GB Fuku 07 1.25 1.25GB Kobe 07 1.70 1.70GB Kwat 07 1.27 1.27PD Ataka 385.01 385.01PD FRANCO 438.37 438.37PD MTS 28.93 28.93PD OYCL 447.05 447.05Planted 393.50 393.50Total 2081.26 43.95 16.46 47.35 8.10 2197.12
Table 4 Planted area from 2004-2007 on the sketch map
This area by planted organization and year is calculated by the GIS table to convert the sketch map to harmonize the GIS Map of the Tain 1 Forest Reserve show on figure below. Two difficulties are remaining. One is that the new plantation areas records are really implemented and 100% succeeded or not. Second one is where the planted areas located, and where the remaining areas for needed planting plan. Old Plantations can be evaluated from satellite view, because well growing stands areas can be seen, nevertheless, new planting, new Taungya areas can not see from satellite. Field officers also can not conduct verifying these planted areas without the location data of the operation. Private developer did not report about the operation results yet. Taungya farmers never report this to FSD. No clear Agreement between a Taungya farmer and FSD had exchanged and signed. For verifying this, FSD officers shall conduct interviews to the persons, company responsible persons, and ask the locations. If necessary, to accompany the person who planting operation had done, and to go to the real places where the person had planted. At least, FSD responsible sections know who had conducted the planting operation; therefore, these interviews can conduct theoretically. Then FSD officers record the real location/boundary that the person or company planted areas, and remaining areas using GPS. The GPS data sent to GIS Map. Then the latest planting results can show on the coordination defined map. The areas can be calculated by the GIS computer.
Planter PlantedMTS 825.00HIPC 400.00PV Developer 565.10Mature Teak 1125.00Total 2865.10
Table 3 SFMP Tain 1 listed on past planting record (ha)
Recommendation-5 , 7 and 9 : Plantation area location shall be re-surveyed and mapped by GPS The location shall be surveyed by GPS at every corner of the planted (Not the planting plan) area boundary by FSD officer together with planted body (Taungya farmers, private developers, and planted contractors) The agreement or contracting for Taungya, private developer, and contractors shall be attached the area map shows what compartment and location in the compartment. Related on Part 1: Current situation Section 4 : State of the Forest Resource 4.3 Plantation forest Section 6: Past Management for Production 6.2 Plantation production areas Related on Part 2 Proposals for Future Management Section 5 Management for Production 5.4 Conversion / Plantation Development Area 5.4.1 Measurable objective

29
2.2.2 GPS and land survey on planting areas at plan and after implemented. The drafted SFMP is week to recognize the latest real situation of the past forest operations. There are simple sketch map shows planted plan where the planted Teaks shall grow. The operations are conducted but no records on the real location and wideness. No evaluations for the reported areas for planting, logging are correct or not. To solve this situation, Land survey and mapping process is indispensable. GPS is explained on MoP that “It is hoped that more use can be made of a Global Positioning System (GPS) receiver for this type of investigation since it allows the teams to accurately locate their position on a map without the need for surveying”. GPS can record the position on the Grove by means of latitude and longitude. If surveyor read the GPS position on every corner of the plantation boundary, and draw the positions on a sheet of paper. It will be the location map. The surveyor can measure the area by transparency doting sheet or some other instruments, if the surveyor make the map on distinguish scale. Map making on a distinguished scale using Longitude and Latitude is not simple. The grove is not flat, and even not real sphere. The Grove is an ellipse sphere, therefore, distance between point a and point b defined Longitude and Latitude are directory not shows. The GPS reading positions needs to convert to the axis of the coordination. Generally, GPS set Datum on WG84. WG 84 is now commonly used in world wide. Geographic Coordinate System is defined as “WGS_1984_UTM_Zone_30N” on Tain 1 and Nsemere areas. The following conversion formulary use many fix numbers to meet the areas located on zone defined WGS 84. The fix number can find from the internet related home pages. The conversion formulas are:
Above explanation is the basic principle, if you want accurate data conversion, you have to follow above
Conversion from Latitude and Longitude to rectangular coordinate
(1) X axis (2) Y axis
(3) Meridian aberration
(4) Scale coefficient
Axis x
Axis y
Latitude (10 unit degree)
Longitude ( do)
Longitude of origin of the coordinate
Scale coefficient of the origin of coordinate
Scale coefficient on Coordination point (x,y)
Length of arc meridian from equator to Latitude origin (φ0)
Length of arc meridian from equator to Latitude (φ)
Radius curvature of prime vertical
Radius curvature of meridian
Eccentricity.

30
instructions. Nevertheless, for forest management plan, you need not so accurate; the author advice following not so accurate but simple and easy applicable way can be used. The method is to find a standard to convert one second difference is equivalent to meter/centimeter on the ground of the target area.
Step 1: stand on 3-5 points where are clearly defended points on 1/50,000 topographic map such as cross point of national road and main river (center point of the bridge), and read GIS (a:N dd1.mm2.ss1, W dd1.mm2.ss1b to e (No 5th point)) positions.
Step 2: Measure the length by ruler measure distance of each points, and calculate each distance horizontal
and vertical length in mater units. Step 3: Calculate difference between points (a) to point (e) of each by means of seconds. Step 4: Calculate the conversion value (meter) per second in horizontal (Longitude) and in vertical Latitude). Step 5: Conversion value shall be averaged, and decide final fix number for longitude and latitude each.
On this area Sunyani surrounding, I second of latitude reflect 33m on ground, and Longitude reflect 30m. You can calculate two sides of the triangle using above units, and remaining side can calculate (a^2=b^2+c^2) On meter unit distance in vertical and horizontal, you can delineate map in any scale.
Another Way, you can download from internet, a general conversion table (Excel file) for converting a longitude
Point a1 N a1n.b1n.c1n
w a1w.b1w.c1w
Point a3 N a3n.b3n.c3n
w 3w.b3w.c3w
Point a2 N a2n.b2n.c2n
w a2w.b2w.c2w
Figure 2.2.22 Simple method GPS reading difference between 2 points to convert to meter unit distance changing fix number of 1 second equivalent xx maters
Measure the distance a1 to a2 in vertical and horizontal on the topographic map (1/50,000)
31
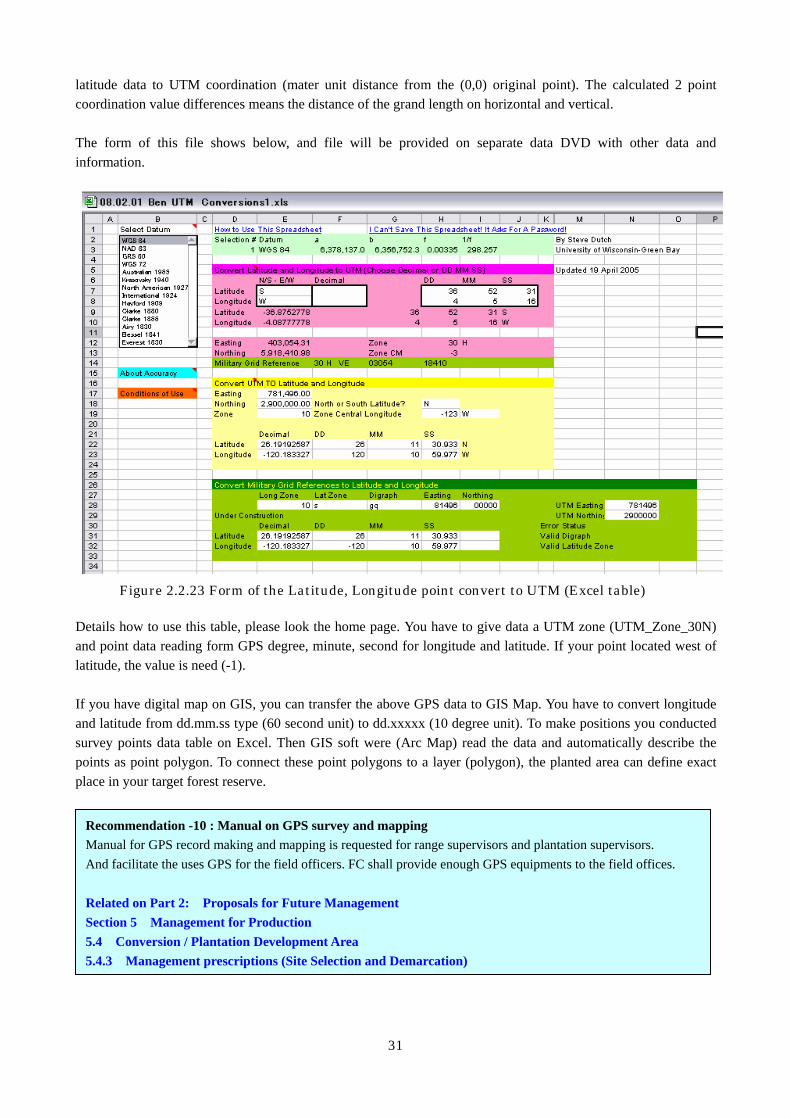
latitude data to UTM coordination (mater unit distance from the (0,0) original point). The calculated 2 point coordination value differences means the distance of the grand length on horizontal and vertical. The form of this file shows below, and file will be provided on separate data DVD with other data and information. Details how to use this table, please look the home page. You have to give data a UTM zone (UTM_Zone_30N) and point data reading form GPS degree, minute, second for longitude and latitude. If your point located west of latitude, the value is need (-1). If you have digital map on GIS, you can transfer the above GPS data to GIS Map. You have to convert longitude and latitude from dd.mm.ss type (60 second unit) to dd.xxxxx (10 degree unit). To make positions you conducted survey points data table on Excel. Then GIS soft were (Arc Map) read the data and automatically describe the points as point polygon. To connect these point polygons to a layer (polygon), the planted area can define exact place in your target forest reserve.
Recommendation -10 : Manual on GPS survey and mapping Manual for GPS record making and mapping is requested for range supervisors and plantation supervisors. And facilitate the uses GPS for the field officers. FC shall provide enough GPS equipments to the field offices. Related on Part 2: Proposals for Future Management Section 5 Management for Production 5.4 Conversion / Plantation Development Area 5.4.3 Management prescriptions (Site Selection and Demarcation)
Figure 2.2.23 Form of the Latitude, Longitude point convert to UTM (Excel table)
32
2.3 How to set up measurable objectives for production and Indicative levels of production (plantation area and conversion area). 2.3.1 Over view the MoP requesting for SFMP about the “Measurable Objectives” After zornation, SFMP planner is requested to decide management principles for each zoned area. And requested to describe the objectives in “measurable indicators” MoP explains by each zone how to write the “Measurable Objectives”. MoP said this on Protection zones are: Hill Sanctuary: Define that the total area of...........ha as identified on the base maps will be retained in this zone, and that the area will not be allowed to diminish during the management of the reserve. The quality of the forest (in terms of canopy closure or forest condition) will not be allowed to deteriorate, and the construction of any new access tracks will be prevented. Swamp Sanctuaries: State that the total area of...........ha, and the area will not be allowed to be disturbed by timber operators. Furthermore, the area within this zone will for most reserves increase as the smaller swamp areas are identified at the time of compartment inspection. Provenance Protection Areas (PPAs): Defined under the direction of the Botany Unit, RMSC. The area should not be allowed to diminish unless specific modifications are received from RMSC. The quality of the forest in terms of its condition class should not deteriorate and would be expected to improve. Special Biological Protection Areas (SBPAs): Areas as defined by the Botany unit of RMSC without any deterioration of the site or the quality of the forest. Floral and fauna diversity of the area shall be maintained or improved. Populations of specially identified species shall be maintained or increased. Cultural Sites: Preservation of the site. No damage to be caused to the area through the collection of timber or NTFPs. Research Areas: Site to be managed in accordance with the treatments defined in the research plan. No undesired external treatment allowed affecting the forest. Fauna Protection Areas (FPAs): Areas as defined by the Wildlife Department without any deterioration of the site or the quality of the forest. Floral and fauna diversity of the area shall be maintained or improved. Populations of specially identified species shall be maintained or increased. Fire Buffer Zones: Forest areas are identified by the Ecology Unit of RMSC retained and successfully prevented
Recommendation-3 and 14: Make Digital map of the forest reserves Preparation a digital base map on the forest reserve and identical compartment map on the ground as well. GIS Map shall be preparing for grasping the latest situation and as well as plan map. Related on Part 1: Current situation Section 4 : State of the Forest Resource 4.2 Natural forest SUPPORTING MAPS

33
from further logging. Ground cover maintained in semi-green state due to maintenance of closed forest conditions. Forest fires peter out before crossing the buffer. Above protection areas are basically define by RMSC or other authorities, therefore, SFMP planner have to follow the instructions, principles how to manage to meet the protection area setting purposes. The descriptions of “Measurable Objectives” also trace the descriptions from the instructions. Following zones are defined by the RFO or DFO. The SFMP planner has to write own principle and measurable objectives. On the production area include plantation area, conversion area, and Convalescence area, The MoP request to set “Measurable Objectives” MoP advising how to describe the “Measurable Objectives” as follows: Shelterbelts: Areas are identified by the Ecology Unit of RMSC or by the DFO retained and successfully prevented from further logging. Ground cover maintained in semi-green state due to maintenance of closed forest conditions. Forest fires peter out before crossing the buffer. Convalescence Forest: Areas are maintained and not logged for at least 40 years. Regular improvement in the stocking of the forest is carried over the convalescence period. Timber Production Areas: Sustainable production of timber to provide a perpetual flow of wood products, revenue for the resource owners and to fund forest management while maintaining environmental quality and social responsibility. Timber production should be roughly equal each year and as the forest moves into normality the area of forest logged each year should be close to 1/40 of the total area of the timber production area. Harvesting Scheduling is in order to adhere to the management regime of a 40 year felling cycle. It is necessary to allocate each compartment within the timber production area into five year felling coupes to fit as closely as possible to a forty year period between planned felling and the time of last entry. In order for this process to be properly carried out details of compartment history are needed and for this reason, the maintenance of a compartment register is essential. NTFP Production Areas: Sustainable production of NTFPs (including bush-meat) for domestic use by local communities and for meeting the demands of controlled commercial trading. The type of NTFPs traditionally collected and traded by the local communities will have to be defined during the initial field investigations and the collection sites identified. This zone defines special collection areas to be set aside where normal logging is excluded. In such areas a measurable objective will be that the harvestable volume is maintained or increased, and that the boundaries of the area are respected by other forest users. Plantation Production Areas: Regular production of marketable produce providing a commercial return on investment. Indicative Level of Production expected from the plantations shall be mentioned, based on the age structure and details of the stocking and standing volume provided by the recent national inventory. This should be in a summary form covering a period of about 20 years if the DFO feels that the data is adequate to show this. The level of planting or replanting would be indicated based on the expected time of clear felling. Conversion Areas: Degraded forest land restored to productive use through the establishment of commercially viable plantations. The plan should provide an indicative level of production expected from the plantations development area, based on average production levels for key indicator plantation species likely to be suited to the site. Assumptions will need to be made on the amount of land likely to be found suitable for planting. 2.3.2 How to project the “Measurable Objectives”

34
(1) Principles The MoP requested “Measurable Objectives” are described in case of protection areas simply copying same descriptions from RMSC documents that are defined as the protection area. The MoP is requesting the SFMP of the substantial protection areas are defined by the authorities other than FSD or FSR, and ordered to follow the instructions come from RMSC. On the case of production area, management under the selective cutting high forest and Teak man made forest are divided into different concepts. The target forest reserves are mainly located on the transition zone, therefore, author want to focus in to Plantation area, Conversion area. These areas are basically managed by means of growing Teak (mainly) man made forest for producing timber, pole. MoP request to the SFMP planner to show how much volume of wood can produce within the certain time flame. The harvest is requested as far as possible to maintain for long term. This means in target the harvesting area and replanting area is same, and harvest volume also continue same level. The SFMP needs to show the roads how to lead the forest reserve to approach the ideal conditions. The starting line is the latest situation/forest condition. The latest forest condition had fixt on the Part 1 past management. Then forest management operations that are set on the SFMP are implemented same as the plan planed, then next plan also implement operations based on the same principle, the forest reserve will change the situation filled with Teak forest in deferent age classes and reach a age class to the harvestable. (2) Measures Skelton To project this sifting forest structures situation, and examine the same level of production or revenue can continue, one calculation form so called Examination table for sustainable yielding is effective. Author suggests to the SFMP planners to try and apply this method for “Measurable Object” calculation. This method is prepared for basically clear cutting and replanting man made forest type management areas. The process is roughly divided into 5 steps as follows:
Step 1 Prepare yielding table for growth condition projection Step 2 Project structures produce into high quality log, middle quality log, pole, and fuel wood at the
main harvest time and thinning time from a unit area (ha) in percentage. Step 3 Survey market price for Teak Log (decide unit price for the produce) Step 4 Fix the latest man made forest and sum up age class units (5yere rudder) Step 5 Shift areas by each age class to add 1 rudder, and decide harvest area (volume or tree number) Step 6 Repeat the process 5 6 or 7 times (for 30 to 40 years)
During Step 6, planner shall harmonize planting areas and harvesting areas to take into account averaged operation size in area and in volume. During this calculation thinning plan also built in the calculation/projection table, therefore, harvest size shall consider the thinning. 2.3.3 How to make Yielding Table Yielding table is the key indicator to project future growth of the Teak plantation. Generally, each county forestry scientific research center or forestry universities studied and formulated general Yielding table. Nevertheless author could not find these kinds of existed yielding table of Teak in transition zone. If planner can find general Teak yielding table in Ghana, following descriptions shall be skip to 2.4.2 (2). If you want to make more suitable yielding table, you have to conduct broad areas field survey on different age stands, and similar management resume had been introduced (similar standards for original planting and thinning) Teak forests. Then to analyze

35
interrelation between age, diameter, stems number, stand height and volume/ha (volume/ha = stands number/ha x averaged stand volume, averaged stand volume is defined Diameter and height of a stand (Volume table of a stand of teak)). Nevertheless, these survey are belonging to the scientist in research center or university. For field officers, these field surveys may difficult therefore, the SFMP planner use applicable data to convert a yielding table for his target area. (1) How apply existed/available Yielding Tables to the target area Data from India
India for Indonesia Forest Department Ghana 1993Diameter DBH cm Diameter DBH cm Diameter DBH cm
Age Class 1 Class 2 Class 3 Age Class 1 Class 2 Class 3 Age Class 1 Class 2 Class 35 8.1 7.6 6.3 5 6.5 5.1 4.5 5 10
10 13.2 11.7 9.4 10 12.9 9.4 6.2 10 1615 18.3 15.7 12.5 15 17.7 12.7 8.7 15 1920 23.1 19.8 14.7 20 21.6 15.7 10.5 20 2125 28.0 23.6 17.0 25 24.9 18.1 12.0 25 2430 32.5 27.4 19.0 30 20.0 20.1 13.3 30 2635 36.8 30.6 20.8 35 31.0 21.9 14.7 35 2840 40.6 34.0 22.8 40 33.8 23.8 16.4 40
Volume/ha Volume/ha Volume/haAge Class 1 Class 2 Class 3 Age Class 1 Class 2 Class 3 Age Class 1 Class 2 Class 3
5 57 44 31 5 45 19 0 5 60 40 3010 123 94 64 10 121 77 72 10 105 85 6015 177 140 93 15 191 131 107 15 145 126 8020 226 184 120 20 256 181 144 20 180 160 11025 265 220 140 25 320 231 181 25 210 187 12530 318 237 159 30 384 282 218 30 240 210 14035 368 266 175 35 447 333 257 35 260 220 15040 416 296 192 40 509 386 296 40 270 240 160
Note Original planting is 3000 Sorce: JIFPRO Report on growth source:Yielding table of ten industrial wood Source: Forestry department 1993
species Lembaga Penelitian Hutan (PAFORM Advisory Report 6 MaSuharian A. .Sumerna, K. .Sudiono Y 2005 Annex 10)1975
Author found some similar tables for India, Indonesia, and Ivory Coast (West Africa). To compare the growing situation of the Teak Plantation in Tain 1 and figures on these tables, you have to find suitable curb on the graph shows near to the field observations of your area’s Teak growing condition such as age and height. Tree height is strongly reflected soil fertility of the area. Then you have to make your yield table for your area in temporary bases. Following Tables and graphs shows above 3 countries yielding tables showing age and tree height or diameter relation on good area, middle area, and poor area. The above yielding tables shows general growth divided into 3 classes by each country/area. The Ghana/West Africa in general, teak growth lower than India (original country), Ghana/West Africa is positioned between class 2 and class 3 site of India. What yielding table is more applicable to the target area? Following table made JICA study team for development cooperation project shows real field growth condition. To comparer with the field data and above yielding tables, class 2 of West Africa/Ivory coast/Ghana is the most near to reflect field growth condition. Therefore, author selected West Africa/Ivory coast/Ghana for the base yielding table for growth projection.
Table 2.3.1 Comparison of Teak yielding tables

36
Source: Forest Management Plan in Transmission zone Ghana Development Study Cooperation Report Find a suitable yielding table to meet your grand condition, then you make your growth prediction and volume
Figure 2.3.1 Volume inclement and age (left) Height growth and age (right) (Ghana) Source: Teak in Ghana, about Practice Field Guide Forest planting Development Center Raymond M. Keogh, Michael Y. Pentsil 2001, Raimond M. Keogh Teak in Ghana Abstract Practice Field Guide Forest Plantation Development Center.
Teak Growth condition on Ground survey Plot Name of Crown DBH Height Volum (m^3)No Reserv Dencity%Age Cm m Actual Ideal20 Sawa Sawa 80 5 10 10.1 21.5 2719 Sawa Sawa 60 6 9 8.5 8.7 1517 Sawa Sawa 90 9 11 10.0 25.5 2818 Sawa Sawa 90 9 12 10.1 34.2 385 Yaya 50 24 20 16.0 62.8 126
28 Tain 2 70 24 23 18.0 69.6 992 Yaya 60 24 20 19.0 91.5 153
22 Tain 2 70 24 29 19.4 141.2 2021 Yaya 80 24 23 19.5 142.2 178
23 Tain 2 70 24 24 22.7 119.3 17012 Tain 1 20 25 21 9.5 4.4 2210 Nsemere 50 25 15 16.2 54.2 10811 Tain 1 50 25 23 17.6 68.4 1373 Yaya 70 25 24 18.5 106.5 152
16 Sawa Sawa 80 26 13 17.0 70.2 8814 Sawa Sawa 60 26 13 17.4 57.7 9629 Tain 2 60 26 13 20.0 58.1 9715 Sawa Sawa 90 26 23 20.6 156.5 17426 Tain 2 70 27 23 16.5 60.8 877 Yaya 60 27 14 21.2 81.6 1366 Yaya 70 27 17 22.2 125.2 179
27 Tain 1 80 29 11 14.4 55.3 694 Yaya 60 29 15 20.2 85 142
Actual growth in AverageAge class DBH Hight V/ha1-4 - - -5-9 10.5 10 2710-14 - - -15-19 - - -20-24 23.2 19 15525-29 17.3 18 114
Table 2.3.2
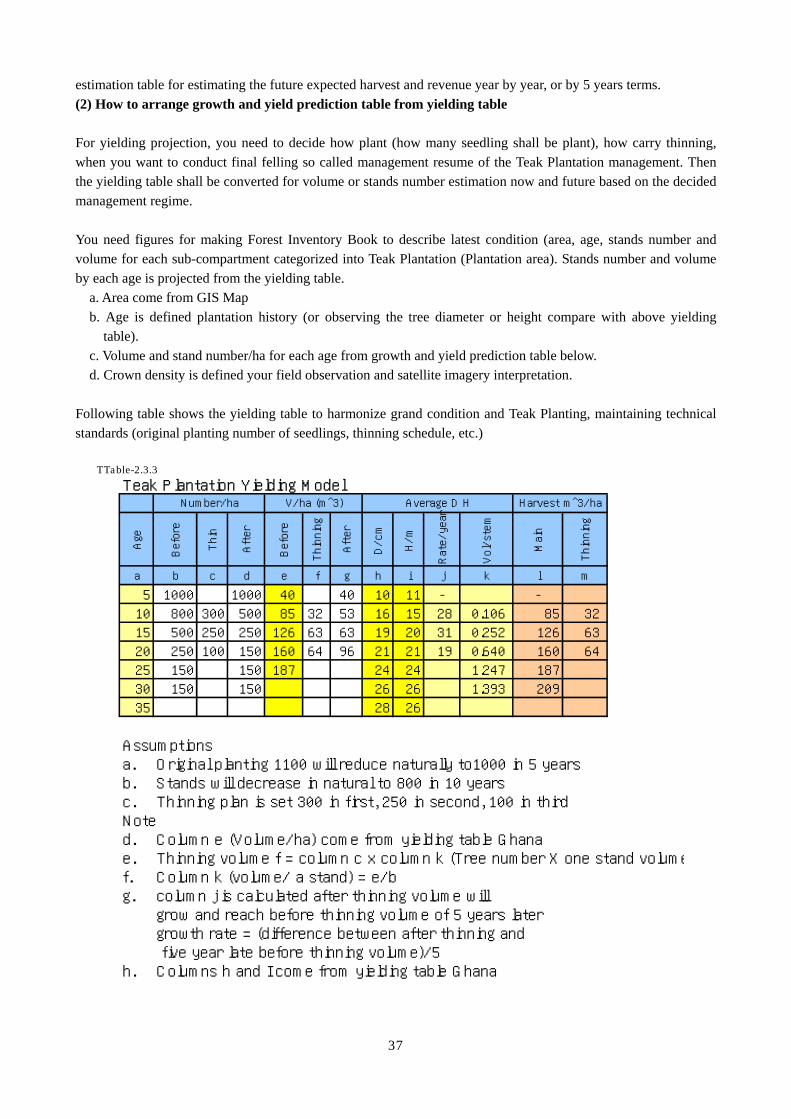
37
estimation table for estimating the future expected harvest and revenue year by year, or by 5 years terms. (2) How to arrange growth and yield prediction table from yielding table For yielding projection, you need to decide how plant (how many seedling shall be plant), how carry thinning, when you want to conduct final felling so called management resume of the Teak Plantation management. Then the yielding table shall be converted for volume or stands number estimation now and future based on the decided management regime. You need figures for making Forest Inventory Book to describe latest condition (area, age, stands number and volume for each sub-compartment categorized into Teak Plantation (Plantation area). Stands number and volume by each age is projected from the yielding table.
a. Area come from GIS Map b. Age is defined plantation history (or observing the tree diameter or height compare with above yielding
table). c. Volume and stand number/ha for each age from growth and yield prediction table below. d. Crown density is defined your field observation and satellite imagery interpretation.
Following table shows the yielding table to harmonize grand condition and Teak Planting, maintaining technical standards (original planting number of seedlings, thinning schedule, etc.)
Teak Plantation Yielding Model
Age
Before
Thin
After
Before
Thinning
After
D/cm
H/m
Rate/ye
ar
Vol/stem
Main
Thinning
a b c d e f g h i j k l m
5 1000 1000 40 40 10 11 - -10 800 300 500 85 32 53 16 15 28 0.106 85 3215 500 250 250 126 63 63 19 20 31 0.252 126 6320 250 100 150 160 64 96 21 21 19 0.640 160 6425 150 150 187 24 24 1.247 187 30 150 150 26 26 1.393 209 35 28 26
Assumptionsa. Original planting 1100 will reduce naturally to1000 in 5 yearsb. Stands will decrease in natural to 800 in 10 yearsc. Thinning plan is set 300 in first, 250 in second, 100 in thirdNoted. Column e (Volume/ha) come from yielding table Ghanae. Thinning volume f = column c x column k (Tree number X one stand volumef. Column k (volume/ a stand) = e/bg. column j is calculated after thinning volume will
grow and reach before thinning volume of 5 years later growth rate = (difference between after thinning and five year late before thinning volume)/5
h. Columns h and I come from yielding table Ghana
Number/ha V/ha (m^3) Average D H Harvest m^3/ha
TTable-2.3.3
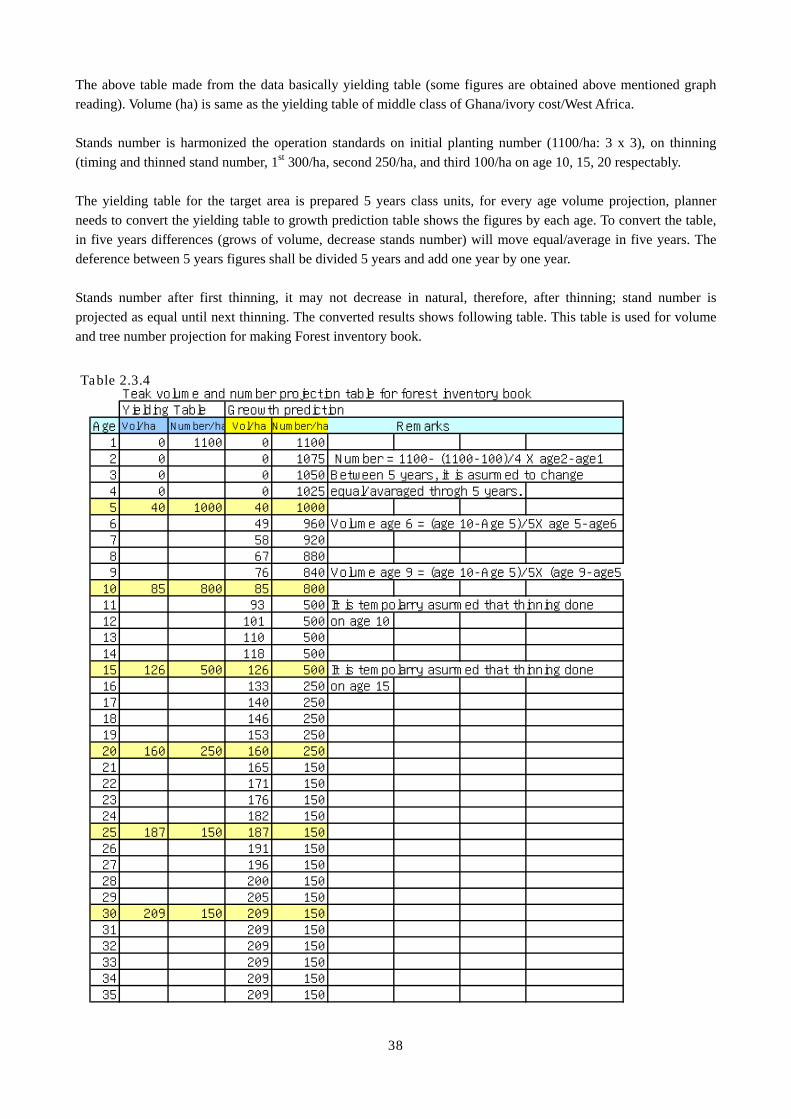
38
The above table made from the data basically yielding table (some figures are obtained above mentioned graph reading). Volume (ha) is same as the yielding table of middle class of Ghana/ivory cost/West Africa. Stands number is harmonized the operation standards on initial planting number (1100/ha: 3 x 3), on thinning (timing and thinned stand number, 1st 300/ha, second 250/ha, and third 100/ha on age 10, 15, 20 respectably. The yielding table for the target area is prepared 5 years class units, for every age volume projection, planner needs to convert the yielding table to growth prediction table shows the figures by each age. To convert the table, in five years differences (grows of volume, decrease stands number) will move equal/average in five years. The deference between 5 years figures shall be divided 5 years and add one year by one year. Stands number after first thinning, it may not decrease in natural, therefore, after thinning; stand number is projected as equal until next thinning. The converted results shows following table. This table is used for volume and tree number projection for making Forest inventory book.
Teak volume and number projection table for forest inventory bookYielding Table Greowth prediction
Age Vol/ha Number/ha Vol/ha Number/ha Remarks1 0 1100 0 11002 0 0 1075 Number = 1100- (1100-100)/4 X age2-age13 0 0 1050 Between 5 years, it is asurmed to change 4 0 0 1025 equal/avaraged throgh 5 years.5 40 1000 40 10006 49 960 Volume age 6 = (age 10-Age 5)/5X age 5-age67 58 9208 67 8809 76 840 Volume age 9 = (age 10-Age 5)/5X (age 9-age5)
10 85 800 85 80011 93 500 It is tempolarry asurmed that thinning done12 101 500 on age 1013 110 50014 118 50015 126 500 126 500 It is tempolarry asurmed that thinning done16 133 250 on age 1517 140 25018 146 25019 153 25020 160 250 160 25021 165 15022 171 15023 176 15024 182 15025 187 150 187 15026 191 15027 196 15028 200 15029 205 15030 209 150 209 15031 209 15032 209 15033 209 15034 209 15035 209 150
Table 2.3.4

39
Note: The yielding table and growth prediction and volume estimation table is prepared to meet management standards in your target forest reserve, therefore, the planner have to harmonize for your target area application. The thinning plan shows on the SFMP tain1 is below. Above table’s assumption and SFMP’s description is not same. The author is considering my table is more realistic to meet real field operation in Ghana, nevertheless, thinning principle have to follow the below table, please re-calculate, and apply your table for volume, stands number, thinning volume, etc. The calculation methods above can use for your re-calculation. Thinning principle described on the SFMP Tain 1 Age (yrs) 4 8 12 18+ Dominant height (m) 12 16 20 25+ No. of trees /ha before thinning 1111 555 300 150
No. of trees /ha after thinning 555 300 150 -
Thinning image by author (above Table)
1 5 y e a r s p a s s e d : s e c o n d t h i n n i n g
H a r v e s t i n g s t a n d s f o r s a l e s b i d d i n g1 5 - 1 7 y e a r s p a s s e d : a f t e r s e c o n d t h i n n i n g
1 8 y e a r s p a s s e d : g r o w s t o w a i t t h e t h i r d t h i n n i n g
2 0 y e a r s p a s s e d : g r o w s t o w a i t t h e t h i r d t h in n in g
A f t e r 3 r d T h in n in g
2 5 y e a r s p a s s e d : g r o w s t o w a i t t h e M a in H a r v e s t in g
Recommendation 11: Preparation of Teak Yielding Table for Transition zone of Ghana Related on Part 2: Proposals for Future Management
Section 5 Management for Production 5.3 Plantation Production Area 5.3.4 Indicative levels of production
Volume estimation on thinning, Needs making a Yielding Table have to be recognized.

40
(3) Fill the Forest Inventory Book columns for Teak Plantation sub-compartments on Volume and Stands
number Above growth prediction table shows average volume/ha and stands number/ha, if the Teak plantation growing under the general conditions, well planted with planed seedlings, well implemented tending cares, not affected fire, etc. Nevertheless in real fields, many places of the planting facing frailer of well management, not implemented well care of the planted seedlings, therefore, the planted Teak often grow under the expectation. Field officers and SFMG planner need to verify the real condition of planted area, especially young plantation. The old Teak forests may evaluate from satellite view. Through both survey and analysis, planner shall hold crown density of each Teak plantation by sub-compartment unit. The crown density reflects growing condition of each sub-compartment. If crown density projected 70%, it means volume and standing tree number reduced 70% of the figure shown on the growth prediction table. On this theory, the planner shall project volume and stands number on a Teak planted sub-compartment. Using Excel Table is convenience for this calculation as follows.
Figurer 2.3.2 Volume and stands number calculation on Excel work sheet (1) On Excel worksheet, growth prediction table set on left side, then forest Inventory book on right side. The sub-compartment man made forest has or give data (age, and crown density). You refer the column of volume and stands number by age, and calculate per/ha figures, then times area. The total volume and stands number is automatically projected. Bellowing table shows calculation formula referring Excel cells (c23, L8, B23, C23) and calculated results on compartment 2 of sub-compartment 3. Repeat this process, effectively using copy and past and ∑ using technique, you can fill all necessary columns in few minutes. Author did not explain the operation techniques on Excel. If you are not familiar Excel, please ask your friends how to operate excel.

41
Figurer 2.3.3 Volume and stands number calculation on Excel work sheet (2) 2.3.4 How to project production quality at harvesting time for revenue projection In general, Teak stands are harvested, and then timber will be divided into for timber use, pole, and fuel wood. For selling price of the harvested teak, we need to project how percentage of logs for high quality lumber, ordinary lumber, pole, and fuel wood are expected from first thinning, second thinning, third thinning, and main harvest. It depends upon harvestable timber size and shape. The stands structure of each harvested time (how many stands of each size /diameter can harvest from the harvesting stands) is projected by the real harvested records. Table xxx shows some record age and production relation. This table roughly suggesting in average, same aged stands produced significant number of timbers for pole and lumber use. Then calculated shearing percentage of the produced number to the total number of stands on growth prediction table.
Harvesting Record on Log size and quarity structuer for end useAge Height DiamaterPossible Production m cm Stand Number/ha Pred. Table tructuer (%) Pole Lumber Age Number/ha Pole Lumber
10 15.4 22.4 110 17.4 10 800 14 211 16.0 23.2 108 19.7 11 500 22 412 16.6 23.8 106 22.1 12 500 21 413 17.1 24.5 104 24.4 13 500 21 514 17.6 25.1 102 26.8 14 500 20 515 18.0 25.6 100 29.2 15 500 20 616 18.5 26.2 98 31.6 16 250 39 1317 18.9 26.7 96 34.0 17 250 38 1418 19.3 27.2 94 36.4 18 250 38 1519 19.6 27.6 92 38.8 19 250 37 1620 20.0 28.1 90 41.1 20 250 36 1621 20.3 28.5 89 43.5 21 150 59 2922 20.7 28.9 87 45.9 22 150 58 3123 21.0 29.3 85 48.2 23 150 57 3224 21.3 29.6 84 50.6 24 150 56 3425 21.6 30.0 82 52.9 25 150 55 3526 21.9 30.3 81 55.3 26 150 54 3727 22.2 30.7 79 57.6 27 150 53 3828 22.4 31.0 78 59.9 28 150 52 4029 22.7 31.3 76 62.2 29 150 51 4130 22.9 31.6 75 64.5 30 150 50 43
SourcGhana Forest Plantations Preparation Project Vol1 Technical 1995 Huntinh Technical Service Limited
Compaer with Growth prediction table
Table 2.3.5

42
Expected production sharing for pole, timber, fuel wood structure of Teak is unknown (Author could not found base data for analyzing this figure), therefore, author temporally projected based on the field observation, and past experiences in Japan taking into above field records on above table as following table. Author expects to SFMP planners that they will collect logging records and find their own table for modifying the table below. The table means that the logging sight on age 15 shows average DBH 25.6 cm will produce 26% of logs for fuel wood, 12% of logs for low timber or pole, 18% of logs for high timber or pole, 9% of logs for lumber, and remaining 35% can not used (waste as top, branch, damaged, etc.). 2.3.5 How to set assumption for log price For the revenue from Teak harvest projection, SFMP planner needs to know or set assumption (a) how many amount of log can harvest on the harvested age, (b) what kinds of wood can be produced, and (c) prices for each products. We tried to project unit (/ha) quantity of harvesting; finally how to project harvested value of logs by ha units? Harvested log price is defined as stumpage price on the logging site, log price on field log yard, etc. In Ghana, log price generally defined by bidding price on stumpage bases. Loggers observe the selling sites and bid price. The highest bid is selling price. This means the price is defined lot by lot, depending the loggers estimation that he/she can expect what size of timbers can sell to sawmills, and depend on the market prices. MoP suggesting that the price for revenue projection, price increase (deflation) shall be inserted. It may very difficult for long term projection. If these factors is needed to consideration, the central government shall guide standard prices and indicator for deflation (how many percentage shall be consider for future log price and revenue projection). In many countries, log price for selling is fixed by the central government year by year for avoiding wrong selling or bribery incidents. For revenue projection, what kind of fixed price shall be used is depend upon the policy of the central government, therefore, SFMP planner shall follow these instructions from authorities if these instructions are exist. Ordinary these instructions are in confidential for external persons such as the author, therefore, author shows one measure for such income projection using existed data as follows. Existed information for log price are:
a. Stem at GH¢10 (= 10 Us$) each stand (6.1.4 in part 2 of Draft management Plan). This price may average of bidding price in all in one.
b. From a report PAFOM Advisory Report (table 3-14) shows;
Harvesting Log size and quarity structuer for end useAverage Stand Number(%)
AgeDBHcm
FuelLow T.Pole
HeighT.Pole
Lumber
waste%
Total
10 22.4 25 10 12 3 50 10011 23.2 23 10 13 4 50 10012 23.8 22 10 13 5 50 10013 24.5 23 12 14 6 45 10014 25.1 23 12 17 8 40 10015 25.6 26 12 18 9 35 10016 26.2 21 13 20 11 35 10017 26.7 13 13 26 13 35 10018 27.2 17 12 26 15 30 10019 27.6 16 12 26 16 30 10020 28.1 26 12 14 18 30 10021 28.5 23 12 15 20 30 100
22 and mor 28.9 17 10 20 23 30 100
Table 2.3.6
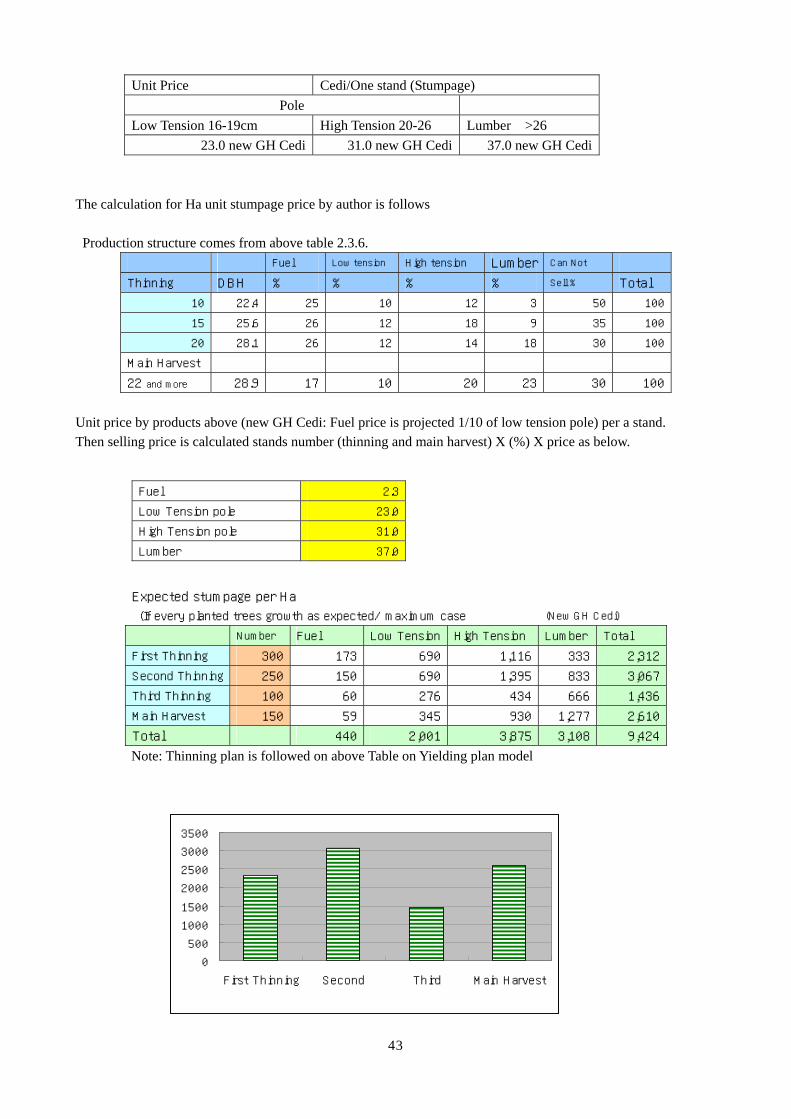
43
Unit Price Cedi/One stand (Stumpage) Pole
Low Tension 16-19cm High Tension 20-26 Lumber >26 23.0 new GH Cedi 31.0 new GH Cedi 37.0 new GH Cedi
The calculation for Ha unit stumpage price by author is follows Production structure comes from above table 2.3.6.
Fuel Low tension High tension Lumber Can Not
Thinning DBH % % % % Sell % Total
10 22.4 25 10 12 3 50 100
15 25.6 26 12 18 9 35 100
20 28.1 26 12 14 18 30 100
Main Harvest
22 and more 28.9 17 10 20 23 30 100
Unit price by products above (new GH Cedi: Fuel price is projected 1/10 of low tension pole) per a stand. Then selling price is calculated stands number (thinning and main harvest) X (%) X price as below.
Expected stumpage per Ha
(If every planted trees growth as expected/ maximum case (New GH Cedi)
Number Fuel Low Tension High Tension Lumber Total
First Thinning 300 173 690 1,116 333 2,312
Second Thinning 250 150 690 1,395 833 3,067
Third Thinning 100 60 276 434 666 1,436
Main Harvest 150 59 345 930 1,277 2,610
Total 440 2,001 3,875 3,108 9,424
Note: Thinning plan is followed on above Table on Yielding plan model
Fuel 2.3
Low Tension pole 23.0
High Tension pole 31.0
Lumber 37.0
0
500
1000
1500
2000
2500
3000
3500
First Thinning Second Third Main Harvest

44
2.3.6 Latest Teak forest structure (areas, volume into Age class) For projection of future harvesting volume, selling price, yielding table/growth prediction table, log price, and share of produce are prepared. You can start the projection for future targets. First, you have to sum up Teak plantation area, volume, stands number by age class, and average crown density by each age class. Generally, the age class is defined by 5 years. (1) Volume estimation for each sub-compartment The estimation methods for volume and stands number of each sub-compartment are explained above (2.4.2 (3)). The calculation result of sub-compartment only Teak forest are extracted from the excel work sheet (Forest Inventory Book) to other work sheet (copy and past on excel table) as below.

45
Note: a. Above table is made from Forest inventory book below. The age of forest inventory book is given based
on year 2005 (third year of the project). Therefore, age convert to the planted year (2005-age). Then age of above table was recalculated (2008-planted year).
b. The above Teak sub-compartments list is made (1) Extract sub-compartments MFn (Compartment and sub-compartment order), and (2) sorted age order
c. Average Crown density by 5 year rudder age class is: Average Crown density (CD) = (∑(area of sub-compartment x CD))/ ∑(area of sub-compartment) d. Excluded Green Belt area sub-compartments from existed Teak forests
Form of Forest Inventory Book FID_CompSub Area Ha F type Spp Age CD GBPL370 1 1 0.18 MF2 Teak 19 60 GB372 1 1 0.11 MF2 Teak 19 60 PL204 1 2 0.3 SHR Teak 16 20 GB417 1 2 1.15 SHR Teak 24 20 PL228 1 3 1.42 SHR Teak 26 30 GB333 1 3 0.52 MF3 Teak 24 60 GB444 1 3 1.74 MF3 Teak 24 60 PL421 1 4 6.06 SHR Teak 24 30 PL226 1 5 0.52 MF3 Teak 26 60 GB227 1 5 3.61 MF3 Teak 26 60 PL
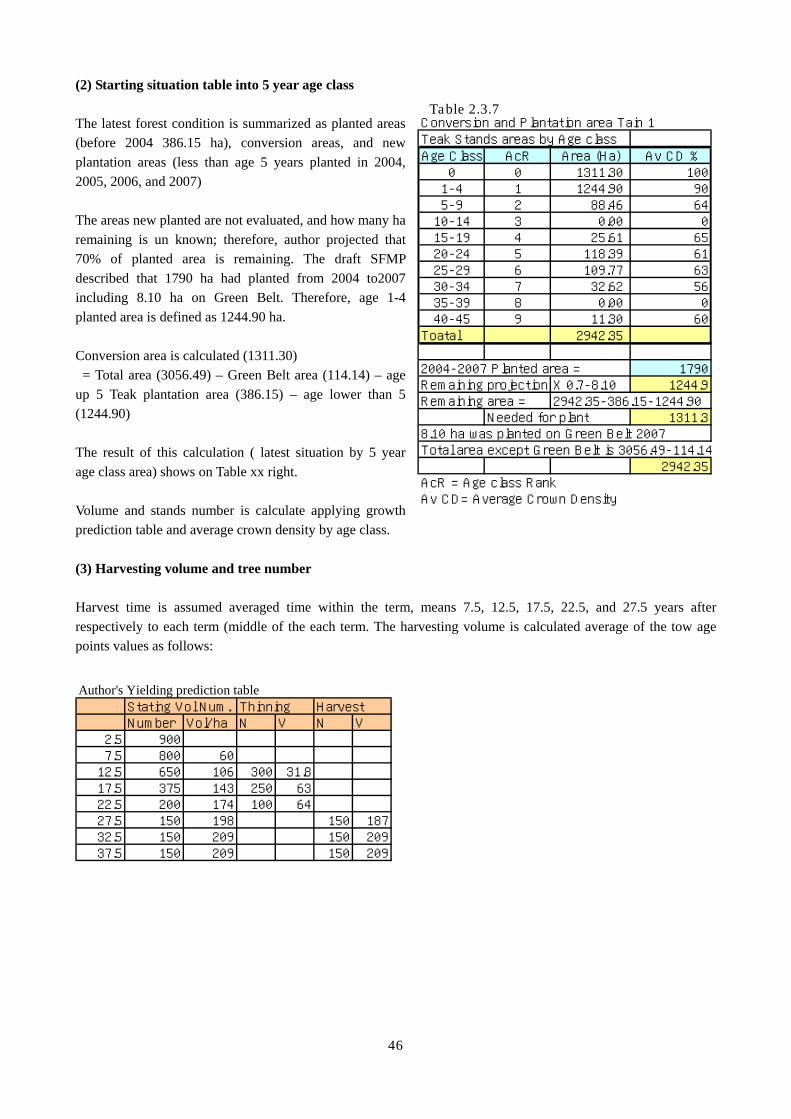
46
(2) Starting situation table into 5 year age class The latest forest condition is summarized as planted areas (before 2004 386.15 ha), conversion areas, and new plantation areas (less than age 5 years planted in 2004, 2005, 2006, and 2007) The areas new planted are not evaluated, and how many ha remaining is un known; therefore, author projected that 70% of planted area is remaining. The draft SFMP described that 1790 ha had planted from 2004 to2007 including 8.10 ha on Green Belt. Therefore, age 1-4 planted area is defined as 1244.90 ha. Conversion area is calculated (1311.30) = Total area (3056.49) – Green Belt area (114.14) – age up 5 Teak plantation area (386.15) – age lower than 5 (1244.90) The result of this calculation ( latest situation by 5 year age class area) shows on Table xx right. Volume and stands number is calculate applying growth prediction table and average crown density by age class. (3) Harvesting volume and tree number Harvest time is assumed averaged time within the term, means 7.5, 12.5, 17.5, 22.5, and 27.5 years after respectively to each term (middle of the each term. The harvesting volume is calculated average of the tow age points values as follows:
Author's Yielding prediction tableStating Vol Num. Thinning HarvestNumber Vol/ha N V N V
2.5 9007.5 800 60
12.5 650 106 300 31.817.5 375 143 250 6322.5 200 174 100 6427.5 150 198 150 18732.5 150 209 150 20937.5 150 209 150 209
Conversion and Plantation area Tain 1Teak Stands areas by Age classAge Class AcR Area (Ha) Av CD %
0 0 1311.30 1001-4 1 1244.90 905-9 2 88.46 64
10-14 3 0.00 015-19 4 25.61 6520-24 5 118.39 6125-29 6 109.77 6330-34 7 32.62 5635-39 8 0.00 040-45 9 11.30 60
Toatal 2942.35
2004-2007 Planted area = 1790Remaining projection X 0.7-8.10 1244.9Remaining area = 2942.35-386.15-1244.90
Needed for plant 1311.38.10 ha was planted on Green Belt 2007Total area except Green Belt is 3056.49-114.14
2942.35AcR = Age class RankAv CD= Average Crown Density
Table 2.3.7

47
2.3.7 Projection 5 years (term2) progress and decisions for temporal sizes of harvesting and planting
Tain 1 Forest Reserve managed by FSD Direct 6 years after
Age class Area byAge class
AverageDencity(%)
T.Number(1000) T.Vol Area by Age
class
AverageDencity
T.Number T.Vol (m^3)
A N ha V ha0: 0 needed area for Planting 1,311.30 (1000) Vol(m^3) 1105.22 (1000) (1000)1 :1-4 900 1,244.90 90.00 100,837 0 250.00 100 22,500 02 :5-9 800 60 88.46 64.00 4,529 340 1,244.90 90 89,633 67223 :10-14 650 106 0.00 0.00 0 0 88.46 64 3,680 6004 :15-19 375 143 25.61 65.00 624 238 0.00 0 0 05 :20-24 200 174 118.39 61.00 1,444 1,257 25.61 65 333 2906 :25-29 150 198 109.77 63.00 1,037 1,369 118.39 61 1,083 14307 :30-34 150 209 32.62 56.00 274 382 109.77 63 1,037 14458: 35-39 150 209 0.009:40-44 150 209 11.30 60.00 102 142Total 2,942.35 108,746 3,585 2,942.35 118,266 10487Thinning 10 300 32 0.00 0.00 0 0 88.46 64.00 1,698 180Thinning 15 250 63 25.61 65.00 416 105 0.00 0.00 0 0Thinning 20 100 64 118.39 61.00 722 462 25.61 65.00 166 107Main H 150 187 0.00 63.00 0 0 0.00 61.00 0 0
150 209 32.62 56.00 274 382 109.77 63.00 1,037 1445150 209 11.30 60.00 102 142
Number Volum m3Thinning 144.00 1,138 567 114.07 1,865 287Main H. 43.92 376 523 109.77 1037 1445Harvest T 187.92 1,514 1,090 223.84 2,902 1732Harvest/year 303 218
Main harvest Ha shall key in by the PPlantation Plan each 5 years (ha) 250 250 : This number shall key in by the Pla
Needed FSD 1311.30 Area come from D5(Exsted grass l 1105.22 Planted 250.00 250.00Harvested 43.92 109.77For next 1105.22 =Grass + Harvest - Planted 964.99
(Needed area for planting for Next
2007-11(1 period) 2012-16 (2 period)
Yield Table(100%)
Harvest Plan and replanting plan ( 43.92 ha harvest, and 250 ha replanted are the plan) a. Thinning is automatically planed at age of the schedule (age 10, 15,20). Volume and number is calculated area x averaged crown density x value of growth prediction table (thinning value) b. Main harvest = planner shall decide and type in the number (ha). And type in replanting area plan
a. Come from Growth predi- ction table and harvest projection table. b. Come from table xx above (Area by age class and averaged crown density ) c. Number of tree = N ha x averaged crown density d. Volume = V ha x averaged crown density
a. Area, average crown density by age class shall shift to next age class b. Number of tree = N ha x averaged crown density c. Volume = V ha x averaged crown density d. Age class 0 Age class 0 of the first term (1311.30) + harvested area (43.92) – planted area (250) = 1105.32 ha e. Then the areas of age class 0 and age class 1 are automatically changed on the Excel table.
Tain 1 Forest Reserve managed by FSD Direct 6 years after
Age class Area byAge class
AverageDencity(%)
T.Number(1000) T.Vol Area by Age
class
AverageDencity
T.Number T.Vol (m^3)
A N ha V ha0: 0 needed area for Planting 1,311.30 (1000) Vol(m^3) 1105.22 (1000) (1000)1 :1-4 900 1,244.90 90.00 100,837 0 250.00 100 22,500 02 :5-9 800 60 88.46 64.00 4,529 340 1,244.90 90 89,633 67223 :10-14 650 106 0.00 0.00 0 0 88.46 64 3,680 6004 :15-19 375 143 25.61 65.00 624 238 0.00 0 0 05 :20-24 200 174 118.39 61.00 1,444 1,257 25.61 65 333 2906 :25-29 150 198 109.77 63.00 1,037 1,369 118.39 61 1,083 14307 :30-34 150 209 32.62 56.00 274 382 109.77 63 1,037 14458: 35-39 150 209 0.009:40-44 150 209 11.30 60.00 102 142Total 2,942.35 108,746 3,585 2,942.35 118,266 10487Thinning 10 300 32 0.00 0.00 0 0 88.46 64.00 1,698 180Thinning 15 250 63 25.61 65.00 416 105 0.00 0.00 0 0Thinning 20 100 64 118.39 61.00 722 462 25.61 65.00 166 107Main H 150 187 0.00 63.00 0 0 0.00 61.00 0 0
150 209 32.62 56.00 274 382 109.77 63.00 1,037 1445150 209 11.30 60.00 102 142
Number Volum m3Thinning 144.00 1,138 567 114.07 1,865 287Main H. 43.92 376 523 109.77 1037 1445Harvest T 187.92 1,514 1,090 223.84 2,902 1732Harvest/year 303 218
Main harvest Ha shall key in by the PPlantation Plan each 5 years (ha) 250 250 : This number shall key in by the Pla
Needed FSD 1311.30 Area come from D5(Exsted grass l 1105.22 Planted 250.00 250.00Harvested 43.92 109.77For next 1105.22 =Grass + Harvest - Planted 964.99
(Needed area for planting for Next
2007-11(1 period) 2012-16 (2 period)
Yield Table(100%)
Harvest Plan and replanting plan a. Thinning is automatically planed at age of the schedule (age 10, 15,20). Volume and number is calculated area x averaged crown density x value of growth prediction table (thinning value) b. Main harvest = planner shall decide and type in the number (ha). And type in replanting area plan. c. Main harvest area, replanting area are decided by the planner taking into account moderate changing the quantity of the working plan for the future. The replanting size shall decide smooth approach to ideal situation.

48
The calculation of first term forest condition (areas by age class) is mainly refer the growth prediction table and above Table (latest situation now) as shown above table. The second term (after 5 years), the areas age class 2 to 9 and + are automatically shift next age class. Age class 1 is same amount as planted area in the term 1 ( the column age 0 of term 2 is referred the column planed plant area on the above Excel table). Sample of the calculation formula of excel table shows below.
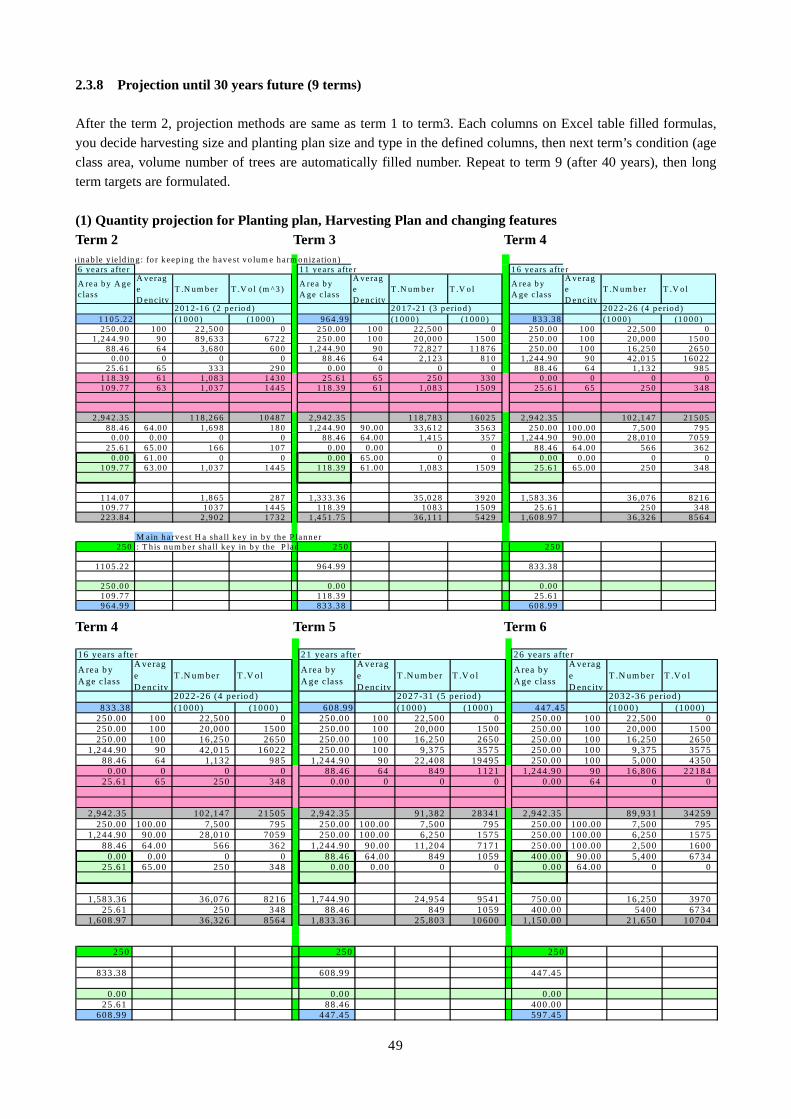
49
2.3.8 Projection until 30 years future (9 terms) After the term 2, projection methods are same as term 1 to term3. Each columns on Excel table filled formulas, you decide harvesting size and planting plan size and type in the defined columns, then next term’s condition (age class area, volume number of trees are automatically filled number. Repeat to term 9 (after 40 years), then long term targets are formulated. (1) Quantity projection for Planting plan, Harvesting Plan and changing features Term 2 Term 3 Term 4
a inab le yie ld ing : fo r keep ing the havest vo lum e harm o n iza tio n )6 years a fte r 1 1 years a fte r 1 6 years a fte r
A rea b y A gec lass
A verageD encity
T .N um b er T .V o l (m ^3 ) A rea b yA ge c lass
A verageD encity
T .N um b er T .V o l A rea b yA ge c lass
A verageD encity
T .N um b er T .V o l
1 1 0 5 .2 2 (1 0 0 0 ) (1 0 0 0 ) 9 6 4 .9 9 (1 0 0 0 ) (1 0 0 0 ) 8 3 3 .3 8 (1 0 0 0 ) (1 0 0 0 )2 5 0 .0 0 1 0 0 2 2 ,5 0 0 0 2 5 0 .0 0 1 0 0 2 2 ,5 0 0 0 2 5 0 .0 0 1 0 0 2 2 ,5 0 0 0
1 ,2 4 4 .9 0 9 0 8 9 ,6 3 3 6 7 2 2 2 5 0 .0 0 1 0 0 2 0 ,0 0 0 1 5 0 0 2 5 0 .0 0 1 0 0 2 0 ,0 0 0 1 5 0 08 8 .4 6 6 4 3 ,6 8 0 6 0 0 1 ,2 4 4 .9 0 9 0 7 2 ,8 2 7 1 1 8 7 6 2 5 0 .0 0 1 0 0 1 6 ,2 5 0 2 6 5 0
0 .0 0 0 0 0 8 8 .4 6 6 4 2 ,1 2 3 8 1 0 1 ,2 4 4 .9 0 9 0 4 2 ,0 1 5 1 6 0 2 22 5 .6 1 6 5 3 3 3 2 9 0 0 .0 0 0 0 0 8 8 .4 6 6 4 1 ,1 3 2 9 8 5
1 1 8 .3 9 6 1 1 ,0 8 3 1 4 3 0 2 5 .6 1 6 5 2 5 0 3 3 0 0 .0 0 0 0 01 0 9 .7 7 6 3 1 ,0 3 7 1 4 4 5 1 1 8 .3 9 6 1 1 ,0 8 3 1 5 0 9 2 5 .6 1 6 5 2 5 0 3 4 8
2 ,9 4 2 .3 5 1 1 8 ,2 6 6 1 0 4 8 7 2 ,9 4 2 .3 5 1 1 8 ,7 8 3 1 6 0 2 5 2 ,9 4 2 .3 5 1 0 2 ,1 4 7 2 1 5 0 58 8 .4 6 6 4 .0 0 1 ,6 9 8 1 8 0 1 ,2 4 4 .9 0 9 0 .0 0 3 3 ,6 1 2 3 5 6 3 2 5 0 .0 0 1 0 0 .0 0 7 ,5 0 0 7 9 5
0 .0 0 0 .0 0 0 0 8 8 .4 6 6 4 .0 0 1 ,4 1 5 3 5 7 1 ,2 4 4 .9 0 9 0 .0 0 2 8 ,0 1 0 7 0 5 92 5 .6 1 6 5 .0 0 1 6 6 1 0 7 0 .0 0 0 .0 0 0 0 8 8 .4 6 6 4 .0 0 5 6 6 3 6 2
0 .0 0 6 1 .0 0 0 0 0 .0 0 6 5 .0 0 0 0 0 .0 0 0 .0 0 0 01 0 9 .7 7 6 3 .0 0 1 ,0 3 7 1 4 4 5 1 1 8 .3 9 6 1 .0 0 1 ,0 8 3 1 5 0 9 2 5 .6 1 6 5 .0 0 2 5 0 3 4 8
1 1 4 .0 7 1 ,8 6 5 2 8 7 1 ,3 3 3 .3 6 3 5 ,0 2 8 3 9 2 0 1 ,5 8 3 .3 6 3 6 ,0 7 6 8 2 1 61 0 9 .7 7 1 0 3 7 1 4 4 5 1 1 8 .3 9 1 0 8 3 1 5 0 9 2 5 .6 1 2 5 0 3 4 82 2 3 .8 4 2 ,9 0 2 1 7 3 2 1 ,4 5 1 .7 5 3 6 ,1 1 1 5 4 2 9 1 ,6 0 8 .9 7 3 6 ,3 2 6 8 5 6 4
M ain harvest H a sha ll key in b y the P lanner2 5 0 : T his num b er sha ll key in b y the P lan 2 5 0 2 5 0
1 1 0 5 .2 2 9 6 4 .9 9 8 3 3 .3 8
2 5 0 .0 0 0 .0 0 0 .0 01 0 9 .7 7 1 1 8 .3 9 2 5 .6 19 6 4 .9 9 8 3 3 .3 8 6 0 8 .9 9
2 0 1 2 -1 6 (2 p erio d ) 2 0 1 7 -2 1 (3 p erio d ) 2 0 2 2 -2 6 (4 p erio d )
Term 4 Term 5 Term 6
16 years after 21 years after 26 years after
A rea byA ge class
A verageD encity
T .N um ber T .V ol A rea byA ge class
A verageD encity
T .N um ber T .V o l A rea byA ge class
A verageD encity
T .N um ber T .V o l
833 .38 (1000) (1000) 608 .99 (1000) (1000) 447 .45 (1000) (1000)
250 .00 100 22 ,500 0 250 .00 100 22 ,500 0 250 .00 100 22 ,500 0250 .00 100 20 ,000 1500 250 .00 100 20 ,000 1500 250 .00 100 20 ,000 1500250 .00 100 16 ,250 2650 250 .00 100 16 ,250 2650 250 .00 100 16 ,250 2650
1 ,244 .90 90 42 ,015 16022 250 .00 100 9 ,375 3575 250 .00 100 9 ,375 357588 .46 64 1 ,132 985 1 ,244 .90 90 22 ,408 19495 250 .00 100 5 ,000 4350
0 .00 0 0 0 88 .46 64 849 1121 1 ,244 .90 90 16 ,806 2218425 .61 65 250 348 0 .00 0 0 0 0 .00 64 0 0
2 ,942 .35 102 ,147 21505 2 ,942 .35 91 ,382 28341 2 ,942 .35 89 ,931 34259250 .00 100 .00 7 ,500 795 250 .00 100 .00 7 ,500 795 250 .00 100 .00 7 ,500 795
1 ,244 .90 90 .00 28 ,010 7059 250 .00 100 .00 6 ,250 1575 250 .00 100 .00 6 ,250 157588 .46 64 .00 566 362 1 ,244 .90 90 .00 11 ,204 7171 250 .00 100 .00 2 ,500 1600
0 .00 0 .00 0 0 88 .46 64 .00 849 1059 400 .00 90 .00 5 ,400 673425 .61 65 .00 250 348 0 .00 0 .00 0 0 0 .00 64 .00 0 0
1 ,583 .36 36 ,076 8216 1 ,744 .90 24 ,954 9541 750 .00 16 ,250 397025 .61 250 348 88 .46 849 1059 400 .00 5400 6734
1 ,608 .97 36 ,326 8564 1 ,833 .36 25 ,803 10600 1 ,150 .00 21 ,650 10704
250 250 250
833 .38 608 .99 447 .45
0 .00 0 .00 0 .0025 .61 88 .46 400 .00
608 .99 447 .45 597 .45
2022-26 (4 period) 2027-31 (5 period) 2032-36 period)

50
Term 6 Term 7 Term 8
26 years after 31 years after 36 years after
Area byAge class
AverageDencity
T.Number T.Vol Area byAge class
AverageDencity
T .Number T .Vol Area byAge class
AverageDencity
T.Number T.Vol
447.45 (1000) (1000) 597.45 (1000) (1000) 747.45 (1000) (1000)
250.00 100 22,500 0 250.00 100 22,500 0 250.00 100 22,500 0250.00 100 20,000 1500 250.00 100 20,000 1500 250.00 100 20,000 1500250.00 100 16,250 2650 250.00 100 16,250 2650 250.00 100 16,250 2650250.00 100 9,375 3575 250.00 100 9,375 3575 250.00 100 9,375 3575250.00 100 5,000 4350 250.00 100 5,000 4350 250.00 100 5,000 4350
1,244.90 90 16,806 22184 250.00 100 3,750 4950 250.00 100 3,750 49500.00 64 0 0 844.90 90 11,406 15893 250.00 100 3,750 5225
444.90 90.00 6,006 8369
2,942.35 89,931 34259 2,942.35 88,281 32918 2,942.35 80,625 22250250.00 100.00 7,500 795 250.00 100.00 7,500 795 250.00 100.00 7,500 795250.00 100.00 6,250 1575 250.00 100.00 6,250 1575 250.00 100.00 6,250 1575250.00 100.00 2,500 1600 250.00 100.00 2,500 1600 250.00 100.00 2,500 1600400.00 90.00 5,400 6734 0.00 100.00 0 0 0.00 100.00 0 0
0.00 64.00 0 0 400.00 90.00 5,400 7522 0.00 100.00 0 0444.90 90 6,006 8369
750.00 16,250 3970 750.00 16,250 3970 750.00 16,250 3970400.00 5400 6734 400.00 5400 7522 444.90 6006 8369
1,150.00 21,650 10704 1,150.00 21,650 11492 1,194.90 22,256 12339
250 250 250
447.45 597.45 747.45
0.00 0.00 0.00400.00 400.00 444.90597.45 747.45 942.35
2042-46 (8 period)2032-36 period) 2037-41 (7 period)
Term 8 Term 9
36 years after 41 years after
Area byAge class
AverageDencity
T.Number T.Vol Area byAge class
AverageDencity
T.Number T.Vol
747.45 (1000) (1000) 942.35 (1000) (1000)
250.00 100 22,500 0 250.00 100 22,500 0250.00 100 20,000 1500 250.00 100 20,000 1500250.00 100 16,250 2650 250.00 100 16,250 2650250.00 100 9,375 3575 250.00 100 9,375 3575250.00 100 5,000 4350 250.00 100 5,000 4350250.00 100 3,750 4950 250.00 100 3,750 4950250.00 100 3,750 5225 250.00 100 3,750 5225444.90 90.00 6,006 8369 250.00 100 3,750 5225
0.00 90 0 02,942.35 80,625 22250 2,942.35 80,625 22250
250.00 100.00 7,500 795 250.00 100.00 7,500 795250.00 100.00 6,250 1575 250.00 100.00 6,250 1575250.00 100.00 2,500 1600 250.00 100.00 2,500 1600
0.00 100.00 0 0 0.00 100.00 0 00.00 100.00 0 0 0.00 100.00 0 0
444.90 90 6,006 8369 250.00 100.00 3,750 5225
750.00 16,250 3970 750.00 16,250 3970444.90 6006 8369 0.00 3750 5225
1,194.90 22,256 12339 750.00 20,000 9195
250 250
747.45 942.35
0.00 0.00444.90 0.00942.35 692.35
2042-46 (8 period) 2047-51 (9 period)

51
(2) Revenue Projection Calculation of income/selling price is not so complicated work except log price change prospects. If the planner expect to show future income as accurately and explanatory, it is may be very difficult. No one know 30 years future price. The projection of progress yielding in volume of logs are able to control, therefore, the above projection has a meaning of management will. But the price is depending on wider market conditions, forest management organizations can not control. The revenue projection is not a fortune teller’s work.
Revenue projection is requested to show the expectation in future, therefore, the figure may enough to show today’s price based information. Author suggest that the planner shall explain to stake holders the expected revenue is not considered the future log price increase or decrease, and if the log price changed accompany with general price index, the projection will fluctuate. Following revenue projection sample is carried based on fixed log price. Calculation measures are follows:
Table Volume and Number shifting caluculation table (Cheking sustainable yielding: for keeping the havest volume harmonizTain 1 Forest Reserve managed by FSD Direct 6 years after
Age class Area byAge class
AverageDencity(%)
T.Number(1000) T.Vol Area by Age
class
AverageDencity
T.Number T.Vol (m^3)
A N ha V ha 0: 0 needed area for Planting 1,311.30 (1000) Vol(m^3) 1105.22 (1000) (1000)1 :1-4 900 1,244.90 90.00 100,837 0 250.00 100 22,500 02 :5-9 800 60 88.46 64.00 4,529 340 1,244.90 90 89,633 67223 :10-14 650 106 0.00 0.00 0 0 88.46 64 3,680 6004 :15-19 375 143 25.61 65.00 624 238 0.00 0 0 05 :20-24 200 174 118.39 61.00 1,444 1,257 25.61 65 333 2906 :25-29 150 198 109.77 63.00 1,037 1,369 118.39 61 1,083 14307 :30-34 150 209 32.62 56.00 274 382 109.77 63 1,037 14458: 35-39 150 209 0.009:40-44 150 209 11.30 60.00 102 142Total 2,942.35 108,746 3,585 2,942.35 118,266 10487Thinning 10 300 32 0.00 0.00 0 0 88.46 64.00 1,698 180Thinning 15 250 63 25.61 65.00 416 105 0.00 0.00 0 0Thinning 20 100 64 118.39 61.00 722 462 25.61 65.00 166 107Main H 150 187 0.00 63.00 0 0 0.00 61.00 0 0
150 209 32.62 56.00 274 382 109.77 63.00 1,037 1445150 209 11.30 60.00 102 142
Number Volum m3Thinning 144.00 1,138 567 114.07 1,865 287Main H. 43.92 376 523 109.77 1037 1445Harvest T 187.92 1,514 1,090 223.84 2,902 1732Harvest/year 303 218
Main harvest Ha shall key in by the PPlantation Plan each 5 years (ha) 250 250 : This number shall key in by the Pla
Needed FSD 1311.30 Area come from D5(Exsted grass l 1105.22 Planted 250.00 250.00Harvested 43.92 109.77For next 1105.22 =Grass + Harvest - Planted 964.99
(Needed area for planting for Next
Projection on Expecting Reveneu (Price is tempolally fixt as 2005 level and assurmed it will be move not chAverage harvest area = 588.47 (in 5 years period)
Income Projection First term Income Projection 6 years afterExpected incom (%) 1000 GH Ced/ annual Expected incom 1000 GH Cedi/ annualThinning 10 Fuel wood 2.3 25 0 0 Thinning 10 Fuel woo 977 195
Pole 1 23 10 0 0 Pole 1 3,906 781Pole 2 31 12 0 0 Pole 2 6,318 1,263Lumber 37 3 0 0 Lumber 1,885 377
Thinning 15 Fuel wood 2.3 26 249 49 Thinning 15 Fuel woo 0 0Pole 1 23 12 1,149 229 Pole 1 0 0Pole 2 31 18 2,322 464 Pole 2 0 0Lumber 37 9 1,386 277 Lumber 0 0
Thinning 20 Fuel wood 23 26 4,319 863 Thinning 20 Fuel woo 995 199Pole 1 23 12 1,993 398 Pole 1 459 91Pole 2 31 14 3,134 626 Pole 2 722 144Lumber 37 18 4,810 961 Lumber 1,109 221
Main H Fuel wood 23 17 1,469 293 Main H Fuel woo 4,056 811Pole 1 23 10 864 172 Pole 1 2,386 477Pole 2 31 20 2,329 465 Pole 2 6,431 1,286Lumber 37 23 3,197 639 Lumber 8,828 1,765
Total 27,221 5,444 38,073 7,614Unit Price Selling price projection by product Selling price projection by product/ one timber Fuel wood 6,037 1,207 Fuel wood 6,028 1,205
Pole 1 4,006 801 Pole 1 6,752 1,350Pole 2 7,786 1,557 Pole 2 13,472 2,694Lumber 9,393 1,878 Lumber 11,822 2,364Total 27,221 5,443 Total 38,073 7,613
Incom shering Revenue Distribution projection Revenue Distribution projectionFSD 50 13,610 2,722 FSD 19,036 3,807Stool 15 4,083 816 Stool 5,710 1,142T council 10 2,722 544 T council 3,807 761D assembry 25 6,805 1,361 D assembry 9,518 1,903Total 27,220 5,443 Total 38,071 7,613
2007-11(1 period) 2012-16 (2 period)
Yield Table(100%)
Quantity projection part
(Harvesting and Planting) Revenue projection part

52
a. Average stumpage price projection (bidding price records) b. Arrange the market log price for every thinning and main harvest to meet expected produced logs size structure. c. Calculate expecting selling price and revenue distribution for stake holders. The calculation is carried using same Excel work sheet as 2.3.7 (1) above. The lower part of same work sheet, the columns for revenue projection are prepared. If you type a figure for harvesting (thinning and main harvest areas ha), the work sheet automatically fill the column for each thinning and main harvest. Note: (1) Revenue distribution percentage for each stake holder is temporally used, therefore, in real estimation;
planner shall change the figures to suitable one for each stake holder.
Average harvest area = 588.47 (in 5 years period)Income Projection First term
Expected incom (%) 1000 GH Ced/ annualThinning 10 Fuel wood 2.3 25 0 0
Pole 1 23 10 0 0Pole 2 31 12 0 0Lumber 37 3 0 0
Thinning 15 Fuel wood 2.3 26 249 49Pole 1 23 12 1,149 229Pole 2 31 18 2,322 464Lumber 37 9 1,386 277
Thinning 20 Fuel wood 23 26 4,319 863Pole 1 23 12 1,993 398Pole 2 31 14 3,134 626Lumber 37 18 4,810 961
Main H Fuel wood 23 17 1,469 293Pole 1 23 10 864 172Pole 2 31 20 2,329 465Lumber 37 23 3,197 639
Total 27,221 5,444Unit Price Selling price projection by product/ one timber Fuel wood 6,037 1,207
Pole 1 4,006 801Pole 2 7,786 1,557Lumber 9,393 1,878Total 27,221 5,443
Incom shering Revenue Distribution projectionFSD 50 13,610 2,722Stool 15 4,083 816T council 10 2,722 544D assembry 25 6,805 1,361Total 27,220 5,443
Thinning 10 300 32 0.00 0.00 0 0Thinning 15 250 63 25.61 65.00 416 105Thinning 20 100 64 118.39 61.00 722 462Main H 150 187 0.00 63.00 0 0
150 209 32.62 56.00 274 382150 209 11.30 60.00 102 142
Referring harvesting plan Unit price and parcentage structure of fuel wood, low tension pole, high tension pole and lumber use come from price table 2.4.4. Thinning 15 fuel wood revenue X X = Thinning Volume (416) x Unit price ( 2.3 cedi) x % structure (26%) Sub total part Revenue distribution calculation part

53
(2) Calculation formula on same Excel work sheet as above is follows
note: Unit price (/ one timber) of Fuel wood, Pole 1 (low tension pole), Pole 2 (High tension pole), and lumber is explained on chapter 2.3.4.
Note: Revenue was calculated based on the harvested stands/timber number. The timber number is referred from figures on yielding table/growth prediction table and crown density times harvesting area as calculated above table (Excel)

54
2.3.9 Harmonize harvesting volume, planting size for stabile and sustainability management The measures for projection of future situations show on 2.3.7. Author mentioned that the planner shall taking into account harmonized plantation operation size, harvesting quantity, and as well as moderate income level to keep stable management and budgetary possibility. The planner can use above form by Excel work sheet shows on 2.3.7 for simulation. Planner type in the different figures of planting areas, harvesting areas on each columns of each calculation period (Terms), he/she get different figures of the situation on 40 years after. Planner can choice the suitable figures to meet general conditions of the organization’s capacity (Man power, budget, technical conditions, etc.). The Excel work sheet file is given in the attached data DVD (08.02.19 MoP modify Teak harvest volume projection 35 years.xls). Please use the file copying to your computer by different name, and change to your target area’s figures of latest condition (Term 1) of areas by age class, averaged crown density, and if necessary to change growth prediction data. You can calculate your projection on your Forest Reserves. 2.3.9 Find the “Measurable objectives” for the SFMP The measurable objectives for planting zone + conversion zone had defined on the first part of this section (2.3.2) that the SFMP needs to show the roads how to lead the forest reserve to approach the ideal conditions. The planner now can show it as follows: (1) Forest condition Forest condition is expected to change as below. (a) Planted areas change by age class and needed area for plant (now mainly in grass land) Volume? Term 1 Term 2 Term 3 Term 4 Term 5 Term 6 Term7 Term 8Planted are 1631.05 1837.13 1977.36 2108.97 2333.36 2494.90 2344.90 2194.90
0.00
500.00
1000.00
1500.00
2000.00
2500.00
3000.00
Term 1 Term 2 Term 3 Term 4 Term 5 Term 6 Term7 Term 8
系列10
系列9
系列8
系列7
系列6
系列5
系列4
系列3
系列2
系列1
Summing up the yielding projection for sustainable yielding chokingArea (ha) Term 1 Term 2 Term 3 Term 4 Term 5 Term 6 Term7 Term 8 UnitAge class0 1311.30 1105.22 964.99 833.38 608.99 447.45 597.45 747.45 haAge class1 1244.90 250.00 250.00 250.00 250.00 250.00 250.00 250.00 haAge class2 88.46 1244.90 250.00 250.00 250.00 250.00 250.00 250.00 haAge class3 0.00 88.46 1244.90 250.00 250.00 250.00 250.00 250.00 haAge class4 25.61 0.00 88.46 1244.90 250.00 250.00 250.00 250.00 haAge class5 118.39 25.61 0.00 88.46 1244.90 250.00 250.00 250.00 haAge class6 109.77 118.39 25.61 0.00 88.46 1244.90 250.00 250.00 haAge class7 32.62 109.77 118.39 25.61 0.00 0.00 844.90 250.00 haAge class8 0.00 0.00 0.00 0.00 0.00 0.00 0.00 444.90 haAge class9 11.30 0.00 0.00 0.00 0.00 0.00 0.00 0.00 haTotal 2942.35 2942.35 2942.35 2942.35 2942.35 2942.35 2942.35 2942.35 ha
Age class 10 45- 09 40-44 08 35-39 07 30-34 06 25-29 05 20-24 04 15-19 03 10-14 02 5-9 01 1-4 00 Grass land
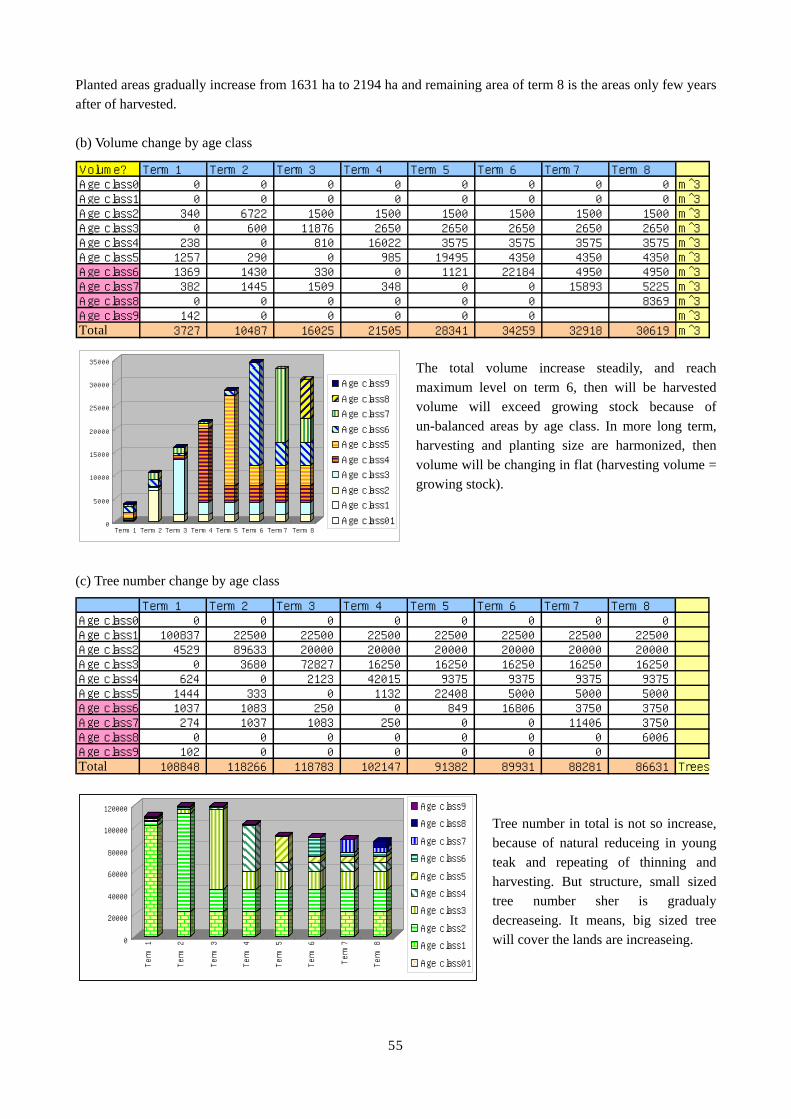
55
Planted areas gradually increase from 1631 ha to 2194 ha and remaining area of term 8 is the areas only few years after of harvested. (b) Volume change by age class
The total volume increase steadily, and reach maximum level on term 6, then will be harvested volume will exceed growing stock because of un-balanced areas by age class. In more long term, harvesting and planting size are harmonized, then volume will be changing in flat (harvesting volume = growing stock).
(c) Tree number change by age class
Tree number in total is not so increase, because of natural reduceing in young teak and repeating of thinning and harvesting. But structure, small sized tree number sher is gradualy decreaseing. It means, big sized tree will cover the lands are increaseing.
Volume? Term 1 Term 2 Term 3 Term 4 Term 5 Term 6 Term7 Term 8Age class0 0 0 0 0 0 0 0 0 m^3Age class1 0 0 0 0 0 0 0 0 m^3Age class2 340 6722 1500 1500 1500 1500 1500 1500 m^3Age class3 0 600 11876 2650 2650 2650 2650 2650 m^3Age class4 238 0 810 16022 3575 3575 3575 3575 m^3Age class5 1257 290 0 985 19495 4350 4350 4350 m^3Age class6 1369 1430 330 0 1121 22184 4950 4950 m^3Age class7 382 1445 1509 348 0 0 15893 5225 m^3Age class8 0 0 0 0 0 0 8369 m^3Age class9 142 0 0 0 0 0 m^3Total 3727 10487 16025 21505 28341 34259 32918 30619 m^3
0
5000
10000
15000
20000
25000
30000
35000
Term 1 Term 2 Term 3 Term 4 Term 5 Term 6 Term7 Term 8
Age class9
Age class8
Age class7
Age class6
Age class5
Age class4
Age class3
Age class2
Age class1
Age class01
Term 1 Term 2 Term 3 Term 4 Term 5 Term 6 Term7 Term 8Age class0 0 0 0 0 0 0 0 0Age class1 100837 22500 22500 22500 22500 22500 22500 22500Age class2 4529 89633 20000 20000 20000 20000 20000 20000Age class3 0 3680 72827 16250 16250 16250 16250 16250Age class4 624 0 2123 42015 9375 9375 9375 9375Age class5 1444 333 0 1132 22408 5000 5000 5000Age class6 1037 1083 250 0 849 16806 3750 3750Age class7 274 1037 1083 250 0 0 11406 3750Age class8 0 0 0 0 0 0 0 6006Age class9 102 0 0 0 0 0 0Total 108848 118266 118783 102147 91382 89931 88281 86631 Trees
0
20000
40000
60000
80000
100000
120000
Term
1
Term
2
Term
3
Term
4
Term
5
Term
6
Term
7
Term
8
Age class9
Age class8
Age class7
Age class6
Age class5
Age class4
Age class3
Age class2
Age class1
Age class01

56
(d) Zonetion area change
The conversion zone is planed to change plantation zone, and finally (Term 8), all conversion areas are to be categorized as plantation zone. (Plantation zone harvested and replanted is defined as plantation zone area).
(e) Harvesting volume change (Thinning and Main harvesting) (Area, Volume, Stands number)
Area
Term 1 Term 2 Term 3 Term 4 Term 5 Term 6 Term7 Term 8Thinning 144.00 114.07 1333.36 1583.36 1744.90 750.00 750.00 750.00 haHarvest 43.92 109.77 118.39 25.61 88.46 400.00 400.00 444.90 haPlant 250.00 250.00 250.00 250.00 250.00 250.00 250.00 250.00 ha
0.00
200.00
400.00
600.00
800.00
1000.00
1200.00
1400.00
1600.00
1800.00
2000.00
Term 1 Term 2 Term 3 Term 4 Term 5 Term 6 Term7 Term 8
Thinning
Harvest
Plant
Volume
Term 1 Term 2 Term 3 Term 4 Term 5 Term 6 Term7 Term 8Thinning 567 287 3920 8216 9541 3970 3970 3970 m^3Harvest 523 1445 1509 348 1059 6734 7522 8369 m^3Total 1090 1732 5429 8564 10600 10704 11492 12339 m^3 Tree Number
Term 1 Term 2 Term 3 Term 4 Term 5 Term 6 Term7 Term 8Thinning 1138 1865 35028 36076 24954 16250 16250 16250 TreesHarvest 376 1037 1083 250 849 5400 5400 6006 TreesTotal 1514 2902 36111 36326 25803 21650 21650 22256
Term 1 Term 2 Term 3 Term 4 Term 5 Term 6 Term7 Term 8Plant Area 386.15 1587.13 1727.36 1858.97 2333.36 2744.90 2844.90 2942.35 haConversion 2556.20 1355.22 1214.99 1083.38 608.99 197.45 97.45 0.00 haTotal 2942.35 2942.35 2942.35 2942.35 2942.35 2942.35 2942.35 2942.35 ha
0.00
500.00
1000.00
1500.00
2000.00
2500.00
3000.00
Term 1 Term 2 Term 3 Term 4 Term 5 Term 6 Term7 Term 8
Conversion
Plant Area
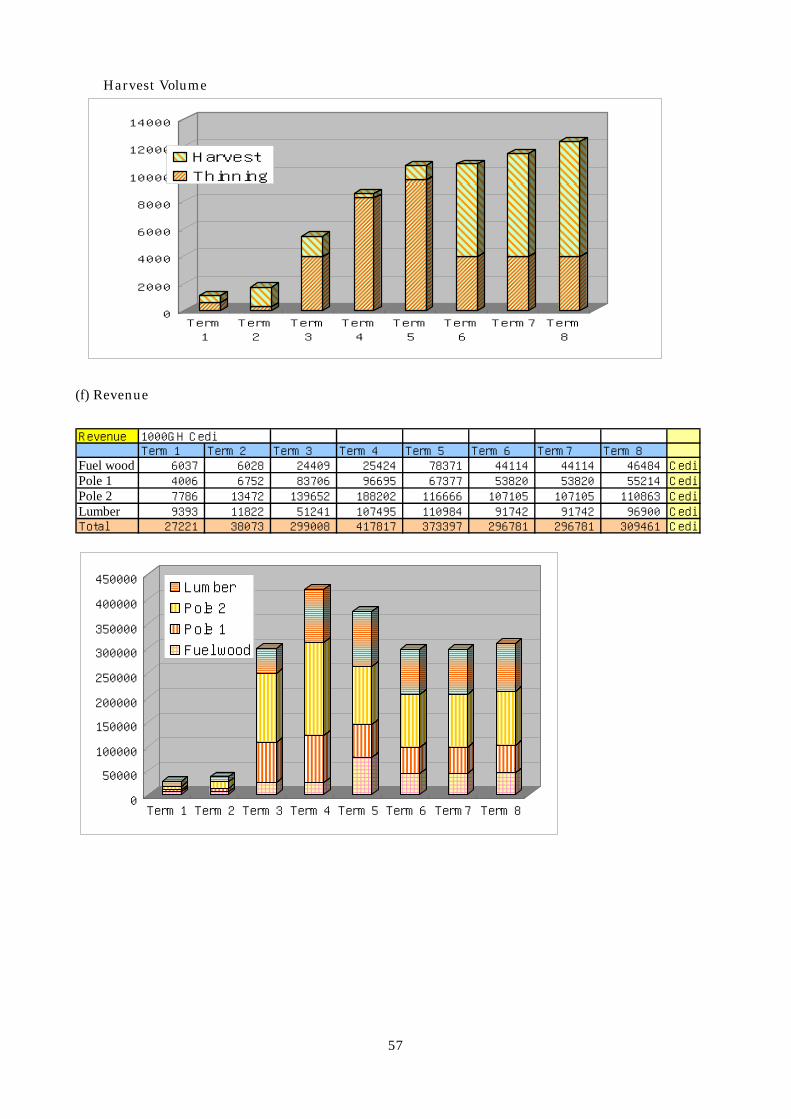
57
Harvest Volume
(f) Revenue Revenue 1000GH Cedi
Term 1 Term 2 Term 3 Term 4 Term 5 Term 6 Term7 Term 8Fuel wood 6037 6028 24409 25424 78371 44114 44114 46484 CediPole 1 4006 6752 83706 96695 67377 53820 53820 55214 CediPole 2 7786 13472 139652 188202 116666 107105 107105 110863 CediLumber 9393 11822 51241 107495 110984 91742 91742 96900 CediTotal 27221 38073 299008 417817 373397 296781 296781 309461 Cedi
0
50000
100000
150000
200000
250000
300000
350000
400000
450000
Term 1 Term 2 Term 3 Term 4 Term 5 Term 6 Term7 Term 8
Lumber
Pole 2
Pole 1
Fuel wood
0
2000
4000
6000
8000
10000
12000
14000
Term1
Term2
Term3
Term4
Term5
Term6
Term7 Term8
Harvest
Thinning

58
2.4 What shall be “The Goal” of the SFMP (On part 2 section 1) MoP requested to write “Goal of the forest management” on the part 2 (Proposals for the future management), but no other explanation for this item. What shall be written on this item? In general context, provably, to show clear feature of the forest after the planed forest operations are implemented as same as plan. The latest forest situation will change/improve ahead to the ideal situation. The goal means the ideal situation that shall be set the final target of the plan. The management plan shall be made as a mile stone or guiding point to the ideal forest situation. What is the changing situation toward an ideal situation? Zonetion of the reserve is fixed in principle. Harvesting the forest produces are realized as planed, then harvested forest volume/number will decrease. Annual growth increment may be not changed. In this meaning author recognized the “Goal” is defined as “at after one rotation years passed the forest structure in the target forest will change to Goal. Based on the 2.4 projection, 35 years after (Goal) forest situation can be described as follows. The planted areas are almost equally distributed, It means harvesting volume will be sustainable (continue same level) and expected income are also continue same level. In final situation expected that if yielding age set 35 years the plantation area by age class are expected 372 ha and logged over area 372 ha (2942 ha/(7age class + 1logged over area)); therefore one more rotation period is necessary for reaching ideal condition.
The “Goal of the Tain 1 forest reserve management” for Plantation area + Conversion area can describe as the above table. This table tells substantial targets of the SFMP in Tain 1. And shows the real meaning of the narrative description as realizing the sustainable forest management and contribute national and regional economic development. All operational plan are organized for the direction to this target.
Recommendation -8: Projection measures for Goal of the forest management Related on Part 2: Proposals for Future Management
Section 1: Goal of Forest Reserve Management Section 2: Beneficiaries of Forest Reserve Management
Examining calculation and projection for assuring sustainable yielding is expected. The projection also shows that the area managed relay to follow the plan set principle, after one lotion period (30-40 yeas after) area covered forest like as projected (age class distribution)
Target/Goar 35 years afterForest Structure by Age Class
Area (ha) Vol. (m^3) Tree Numb. Harvest Level (Vol) Expected(1000 standThinning Main Revenue
Age class0 747.45 0 0Age class1 250.00 0 22500Age class2 250.00 1500 20000Age class3 250.00 2650 16250Age class4 250.00 3575 9375Age class5 250.00 4350 5000Age class6 250.00 4950 3750Age class7 250.00 5225 3750Age class8 444.90 8369 6006Age class9 0.00 0 0Total 2942.35 30619 86631 3970 8369 309461

59
2.5. Institutional flame reform for strategic plan formation For the SFMP formation, MoP said that RMSC will support providing various data and information. In case management planning on Tain 1 forest reserve, RMSC conducted forest reserve inventory survey, and identified, flora and fauna that are important for environmental protection, forest stocks by compartment. But unfortunately, past management plan, base map, forest categorization/ vegetation map and etc. that are expected to provide by RMSC did not presented. At least digital boundary and compartment map on each forest reserve are expected to present for SFMP planners. It means, probably, the capacity of RMSC needs to enforce. On the other aspects, Author found, that FSD records and real field situation have not small gaps. The past operation planting, harvesting records itself uncertain, and it seams that FSD has no rules and regulations how to make the operational report/form and how/who have the responsibility to keep these records. There seams several reasons, that (1) FSD have no tradition to fix the operation areas on a map because there are no instruments and experiences for conducting land survey, (2) there are no reasons to conduct land survey on logged area or on planting area, because budget or income are not regulated by area (Logging is controlled by the number of stands, Planting is controlled by the number of the seedlings), (3) DM do not have interest to know the results of the operation, and to afraid to make clear the past results especially planting results, (4) there are so many times wild fire attack and lost new planting areas, and have not want to report it to the higher authorities. Then latest forest situation became into chaos. Even these back ground exist, if the latest condition is not good, the responsibility shall belongs the district manager; therefore, forest inventory that will make clear the failures under the sun, seams un-welcome job for the district forest officers. Therefore, probably, the district forest office does not positively allocate man power for the jobs on forest inventory. The uncertain latest forest situation can guide uncollected management objectives, and lead un-sustainable management. Honestly, every person does not want to know the bad news. Even so, SFMP planners need to know the latest forest situation as the bases of the new forest management plan. Under the MoP, the responsibility for formulating SFMP is belongs to a planning team, led by the Deputy RM in charge of Technical Operations. And member is expected, the respective DM, Regional CFM support team, Support staff from the RMSC, A representative each from the landowners and the DoA, Other representatives of local interest groups or specialists as required and in the transitional zone the assistance of the fire ecologists may be especially critical. The MoP not mentioned the secretary team who will conduct forest inventory, evaluation of the past operation, making maps, making Forest Inventory Book, and drafting a paper for the above planning team. The MoP did not explained clearly how to collect and evaluate the exiting information. Is a member of the team can carry the works for the data collection? Who have the responsibility to prepare Forest Inventory Book that recorded latest forest situation for the bases of the SFMP. MoP mentioned the basic map shall be prepared by RMSC, nevertheless, operation results maps are probably belongs to DM. MoP suggesting establishing a planning team but the team is temporally organization, and not has the function for field survey. Author recommends establishing a permanent organization/division for evaluating in Regional Forest Office and RMSC. In the nowadays situation DM have less interest to carry the evaluation of existing plantation areas because they have limited man power, no additional working allowances, limited tools and transportation

60
measurers. And the DM may feels that the evaluation may call a voice from higher authorities who are blamed to fail the plantation establishment, who has the blame to waist the national funds. Author feels if the Forestry Commission make orders to conduct these inventory to make clear, to conduct land survey for past few years Taungya plantation and private developer’s plantation, RM may convey the order to DM, then DM convey to Range Officer or Range Plantation Officer. Can the field officers implement this order? Forestry Commission can conduct this inventory under the contractual agreement with NGO or Consultant farm; nevertheless, for the view of sustainability, it may not suitable for all forest reserves. Therefore, author recommend following institutional reform:
a. Forestry commission shall make strategic plan formation plan for every forest reserve under the fixed years rotation system (10 year rotation)
b. RMSC shall set up permanent division for conducting forest inventory for every Forest Reserve (every year the permanent division shall conduct forest inventory (1/10 number of forest reserves), and stock the operational results based on the yearly operational report submitted by the DM.
c. RM shall set up Strategic Forest Management office and mandated as the secretary works for the SFMP formulating team that are established for each forest reserve on adhoc basis. The office will work permanently to draft the SFMP year by year to meet the periodic rotation plan as above “a”.
d. DM shall report annual operation results (Planted areas quantity and map, harvested areas and quantity) by the end of December of each year.
e. The RMSC division shall amend the Forest Inventory Book and base map in digital form by the end of March and send it to the related DM through RM.
For this reform and to realize the functions, RMSC needs to enforce their capacity building and tools such as obtaining satellite data, GIS soft ware, operational skills, digital maps for each forest reserve, and to train RM/DM officers to conduct land survey using GPS, mapping skills, GIS operations, etc. Author suggest that Forestry Commission shall establish a project for this capacity building and enlightenment all forest officers the importance of the SFMP and ground survey for ensuring the quality of the basic data for realizing the sustainable forest management The proposed project Skelton shows below: (1) Project Objectives: Effectively implement the expected functions of RMSC to support Forest Offices formulating the Strategic Forest Management Plan of each Forest reserve by means of providing necessary maps and evaluated latest forest condition data of the substantial forest reserve to the forest offices that are caring the works for Strategic Forest Management Plan formulating as explained on MoP (Manual of Procedures Forest Resource Management Planning in the High Forest Zone had published on March 1998). (2) Project Targets
1) Capacity development for providing necessary basic data for Strategic Forest Management Planning of the
Special Task Force Personnel 2) Dissemination the techniques on basic data preparation using satellite imagery and GIS for Field Offices of
Forestry Service

61
(3) Project Outputs
The project is expected to achieve the following outputs:
a. Capacity building the Task Force on GIS and Satellite imagery interpretation b. Conduct trials for field practice for providing base data for field office on 2 forest reserves c. Guide and assist the Task Force to implement field survey on a forest reserves in a districts by a Task Force
Team (3 teams conduct real works on 3 forest reserves). d. Assist on the job training conducted by the Task Force Teams for field office officers on basic data
preparation works. e. Evaluation the capacity of Task Force Member and trained member of the field offices.
(4) Project Activities
a) Capacity building the Task Force on GIS and Satellite imagery interpretation a)-1 Establish the Special Task Force with authorized functions and power. a)-2 Make OJT plans for obtaining the needed techniques. a)-3 Purchase GIS soft wares, GPS(s), personal computers and satellite data. a)-4 Conduct OJT on a sample area of a Forest Reserve. a)-5 Formulate Basic data maps and tables on the sample forest reserve. a)-6 Implement a seminar for introduction the new techniques to related field offices staff.
b) Conduct trials for field practice for providing base data for field office on 3 forest reserves b)-1 Select the a target Forest Reserve and District Forest Office. b)-2 Set up field offices in the District Forest Offices for the Task Force. b)-3 Provide materials including the satellite imagery(s) for the target Forest Reserve b)-4 Conduct field survey and on the job training for the district officers. b)-5 Submit the results of field survey and GIS maps to the District offices. b)-6 Conduct a seminar to find difficulties for the techniques to dissemination
c) Guide and assist the Task Force to implement field survey on a forest reserves in a districts by a Task Force Team (3 teams conduct real works on 3 forest reserves). c)-1 Select the target Forest reserves and District Forest Offices. c)-2 Set up field office in the District Forest Office for the Task Force. c)-3 Provide materials including the satellite imagery(s) for the target Forest Reserve. c)-4 Conduct field survey and on the job training for the district officers. c)-5 Submit the results of field survey and GIS maps to the District offices. c)-6 Assist Strategic Plan making by the district/regional offices to used the results prepared by the Task
Force.
d) Assist on the job training conducted by the Task Force Teams for field office officers on basic data preparation works.
d)-1 Select the target field offices for conducting on the job training for GPS/GIS techniques applying for basic data arrangement for the Strategic Management Planning.
d)-2 Conduct on the job training above. d)-3 Provide GIS maps and data for Strategic Forest Management Planning on the above Forest Reserve.
e) Evaluation the capacity of Task Force Member and trained member of the field offices.
e)-1 Conduct evaluation survey to measure the capacity improved of the Task Force
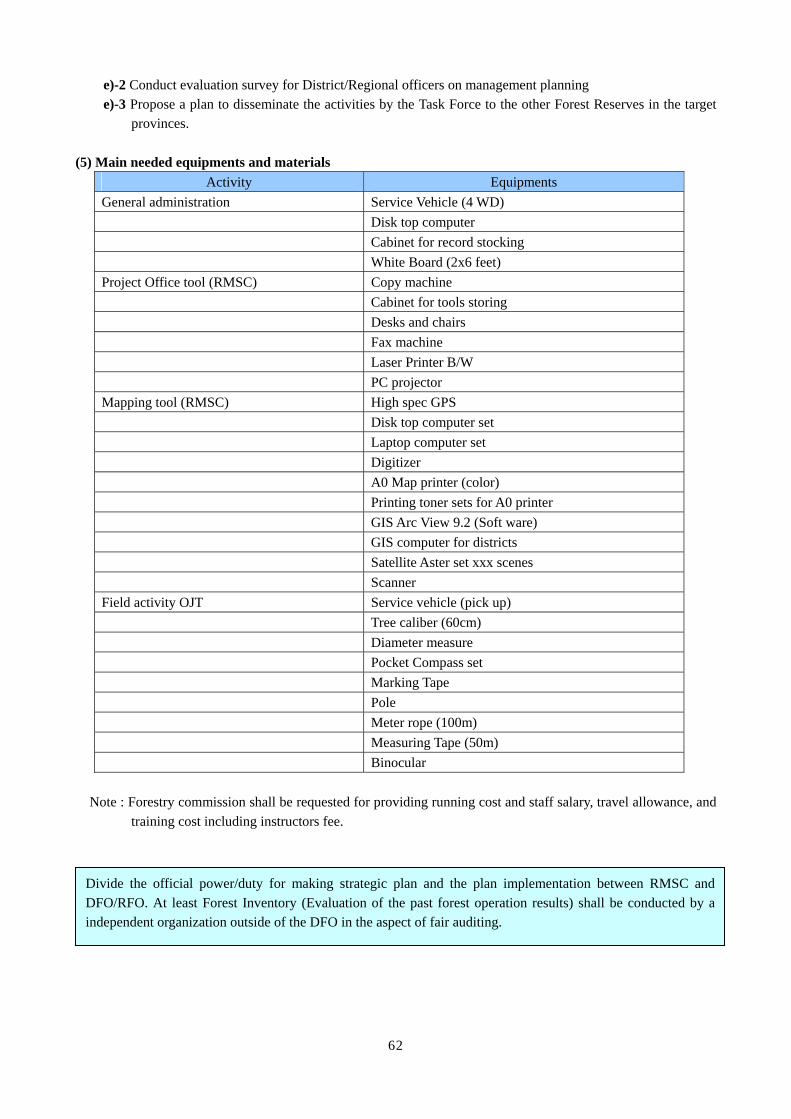
62
e)-2 Conduct evaluation survey for District/Regional officers on management planning e)-3 Propose a plan to disseminate the activities by the Task Force to the other Forest Reserves in the target
provinces. (5) Main needed equipments and materials
Activity Equipments General administration Service Vehicle (4 WD) Disk top computer Cabinet for record stocking White Board (2x6 feet) Project Office tool (RMSC) Copy machine Cabinet for tools storing Desks and chairs Fax machine Laser Printer B/W PC projector Mapping tool (RMSC) High spec GPS Disk top computer set Laptop computer set Digitizer A0 Map printer (color) Printing toner sets for A0 printer GIS Arc View 9.2 (Soft ware) GIS computer for districts Satellite Aster set xxx scenes Scanner Field activity OJT Service vehicle (pick up) Tree caliber (60cm) Diameter measure Pocket Compass set Marking Tape Pole Meter rope (100m) Measuring Tape (50m) Binocular
Note : Forestry commission shall be requested for providing running cost and staff salary, travel allowance, and
training cost including instructors fee.
Divide the official power/duty for making strategic plan and the plan implementation between RMSC and DFO/RFO. At least Forest Inventory (Evaluation of the past forest operation results) shall be conducted by a independent organization outside of the DFO in the aspect of fair auditing.

63
2.6 Establish Record keeping principle and standards of Modified Taungya for avoiding future conflicts MoP mentioned that the management plan making team shall collect following data/information before the task start; nevertheless, in real field, some information are not kept or could not find. In the case Tain 1, the JP team could not got access the data (even some paper shows but it was not clear as the one are officially recorded or not). Following table shows that the data will be provided by RMSC or other related organizations. On the column remarks explains the real availability during the plan preparation stage. Information Required for Plan Preparation on MoP (Table 2.2.2 on MoP)
Many data/map are not presented from relevant offices. It is not sure that this data/map is not exist/not made yet or could not found in their office. But ordinal forest office have to keep operation maps showing harvested record (year, area, location), planted record (year, area, location, and who planted). And probably, the related forest office made almost data above and stocked somewhere, then, the data became lost and can not used.
Items necessary for current situation In case of Tain 1 Forest Reserve Plans Previous management plan if ever produced No previous plan existed identified Plantation Management Plans Not presented to JP experts Annual Programmes of Work Do above TUC Plans Do above Reports TSP Inventory Reports Received from RMSC NTFP survey data Do above Annual reports Not presented to JP experts Plantation Inventory Reports Do LMC Reports Do Registers Compartment Register Received but fingers are observed not
same between presented maps; therefore, new map is needed
Felling register Received District Timber Revenue Returns Received Maps
Forest reserve boundary map Exiting Compartment Maps Progress Maps Plantation Maps Administrative boundaries Protected Areas
Different boundary lines and compartment lines sketch maps are presented. Not presented Presented but the maps are only rough sketch and not fit the real field (location, shape, etc.) Presented but Not sure Not existed in the target area.
Protection Areas already identified Not existed Provisional Forest and Vegetation Types Not presented Maps Fire sensitivity maps Not presented Location of PSPs, research plots Not existed Others Gazettment notice Presented Fire history by compartment Not existed Summary of relevant meteorological data
Summary of soil and site investigations Reports on status of fauna and protection plans Relevant plans mining organizations.
Available - do- - do-
Not presented

64
The document and related data keeping system may be very week. In ordinal government organization, generally make rules and regulations how to and how long preserve the official papers, and responsible section of the paper keeping. FSD probably have similar system, so the author want to believe. Even though, the needed records, for forest management plan preparation job such as samples of Taunya agreements, annual operational report for logging and planting, fire damaged history, are not presented. Forestry Commission shall reconfirm these regulations and audit how the document keeping system is worked, needed official documents are really kept or not. If the regulations are not clear, Forest Commission shall make new regulations for the strengthening document keeping system again. 2.7 Recommendations for other matters Author found some additional matters not directory connected for formulation of the SFMP, but important for the realizing sustainable forest management to be modified or need to change the situation. The additional recommendations are follows (1) Keep documents and maps Taungya implementation for avoiding future conflicts. (2) Make clear the locations for admitted farm, and reconfirm location map of these farm lands for the fringe communities (3) MoP requested to make fire hazardous map
Recommendation -6 Add Fire hazardous map as a supplement data on SFMP Related on Part 1: Current situation
Section 4 : State of the Forest Resource 4.6 Factors affecting the forest resource The fire damaged area shall be delineate roughly on the compartment map, and mentioned if the planted area affected to write when and who planted. The record shall be transfer to SH.
Recommendation -11 and 13 Preserve the Taungya Documents/ Agreements Related on Part 2: Proposals for Future Management
Section 5 Management for Production 5.4 Conversion / Plantation Development Area 5.4.3 Management prescriptions (Modified Taungya System (MTS)) 5.4.5 Rights And Responsibilities Under The Modified Taungya Responsibilities of FSD
Taungya agreement and related records form standardization are requested. The agreement and map shall kept by the legal third party for assuring the agreement effects 30 to 40 year after. The records keeping lure including officially the official document kept by lawyer is advisable
Recommendation -2 Location map of the admitted farm Related on Part1: Current situation
Section 2: Property rights 2.3 Domestic usufruct rights /customary rights Conduct interviews to farm holder and traditional authorities for finding which areas are admitted farm, and conduct land survey by GPS then make location map.

65
(4) When the DFO planed new plantation by Taungya or private companies, the plan shall be fixed the location not only the name of compartment but the real location surveyed by GPS and make map.
Recommendation-12 Fixing the locations for Plantation plan map Related on Part 2: Proposals for Future Management
Section 5 Management for Production 5.4 Conversion / Plantation Development Area 5.4.4 Indicative levels of production
How to fix the parcels for ( 10 years ) plantation plan Is the allocation of the planting plan area into MTS (Modified Taungya System) or HIPC or Private company shall be descried in the operational plan. In the participatory regnum, at least the areas MTS shall be open to the community Strategic plan part 2 basis
66
3. MoP Modification Introduction As a whole, it can be said that Manual of Procedure (MoP) describes the objectivities for zoning in Forest Reserves clearly. The contents of Part 1, Part 2, and Part 3 to be filled, which are described in MoP can be recognized as necessary ones, and the composition has a commonality of manuals for forest management plan formulation in other countries. The reason why FSD planning officers feel it is difficult to make FR Management Plan based on MoP is probably its insufficient explanation how to describe according to the content. For example, it is very difficult to identify what is difference between the words “goal (Part 2 section1)”, “General management objectivities (Part 2 section 3)”, and “measurable objectivities by each zone (Part 2 section 4)”. Therefore, further explanation is requested for the FSD planning offices to form the FR Management Plan. One person said, “MoP is very complicated, and need to be simplified”. Does it mean the MoP requests too much and shall some items be omitted? Generally, the process of formulating forest management plan is not very simple, planners are requested to have broad field of knowledge and experiences. In addition, documented records concerning tree plantation are necessary. The reason why MoP suggests the planning team shall included directors of District forest office and Regional forest office is that the planning works need broad knowledge and experiences and power. MoP describes that objectivities of management plan in measurable/countable manner shall be shown. For Teak planting, logging are general items for every same kinds of Forest Management Plan. It is not very tough for planners to describe quantitative objectivities. However, measurable objectivities on fauna protection area, hillside protection area, and so on may not easy. For avoidance of such confusion for completion of Part 1, Part 2, Part 3, some explanatory notes shall be added by each Part. As a whole, general principle/standards based on the national plan or guidelines shall be mentioned in Part 1, and, the planed works under the national plan or guideline, the reserved forest expects substantial amounts/quantity of produce shall be mentioned in the measurable manner in Part 2. Part 3 mentions who carries the plan by what kinds of measures, and how to monitor / evaluate the results for next plan making. Following proposals for MoP modification is developed taking account into an important discussions made with JP expert (Mr. Sato) and Counterparts at the second year of the PAFORM project (2005). The summary of discussion is attached below (appendix-xx). A proposal for additional explanations on important sections (sample/idea) for additional explanation notes are follows: (Bold letter part is copied from MoP, in italics is additional explanation proposed) PART 1: CURRENT SITUATION Section 1: Location And Extent 1.1 Geographical Location [And 100,000 Map] 1.2 Area, Perimeter 1.3 District Administration Additional note: Simple explanation and a map (if not available, a sketch map) showing the location of area including main towns, roads (national and provincial level), river and so on surrounding the Forest Reserve shall

67
be shown. Attachment of appendices of map is requested. .The reserve’s location and area shall be defined with location data of pillars (boundary pillars are defined based on the coordination system (longitude and latitude) or axis is expected). The defined boundary lines shall be delineated on a topographic map. If these records are not found, the planner carrying boundary pillars survey by GPS is advisable. If GIS map can use, the GPS data shall be put into the GIS Map. Area and Perimeter shall be calculated by the GIS computer. The map is requested to mention, map direction, scale, and legend. Section 2: Property Rights 2.1 Ownership of the Reserve Additional note: on A2.3.4 of the MoP describes” Firstly the forest reserves in Ghana are unique in that the land in the reserves and the forests are for the most part the property of the traditional landowners. The Forest Service is mandated only to manage them for the benefit of the owners and in the interest of the nation” The section 2 declares that the FMP is planned based on the respecting of such traditional right. On 2.1 shall explain the substantial traditional authority’s name and right and assure these rights by the plan. Table below is expected to list up related stool(s) and areas approximately
Ownership Area in ha District Assembly Remarks XXXX State XXXX Stool XXXX Stool
. 2.2 Date of Gazette and Management Rights (Dates of Any Excisions) Additional note: write the date of gazette and official number of the gazette paper 2.3 Domestic Usufruct Rights /Customary Rights Additional note: On 2.3, even the area as gazette forest reserve, traditional right shall be maintained as principle, nevertheless, to care the different objectivities for establishing the forest reserve, it may be necessary to restrict the right, If the reserve needs such restriction, the plan shall explain the reasons and significant level of the restriction. 2.4 Timber Harvesting Rights Additional note: 2.4 is mainly apply to the Natural High Forest area managed under the selective cutting. If the reserve have concessions, mention the concession name, area, authorized date and No. of the official paper, location compartment number(s) 2.5 NTFPs Commercial Harvesting Rights Additional note: If the reserve has the part of areas for NTFP for commercial collecting, the principle for NTFP collection manner or limit shall be mentioned on 2.5. If not have the special areas, the plan shall mention that the area is basically not allowed NTFP collection for commercial purpose (only allowed for domestic use).

68
2.6 Others (E.G. Prospecting or Mining Rights Plantation Development Rights) Additional note: if special right has not existed in the target area, mention only that the reserve has no special use right approved. Section 3: Local Context 3.1 Demography 3.2 Economy 3.3 Local People’s Relations with the Reserve 3.4 District Development Plan Additional note: Based on the socio-economic survey mentioned on A.2.5.2 of MoP, briefly explanations are requested on one or two paragraph(s) each. On 3.3 Name, and population of each fringe community is expected to mention (Using s simple table). Section 4: State of the Forest Resource 4.1 Physical Features Additional note: Simple descriptions about General feature of
Topography: land feature (gentle sloppy area,, mountainous area, or Savannah, grasslands etc in majority), Elevation: highest place, lowest place and average, and water/river system (name, direction of flow, etc.) Climate: rainfall, rainy/dry season (from when to when), temperature, Main wind direction on different
season, etc. Soil: main soil pattern based on national standards or FAO standards 4.2 Naturel Forest (Extent, Composition, Condition Class, GHI etc. And Reference to Summaries from the
National Inventory Included as Appendices) Additional note: Explain what kinds of natural forest (forest type, crown-density, main species, height and diameter, distribution (average, majority, etc) are covering the reserve. The location shall be mentioned by the compartments number
Forest classification item Area Main distribution area explanation (compartment, etc) Total
Forest distribution map is expected to add in this part .Following tables are example for explaining the condition of the natural forest by forest type
Table Volume m3/ha, Stem number/ha, Basal area/ha > 30 dbh > 70 cm dbh > 110 cm dbh remarks F type Mean RME E % Mean RME E % Mean RME E % F type 1 F type 21 F type 3

69
Total This type of tables for Volume, stem number, and basal area are general pattern of the forest Inventory survey to be done by RMSC. Therefore, if inventory report by RMSC is available, 3 patterns of the above table shall add on this part. If the reserve has harvestable size of stands in significant area, name list of dominant tree species shall be added in this section. 4.3 Plantation Forest (Extent, Composition, Condition- Details of the National Inventory And Summaries of
the Relevant Tables Provided as Appendices) Additional note: First, Briefly explain the historical view of the plantation establishment including activities by HIPC, MTS, and Private developer (Planted area, species, planted year, and planted compartment). Second, comparisons between planted record and latest remaining plantation, and the main causes why the differences are arisen (harvested, illegal felling, wild fire, etc.) shall be explained. The latest plantation area distribution map shall be prepared. If these data are not existed or missing, the planner shall implement “check survey” for identifying the remaining plantation areas using GPS. If GIS map is available, insert the check survey results into the map. The latest remaining plantation areas shall summarise on table form below is advisable.
Age Class Area (ha) Average Crown Density ( %)
0
1-4
5-9
10-14
15-19
20-24
25-29
30-34
35-39
40-45
Total
4.4 Non Timber Forest Product Resources Additional note: Explain briefly what kinds of NTFPs are generally used by the surrounding communities, how the people control the harvesting these NTFPs in sustainable manner, and the quantity of these NTFPs harvested in annual base if it possible. If the reserve has special areas for NTFPs for special community or special occasions, mention them. If the reserve does not have these special areas, mention the general rule or general custom (harvesting season, main usage such as home consumption or commercial purpose) and procedures to give approvals the usage of NTFPs If the reserve has the general standards for controlling NTFPs harvesting, to summarize about main products the harvesting level showing on following table is advisable
Name of NTFPs Allowable size or quantity /year
Harvestable location Name of compartment
Name of Permitted community
NTFP 1
70
NTFP 2 NTFP 3
4.5 Wildlife Resources Additional note: Based on inventory report on the natural conditions to be done by RMSC, identified main species on flora and fauna. If the report recognizes that there are endangered, rare, endemic etc specie within the FR, mention their names and level of importance or dangerous situation for protection. If the report did not recognize such important flora and fauna, explain general manner for the protection of wild life under the wild life protection law. 4.6 Factors Affecting the Forest Resource (Fire, Encroachment, Illegal Felling, Etc.) Additional note: Explain briefly about the difficulties for conserving/maintaining the reserve focus on (a) wild fire (how many ha was destroyed, frequency of fire breakout, main reason, and countermeasures), (b) encroachment (same), Illegal felling (same), and (c) other factors (same). Section 5: Past Management for Protection and Research 5.1 Environmental Protection Areas 5.2 Biodiversity Protection Areas Additional note: If the reserve is earmarked, show the areas on Map, and explain the location (related compartment and key land marks). Explain briefly about the flora and fauna and the protection condition, key factors for the protection. If no special area demarcated, describe“ There are no area is demarcated for biodiversity protection of flora and fauna protection”. 5.3 Fauna Protection Additional note: Explain legal and illegal hunting situation and how hunting affects on wild life/fauna protection in general 5.4 Fire Protection Additional note: In the Transitional zone, wild fire is very serious issue, therefore, detail explanations countermeasures against fire, damaged forest records (past several years record on fire incidence and statistic information on damaged areas) shall be described. This section is details of explanation made in section 4.6 above. Attach following table, if it is advisable
Year Number of fire Damaged area (ha) Needed area for replanting Remarks 2005 2006 2007 2008
71
5.5 Research Areas (Including PSPs) Additional note: If the reserve has research plots (Long term and periodical observation carried out by the research organization, university, and other responsible body), explain the contents of research (Objectives, Name of responsible organization, established year, etc.). If the reserve has no research plots, only describe “The reserve has no special plots for research” Section 6: Past Management for Production Additional note: Belief explanation and tables are requested to be prepared for 10 years in the past, plantation/regeneration, NTFPs production and revenue come from forest produce from the reserve management The forest produce results shall evaluate to comparer with the management plan that was covered past 10 years if the previous plan was made. 6.1 Timber Production Areas (Compartments, Harvesting Schedule, Progress Map, Production Levels Over
The Last 10 Years) Additional note: The felling/harvested volume or number of stand shall be mentioned year-by-year, in location, volume/number, unit price, and total revenue. Harvested places also shall be mention on management map compared with previous plan. Fill the following table is expected.
Harvested Revenue Name
Year Comp. Spp. Area(ha) volume number Total Unit/m^3 or / timber Logger
The line is filled by one logging site by a contractor or bidding (one logging company or payer of the revenue) Spp. is species harvested, if the harvested stands are including many species, dominant and high value specie
shall be mentioned. 6.2 Plantation Production Areas (Compartments, Planting Final Felling And Thinning Over The Last 10
Years, Other Operations Over The Last Five Years, Summary Of Production Over The Last 10 Years) Additional note: Same as 6.1, and fill the following table
Harvested Revenue Name
Harvested Year
Main or Thinning
Comp. Spp . Age Area(ha) volume number
Total Unit/m^3 or / timber
Logger
The line is filled by one logging site by a contractor or bidding (one logging company or payer of the revenue) “Spp”. is species harvested, if the harvested stands is natural stand, dominant and high value specie shall be
mentioned.

72
6.3 Non Timber Forest Production (Inc. Bush meat) (Current Management, Markets And Opportunities,
Main Results From NTFP Survey, Issue And Control Of Hunting Licences)
Additional note: If the reserve has special area for NTFPs, and collecting some revenue from NTFPs collectors, planner shall briefly explain, what kinds of NTFPs produce revenue, quantity and price filling the following table, but the reserve has no such special areas, explain the general condition and general benefit for the NTFPs collector or user.
Kind of NTFPs Amount/year Total revenue Remarks NTFP 1 NTFP 2 NTFP 3
Add information about hunting licence issued to whom and general condition to permit Section 7 Past Management for Local People 7.1 Domestic Use Rights Additional note: If the reserve has special dictionary benefit to local community, explain the special benefit during past 10 years. If not, only mention that “The domestic right had realized through principles explained above (Section 2.3, section 4.4, and Section 6.3)”. 7.2 Revenue Collected and Distributed to Owners in Last 10 Years Additional note: Briefly explain the income and expenditure during past 10 years including NTFPs. Total expenditure is total budget by each year allocated for the management (including expenditure for regeneration/planting, expenditure for stumpage selling bidding, general management cost such as boundary clearance, maintain of pillars. etc. and general administration cost such as field officers salary, maintenance for vehicles, facilities etc.) If a DFO manages several reserves and officers services, facilities maintenance reflecting to all reserves case/items allocates these costs to reflect ratio of the area to the total area. The detail figures shall be shown on section 8.3 below.
Total revenue Total expenditure Distributed revenue 1000Gh¢
Year 1000Gh¢ 1000Gh¢ Stool Traditional C. District Assemblies
Total
7.3 Cultural Sites Additional note: If the reserve has special cultural site, explain users, general usage, and mention the location on compartment map.

73
Section 8: Infrastructure and Administration 8.1 Access Roads, Tracks, Pillars, Forest Stations, Fg Posts, Forest Nurseries 8.2 FD Responsible Office And Staffing Additional note: This section requests planner to describe the latest situation for the administration facilities, therefore; explain in brief about forest road system (how long and /ha, general condition), boundary pillars (how many exist and how many lost or need to repair), field officers station, vehicles, bicycles, instruments such as GPS, pocket compass for field survey instruments, and main supplier/facility (nursery) for the reserve management, 8.3 Income & Expenditure Ratios Additional note: Explain in brief on past five years financial results, revenue from forest produce, and expenditure/budget used for the management for the reserve. FSD officers contribute to the management of the reserve but not only for the reserve. In this case, allocate the human cost reflecting the ratio of total reserves areas concern and the area of the reserve.
Year Income Expenditure Balance
Log sales Others Total Regeneration
Fire pre -vention
Wood sales
Etc. Total Admi Total
Note: Abbreviation “Admi” is General administration cost including staff salary Year can round in 5 years unit (1998-2002, 2003-2007) Section 9: Conclusion 9.1 Strengths and Weaknesses of Past Management 9.2 Opportunities and Threats to Future Management PART 2: PROPOSALS FOR FUTURE MANAGEMENT SECTION 1: GOAL OF FOREST RESERVE MANAGEMENT Additional note: Generally, long focused objectives or “Goal” is normatively described on this section such as “to realize sustainable management and as well as contribute society of the surrounding community”. This kind of description is suitable for the first paragraph but not enough. Planner is requested to show a visual feature, if the management activities are carried on at the planed term. It means, now if the reserve is occupied by denuded

74
grassland at 80%, the conditions shall be changed by conducting plantation works aiming at 80% cover of the Teak plantation. This kind of measurable target shall be shown on this section. Following table is advisable to show the “Goal”
ON 2008 (now) Goal Increase or Forest Type Area (ha) Structure(%) Area (ha) Structure(%) Decrease
Remarks
Closed N.F Middle N.F Open N.F Shrub Grass Man made F After harvest Farm other Total 100 %
Note: Possible, If you have forest inventory book data, this table is expected different sheets for deferent zone that are planed on section 3. Category of the Forest type shall be followed general standards to meet the reserved ecological conditions. SECTION 2: BENEFICIARIES of FOREST RESERVE MANAGEMENT 2.1 The national interest 2.2 The resource owners Additional note: This section shows the general principle for the management of the reserve SECTION 3: GENERAL OBJECTIVES AND ZONATION OF THE FOREST RESERVE Additional note: At the 1st paragraph on this section, planner is requested to show the zoning principle, what kind of zone will be set, The zones shall be shown on the Map and the following table.
Name of zone Area (ha) Objectives or reason Management principle 1. protection zone a. XXX protection b. hill side protection c. riverside protection d. Swamp Sanctuaries e. Special biological protection. f. etc. g. etc. 2. Timbre production zone a. production N.F b. Plantation F c. Convalescence area d. Conversion area

75
3. NTFPs production zone a. XX production b. etc. Total
Note : 1. The categories of zone shall follow the zoning proposal of the FMG. The total area shall be equal to the reserve’s total area. The definition of zones shall be followed to the explanation made on the MoP (A2.3.3). 2. Simply explain the most important point for explaining the objectives that the planner planed to set the zone on the column “Objectives”. 3. Simply explain the measures to realize the objectives such as key restrictions for felling, hunting, etc. on the column “Management principle” 4. Detailed explanation of the zoned management objectivities and principles shall be explain on 3.1 to 3.n and section 4, section 5 below. 3.1 Protection objectives and zones 3.2 Production objectives and zones 3.3 Beneficiary objectives and zones SECTION 4: MANAGEMENT FOR PROTECTION Additional note: This section explains the forest protection in each zone. The reasons why the zone is necessary and important are needed to be explained. Some zones are set to follow the governmental decision such as Special biological protection areas, Provenance protection areas, Special Biological Protection areas. Forest management regime of these zones shall strictly follow the regulations to meet the protection objectivities. On section 4, MoP requests planner to write (a) Measurable objectives, (b) Management Regime, (c) Management prescription, (d) Right and responsibilities for each protection zone. Planner may face difficulties how to define the measurable objectives for Hill sanctuary, for example. What is the measurable indicator to verify the level of protection? In same meaning, there are same difficulties to define the measurable indicators to other protection zones. MoP itself is describing the items (a) to (d) above in narrative manner. If the planner faces difficulties to show or to describe the measurable indicators for the management zone, the planner shall follow/copy the sentences as same as mentioned on the MoP in narrative explanations on the MoP related sections. 4.1 Hill Sanctuaries 4.1.1 Measurable objectives 4.1.2 Management regime 4.1.3 Management prescriptions 4.1.4 Rights and responsibilities Additional note: Basically follow the description on MoP (A.2.6 2.1 as Measurable objectives, A2.6.2.3 as Management regime, A2.6.2.4 Management prescriptions, and A.2.6.5 as Rights and responsibilities). If some local modification is needed, add the needed matter as second paragraph of A.2.6.2.3 instructed. 4.2 Swamp Sanctuaries 4.2.1 Measurable objectives 4.4.2 Management regime 4.4.3 Management prescriptions

76
4.4.4 Rights and responsibilities 4.3 Provenance protection areas 4.3.1 Measurable objectives 4.3.2 Management regime 4.3.3 Management prescriptions 4.3.4 Rights and responsibilities 4.4 Special biological protection areas 4.4.1 Measurable objectives 4.4.2 Management regime 4.4.3 Management prescriptions 4.4.4 Rights and responsibilities 4.5 Cultural Areas 4.6.1 Measurable objectives 4.6.2 Management regime 4.6.3 Management prescriptions 4.6.4 Rights and responsibilities 4.6 Research Areas 4.7.1 Measurable objectives 4.7.2 Management regime 4.7.3 Management prescriptions 4.7.4 Rights and responsibilities 4.7 Fauna Protection Areas 4.8.1 Measurable objectives 4.8.2 Management regime 4.8.3 Management prescriptions 4.8.4 Rights and responsibilities 4.8 Fire Buffer Zone 4.9.1 Measurable objectives 4.9.2 Management regime 4.9.3 Management prescriptions 4.9.4 Rights and responsibilities 4.9 Fire Shelterbelts 4.9.1 Measurable objectives 4.9.2 Management regime 4.9.3 Management prescriptions 4.9.4 Rights and responsibilities Additional note: From 4.1 to 4.9, basically describe same scene to follow the descriptions of MoP related part (A.2.3 to A.2.9). If these is a protection zone can be divided into several parts, which have different protection level, write the area for each different protection levelled part, and explain management regime, management prescriptions, and right and responsibility to meet the protection measures or principle of each part.

77
4.10 Convalescence (and Enrichment) Areas 4.10.1 Measurable objectives 4.10.2 Management regime 4.10.3 Management prescriptions 4.10.4 Rights and responsibilities Additional note: Convalescences area is defined as “Forest which due to either the effects of past logging or fire is now at stage where it can not be logged in the present management cycle. A guide of 15m2 /ha basal area or less is indicative in this case” and the objectives as “Area left to regenerate until commercially sized timber available for felling” This means the zone shall be maintained until the forest stands to reach enough size for harvest. The area where young natural forest regenerated in natural after illegal logged is not needed to be replanted, nevertheless, these regenerated parts need to protect from felling, therefore, these areas/parts need to set aside from ordinal rotation system of the selecting cutting system. Measurable objectives is shown by area, target size of stands for recombine to log production zone, and years or rotation periods to be kept as the convalescences zone. Management prescription is expected to explain how to maintain the regenerated stands from felling. And if special treatments are needed, explain how the enrichment shall be carried out (Species, number of seedlings/ha), or tree improvement treatment, etc. Rights and responsibilities is expected to explain restrictions for the community people including collection of NTFPs with reasonable reasons and terms of the restrictions may continue, if the general customary right of the reserve are not applied to this regenerated areas. SECTION 5: MANAGEMENT FOR PRODUCTION 5.1 Timber Production Area 5.1.1 Measurable objectives 5.1.2 Management regime 5.1.3 Management prescriptions 5.1.4 Indicative levels of production 5.1.5 Rights and responsibilities Additional note: Timber production area is the most important and popular by means of sustainable yielding management. Generally in Ghana, natural tropical rain forests are included in this category, and long time managed by concessions under selective cutting system. On the Transition Zone in Ghana, area of this kind of rich natural forest may be limited; therefore, principally, additional note is needed for this category. If the reserve has significant level of rich natural forest as defined this category/zone, the plan shall show the allowable harvesting volume/year, cutting ratio in means of volume, lower limitation for cutting stands by means of volume/ha and lowest allowable diameter size/dbh, cutting rotation year, and limitation of harvesting area/year (basically the area=(total area of the Management Unit)/(rotation year)). These conditions are the bases to assure the sustainable yielding. On 5.1.1 shows Measurable objectives. It means 5.1.1 shall shows quantity of log/timber harvestable/year. 5.1.4 also shows “Indicative levels of production. How difference between these 2 items? In general, selective cutting volume per year is equivalent to the total growth increment/year, then total forest in a management unit maintain total volume and capacity of total yearly growth. As Item 5.1.1 shows the harvestable size/volume per year, then
78
5.14 shall explain the suitability of the harvest size assuring the sustainable yielding under the selective cutting system of the Management Unit. Nevertheless, the problems/difficulties is how to show the reasonable reasons for defining the harvestable size/volume per year. The planner needs to collect the data related to the annual growth of the targeted management unit. Generally, on Teak man made forest concern, forestry university, and/or forestry science institutions have some information about growth prediction of Teak (please see5.3.4 Indicative levels of production below . The section is explaining a yielding table for Teak man made growth prediction.). For natural forest concern, permanent growth increment survey plots data are available. If you can not find any data above, you have to make your data to collect own field survey. The measures you can find on some text book on wood measurement. The official procedures how to make a growth prediction table is not mentioned on the MoP. 5.2 NTFP Production 5.2.1 Measurable objectives 5.2.2 Management regime 5.2.3 Management prescriptions 5.2.4 Indicative levels of production 5.2.5 Rights and responsibilities Additional note: The MoP describes that” a measurable objectives will be that the harvestable volume is maintained or increased, and that the boundaries of the area are respected by other forest users” therefore, if the data is available for the suitable size of harvest. Forest-produce, such as Rattan, the planner shall show the limitation of quantity/year and controlling measures (getting permission, and reporting the harvested results) on section 5.5.2 and 5.5.3 below. If such data is not available, measurable objectives shall be written “Maintain the size of harvest”, and right and responsibility write” management responsibility shall belong to the authorized collectors union or collaborative group/bodies who have to control themselves to avoid over collection for maintaining the sustainable harvest for next generation of people”. 5.3 Plantation Production Area Additional note: On the Transitional Zone, Teak plantation may be the most important forest for the sustainable yielding and forest protection, therefore; Plantation in the Production area shall be given more priority and need detailed information. At present, Teak plantation areas are not clearly recognized by the FSD. Planted areas are not recorded on management map. Taungya style forestation has been conducted on broad areas; nevertheless, the records, where the plantation was had carried out by whom is not clear. Planted places were in many cases duplicated. The latest situation of the Teak plantation is generally unknown. The planner needs to verify the official records, and may need to conduct field survey. Then fix the exact places, areas remaining, crown density of each remaining stands. The teak plantation shall be demarcated and delineated it’s areas on the management map, and give a sub-compartment names. 5.3.1 Measurable objectives Additional note: The measurable objectives of this section, MoP describes” Regular production of marketable produce providing a commercial return on investment (A2.7.4.1)”. This means is quantity of harvestable timber at substantial time flame. When the planted part reach the harvestable age, how many stands or cubic mater of logs

79
Author's Yielding prediction tableStating Vol Num. Thinning HarvestNumber Vol/ha N V N V
2.5 9007.5 800 60
12.5 650 106 300 31.817.5 375 143 250 6322.5 200 174 100 6427.5 150 198 150 18732.5 150 209 150 20937.5 150 209 150 209
can harvest and to maintain production level haw many ha of replanting is necessary? The detail calculation process shall be shown on 5.3.4 below. Here the planner is requested to show the target level of yearly producing in future. 5.3.2 Management regime Additional note: on the management regime, MoP describes that the descriptions shall be expected “Plantations established by use of seedling stock (rarely direct seeding) and managed in accordance with well tested silvicultural principles specific to the particular species using thinning at defined intervals to maximize production of material of commercially desirable diameters”(A2.7.4.2). This description on the MoP is the common regime of the plantation forest, therefore, to insert the same sentence to your management plan. 5.3.3 Management prescriptions Additional note: No addition than MoP explanation on A2.2.7.4.3 to 4.12 5.3.4 Indicative levels of production Additional note: This section is expected to show the suitable reason that 5.3.1 mentioned figures (measurable target). This circulation method is not standardized. MoP does not show standard circulation formula or methods. Applicable yielding table is also needed. Planner needs to make a table shown on 4.2 of Part 1. Then project the situation in the future to slide the class of areas according to the expecting year (generally, 5 years period is used as an unit term). Then calculate a 5 years after situation using a yielding table and crown density. In Ghana transition zone, if the planner cannot find the applicable yielding table, use following table temporally. Repeat same sliding for more than 6 times (30 years future: more than at least 1 rotation period for Teak plantation). The measurable objectives will be defined; almost same areas plantation by age class and it will realize the stabile or continuous level of the harvestable quantity
Following table shows a temporary image describing the “Goal” as 35 years period’s target breakdown of Teak plantation area.
Target/Goar 35 years afterForest Structure by Age Class
Area (ha) Vol. (m^3) Tree Numb. Harvest Level (Vol) Expected(1000 standThinning Main Revenue
Age class0 747.45 0 0Age class1 250.00 0 22500Age class2 250.00 1500 20000Age class3 250.00 2650 16250Age class4 250.00 3575 9375Age class5 250.00 4350 5000Age class6 250.00 4950 3750Age class7 250.00 5225 3750Age class8 444.90 8369 6006Age class9 0.00 0 0Total 2942.35 30619 86631 3970 8369 309461
80
5.3.5 Rights and responsibilities Additional note: No addition beyond MoP explained on A2.7.4.17. 5.4 Conversion / Plantation Development Area Additional note: Conversion area is defined as “Areas where forest cover and regeneration is minimal and might be suitable for conversion to plantations”. A guide of “5m2 / ha basal area or less” would suggest this condition”(MoP A.2.7.5). And the areas shall be managed for “to restore tree cover on severely degraded areas of the forest reserve”. Through the establishment of plantations, the areas shall be managed in order to restore environmental functions and to generate revenue for the resource owners (MoP A2.7.5). The areas are expected to be categorized into Plantation Development Area above. But it is not mentioned in MoP when the category will be changed. Planner may need what kind of condition is needed for change of conversion area into Plantation development area. Maybe the planted area that reached to the necessary level to some extent the stand volume can be measured. In general, the planted part reach to similar level of yielding table showing condition, exceeded age 5 is suitable. But growing condition is poor, wait until the average dbh of stand reached to 10 cm. 5.4.1 Measurable objectives Additional note: The measurable objectives shall be mentioned how many ha are categorized into this class, and how many ha shall be planted in the substantial years of range. Then the conversion area will be diminished by the year XXX in briefly the detail process for converting to Plantation development area shall be explained on the section 5.4.4 below. 5.4.2 Management regime 5.4.3 Management prescriptions 5.4.4 Indicative levels of production 5.4.5 Rights and responsibilities Additional note: No addition for these 4 sections. SECTION 6: MANAGEMENT FOR LOCAL PEOPLE 6.1 Revenue from forest reserve management Additional note: this section shows the expected level of the revenue to share the profits with local beneficiaries and land owner/traditional authority. Therefore, every zone managed according to the regimes above, then how much revenue will be gained is the main term of this section. Project the possible value for coming significant years in yearly average bases.
81
6.1.1 Measurable objectives Additional note: On this section, MoP requests planner to write “To ensure that as owners of the reserve, the people of ............ shall receive the gross revenue arising from the utilization of the forest reserve in accordance with this management plan, less any deductions the Forest Service is authorized to make by law in order to carry out its operations (A2.82.1.)” 6.1.2 Management regime 6.1.3 Management prescription 6.1.4 Indicative levels of revenue 6.1.5 Rights and responsibilities 6.2 Access to forest products for domestic use 6.2.1 Measurable objectives 6.2.2 Management regime 6.2.3 Management prescription 6.2.4 Indicative levels of production 6.2.5 Rights and responsibilities Additional note: No special advice to be added for the items on 6.2 above PART 3: PROPOSALS FOR IMPLEMENTATION Additional note: No special advice to be added for Part 3. SECTION 1: ADMINISTRATION AND FINANCE 1.1 Infrastructure development and maintenance 1.1.1 Types of Activity 1.1.2 Operational Arrangements 1.2 Reserve/FMU administration 1.2.1 Responsibilities 1.2.2 Operational Planning Process 1.3 Reserve finance 1.3.1 Objectives 1.3.2 Financial agreement SECTION 2: MONITORING and REVISION 2.1 Monitoring system 2.1.1 Objectives [accountability, transparency, assess progress] 2.1.2 Parameters/indicators. 2.1.3 Records and reporting 2.2 Procedures for revision of the plan

82
Annex- 1 Recommendation items identified on the attached evaluation sheet are follows Following are rough summary on problem/difficulty picked from comparison with MoP requesting and drafted Management Plan. Details on item by item are shown on the attached supplementary data Disc Recommendation-1: Fix the reserved boundary on a digital Map Related on Part 1: Current situation
Section 1 Location and Extent 1.2 Area, perimeter Re survey boundary pillars by GPS and describe the position (Longitude and Latitude) on the Reserve Forest location Map which is defined coordination system. Recommendation-2 Related on Part1: Current situation
Section 2: Property rights 2.3 Domestic usufruct rights /customary rights Conduct interviews to farm holder and traditional authorities for finding which areas are admitted farm, and conduct land survey by GPS then make location map. Recommendation-3 Related on Part 1: Current situation
Section 4 : State of the Forest Resource 4.2 Natural forest Preparation a digital base map on the forest reserve and identical compartment map on the ground as well. Recommendation-4 Related on Part 1: Current situation
Section 4 : State of the Forest Resource 4.2 Natural forest The forest distribution of different forest type shall be demarcated within a compartment and gives name as sub compartment. Visitation/forest type map is needed, Use satellite imagery to divide the areas/compartment into forest types categories. Recommendation-5 and 7 and 9 Related on Part 1: Current situation
Section 4 : State of the Forest Resource 4.3 Plantation forest Section 6: Past Management for Production 6.2 Plantation production areas
Related on Part 2 Proposals for Future Management Section 5 Management for Production
5.4 Conversion / Plantation Development Area 5.4.1 Measurable objective The location shall be surveyed by GPS at every corner of the planted (Not the planting plan) area boundary by FSD officer together with planted body ( Taungya farmers, private developers, and planted contractors) The agreement or contracting for Taungya, private developer, and contractors shall be attached the area map shows what compartment and location in the compartment. Recommendation-6 Related on Part 1: Current situation
Section 4 : State of the Forest Resource 4.6 Factors affecting the forest resource The fire damaged area shall be delineate roughly on the compartment map, and mentioned if the planted area affected to write when and who planted. The record shall be transfer to SH Recommendation-8
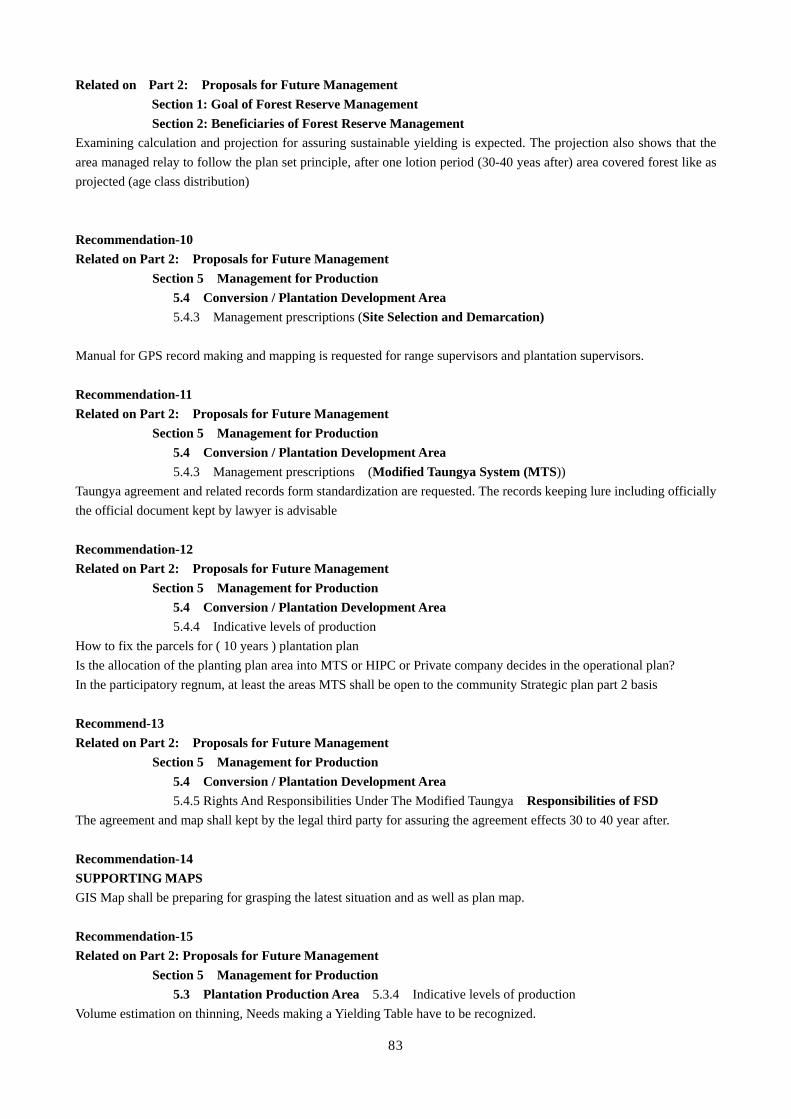
83
Related on Part 2: Proposals for Future Management Section 1: Goal of Forest Reserve Management
Section 2: Beneficiaries of Forest Reserve Management Examining calculation and projection for assuring sustainable yielding is expected. The projection also shows that the area managed relay to follow the plan set principle, after one lotion period (30-40 yeas after) area covered forest like as projected (age class distribution) Recommendation-10 Related on Part 2: Proposals for Future Management
Section 5 Management for Production 5.4 Conversion / Plantation Development Area 5.4.3 Management prescriptions (Site Selection and Demarcation)
Manual for GPS record making and mapping is requested for range supervisors and plantation supervisors. Recommendation-11 Related on Part 2: Proposals for Future Management
Section 5 Management for Production 5.4 Conversion / Plantation Development Area 5.4.3 Management prescriptions (Modified Taungya System (MTS))
Taungya agreement and related records form standardization are requested. The records keeping lure including officially the official document kept by lawyer is advisable Recommendation-12 Related on Part 2: Proposals for Future Management
Section 5 Management for Production 5.4 Conversion / Plantation Development Area 5.4.4 Indicative levels of production
How to fix the parcels for ( 10 years ) plantation plan Is the allocation of the planting plan area into MTS or HIPC or Private company decides in the operational plan? In the participatory regnum, at least the areas MTS shall be open to the community Strategic plan part 2 basis Recommend-13 Related on Part 2: Proposals for Future Management
Section 5 Management for Production 5.4 Conversion / Plantation Development Area 5.4.5 Rights And Responsibilities Under The Modified Taungya Responsibilities of FSD
The agreement and map shall kept by the legal third party for assuring the agreement effects 30 to 40 year after. Recommendation-14 SUPPORTING MAPS GIS Map shall be preparing for grasping the latest situation and as well as plan map. Recommendation-15 Related on Part 2: Proposals for Future Management
Section 5 Management for Production 5.3 Plantation Production Area 5.3.4 Indicative levels of production
Volume estimation on thinning, Needs making a Yielding Table have to be recognized.

84
Advice-1 Related on Part 1: Current situation
Section 5: Past Management for protection and Research 5.4 Fire protection Make fire risk map surrounding the Forest reserve. And FMP follow the caution of the fire risk map. FMP shall prepare special operation plan if the risks are high than other forest reserves. Advice-2 Related on Part 1: Current situation Section 7
Past Management for Local People 7.2 Revenue collected and distributed to owners in last 10 years
Past records shall be disclosed even if the amount is very small. Advice-3 Related on Part 2: Proposals for Future Management
Section 5 Management for Production 5.3 Plantation Production Area 5.3.1 Measurable objective
Therefore, in this item for example “second category wood production (xx m^3/ha) basically through Tayngya” may more substantial measurable objective.

85
Annex –2 Evaluation sheet on Manual of Forest Management Plan formulation 08-02-28 PAFORM JP Expert This Paper is prepared by Mr. Miyazaki for facilitating the forest management plan making works to meet the real situations of the Forest Department of GH through simple evaluation that to compare with authorized Manual (MoP) and drafted Strategic Plan for Tain 1(FMP) forest reserve. The author recognized that MoP requesting contents are not fully fulfilled by the drafted Management Plan. This evaluation sheet trying to identify the difficulties/problems why the draft could not fulfilled the contents, and wants to challenge for finding solutions and/or harmonizing ways the MoP requests to meet the real capacity of the related organizations or staff. Items requested by MoP Description brief on Draft FMP Gap recognized Difficulties recognized Solutions (brief recommend) Section A : Strategic Plan MoP=Manual of Planning FMP= Forest Management Plan Part1: Current situation Section 1 Location and Extent 1.1 Geographical location < No detail request on MoP> Located in the Brong Ahafo
Region of Ghana and lies between latitudes 7˚ 22´ and 7º 41´ N; and longitude 2º 13´ and 2º 43´W.
------------------------------------ ------------------------------------ ------------------------------------
1.2 Area, perimeter < No detail request on MoP> Covers an area of 31 km² (3056
ha) The pillars were positioned at the change of direction of the boundary line and at approximately 800m intervals where the lines are longer.
Pillars location data and boundary map are expected to add as annex
The reserve established on 1930’ (British era). Pillars mined data (survey record) is probably missed. To find the data on the colonial time is almost no hope.
Recommend 1 Re survey boundary pillars by GPS and describe the position (Longitude and Latitude) on the Reserve Forest location Map which is defined coordination system.
1.3 District Administration < No detail request on MoP> The reserve is managed along
with Nsemere, Sawsaw and Yaya Forest Reserves and together these reserves constitute Forest Management Unit 18.
------------------------------------ ------------------------------------ ------------------------------------
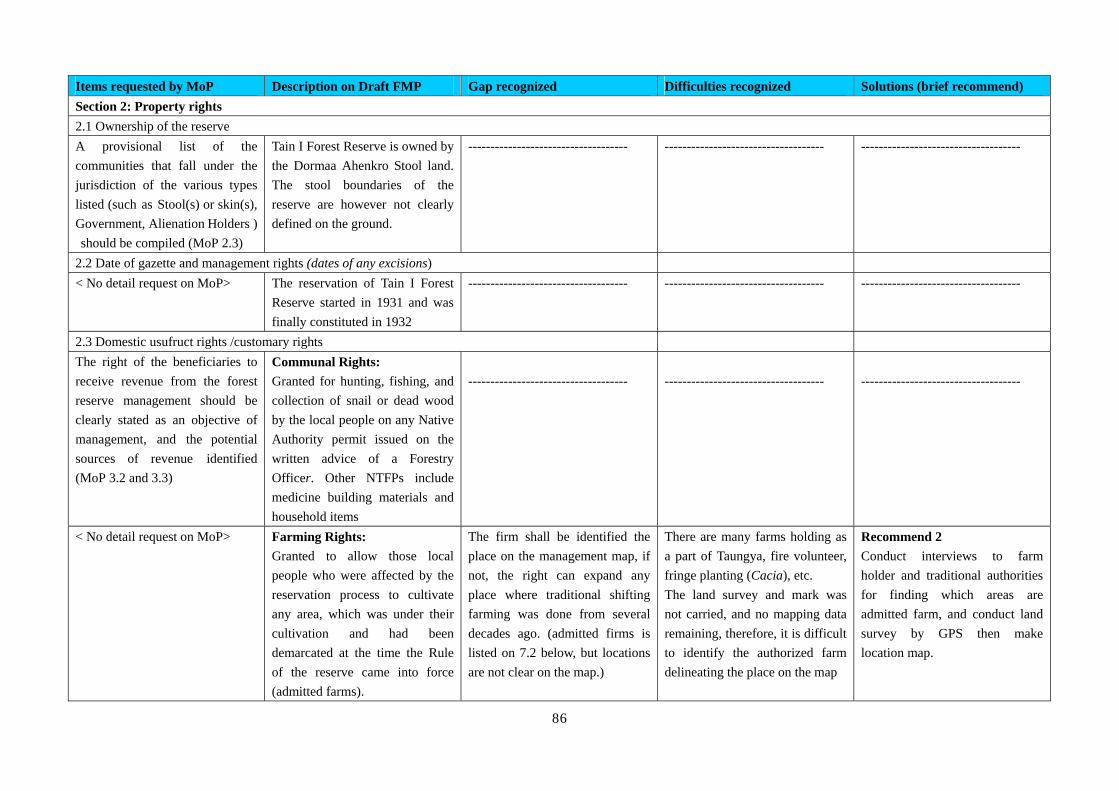
86
Items requested by MoP Description on Draft FMP Gap recognized Difficulties recognized Solutions (brief recommend) Section 2: Property rights 2.1 Ownership of the reserve A provisional list of the communities that fall under the jurisdiction of the various types listed (such as Stool(s) or skin(s), Government, Alienation Holders ) should be compiled (MoP 2.3)
Tain I Forest Reserve is owned by the Dormaa Ahenkro Stool land. The stool boundaries of the reserve are however not clearly defined on the ground.
------------------------------------ ------------------------------------ ------------------------------------
2.2 Date of gazette and management rights (dates of any excisions) < No detail request on MoP> The reservation of Tain I Forest
Reserve started in 1931 and was finally constituted in 1932
------------------------------------ ------------------------------------ ------------------------------------
2.3 Domestic usufruct rights /customary rights The right of the beneficiaries to receive revenue from the forest reserve management should be clearly stated as an objective of management, and the potential sources of revenue identified (MoP 3.2 and 3.3)
Communal Rights: Granted for hunting, fishing, and collection of snail or dead wood by the local people on any Native Authority permit issued on the written advice of a Forestry Officer. Other NTFPs include medicine building materials and household items
------------------------------------
------------------------------------
------------------------------------
< No detail request on MoP> Farming Rights: Granted to allow those local people who were affected by the reservation process to cultivate any area, which was under their cultivation and had been demarcated at the time the Rule of the reserve came into force (admitted farms).
The firm shall be identified the place on the management map, if not, the right can expand any place where traditional shifting farming was done from several decades ago. (admitted firms is listed on 7.2 below, but locations are not clear on the map.)
There are many farms holding as a part of Taungya, fire volunteer, fringe planting (Cacia), etc. The land survey and mark was not carried, and no mapping data remaining, therefore, it is difficult to identify the authorized farm delineating the place on the map
Recommend 2 Conduct interviews to farm holder and traditional authorities for finding which areas are admitted farm, and conduct land survey by GPS then make location map.

87
Items requested by MoP Description on Draft FMP Gap recognized Difficulties recognized Solutions (brief recommend) Clearly state that as an objective, the reserve will be managed to provide forest produce to meet domestic needs and type of products to be provided should be agreed. (MoP 4.2 and 4.3)
< Not clearly described on FMP on this section, but touched on later sections.>
------------------------------------
------------------------------------
------------------------------------
2.4 Timber harvesting rights Specific Timber Operating Specifications may apply to timber contracts to protect community rights and traditions from infringement contractors. (MoP 4.4)
The last timber harvesting rights in the forest for natural timber expired in 2005. The current degraded state of the reserve does not make it suitable for any natural timber harvesting holding. However, thinning and harvesting of matured Teak rights are given to contractors on permit basis.
------------------------------------
------------------------------------
------------------------------------
2.5 NTFP commercial harvesting rights The communities own traditional controls on collection of NTFPs - restriction. As much as possible these traditions should be supported and incorporated within the agreed management prescriptions. (MoP 4.5)
The local people have right to harvesting NTFPs on commercial basis. The permit is obtained from the FSD. However, the availability of these NTFPs has declined due to over exploitation persistent annual bushfires. Palm wine tapping, collection of palm fronds, and the collection of Borassus palm fruits are the NTFPs being enjoyed by the fringe communities of the reserve
------------------------------------
------------------------------------
------------------------------------

88
Items requested by MoP Description on Draft FMP Gap recognized Difficulties recognized Solutions (brief recommend) 2.6 Others (e.g. prospecting or mining rights plantation development rights) Any additional beneficiary rights the local people may have been granted at the time of reservation which are to be maintained or any new rights should be recorded in the objectives of management. (MoP 5.1)
No other particular right including mining was permitted.
------------------------------------
------------------------------------
------------------------------------
Examples of the additional beneficiary rights may include right to employment on plantation development programmes and rights of access to fetish sites and intellectual property rights. (MoP 2.4.5.2)
< No description on FMP> No description about employment regime for giving priority for fringe community farmers for planting, “Taungya”, and other works during the plan implement- tation period. Description shall detail on 5.4.5 (conversion area).
-----------------------------------
-----------------------------------
Section 3 : Local context 3.1 Demography < No detail request on MoP> The main communities are
Kwatire, Adantia, Kobedi, Forkuokrom, Afrasu I and II. The inhabitants in the (Afrasu I and II, Forkuokrom, Kobedi) are mostly migrants. The Kobedi community has a fair representation of Dagartis, Frafras and Bonos which are 32%, 26% and 24% respectively. About 58% of the population in Kwatire and Adantia are predominantly indigenous Bonos (Tony et al, 2006).
------------------------------------
------------------------------------
------------------------------------

89
Items requested by MoP Description on Draft FMP Gap recognized Difficulties recognized Solutions (brief recommend) 3.2 Economy < No detail request on MoP> Socio-Economic Determinants 3.2.1 Occupation
Agriculture dominates of the fringing communities. The major food crops grown are maize, cassava, plantain, yam beans, tomatoes, groundnuts, pepper. There are other livelihoods activities include petty trading, grass-cutter rearing, livestock farming, and hired labor. Previously, cocoa found in Kobedi, Adantia and Kwatire Fringe communities are now engaged in Teak plantation as cash crop.
------------------------------------ ------------------------------------ ------------------------------------
3.2.3 Land Tenure The land is the Dormaahene but has ‘lower’ Chiefs, ‘Odikro’ and Chiraahene. These chiefs lease out land to settler farmers and non land owning families. Wealthy farmer in Adantia and Kwatire acquire land through lease, or purchase. Majority of people (Over 80 %) in Afrasu I and II, Kobedi are sharecroppers Taungya system since a farmer would have his farm produce all to himself (Tony et al, 2006)
------------------------------------ ------------------------------------ ------------------------------------

90
Items requested by MoP Description on Draft FMP Gap recognized Difficulties recognized Solutions (brief recommend) 3.2.4 Income levels.
Income levels of majority people is far below $1 a day. Major income source is sales of more than half of their farm produce, mainly maize, yam and cassava. Afrasu I and II have no alternative source of livelihood. Other communities have petty trading, grass-cutter rearing, and livestock farming, to get additi- onal income. Majority of people in Afrasu I and II, Forkuokrom and Adantia earn between 2 and 3 million Cedis annually. Less than 20% of the people earn an annual income of 5million Cedis. (Analysis of workshops)
------------------------------------ ------------------------------------ ------------------------------------
3.2.5 Constraints The biggest constraint identified is the lack or difficulty to access credit to enhance economic activities. Others factors identified include poor transport facilities, inadequate technical support and poor marketing facilities. Difficulty to have access to land was also identified as having the ability to affect the general economic welfare of the people, especially the landless.
------------------------------------ ------------------------------------ ------------------------------------

91
Items requested by MoP Description on Draft FMP Gap recognized Difficulties recognized Solutions (brief recommend) 3.3 Local people’s relations with the reserve < No detail request on MoP> Forests play an important role for
forest-dependent people. The current degraded state of the reserve does not present signi- ficant products to the them. Local farmers participated taun- gya since 1972. Access to land for farming is very important for them. Taungya has facilitated this. Efforts to control illegal tim- ber felling have led to conflicts between forestry officials and the community members. Consultations between FSD and communities on reserve manage- ment planning and operation were not adequately done in the past.
------------------------------------ ------------------------------------ ------------------------------------
In an effort to improve upon community participation in the management of the reserve, and to improve upon governance in the allocation and use of the resources in general, Community Forest Committees (CFCs) were constituted. The effectiveness of these committees has not been very good though. They how ever present one of many structures through which participation can be enhanced.
------------------------------------ ------------------------------------ ------------------------------------
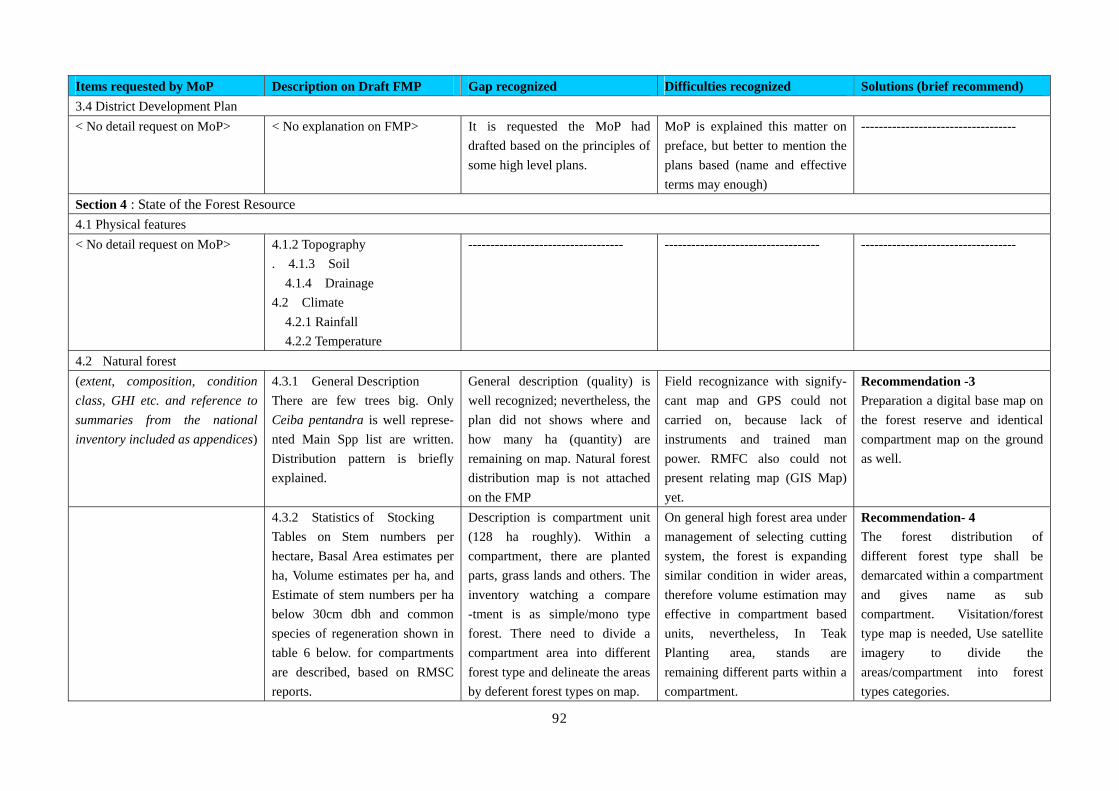
92
Items requested by MoP Description on Draft FMP Gap recognized Difficulties recognized Solutions (brief recommend) 3.4 District Development Plan < No detail request on MoP> < No explanation on FMP> It is requested the MoP had
drafted based on the principles of some high level plans.
MoP is explained this matter on preface, but better to mention the plans based (name and effective terms may enough)
-----------------------------------
Section 4 : State of the Forest Resource 4.1 Physical features < No detail request on MoP> 4.1.2 Topography
. 4.1.3 Soil 4.1.4 Drainage
4.2 Climate 4.2.1 Rainfall 4.2.2 Temperature
----------------------------------- ----------------------------------- -----------------------------------
4.2 Natural forest (extent, composition, condition class, GHI etc. and reference to summaries from the national inventory included as appendices)
4.3.1 General Description There are few trees big. Only Ceiba pentandra is well represe- nted Main Spp list are written. Distribution pattern is briefly explained.
General description (quality) is well recognized; nevertheless, the plan did not shows where and how many ha (quantity) are remaining on map. Natural forest distribution map is not attached on the FMP
Field recognizance with signify- cant map and GPS could not carried on, because lack of instruments and trained man power. RMFC also could not present relating map (GIS Map) yet.
Recommendation -3 Preparation a digital base map on the forest reserve and identical compartment map on the ground as well.
4.3.2 Statistics of Stocking Tables on Stem numbers per hectare, Basal Area estimates per ha, Volume estimates per ha, and Estimate of stem numbers per ha below 30cm dbh and common species of regeneration shown in table 6 below. for compartments are described, based on RMSC reports.
Description is compartment unit (128 ha roughly). Within a compartment, there are planted parts, grass lands and others. The inventory watching a compare -tment is as simple/mono type forest. There need to divide a compartment area into different forest type and delineate the areas by deferent forest types on map.
On general high forest area under management of selecting cutting system, the forest is expanding similar condition in wider areas, therefore volume estimation may effective in compartment based units, nevertheless, In Teak Planting area, stands are remaining different parts within a compartment.
Recommendation- 4 The forest distribution of different forest type shall be demarcated within a compartment and gives name as sub compartment. Visitation/forest type map is needed, Use satellite imagery to divide the areas/compartment into forest types categories.

93
Items requested by MoP Description on Draft FMP Gap recognized Difficulties recognized Solutions (brief recommend) 4.3 Plantation forest (extent, composition, condition- details of the national inventory and summaries of the relevant tables provided as appendices)
Matured Teak stand of about 1,125.0 ha are in nine compartments in the reserve. Private companies conducted planting activities 1000 ha in recent 5 years (locations are mentioned as compartment name/number) (On 4.4.1 of FMP). 825 ha was planted by Taungya from 2000 to 2007 (On 4.4.2 of FMP). And 400 ha planted by FSD (On 4.4.3 of FMP).
Latest forest condition is not verified (not conducted land survey of the extent of the parts of real plantation area remained) Planted locations are not recorded on area map but made rough sketch (Position shows the planted area is planed around the area somewhere within the nominated compartments or parts of compartments. Therefore, real planted results or changing situation (failed planting, ruined planted by bush fire, etc.)/latest remaining plantation areas are not recorded on any map.
The plantation plated 1970’ may be more than 1000 ha, but occasional inventory is difficult because of lack of tools and trained man power. The record keeping rules are not clearer. Some time, field officer dose not informed (not given to the field officers about the copies of the Contracture agreement, Taungya agreement, and agreement with private developers.
Recommendation-5 The location shall be surveyed by GPS at every corner of the planted (Not the planting plan) area boundary by FSD officer together with planted body ( Taungya farmers, private deve- lopers, and planted contractors) The agreement or contracting for Taungya, private developer, and contractors shall be attached the area map shows what comp- artment and location in the compartment.
4.4 Non timber forest product resources < No detail request on MoP> Listed NTFPs names, climbers,
herbs. Nevertheless, the possi -bilities of collection of these NTFPs are quite limited because the area is too degraded.
----------------------------------- ----------------------------------- -----------------------------------
4.5 Wildlife resources < No detail request on MoP> Explanation shall be followed the reports of wildlife authorities.
The wildlife resources identified are mainly mammals, birds and butterfly species. About 49 bird species, 31 butterfly species and 15 different kinds of mammals are said to inhabit in the reserve. (Based on RMSC report)
----------------------------------- ----------------------------------- -----------------------------------

94
Items requested by MoP Description on Draft FMP Gap recognized Difficulties recognized Solutions (brief recommend) 4.6 Factors affecting the forest resource SH: Stake Holders (fire, encroachment, illegal felling, etc.)
[No description on this item on FMP]
The situation of fire attacked history, encroachment and illegal felling identified are the nece- ssary information for the plan making but not clearer these history in description and as well as on map.
Wild fire is the most serious incident to degrade forest; Nev- ertheless, the records, when and where the fire attacked. The fire attack record is needed for evaluating the latest condition of the management area.
Recommendation -6 The fire damaged area shall be deriniate roughly on the compart- ment map, and mentioned if the planted area affected to write when and who planted. The record shall be transfer to SH
Section 5: Past Management for protection and Research 5.1 Environmental protection areas Categorized on Table 2.3.2 of MoP, the protection area (block of lands) shall be mentioned and explained the area and the rea- sons for setting up or established protection areas.
The reserve was demarcated and reserved for general protective purpose. No specific portions were marked out as environ- mental protected areas
----------------------------------- ----------------------------------- -----------------------------------
5.2 Biodiversity protection areas Biodiversity protection categories will be defined by the Botany Unit of RMSC and are based on ground surveys already under- taken. (3.2 on MoP).
[ No explanation made on this, but explained there are no subs- tancial area for environmental co- nservation reason as mentioned 5.1]
----------------------------------- ----------------------------------- -----------------------------------
5.3 Fauna protection Is the area covered by this potential area? (2.10 on MoP). Any specific areas required as Fauna Protection Areas will be defined by the Wildlife Department and mapped by RMSC. (3.1on MoP)
No specific zone has been ear- marked as fauna protection area.
----------------------------------- ----------------------------------- -----------------------------------

95
Items requested by MoP Description on Draft FMP Gap recognized Difficulties recognized Solutions (brief recommend) 5.4 Fire protection Compartments or part of compartment where fire risks are high in day season shall be identified and mapped.. The areas high fire risk needed some restrictions for forest operation works therefore, the area and special care shall be explained (3.13 of MoP). All narrow belts of forest areas should be retained as un logged areas ( 3.15 on MoP).
Annual forest fires were the major problem. To control the fire hazards, two additional Forest Guards were employed to inten- sify the patrolling of external and internal boundaries during the dry season. Again communities were educated and caution against use of fire in the vicinity of reserves especially during dry season.
No definition what compartments are high fire risk area on map. The map expected to define and categorize the area into score 1 to 5 as mentioned table 2.3.1 on MoP. [Tain 1 may define totally as high fire risks area.]
On small specific forest reserve such as Tain 1 to categorize fire risk levels into MoP mentioned criteria. It will be recognized a uniformed pattern. It may effect- tive to define the fire risk level map on rather broad area such as a district. The plan mentioned this district map and call attention, or substantial operational guide for fire protection
Advice -1 Make fire risk map surrounding the Forest reserve. And FMP follow the caution of the fire risk map. FMP shall prepare special operation plan if the risks are high than other forest reserves.
5.5 Research areas (including PSPs) The responsibility for mapping and demarcating the sites lies with the concerned research organization who should directly inform the RFO/DFO (3.10 of MOP) RMSC will provide maps of all Permanent Sample Plots (PSPs) (3.11 of MOP)
[ No description on this] No places allocated to PSP or other research plots.
----------------------------------- -----------------------------------
Section 6: Past Management for Production 6.1 Timber production areas (compartments, harvesting schedule, progress map, production levels over the last 10 years)
Timber exploitation occurred in the reserve. Common timber species exploited were Wawa, Odum, Kyere, Mansonia, Daho-ma, Danta, Ofram and Papao
Timber production under selecti- ve cutting, 40 years rotation sys- tem may apply high forest zone of tropical rain forest, therefore, in Tain 1 may not apply this section’s principle on natural
----------------------------------- -----------------------------------
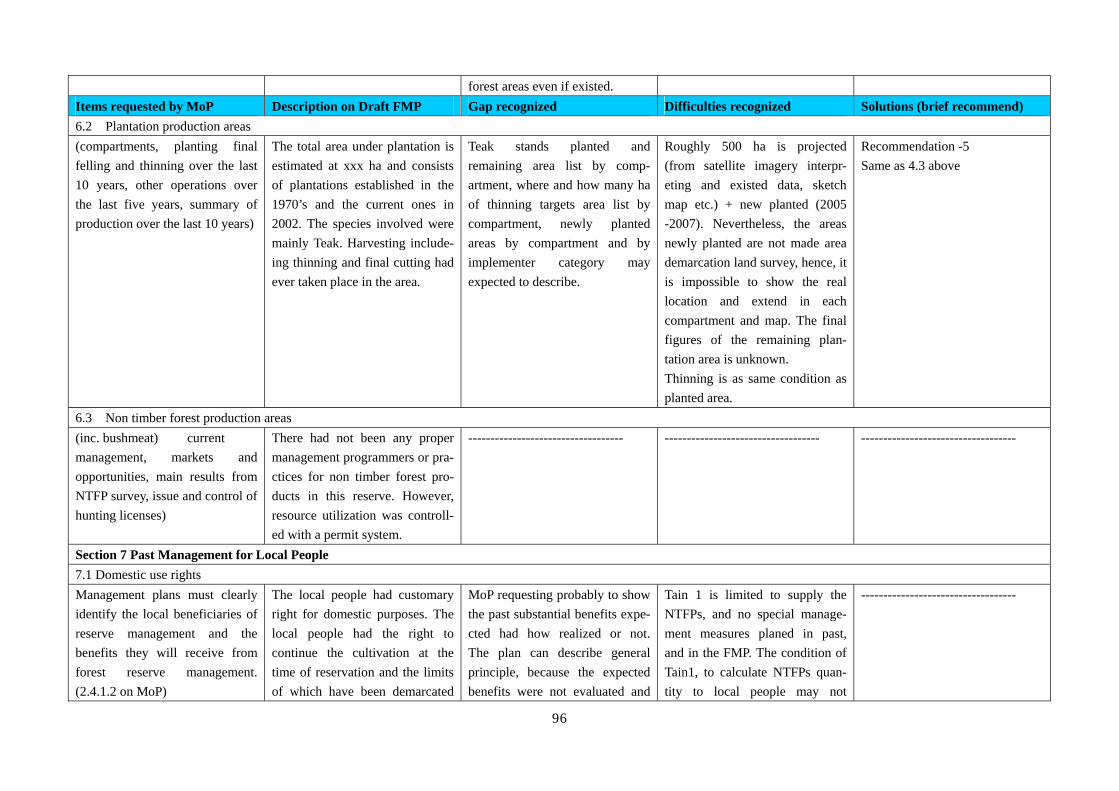
96
forest areas even if existed. Items requested by MoP Description on Draft FMP Gap recognized Difficulties recognized Solutions (brief recommend) 6.2 Plantation production areas (compartments, planting final felling and thinning over the last 10 years, other operations over the last five years, summary of production over the last 10 years)
The total area under plantation is estimated at xxx ha and consists of plantations established in the 1970’s and the current ones in 2002. The species involved were mainly Teak. Harvesting include- ing thinning and final cutting had ever taken place in the area.
Teak stands planted and remaining area list by comp- artment, where and how many ha of thinning targets area list by compartment, newly planted areas by compartment and by implementer category may expected to describe.
Roughly 500 ha is projected (from satellite imagery interpr- eting and existed data, sketch map etc.) + new planted (2005 -2007). Nevertheless, the areas newly planted are not made area demarcation land survey, hence, it is impossible to show the real location and extend in each compartment and map. The final figures of the remaining plan- tation area is unknown. Thinning is as same condition as planted area.
Recommendation -5 Same as 4.3 above
6.3 Non timber forest production areas (inc. bushmeat) current management, markets and opportunities, main results from NTFP survey, issue and control of hunting licenses)
There had not been any proper management programmers or pra- ctices for non timber forest pro- ducts in this reserve. However, resource utilization was controll- ed with a permit system.
----------------------------------- ----------------------------------- -----------------------------------
Section 7 Past Management for Local People 7.1 Domestic use rights Management plans must clearly identify the local beneficiaries of reserve management and the benefits they will receive from forest reserve management. (2.4.1.2 on MoP)
The local people had customary right for domestic purposes. The local people had the right to continue the cultivation at the time of reservation and the limits of which have been demarcated
MoP requesting probably to show the past substantial benefits expe- cted had how realized or not. The plan can describe general principle, because the expected benefits were not evaluated and
Tain 1 is limited to supply the NTFPs, and no special manage- ment measures planed in past, and in the FMP. The condition of Tain1, to calculate NTFPs quan- tity to local people may not
-----------------------------------

97
by the Forest Services Division. measured the quantity. effective and meaningful. Items requested by MoP Description on Draft FMP Gap recognized Difficulties recognized Solutions (brief recommend) 7.2 Revenue collected and distributed to owners in last 10 years The right of the beneficiaries to receive revenue from the forest reserve management should be clearly stated as an objective of management. (2.4.3.3on MoP)
[ nothing written here] {Thinning recorded on Nov 2003 comp 1 (20ha) and 15 (25ha) are founded within the bidding history table.}
The MoP may requested to show the quantity of the received revenue to stake holders in past time, the plan did not touch about the revenues small number of stands harvested by probably thinning..
Tain 1 was conducted no main harvest and thinning (6.2 on FMP), therefore, log oriented revenues were not provided. The Plan shall describe the reasons that the real revenue was not distributed.
Advice – 2 Past records shall be disclosed even if the amount is very small.
Traditional NTFPs management measures shall be identified if any (2.4..4.5 on MoP)
[ nothing written here] “No special management criteria existed in past” is the explanation on 2.5 of FMP
---------------------------------- ----------------------------------
Specific Timber Operating Speci- fications may apply to timber contracts issued within the reserves to take account of any local requirements and restrict- tions (2.4..4.6 on MoP).
[ nothing written here] There was no main harvest of Teak plantation, therefore, no special timber operation speci- fication was exchanged to loggers may be.
---------------------------------- ----------------------------------
Any additional beneficiary rights the local people may have been granted at the time of reserve- ation (2.4..5.1 on MoP).
List of the admitted Farms as name, area. 3 family on 6.4 ha.
---------------------------------- ---------------------------------- ----------------------------------
7.3 Cultural sites Culturally important areas identi- fied during the settlement proce- dure or in special cases areas identified since and archaeo- logical sites (table 2.3.2 on MoP).
[ nothing written] The plan shall mention that no such areas requested and identifies in past management.
---------------------------------- ----------------------------------

98
Items requested by MoP Description on Draft FMP Gap recognized Difficulties recognized Solutions (brief recommend) Section 8: Infrastructure and Administration 8.1 Access roads, tracks, pillars, forest stations, FG posts, forest nurseries < No detail request on MoP> [Explained possible access road
to the reserve on 8.1 FMP] ---------------------------------- ---------------------------------- ----------------------------------
The missing boundary pillars are Bp 15, 18, 21, 43, 53, 56, 63, 69, 73, 75, 79, and 83. Bp 3 is defaced and Bp 13, 66 and 77 broken (8.2 on FMP).
---------------------------------- ---------------------------------- ----------------------------------
There are no range quarters as residency at the range headqua- rters at Adantia (8.3 on FMP).
---------------------------------- ---------------------------------- ----------------------------------
There are no Forest Guard Quarters for the Forest Guards in-charge of the reserve beats. (8.4 on FMP)
---------------------------------- ---------------------------------- ----------------------------------
The FSD has not got a nursery in or near the reserve.(8.5 on FMP).
---------------------------------- ---------------------------------- ----------------------------------
8.2 FD responsible office and staffing < No detail request on MoP> The Sunyani Forest Services
Division is responsible for the protection and management. The District Manager, the Area Plantation Manager and the following staff, worked directly in the reserve (8.6 on FMP): Rank Number
Range Supervisor -1 Plantation Supervisor - 1 Plantation Assistants - 2
---------------------------------- ---------------------------------- ----------------------------------
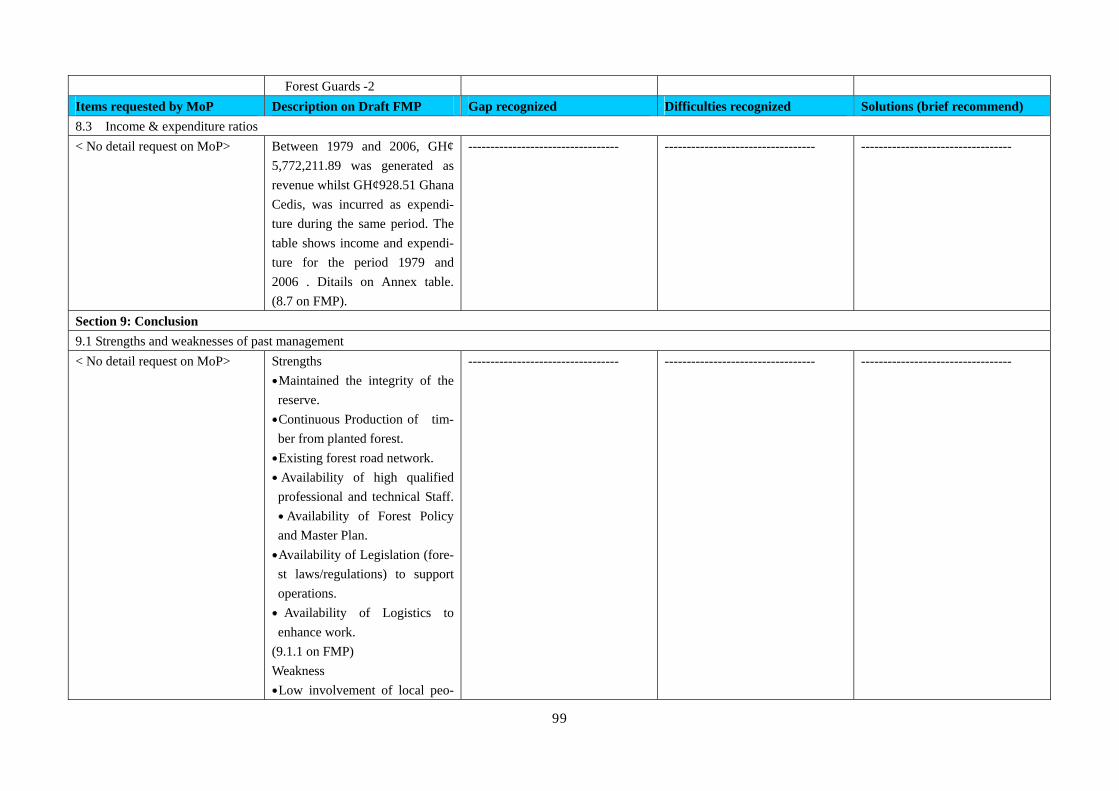
99
Forest Guards -2 Items requested by MoP Description on Draft FMP Gap recognized Difficulties recognized Solutions (brief recommend) 8.3 Income & expenditure ratios < No detail request on MoP> Between 1979 and 2006, GH¢
5,772,211.89 was generated as revenue whilst GH¢928.51 Ghana Cedis, was incurred as expendi- ture during the same period. The table shows income and expendi- ture for the period 1979 and 2006 . Ditails on Annex table. (8.7 on FMP).
---------------------------------- ---------------------------------- ----------------------------------
Section 9: Conclusion 9.1 Strengths and weaknesses of past management < No detail request on MoP> Strengths
•Maintained the integrity of the reserve. •Continuous Production of tim- ber from planted forest. •Existing forest road network. •Availability of high qualified professional and technical Staff. •Availability of Forest Policy and Master Plan. •Availability of Legislation (fore- st laws/regulations) to support operations. • Availability of Logistics to enhance work.
(9.1.1 on FMP) Weakness •Low involvement of local peo-
---------------------------------- ---------------------------------- ----------------------------------

100
ples’ participation. Items requested by MoP Description on Draft FMP Gap recognized Difficulties recognized Solutions (brief recommend) •Inadequate enforcement of for-
est laws and regulations. • Inadequate education in com- munities on forest protection. •Participating communities have no share in the final crop. • Inability to revise the mana- gement plans periodically. • Inadequate resources for effe- ctive management of the forest resources. •Inadequate staffing. •Inadequate logistics. • Inadequate funding of oper- ations and the untimely release of funds from Central Government. (9.1.2 on FMP)
---------------------------------- ---------------------------------- ----------------------------------
9.2 Opportunities and threats to future management < No detail request on MoP> Opportunities
•Willingness of communities’ to participate in forest management.• Existing forest related local community based organizations to assist in forest management activities. •Donor and Non-Governmental Organization (NGO) Support. • High demand for plantation products. •Increased awareness of comm.-
---------------------------------- ---------------------------------- ----------------------------------

101
unities on forestry issues. Items requested by MoP Description on Draft FMP Gap recognized Difficulties recognized Solutions (brief recommend) •Willingness of Traditional Cou-
ncils and District Assembly to collaborate in forest management.•Collaboration with other agen- cies in the management of forest resources. •Governmental support. (9.2.1 onFMP)
---------------------------------- ---------------------------------- ----------------------------------
Threats •Annual Fire. •Illegal logging. •Illegal farming. •Illegal hunting. •Inadequate support of judiciary and law enforcement agencies. • Non adherence to terms of MOU on benefit sharing. (9.2.2 on FMP)
---------------------------------- ---------------------------------- ----------------------------------
Part 2: Proposals for Future Management Section 1: Goal of Forest Reserve Management < No definition about the word ”Goal” on MoP. >
To conserve and sustainably develop the resources for the maintenance of environmental quality and supply of forest produce to improve the living standard of the people. 1.0 on (FMP) [ FMP expressed general objects of forest reserve, and listed 8 brake downed objectives in
It is not sure that MoP requested to write this part. The written objectives on FMP will be realized during the planning term (10 years after). Nevertheless, FMP did not draw measurable criteria for identifying the quan- tity of the realized objectives.
Generally, The Goal shall define as the long time focusing target as ideal forest situation (at least 1period of rotation of main forest products harvesting, 30-40 year in teak plantation) how many ha of Teak plantation will be established, how distribute age class of Teak forest, how size of yielding of teak log, how match
Recommendation -8 Examining calculation and projection for assuring sustainable yielding is expected. The projection also shows that the area managed relay to follow the plan set principle, after one lotion period (30-40 yeas after) area covered forest like as projected (age class distribution)

102
general principles.] revenue will be expected. Items requested by MoP Description on Draft FMP Gap recognized Difficulties recognized Solutions (brief recommend) Section 2: Beneficiaries of Forest Reserve Management 2.1 The national interest < No detail request on MoP> The Tain Forest Reserve shall be
managed to conserve and sustain- ably develop the forest resources for the maintenance of environm- ental quality and also to provide income and a source of employ- ment for the government agencies and the forest fringe communities to improve their standard of living.
It is not cler that MoP request to describe on this item. The expected output for nation probably, if the reserve set because of some environmental perpos, the national interest may protect the environment, therefore, If Tain 1 is made water resource protection, if wood supply the description may be fit.
Wood supply capacity is expected national interest. If the plan can make feature of the Teak plantation ideally distributed, the reserve can supply log XX m^3 shall be project by the sustainability projection mention- ed above.
Recommendation-8 as above.
2.2 The resource owners < No detail request on MoP> The Resource Owners will
receive portion of revenue accruing from the harvesting and sale of timber, poles, fuel wood and Non-Timber Forest Produce from the Forest Reserve in accordance with the 1992 constitution. In addition, the fringe communities will have access to poles, fuel wood and Non-Timber Forest Produce for domestic use.
-- same as above --- ---------------------------------- ----------------------------------
Section 3: General Objective and Zonation of the Forest Reserve The Reserve will be divided into
five (5) major zones namely Plantation, Multipurpose Green- belt, Rivers and Streams, Conv-
---------------------------------- ---------------------------------- ----------------------------------

103
alescence and Conversion Areas. Items requested by MoP Description on Draft FMP Gap recognized Difficulties recognized Solutions (brief recommend) 3.1 Protection objectives and zones The entire forest reserve will be
protected against encroachment and their boundaries properly maintained.
Zonation Map shall be attached as annex.
---------------------------------- ----------------------------------
3.2 Production objectives and zones Plantation Production Areas
This zone constitutes the existing plantation established in the 1970s and 1980s, which covers an area of 560 ha. It are com- partments 1, 2, 3, 4, 5, 6, 10, 15 and 21. The objective of the zone is to produce teak timber, poles and fuel wood.
---------------------------------- ---------------------------------- ----------------------------------
Multipurpose Greenbelt It will be established along the periphery Tain I using Senna siamea and fruit trees. Pineapples will be intercropped with the fruit trees. The purposes area. i To serve as source of income from sale of fruits harvests to the participating communities. ii. To enable the fringe comm.- unities utilize the forest reserve daily to promote and improve their livelihood and to protect the reserve against bush fires, illegal logging and encroachment.
Following explanation may suitable to add the FMP. Area is 40m X 31 km. Who are the management actors for this GB. Descriptions add is for example: [The area for green belt will allow plant fruit tree and harvest fruits for Community based working Group of fringe communities. Agreement / Mou will be exchanged between FSD and CBWG. The Mou will be authorized/endorsed by RFO and traditional authorities.]
---------------------------------- ----------------------------------
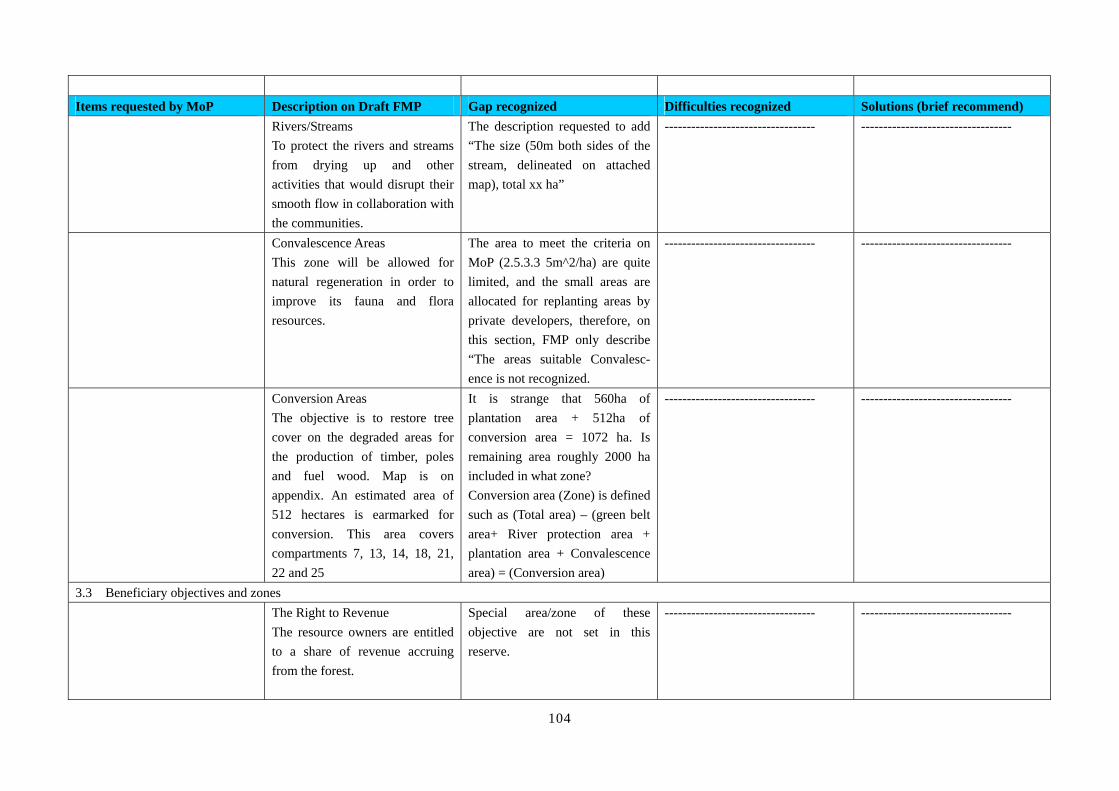
104
Items requested by MoP Description on Draft FMP Gap recognized Difficulties recognized Solutions (brief recommend) Rivers/Streams
To protect the rivers and streams from drying up and other activities that would disrupt their smooth flow in collaboration with the communities.
The description requested to add “The size (50m both sides of the stream, delineated on attached map), total xx ha”
---------------------------------- ----------------------------------
Convalescence Areas This zone will be allowed for natural regeneration in order to improve its fauna and flora resources.
The area to meet the criteria on MoP (2.5.3.3 5m^2/ha) are quite limited, and the small areas are allocated for replanting areas by private developers, therefore, on this section, FMP only describe “The areas suitable Convalesc- ence is not recognized.
---------------------------------- ----------------------------------
Conversion Areas The objective is to restore tree cover on the degraded areas for the production of timber, poles and fuel wood. Map is on appendix. An estimated area of 512 hectares is earmarked for conversion. This area covers compartments 7, 13, 14, 18, 21, 22 and 25
It is strange that 560ha of plantation area + 512ha of conversion area = 1072 ha. Is remaining area roughly 2000 ha included in what zone? Conversion area (Zone) is defined such as (Total area) – (green belt area+ River protection area + plantation area + Convalescence area) = (Conversion area)
---------------------------------- ----------------------------------
3.3 Beneficiary objectives and zones The Right to Revenue
The resource owners are entitled to a share of revenue accruing from the forest.
Special area/zone of these objective are not set in this reserve.
---------------------------------- ----------------------------------

105
Items requested by MoP Description on Draft FMP Gap recognized Difficulties recognized Solutions (brief recommend) The Rights to Forest Produce for
Domestic Use The fringe communities will have access to non-timber forest produce for domestic use. However, the collection of such benefits will be based on agreed guidelines.
-- Do above --- ---------------------------------- ----------------------------------
Period of Management Plan The Management Plan will be for a period of ten (10) years commencing
This item connects NTFPs area. The plan period may suitable to describe other item such as preface of the plan.
---------------------------------- ----------------------------------
Section 4: Management for Protection < On this section MoP may not requested about boundary protection.>
4.1General Protection 4.1.1 Measurable Objectives The external boundary with a perimeter of 31.35 km will be maintained annually to ensure the integrity of the forest. 4.1.2 Management Prescriptions i. The external boundary of length 31.35 km will be cleaned at least twice per annum in accordance with schedule as shown in Appendix. ii. The external boundary will be inspected at least twice per annum. A staff not below the rank of Range Supervisor will be responsible for the inspection.
---------------------------------- ---------------------------------- ----------------------------------

106
Items requested by MoP Description on Draft FMP Gap recognized Difficulties recognized Solutions (brief recommend) iii. A total of xxx broken and xxx.
missing pillars will be replaced during the plan period. In addition the …. defaced pillars will also be repaired during the period. iv. The external boundaries will be patrolled every month.
---------------------------------- ---------------------------------- ----------------------------------
4.1 Hill Sanctuaries [no place in Tain 1 planed] ---------------------------------- ---------------------------------- ---------------------------------- 4.2 Swamp Sanctuaries [no place in Tain 1 planed] ---------------------------------- ---------------------------------- ---------------------------------- 4.3 Provenance protection areas [no place in Tain 1 planed] 4.4 Special biological protection areas [no place in Tain 1 planed] 4.5 Cultural Areas [no place in Tain 1 planed] ---------------------------------- ---------------------------------- ---------------------------------- 4.6 Research Areas [no place in Tain 1 planed] ---------------------------------- ---------------------------------- ---------------------------------- 4.7 Fauna Protection Areas [no place in Tain 1 planed] ---------------------------------- ---------------------------------- ---------------------------------- 4.8 Fire Buffer Zone [no place in Tain 1 planed] ---------------------------------- ---------------------------------- ---------------------------------- 4.9 Fire Shelterbelts [no place in Tain 1 planed] ---------------------------------- ---------------------------------- ---------------------------------- Xx River/stream side area < No category mentioned river and stream protection area om Mou>
4.2 Rivers and Stream
---------------------------------- ---------------------------------- ----------------------------------
Measurable objective All the rivers/streams identified
will be properly maintained to prevent their drying up.
---------------------------------- ---------------------------------- ----------------------------------
Management regime Trees located within 25cm and
50cm at both banks of streams and rivers respectively will not be allowed to be felled.
---------------------------------- ---------------------------------- ----------------------------------

107
Items requested by MoP Description on Draft FMP Gap recognized Difficulties recognized Solutions (brief recommend) Rights and responsibilities < Stream protection area concern>
The Communities •The communities have the right to collect only the allowed NTFP.•The communities have a joint responsibility with the FSD for ensuring that the rivers and streams are properly protected and not dried up. The Forest Services Division •The Division has the right to ensure the enforcement of the Forest Laws and regulations. •The Division has the response- bility for ensuring that no felling is carried out in this zone. • It is the responsibility of the Division for monitoring and reporting on the quality of forest with respect to this zone.
---------------------------------- ---------------------------------- ----------------------------------
4.10 Convalescence (and Enrichment) Areas 4.10.1 Measurable objective (growing natural forest) To maintain and prevent felling of
timber and poles from these zones in order to improve the stocking for at least over the plan period of (10) years.
The FMP demarcated no Convalescence area, but management principles are described.
---------------------------------- ----------------------------------

108
Items requested by MoP Description on Draft FMP Gap recognized Difficulties recognized Solutions (brief recommend) 4.10.2 Management regime <Convalescence area concern> •No harvesting of timber and
poles would be allowed for at least ten (10) years. •Intensive fire protection would be ensured. •Collection of NTFPs would be strictly restricted.
-- D above --- ---------------------------------- ----------------------------------
4.10.3 Management prescriptions •Enrichment planting with indi-
genous species in cut lines at intervals of about 5 – 10m will be carried out. •Stakeholders will identify and assess the NTFPs in the area •Fire rides will be done at a width of 5 metres along the periphery of the zone. •The fire rides will be patrolled during the dry season. • Spot tending of the planted trees.
-- D above --- ---------------------------------- ----------------------------------
4.10.4 Rights and responsibilities The identified stakeholders’ rights
and responsibilities are detailed explained:
The Communities ( 6 items) The Forest Services Division (5 items)
Traditional Authorities (3 items)
-- D above --- ---------------------------------- ----------------------------------

109
Items requested by MoP Description on Draft FMP Gap recognized Difficulties recognized Solutions (brief recommend) Section 5 Management for Production 5.1 Timber Production Area (Mainly focusing Natural forest under selective cutting system High Forest) [No area of this] --------------------------------- --------------------------------- --------------------------------- 5.2 NTFP Production area [No area of this] --------------------------------- --------------------------------- --------------------------------- 5.3 Plantation Production Area (Planted and grown as recognized man made forest with significant dance crown cover, can measure volume) 5.3.1 Measurable objective a. To ensure the sustainable prod-
uction of commercial poles and timber. b.To provide revenue for stake- holders. c. To compile and develop data on sivilcultural prac- tices, e.g. thin- ning, pruning, ten- ding including growth measure- ments.
What means the word “measure- able”? For example, the plan shall set up some target to cultivate the teak trees for produce good timber (40%) and pole 40%. in average size at 35 years is 24cm in diameter, 20m height. The descriptions are too general.
Plantation management object is not clear, only mentioned timber and pole. In case Tain 1, high quality no not teak produce may difficult, because land produc- tivity is limited,
Advice-3 Therefore, in this item for example “second category wood production (xx m^3/ha) basically through Tayngya” may more substantial measurable objective.
5.3.2 Management regime Strategies to be used in deve-
loping the plantations include Modified Taungya System, Priv- ate Developers and Government Plantation (HIPC). Detail are provided in Appendix Stakeholder involvement will be promoted in the development and management of the plantations.
This FMP description shall be written on management regime of Conversion area below. On the remaining Teak plantation New Taunya contract was not operated.
On this item, the existed plantation Teak shall be treated for size and quality improvement by intensive care or not request bigger size of timber, then thinning plan, pruning plan may set to meet the planted area management objectives
---------------------------------
5.3.3 Management prescriptions <Plantation Production Area concern>
At an initial planting density of 1,111 trees/ha at 3m x3m spacing, the following prescriptions are hereby made;
Original planting standards shall written on Conversion area section.
--------------------------------- ---------------------------------

110
Items requested by MoP Description on Draft FMP Gap recognized Difficulties recognized Solutions (brief recommend) Thinning schedule table on Teak
and on Cedrela are shown (5.1.4 and 5.1.5 on FMP)
--------------------------------- --------------------------------- ---------------------------------
Management of stumps after Thinning There shall be regular cutting down of the coppices to prevent the stumps from sprouting up. There shall be a minimum of two cuttings in a year.
--------------------------------- --------------------------------- ---------------------------------
5.3.4 Indicative levels of production <Plantation Production Area concern>
[ No description made of this item]
Quantity of producing Teak log by thinning may expected to write in this section.
How to calculate the possible harvest by thinning, the manual shall shows the circulating procedures.
Recommendation 15 Volume estimation on thinning, Needs making a Yielding Table have to be recognized.
5.3.5 Rights and responsibilities Rights and Responsibilities
FSD has the rights and respon- sibilities to carry out thinning operations.
--------------------------------- --------------------------------- ---------------------------------
5.4 Conversion / Plantation Development Area 5.4.1 Measurable objective To restock 512 ha of degraded
portions or areas through the establishment of commercial plantations for production of timber and poles. (MTS 150HA, HIPIC 100HA, PRIVATE DEVELOPERS 262HA)
Location map is not made, because the planted areas are not surveyed on the field (Location). The grass land remaining more than xxx ha from satellite view. The evaluation of planted areas from 2004 to 2007, with land survey by GPS is needed to
There are no custam, and was no measuer, instruments, no trained man powers to conduct plantation area land survey and as well as for mapping.
Recommendation 9 Same as recommendation -5 as
above

111
diminish the Gap. Items requested by MoP Description on Draft FMP Gap recognized Difficulties recognized Solutions (brief recommend) 5.4.2 Management regime < Conversion / Plantation Development Area>
Strategies to be used in develop- ping the plantations include Mo- dified Taungya System (MTS), Private Developers and Govern- ment Plantation (HIPC). The Benefit Sharing Agreement is also provided in Appendix 8.
--------------------------------- --------------------------------- ---------------------------------
5.4.3 Management prescriptions Nurseries
The seed sources will be supplied from FSD. Seedling production will be contracted to participating Taungya Groups, communities and seedling contractors. The seedling supplied will be based on the annual planting targets. 20% of both Cedrela and indi- genous will be used for mixed- planting design A table shows seedling require- ement for a 5 year period
--------------------------------- --------------------------------- ---------------------------------
<Conversion / Plantation Development Area concerned>
Site Selection and DemarcationSite selection will be done between December and February. GPS will be used to locate the coordinates of the area for mapping. Each demarcated coupe of 16 ha will be pillared with Fabricated concrete of (12 x 12 x
This description is shall given special attention. Planting plan by annual budget shall surveyed and mapped. GPS is applicable way. And to combine GPS map, input the location to GIS map, the evaluation of planted area (bad survival, fire damage, etc.) bec-
Technical standard on Land survey by GPS is expected. The FC shall facilitate to mobilize GSPs to every District Forest Office.
Recommendation - 10 Manual for GPS record making and mapping is requested for range supervisors and plantation supervisors.

112
40) cm. ame tremendously accurate. Items requested by MoP Description on Draft FMP Gap recognized Difficulties recognized Solutions (brief recommend) Continue above Demarcation of sites for Private
Developers will also be carried out by the FSD with the same procedure at a cost.
--------------------------------- --------------------------------- ---------------------------------
Site Preparation The demarcated sites shall be cleared of vegetation/weeds with controlled burning by close of April. During the site preparation, niches and isolated indigenous trees would be maintained and retained respectively to enhance biodiversity in the plantation development.
--------------------------------- --------------------------------- ---------------------------------
Pegging Pegging shall be done between March and May. The spacing of 3m X 3m shall be used for all exotic species. For the indigenous, the spacing shall be 9m X 9m. Where the indigenous is being intercropped with exotics, the spacing shall be 3m X 3m for the exotics.
--------------------------------- --------------------------------- ---------------------------------
<Conversion / Plantation Development Area concerned>
Planting The annual planting target shall be a minimum of 30 hectares. Planting of tree seedlings shall be
--------------------------------- --------------------------------- ---------------------------------

113
done between April and August. Items requested by MoP Description on Draft FMP Gap recognized Difficulties recognized Solutions (brief recommend) <Conversion / Plantation Development Area concerned>
Tending Tending operations involve freeing the tree crop from weeds, singling and side pruning. These operations will be carried out as detailed in the Operational Plan.
--------------------------------- --------------------------------- ---------------------------------
Survival Survey Survival survey will be carried out after the completion of the annual planting by August.
--------------------------------- --------------------------------- ---------------------------------
Beating up Based on the survival survey, beating up will be carried out with potted seedlings when the planting success is less than 80% of the established area.
Is it about surplus planting? --------------------------------- ---------------------------------
< Management prescriptions > Modified Taungya System (MTS < no special attention about Taunya on MoP>
A total of 825 ha have been established in the various comp- artments with fringe communities between 2002 and 2007. A tabe shows annual planted areas by modified Taungnya.
Location and standard form of agreement is indispensable for managing allocation benefit to the originally planted person.
The Modified Taungya had implemented but the name of the person, location are not mapped, it may the big cause of conflicts between FSD and Taungnya farmer and his/her inheritances.
Recommendation -11 Taungya agreement and related records form standardization are requested. The records keeping lure including officially the official document kept by lawyer is advisable
<Conversion / Plantation Development Area concerned>
Tending standards are described. (5.4.1 on FMP)
-------------------------------- -------------------------------- --------------------------------
Thinning standards are described (5.4.2 on FMP)
-------------------------------- -------------------------------- --------------------------------

114
Items requested by MoP Description on Draft FMP Gap recognized Difficulties recognized Solutions (brief recommend) <Conversion / Plantation Development Area concerned>
Pruning Techniques It is an expensive operation that should be seen as an investment to improve the quality of the final product. (Technical guides are written 5 matters)
The plan may necessary to mention the special area on map if high quality timber production without knot Pruning operation area on the management map.
In Tain 1 the suitable place for high quality Teack (Land condition is not rich for high quality timber production, therefore, pruning is not recommendable to introduce.
--------------------------------
Harvesting Techniques Harvesting shall be organized through the competitive bidding process. During harvesting, the MOP “C” on plantation harvesting standards and procedures should be adhered to.
This description may suitable on the part on Plantation area
-------------------------------- --------------------------------
5.4.4 Indicative levels of production <Conversion / Plantation Deve- lopment Area concerned>
The projected Mean Annual Increment per cubic meter per hectare (MAI/m3/hectare) for the rotation period (25 years) is expected to be between 9 and 12 depending on the site and the management treatment. Some experimental plot data table shown on 5.5 of FMP.
The plan has thinning plan of old planted teak and new planting (first and second). The expect income from thinning shall be mentioned and describe the principles who are the revenues receiver (on newly planning part by modified Taungya). This part may be expected to explain substantial quantity for local beneficially as described principle on 2.6 of FMP.
Plantation plan by MTS, Private Company, and HIPC (areas, quantity (ha) shall be mentioned on the Proposal section.
Recommendation-12 How to fix the parcels for ( 10 years ) plantation plan Is the allocation of the planting plan area into MTS or HIPC or Private company decides in the operational plan? In the participatory regnum, at least the areas MTS shall be open to the community Strategic plan part 2 basis
5.4.5 Rights and responsibilities [No description made on
conversion area concern] Shall be mentioned the private developer’s right and response-
Priority shall given to fringe community people in the case of
--------------------------------
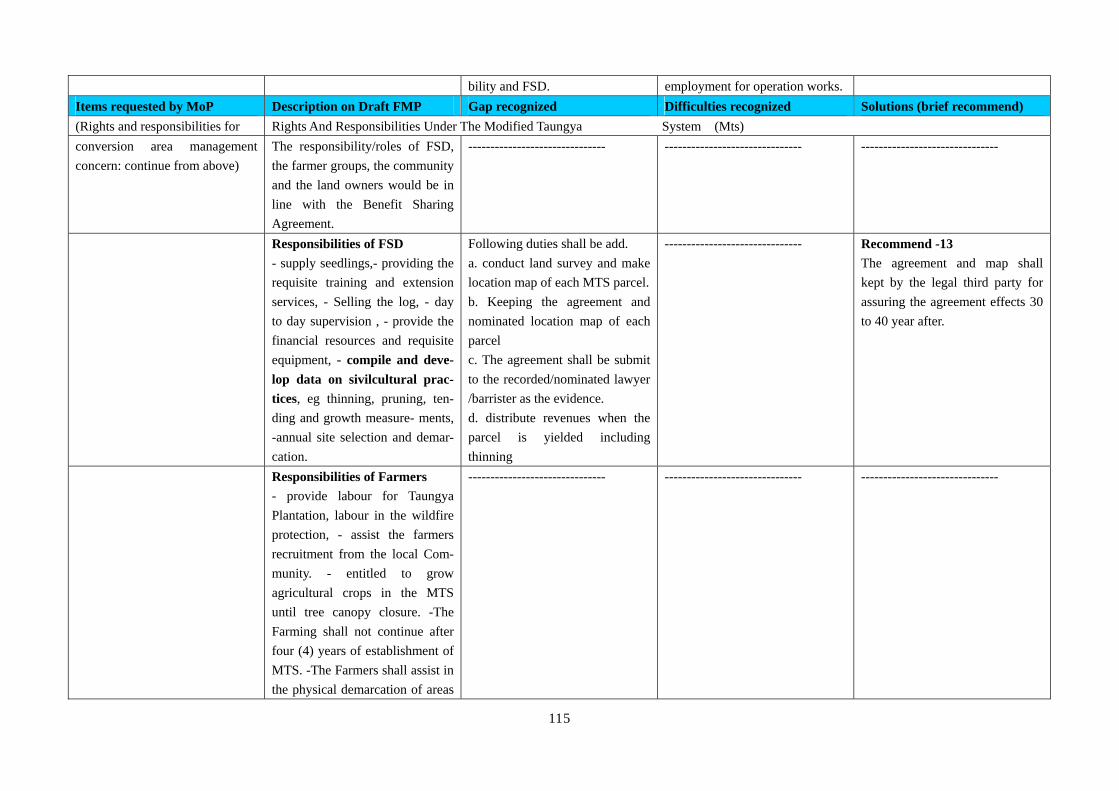
115
bility and FSD. employment for operation works.Items requested by MoP Description on Draft FMP Gap recognized Difficulties recognized Solutions (brief recommend) (Rights and responsibilities for Rights And Responsibilities Under The Modified Taungya System (Mts) conversion area management concern: continue from above)
The responsibility/roles of FSD, the farmer groups, the community and the land owners would be in line with the Benefit Sharing Agreement.
------------------------------- ------------------------------- -------------------------------
Responsibilities of FSD - supply seedlings,- providing the requisite training and extension services, - Selling the log, - day to day supervision , - provide the financial resources and requisite equipment, - compile and deve- lop data on sivilcultural prac- tices, eg thinning, pruning, ten- ding and growth measure- ments, -annual site selection and demar- cation.
Following duties shall be add. a. conduct land survey and make location map of each MTS parcel. b. Keeping the agreement and nominated location map of each parcel c. The agreement shall be submit to the recorded/nominated lawyer /barrister as the evidence. d. distribute revenues when the parcel is yielded including thinning
------------------------------- Recommend -13 The agreement and map shall kept by the legal third party for assuring the agreement effects 30 to 40 year after.
Responsibilities of Farmers - provide labour for Taungya Plantation, labour in the wildfire protection, - assist the farmers recruitment from the local Com- munity. - entitled to grow agricultural crops in the MTS until tree canopy closure. -The Farming shall not continue after four (4) years of establishment of MTS. -The Farmers shall assist in the physical demarcation of areas
------------------------------- ------------------------------- -------------------------------
116
to be developed. Items requested by MoP Description on Draft FMP Gap recognized Difficulties recognized Solutions (brief recommend) (Rights and responsibilities of conversion area management concern: continue from above)
Responsibilities of the Landow- ners - provide land within the degrade- ed forest reserve for MTS. - guarantee uninterrupted access to the allocated land for FSD and other parties. - ensure that the MTSo is well implemented - support the promotion of wildfire prevention in the plantation areas. - assist in the prevention of the MTS areas.
------------------------------- ------------------------------- -------------------------------
Responsibilities of Local Com- munities - shall assist in the prevention and control of wildfires in the planta- tion areas. - shall assist FSD to prevent illegal activities within the MTS Areas.
------------------------------- ------------------------------- -------------------------------
Government Plantation Deve- lopment Programme (HIPC) The achievement made since the commencement of the HIPC from 2004 is 500ha. Yearly planted areas shows on a table.
Part 1.6.2 (Past management) is suitable section to write this matter.
------------------------------- -------------------------------
Private Developers 800 ha had planted from 2002 to
‘ -- do above -- ------------------------------- -------------------------------

117
2005. by company are is shown. Items requested by MoP Description on Draft FMP Gap recognized Difficulties recognized Solutions (brief recommend) Section 6: Management for Local People 6.1 Revenue from forest reserve management 6.1.1 Measurable objective The objective is to ensure equit-
able distribution of revenue to the local people.
------------------------------- ------------------------------- -------------------------------
6.1.2 Management regime The Forest Services Division will
collect all revenue on behalf of the Landowners and will promptly disburse it to the Administrator of Stool Lands. The Administrator of Stool Lands will then disburse to the District Assembly, Paramountcy, and Stool in accordance with the 1992 Constitution.
------------------------------- ------------------------------- -------------------------------
6.1.3 Management prescription i.FSD collect all revenue and
promptly disburse the revenue. ii.The all trans- actions will be rendered on a quarterly basis. A financial report will be prepared as part of the quarterly report for the information of all stake- holders. iii.The FC/FSD shall ensure that disbursement reports are provided every six months for all
------------------------------- ------------------------------- -------------------------------
118
stakeholders. Items requested by MoP Description on Draft FMP Gap recognized Difficulties recognized Solutions (brief recommend) 6.1.4 Indicative levels of revenue Continue from above on Revenue from forest reserve management)
A Table shows the size of projected revenue on 8-10 years after. 1475 ha HIPC and MTS will produce thinning logs
Thinning logs revenue shall be add the projection.
Thinning log’s price (stampage) projection is not easy and big fluctuation because of the different quality of thinned logs.
------------------------------
6.1.5 Rights and responsibilities The Forest Services Division
i. ensuring all revenue collected. ii. ensuring that records of paym- ents of all forest produce are mai- ntained and made available for public scrutiny. iii. present quarterly financial statement as part of the disburse- ment report. iv. The Division has the right to retain an agreed fee for their services.
------------------------------ ------------------------------ ------------------------------
The Communities i. The landowners have the right to request details of all transaction carried out on their behalf. ii. They have the right to ensure that the Division collects and disburses revenue promptly.
------------------------------ ------------------------------ ------------------------------
119
Items requested by MoP Description on Draft FMP Gap recognized Difficulties recognized Solutions (brief recommend) 6.2 Access to forest products for domestic use 6.2.1 Measurable objective To ensure the continuous flow of
forest produce to the fringe communities who have domestic user right in order to fulfill some of their household requirements.
------------------------------ ------------------------------ ------------------------------
6.2.2 Management regime Local communities identified, as
having domestic user rights, will be allowed free access to the reserve to collect forest produce. This should be in accordance with the harvesting rules agreed between Forest Services Division and the communities.
On 2.3 FMP write “Granted for hunting, fishing, and collection of snail or dead wood by the local people on any Native Authority permit issued on the written advice of a Forestry Officer” Is it same meaning? (written advive and agreed rules).
------------------------------ ------------------------------
6.2.3 Management prescription i. Communal rights will be
respected and exercised through procedures established by consensus. ii. Harvesting of produce from the forest for domestic use should follow the harvesting rules to be agreed by both the Forest Services Division and the fringe communities. iii. Permit will have to be obtained from the Division before produce can be harvested on
------------------------------ ------------------------------ ------------------------------

120
commercial basis. Items requested by MoP Description on Draft FMP Gap recognized Difficulties recognized Solutions (brief recommend) 6.2.4 Indicative levels of production [ No description on this item] ------------------------------ ------------------------------ ------------------------------ 6.2.5 Rights and responsibilities
The Communities • adhering to the rules and regulations for harvesting in the reserve. •undertake awareness creation on the need to protect the forest resource from encroach- ment. • assist in the prevention and control of wildfires. •form Community Based Organi- zations who will collabor- ate with the Division to manage the forest resources. •prevent outsiders without dome- stic user right to harvest forest produce unlawfully. Forest Services Division i. ensure that surveys of the Non-timber Forest Produce (NTFPs) and negotiations requ- ired to develop domestic user rights are undertaken. ii. ensure the resources are har- vested sustainably. iii. It is the responsibility of FSD to ensure that people do not harvest forest produce illegally.
------------------------------ ------------------------------ ------------------------------

121
Items requested by MoP Description on Draft FMP Gap recognized Difficulties recognized Solutions (brief recommend) Section 7 Multipurpose Greenbelt Area (new item not listed on MoP Measurable Objective
To plant the periphery of Tain I Reserve with fruit trees (man- goes, citrus) and Sena siamea (cassia) to prevent wildfires and promote alternative income to fringe communities respectively. To intercrop the fruit trees with low lying crops example (pine- apples etc) to suppress weeds and also provide short term income to the farmers.
Total xxx ha 40m inside area from the boundary of the reserve. The area shall allocate to fringe community that formulate CBWG . The allocation will done mutual consultation with the FSD and community that agreed to participate and carry their duties listed below. The area shows on a map attached (Zonation map )
------------------------------ ------------------------------
Management Regime Healthy planting materials will be used to establish the multipurpose greenbelt. Mainly potted seed- lings will be used. The Sena siamea (cassia) will be planted as the last two/three rows of the green belt zone.
------------------------------ ------------------------------ ------------------------------
Management Prescriptions ( listup 8 items as annual size, design (40m width), FSD will conduct demarcation land survey, CBWG shall do land preparation, Pegging, plant trees (8X8 mango), planting season is basically May to June, tending is twice a year, fringe of the green
------------------------------ ------------------------------ ------------------------------
122
belt fire belt 4m shall set up etc.) Items requested by MoP Description on Draft FMP Gap recognized Difficulties recognized Solutions (brief recommend) Rights and Responsibilities
6 items for community 6 items for FSD are mentioned
------------------------------ ------------------------------ ------------------------------
SECTION 8: Income Generation Activities (Iga) (new item not listed on MoP) Measurable Objectives
To promote income generation activities for the communities in order to reduce their reliance on the forest reserve for their suste- nance.
------------------------------ ------------------------------ ------------------------------
Management Regime Facilitate capacity building of the participating community membe- rs in income generation activities.
------------------------------ ------------------------------ ------------------------------
Management Prescriptions •Income generation options will be identified within the pilot communities. • The participating community members will form groups based on their income generation options. • The participating community members would be given training based on income generation options. •There will be trainers of trainees among the participating comm.- unity members.
------------------------------ ------------------------------ ------------------------------

123
Items requested by MoP Description on Draft FMP Gap recognized Difficulties recognized Solutions (brief recommend) (Continue above Income Genera- tion Activities (Iga) management prescription)
•The identified groups would be assisted with basic material support where necessary to start up their income generation activities. • Agencies with the requisite expertise in the identified income generation activities will be co-opted in the implementation.
------------------------------ ------------------------------ ------------------------------
Rights and Responsibilities The Communities •Identifying their preferred acti- veeties. •Forming groups based on pref- erred income generating activities•Provision of sites for income generating activities. •Enacting bye laws to regulate community members works. The Forest Services Division • Selecting committed commu- nities. •Ensuring all rules and regulat- ions are adhered to. •Facilitate the provision of basic material and support to the participating groups. •Ensuring all material provided to the participating groups are utilized for the intended purposes.
------------------------------ ------------------------------ ------------------------------
124
Items requested by MoP Description on Draft FMP Gap recognized Difficulties recognized Solutions (brief recommend) PART 3: PROPOSALS FOR IMPLEMENTATION Section 1: Administration and Finance 1.1 Infrastructure development and maintenance 1.1.1 Types of Activity Buildings
Communication Transport
------------------------------ ------------------------------ ------------------------------
1.1.2 Operational Arrangements Building of Range Quarters at
Adantia Maintenance of forest roads Maintenance of existing motor bikes/vehicle
------------------------------ ------------------------------ ------------------------------
1.2 Reserve/FMU administration 1.2.1 Responsibilities The District Manager have the
responsibility for the operations. The Area Plantation Manager have responsible for the plant- ation activities. A Range Superv- isor and Plantation Supervisor shall supervise all prescribed ope- rations in the Tain I Forest Reserve. Three (3) Forest Guards shall have the respon- sibility of cleaning 31.35Km of the boundaries, These should be in collaboration with the fringe comm.- unities.
------------------------------ ------------------------------ ------------------------------
125
Items requested by MoP Description on Draft FMP Gap recognized Difficulties recognized Solutions (brief recommend) 1.2.2 Operational Planning Process operational planning => FSD.
five-year operational plan,=>DM three-year rolling plan=>DM annual programme =>DM. (in consultation with the Area Plantation Manager, Range Supe- rvisors and Plantation Superv- isors.) The community shall be involved part of the operational planning process..
------------------------------ ------------------------------ ------------------------------
1.2.3 Community Participation Existing Community Based Orga- nisations (CBOs) including Co- mmunity Forest Committees (CFC) and Taungya Groups, Mul- tipurpose Greenbelt Groups, Inc- ome Generating Activity (IGA) Groups and Fire Volunteers will represent the communities in all matters relating to protection and management of the forest reserve. The identified CBOs, Ministries, Departments and Agencies Below shall have these rights and responsibilities: Fire Volunteer Squads, Traditio- nal Authorities, District Assemb- lies, Ministry of Food and Agriculture (MOFA), Ghana
------------------------------ ------------------------------ ------------------------------

126
National Fire Service (GNFS) Items requested by MoP Description on Draft FMP Gap recognized Difficulties recognized Solutions (brief recommend) 1.3 Reserve finance 1.3.1 Objective To generate revenue from
production activities for the benefit of all the stakeholders.
------------------------------ ------------------------------ ------------------------------
1.3.2 Financial agreement 1992 Constitution should be
adopted and implemented. FSD would retain 50% from the sale of products while the other stake- holders will receive 50%. The 50% to the other stakeholder- rs shall be disbursed as follows: 10% to the administrator of Stool lands and the remaining percent- tage disbursed as follows: 25% to Stool or skin 20% to Traditional Council 55% to District Assemblies Ditails (sample of agreement on Taungya) shows appendix table MOU on Green belt also attached as appendix.
------------------------------ ------------------------------ ------------------------------
Section 2: Monitoring and Revision 2.1 Monitoring system 2.1.1 Objectives [accountability, transparency, assess progress]
To ensure that all operational activities and schedules are prop- erly documented.. Monitoring should be carried to enhance tran-
------------------------------ ------------------------------ ------------------------------
127
sparency and accountability. Items requested by MoP Description on Draft FMP Gap recognized Difficulties recognized Solutions (brief recommend) 2.1.2 Parameters/indicators Parameters and indicators are
listed on a table (2.1.4 of FMP) ------------------------------ ------------------------------ ------------------------------
2.1.3 Records and reporting All FSD standard records and
reports on all prescriptions will be well kept, upgraded and main- tained as specified. Compartment records, financial statements of the reserve, month- ly/quarterly/annual reports, Value Books and other schedules will be kept by the responsible off- icers. Copies of relevant records shall be made available to the communities.
------------------------------ ------------------------------ ------------------------------
2.2 Procedures for revision of the plan All activities will be monitored
closely during the plan period to facilitate review in the next plan. Any changes on yield regulations, and operation schedules for the next plan period must be submit- tted by the District and Regional Managers to RMSC twelve mon- ths before the expiry date of this plan. Minor amendments and changes will be carried out after consul- tation with RMSC during the plan
------------------------------ ------------------------------ ------------------------------
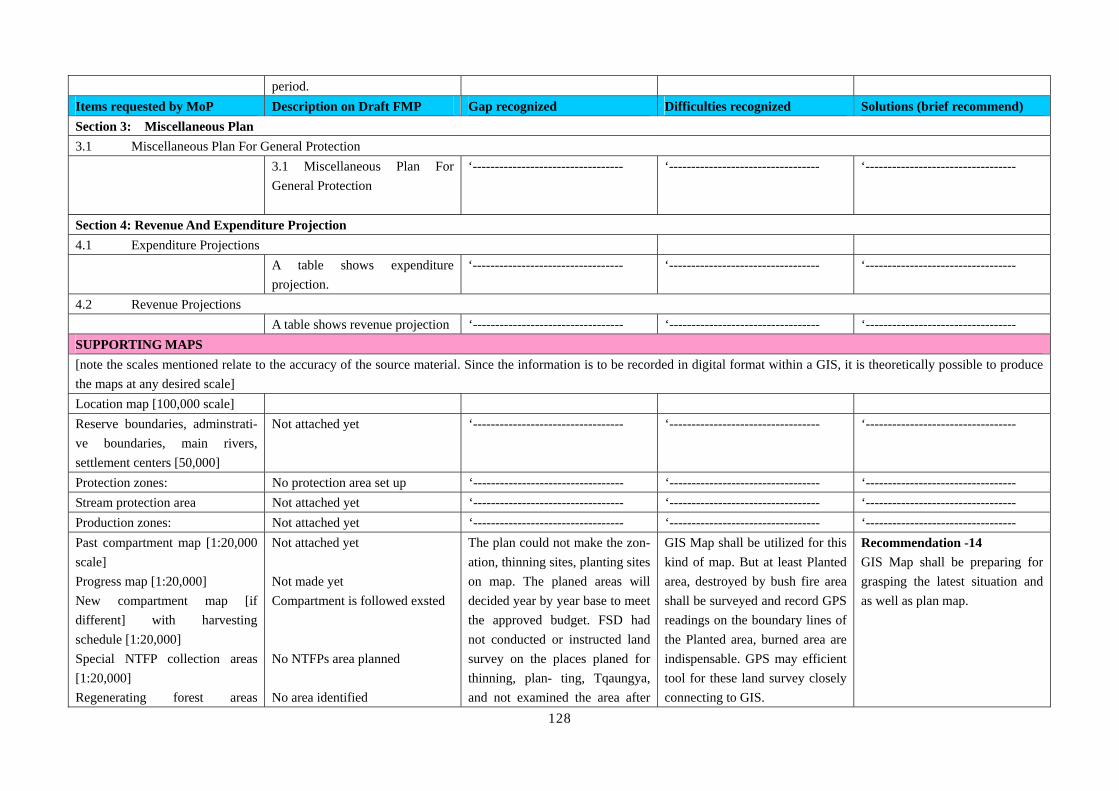
128
period. Items requested by MoP Description on Draft FMP Gap recognized Difficulties recognized Solutions (brief recommend) Section 3: Miscellaneous Plan 3.1 Miscellaneous Plan For General Protection 3.1 Miscellaneous Plan For
General Protection
‘---------------------------------- ‘---------------------------------- ‘----------------------------------
Section 4: Revenue And Expenditure Projection 4.1 Expenditure Projections A table shows expenditure
projection. ‘---------------------------------- ‘---------------------------------- ‘----------------------------------
4.2 Revenue Projections A table shows revenue projection ‘---------------------------------- ‘---------------------------------- ‘---------------------------------- SUPPORTING MAPS [note the scales mentioned relate to the accuracy of the source material. Since the information is to be recorded in digital format within a GIS, it is theoretically possible to produce the maps at any desired scale] Location map [100,000 scale] Reserve boundaries, adminstrati- ve boundaries, main rivers, settlement centers [50,000]
Not attached yet ‘---------------------------------- ‘---------------------------------- ‘----------------------------------
Protection zones: No protection area set up ‘---------------------------------- ‘---------------------------------- ‘---------------------------------- Stream protection area Not attached yet ‘---------------------------------- ‘---------------------------------- ‘---------------------------------- Production zones: Not attached yet ‘---------------------------------- ‘---------------------------------- ‘---------------------------------- Past compartment map [1:20,000 scale] Progress map [1:20,000] New compartment map [if different] with harvesting schedule [1:20,000] Special NTFP collection areas [1:20,000] Regenerating forest areas
Not attached yet Not made yet Compartment is followed exsted No NTFPs area planned No area identified
The plan could not make the zon- ation, thinning sites, planting sites on map. The planed areas will decided year by year base to meet the approved budget. FSD had not conducted or instructed land survey on the places planed for thinning, plan- ting, Tqaungya, and not examined the area after
GIS Map shall be utilized for this kind of map. But at least Planted area, destroyed by bush fire area shall be surveyed and record GPS readings on the boundary lines of the Planted area, burned area are indispensable. GPS may efficient tool for these land survey closely connecting to GIS.
Recommendation -14 GIS Map shall be preparing for grasping the latest situation and as well as plan map.

129
(Convalescence) [1:20,000] the operation had done. Items requested by MoP Description on Draft FMP Gap recognized Difficulties recognized Solutions (brief recommend) Conversion Areas/ Plantation development areas [1:10,000] Plantation Production Areas (compartment maps) [1:10,000]
Not yet complied Not yet Complied
It measns that planed area is just same as implemented area. This is the most basic difficulty to hold the latest forest situation, how many ha of planted areas are remaining now.
‘---------------------------------- ‘----------------------------------