Embed Size (px)
Citation preview

Participation in Context: Neighborhood Diversity andOrganizational Involvement in BostonVan C. Tran*Department of Sociology, Columbia University
Corina GraifDepartment of Sociology and Crime, Law and Justice, Pennsylvania State University
Alison D. JonesCommittee on Social Studies, Harvard University
Mario L. SmallDepartment of Sociology, University of Chicago
Christopher WinshipDepartment of Sociology, Harvard University
We use unique data from the Boston Non-Profit Organizations Study, an innovativesurvey containing rich information on organizational participation across seven so-cial domains in two Boston neighborhoods, to examine the relationship betweenethnic diversity and participation in local organizations. In particular, we identifyneighborhood-based social ties as a key mechanism mediating the initial negativeassociation between diversity and participation. In contrast to previous work, wemeasure participation using both the domain-based and group-based approach, withthe former approach uncovering a wider range of organizational connections thatare often missed in the latter approach. We also investigate the relationship betweeninterpersonal ties and organizational ties, documenting how primary involvementwith an organization facilitates the development of further interpersonal ties andsecondary forms of organizational involvement. We then discuss implications of ourfindings for urban poverty research.
INTRODUCTION
One important consequence of post-1965 immigration is the increase in ethnic and racialdiversity in local communities across the country (Iceland 2009). This recent demo-graphic shift has also prompted concerns about its impact on social cohesion and partic-ipation (Alesina and La Ferrara 2000; Costa and Kahn 2003; Putnam 2007; Sampson andGraif 2009). This article addresses one component of this debate by focusing on how eth-nic diversity shapes involvement with local organizations in two Boston neighborhoods,one homogenous and one diverse. In particular, we ask how neighborhood diversity im-pacts individuals’ ties to local organizations and focus on the role of neighborhood-based
∗Correspondence should be addressed to Van C. Tran, Columbia University, 606 Knox Hall, 606 W. 122nd St.,New York, NY 10027; [email protected].
City & Community 12:3 September 2013doi: 10.1111/cico.12028C© 2013 American Sociological Association, 1430 K Street NW, Washington, DC 20005
187

CITY & COMMUNITY
social ties as a mechanism meditating this relationship. Theoretically, we combine insightsfrom the emerging literature on diversity and social capital with urban poverty researchon the role of neighborhood institutions and local organizations. Empirically, we draw onunique survey data from residents of two Boston neighborhoods, Upham’s Corner andWest Roxbury, including measures of individuals’ organizational ties1 across multiple so-cial domains. Using this in-depth comparative study of two neighborhoods, we argue thatethnic diversity does not necessarily lead to lower levels of organizational involvement,but instead this negative relationship is accounted for by neighborhood-based social ties.Furthermore, we investigate the complex relationship between interpersonal and organi-zational ties, documenting that organizational involvement often facilitates other formsof local involvement and the formation of new interpersonal ties.
This article contributes to previous research in four ways. First, we adopt novel mea-sures of individuals’ ties to organizations, using both a group-based and a domain-basedapproach. The group-based approach solicits individuals’ involvement using a standardlist of groups (e.g., civic, ethnic), whereas the domain-based approach asks about their in-volvement with organizations in specific social domains (e.g., healthcare, education). Weshow that the domain-based approach uncovers a wider range of organizational connec-tions that might otherwise be missed in the standard group-based approach. Second, wedistinguish between primary and secondary forms of involvement, depending on whetherthe involvement is relevant to the organization’s main purpose. We also explore the bi-directional relationship between individuals’ interpersonal ties and their connections toorganizations. Third, we ask individuals about the formation of interpersonal ties as aresult of their involvement with local organizations. Following Small (2009), we suggestthat one unintended consequence of organizational involvement is an increase in inter-personal ties, which not only facilitates further involvements with other organizations,but also provides crucial support to urban residents. Fourth, our in-depth comparativestudy of two neighborhoods with differing ethnoracial compositions provides importantleverage on how ethnic diversity might operate at the local level.
For our study, we define individuals’ interpersonal ties based on self-reports on the localpresence of friends and family (Guest and Wierzbicki 1999) and individuals’ organiza-tional ties based on self-reports on the organizations to which respondents are connected(Small 2009). We report four findings. First, there is significant variation in the extentand nature of organizational involvement across social domains. Second, the domain-based approach uncovers much higher levels of involvement than the group-based ap-proach. Third, primary involvement with an organization often leads to both secondaryinvolvement and the formation of interpersonal ties. Finally, neighborhood-based socialties facilitate involvement, a relationship that is not stifled in diverse neighborhoods, eventhough social ties might be more fragmented there.
We argue that diverse neighborhoods may render local interpersonal ties all the moreimportant in promoting organizational involvement in the face of diversity. Diversecommunities such as Upham’s Corner also tend to be more transient with more rentersthan homeowners2 and neighborhood-based social ties in such neighborhoods tendto be more fragmented because residents of the neighborhood have had less time toget to know each other, compared to a homogenous neighborhood where social tiesmight have been cultivated over decades and sometimes across generations. However,in contrast to prior arguments that diversity weakens social capital, we introduce someimportant conceptual nuances. Because ethnic diversity is associated with other forms
188

PARTICIPATION IN CONTEXT
of heterogeneity (e.g., immigration, linguistic and cultural diversity, or socioeconomicdiversity), residents in more diverse neighborhoods might face additional barriersto local participation. In such a context, neighborhood-based social ties might beinstrumental in providing residents with information about local organizations and inencouraging them to participate. In contrast, ethnically homogenous neighborhoodstend to be more stable communities that are characterized by both stronger social andfamilial ties due to network homophily. Residents of homogenous neighborhoods notonly face fewer barriers in communication and engagement, but also have overlappingsocial interactions that serve to reinforce their social networks. For example, residentsnot only live in the same neighborhood, but also attend the same church in the localparish and serve on the same committee at the local school board. As a result, we expectthat neighborhood-based social ties in homogenous neighborhoods are less importantin providing residents with information about new and different local organizations,presumably because such information is already available through multiple venues,even though they remain crucial in facilitating involvement. Specifically, we investigatewhether social ties constitute a moderating factor or a core mechanism mediating therelationship between diversity and organizational participation.
This article proceeds in four parts. First, we discuss the emerging research on organiza-tional ecology within urban sociology, while also situating our project within the debateon diversity and social capital. We suggest that the current literature remains underthe-orized with regards to the social mechanisms that underlie or condition the relationshipbetween ethnic diversity and participation. Second, we describe the Boston Non-ProfitOrganizations (BNPO) Study, placing special emphasis on the methodological innova-tions in our study. We also discuss the two neighborhoods that are the focus of our studyand our rationale for their selection. Third, we present our analyses in three stages: (1)descriptive analyses of domain- and group-based ties, (2) descriptive analyses of primaryand secondary involvements, and (3) multivariate analyses on the impact of neighbor-hood diversity on organizational involvement. The article then concludes with a summaryof findings and implications for urban poverty.
THE DIVERSITY AND SOCIAL CAPITAL DEBATE
Classic works in sociology have argued that ethnic heterogeneity poses challenges tourban neighborhoods, including higher levels of alienation, disorder, and crime (Fis-cher 1975; Shaw and McKay 1942). The rise in post-1965 immigration has also renewedan older debate about the potential negative impact of ethnic diversity on social co-hesion. Specifically, ethnic diversity has been associated with declines in group partic-ipation (Alesina and La Ferrara 2000), civic engagement and volunteering (Costa andKahn 2003), social trust (Lancee and Dronkers 2011), and social cohesion (Laurence2011; Putnam 2007). Other studies have also linked immigration and ethnic diversity tohigher crime rates at the neighborhood and county levels (Martinez and Valenzuela 2007;McVeigh 2009). Since Putnam (2007), many studies have examined this relationship inthe United States and in Europe, but the impact of diversity is not always negative andcan vary widely based on the local context (Kesler and Bloemraad 2010). For example,ethnic diversity has also been found to have either a nonsignificant effect or a positiveeffect on community participation (Greif 2009), trust (Bakker and Dekker 2012), civic
189
CITY & COMMUNITY
engagement (Sampson et al. 2005), friendship contacts and local involvements (Letski2008), and crime (Graif and Sampson 2009).
This emerging body of work draws attention to two broad theoretical frames with com-peting predictions about the relationship between diversity and cohesion. On the onehand, the intergroup conflict theory argues that ethnic diversity engenders conflict andcompetition among groups that are often vying for limited resources at the local level(Blalock 1967). On the other hand, the intergroup contact theory predicts that meaning-ful interactions among individuals from different ethnic and racial backgrounds shouldreduce stereotypes and prejudices across groups, while bringing about collaboration andcooperation toward common goals (Allport 2009). These competing perspectives callattention to the difficulty in predicting the consequences of ethnic diversity in a chang-ing American society, characterized by increasing immigration, changing racial attitudes,changing salience of racialized frames, and changing local contexts (Hopkins 2011).
A related strand of research has also argued that neighborhood-based social ties build so-cial cohesion and facilitate organizational involvement. First, informal social interactionshave been a critical component in discussions of social cohesion and social capital (Cole-man 1990; Lin 2001; Putnam 2000). Second, higher levels of social cohesion and in-teractions promote the development of local friendships (Letski 2008). Third, local in-teractions and interpersonal ties can help ameliorate tensions and conflicts. In diverseneighborhoods, local ties might play an even more prominent role in maintaining socialcohesion and providing crucial social support. Finally, this emphasis echoes earlier callsfor more attention to the link between local social networks and groups’ participation incivic life (Briggs 2007).
Prior research has documented inconsistent findings on the relationship between di-versity and social capital due to three reasons. First, the concepts of social capital andsocial cohesion are admittedly broad, covering a range of related theoretical constructs(e.g., social ties, social trust, community participation, community cohesion). This lackof conceptual clarity results in a multitude of theoretical constructs being lumped to-gether under the umbrella of “social capital” or “social cohesion” (Daly and Silver 2008).Second, the empirical operationalization of these theoretical constructs reflects both theconceptual ambiguity and operational constraints in preexisting data sources. Disaggre-gating and clearly defining the outcome measure of interest will facilitate theoreticaldevelopment in the field. Another part of this problem is methodological. Although theGeneral Social Survey (GSS) and the Social Capital Community Benchmark Survey pro-vide good overviews of key trends on participation, these datasets provide few insights intohow ethnic diversity operates at the local level. Third, there is “insufficient theorizing” ofthe social mechanisms and processes that underlie or condition the relationship betweendiversity and cohesion (Daly and Silver 2008:537). Specifically, these studies have notexamined how neighborhood-based social ties might mediate the relationship betweendiversity and participation, especially if social ties remain functional in diverse neigh-borhoods. A diverse community renders these ties all the more important because oftheir potential to connect individuals from different backgrounds to different resources.These studies have not explored how the local context structures participation amongdifferent subpopulations. Communities with a longer history of diversity might be morecomfortable with diversity than neighborhoods with a recent influx of non-white groups.Similarly, immigrants and minority populations might be more comfortable with ethnicdiversity, given their own personal experiences with it.
190

PARTICIPATION IN CONTEXT
URBAN POVERTY RESEARCH ON ORGANIZATIONAL ECOLOGY
Within urban sociology, a robust literature has explored the role of neighborhood insti-tutions in providing social support to the urban poor (Allard and Small 1954). In fact,one component of Wilson’s (1987) theory of social dislocation argues that high-povertyneighborhoods often lack important institutional resources that facilitate social mobility.
Research on urban organizations to date has focused on specific types of organiza-tions such as childcare centers (Small 2009), community organizations (Marwell 2006),social services (Allard 2013; Watkins-Hayes 2009), churches (McRoberts 2006), and non-profit organizations (Galaskiewicz et al. 2006). This body of work shows that neighbor-hood institutions not only provide residents with important resources, but also directlyimpact the individual and communal well-being (McQuarrie and Marwell 2003; Small2006).
Although this literature has documented the persistence of race- and class-based spa-tial inequality in access to local organizations (Allard 2013), poor and diverse neighbor-hoods do not necessarily have fewer resources (Small and McDermott 2006). Small andStark (2005) show that childcare programs such as Head Start are actually more likely tobe located in poor neighborhoods, given their public mandate to provide low-cost andaffordable child care for low-income mothers. In a recent study, Murphy and Wallace(2010) also find that poor urban neighborhoods not only are less isolated, but can alsohave higher numbers of organizations than nonpoor neighborhoods, especially thosethat promote social mobility and provide social support.
With regards to social ties, urban poverty research has privileged individuals’ inter-personal ties over their organizational ties (Dominguez and Watkins 2003; Fischer 1982;Hipp and Perrin 2009; Wellman 1979). Despite the emphasis on the consequences of so-cial capital, there has been less attention on the process of social ties formation and howindividuals become connected to organizations (but see Small 2009). Individuals’ orga-nizational ties matter because they can provide access to important resources, in additionto imparting the intrinsic rewards of feeling connected. In his study of childcare centersin New York City, Small (2009) finds evidence that mothers benefit from access to both in-formal social networks and formal organizational resources through their connections tochildcare centers. Mothers with children at these centers also report having more friends,along with fewer material and mental hardships. In her case study of community-basedorganizations, Marwell (2006) illustrates how these organizations mediate the relation-ships between local residents and external economic, social, and political forces. Becauselocal institutions often serve as key sites for interactions among residents, they also facil-itate the formation and expansion of interpersonal ties. This is especially important indiverse, immigrant neighborhoods. Faced with linguistic and cultural barriers in access-ing services, this population might rely more heavily on local organizations for supportand information than in homogeneous neighborhoods.
THE BOSTON NON-PROFIT ORGANIZATIONS STUDY
This analysis draws on unique data from the BNPO Study, which explores the role ofnonprofit organizations in people’s lives.3 The project is a nested mixed methods study(Small 2011) with two main components: a random-digit-dialing telephone survey with
191

CITY & COMMUNITY
a stratified sample of 213 respondents in two neighborhoods in Boston and 30 in-depthsemistructured interviews with a subset of the same respondents. One innovation of ourstudy is methodological. We measure organizational involvement using both a group- anda domain-based approach. The group-based approach refers to the standard practice of theGSS and other major surveys in which individuals are asked about their involvements andformal group membership using a standard list of groups (e.g., civic, political, ethnic,racial, literary). This method is also referred to as “aided-recall” in that the standard listis meant to jog respondents’ memories on specific types of organizations, and hence,improve the overall recall rate. In contrast, the domain-based approach asks respondentsto think concretely about specific domains and problems in their lives (e.g., where theygo to receive healthcare, where they send their children to school). Specifically, we askedrespondents about their organizational involvements in seven social domains: healthcare,daycare, schools, recreation, churches, volunteering, and any “other groups.” The last twodomains on “volunteering” and “any other groups” are two residual categories designedto capture any remaining groups or organizations that the individual might be involvedwith, beyond those reported in the first five domains.4
The domain-based approach provides two advantages. First, it invokes both formal andinformal organizational connections. In so doing, it uncovers a wider range of organi-zational connectedness than the group-based approach. Second, it allows us to furtherprobe the nature of involvements by asking about both primary and secondary involve-ments. Primary involvements refer to connections to the organization that individualsmaintain that are directly related to the explicit goal of the organization, whereas sec-ondary involvements refer to any additional activities that individuals might also engagein as a result of their connection to the organization. For example, those with childrenwill have a connection to their children’s school that will count as a “school tie.” Amongthose without children, we also asked if the respondents might be connected to the localschools in some other ways, instead of assuming that they have no such ties. For thosereporting having a primary tie within the first five social domains, we asked about theirsecondary involvements with these organizations, whether they volunteered at the school,participated in activities, helped raise funds, and so on.5
The Center for Survey Research (CSR) at University of Massachusetts, Boston, fieldedthe survey. Prior to the survey, CSR conducted two focus groups, one in West Roxburyand one in Upham’s Corner, with a total of 15 participants. Eight cognitive interviewswere also conducted, four in each of the two neighborhoods. Results from the cognitivetesting and the focus groups informed the decisions about the final survey instrument. Toreach a larger pool of people than just those with listed numbers, we relied on a compre-hensive database from the Marketing Systems Group (MSG). The MSG database containshouseholds identified through numerous sources, including all telephone listings, voterregistration lists, driver’s license lists, tax lists, county and city database records, magazinesubscription lists, and other commercial or government lists. All are updated quarterly.Although this sampling frame does not give all households in a targeted area a chanceof selection into a sample, it has proven over time to be an excellent source for surveystudies. MSG, in partnership with CSR, then isolated all households from its listed sampledatabase that were known to be in the census tracts that define the neighborhoods. Thesample was randomly selected from this MSG list of phone numbers, 450 in West Roxburyand 676 in Upham’s Corner.
192

PARTICIPATION IN CONTEXT
Telephone interviewing took place from July to September of 2007. The interview re-sponse rate was 58 percent in West Roxbury and 61 percent in Upham’s Corner. Weightswere calculated based on the inverse probability of selection taking into account the prob-ability of selection for different strata (e.g., neighborhoods), the survey nonresponse rate,the number of residential phone lines, and the probability of selection within a house-hold. These weights were applied to all analyses of the survey data. Among the 213 re-spondents in the survey sample, 81.7 percent indicated that they would be willing to berecontacted. From this group, we selected 30 individuals to undergo in-depth, semistruc-tured interviews. In deciding whom we would interview for this second round, we ex-plicitly sampled individuals to obtain a diverse range of personal perspectives, includingthose who reported having the highest and lowest levels of organizational ties in our sur-vey. We also made a concerted effort to interview a group of individuals that are diverse interms of age, gender, race, immigration, and socioeconomic status. In Upham’s Corner,we interviewed eight white respondents, seven black respondents, and one Hispanic re-spondent. In West Roxbury, we interviewed 13 white respondents and 1 black respondent.The lack of ethnic diversity in West Roxbury meant that we ended up interviewing mostlywhite respondents there. The majority of the interviews were conducted in libraries, cof-fee shops, and respondents’ homes in Spring 2008. All interviews were digitally recordedwith permission from the respondents and transcribed. We then developed a list of codesbased on the interview schedules, focusing on the following broad themes: personal up-bringing, neighborhood experiences, interpersonal ties, organizational ties, extent andnature of organizational involvements, and access to resources through the organizationsthe respondents were connected to. The transcripts were then coded and analyzed withATLAS.ti. Given space constraints, we only report the survey results, but the insights fromour qualitative data helped guide our analysis.
THE NEIGHBORHOODS: UPHAM’S CORNER AND WESTROXBURY
Our decision to sample and study two neighborhoods, one diverse and one homogenous,was purposeful. Our research design explicitly avoids sampling the most disadvantagedneighborhoods in Boston. In selecting these neighborhoods, we relied on the neighbor-hood characteristics from the census and our extensive knowledge of Boston neighbor-hoods. These two neighborhoods are “extreme cases” in terms of ethnic diversity amongthe distribution of Boston neighborhoods, allowing us to make comparisons that mightbe difficult to observe in less disparate neighborhoods (Yin 2003). As one respondentin West Roxbury observed at end of an interview (without prompting), “If you asked mebefore what’s the exact opposite in the city of Boston of West Roxbury, I would probablysay Upham’s Corner.” In what follows, we rely on census data, our interviews with localrespondents, our observations and knowledge of Boston to describe both neighborhoodsand to provide some context for our analyses of the survey data.
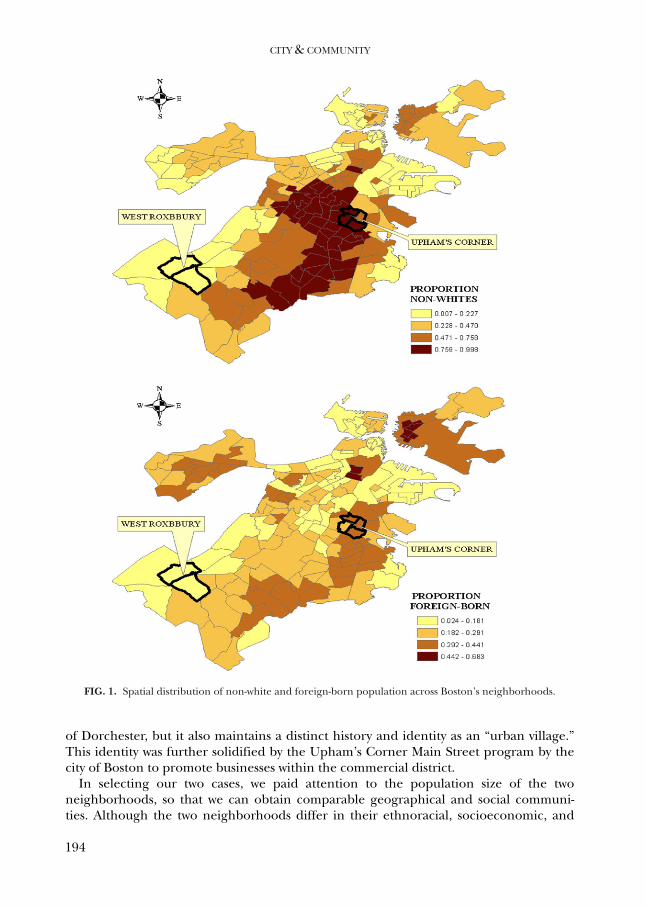
Figure 1 provides a snapshot of the two neighborhoods’ location and the relative distri-bution of non-white and foreign-born populations. West Roxbury is one of Boston’s pre-dominantly white neighborhoods, whereas Upham’s Corner has significant number ofminority residents. Upham’s Corner is a neighborhood within the larger neighborhood
193
CITY & COMMUNITY
FIG. 1. Spatial distribution of non-white and foreign-born population across Boston’s neighborhoods.
of Dorchester, but it also maintains a distinct history and identity as an “urban village.”This identity was further solidified by the Upham’s Corner Main Street program by thecity of Boston to promote businesses within the commercial district.
In selecting our two cases, we paid attention to the population size of the twoneighborhoods, so that we can obtain comparable geographical and social communi-ties. Although the two neighborhoods differ in their ethnoracial, socioeconomic, and
194

PARTICIPATION IN CONTEXT
TABLE 1. Selected Demographic Characteristics for Field Neighborhoods in Boston
Upham’s Cornera West Roxburyb City of Boston
Racial/Ethnic CompositionNon-Hispanic white (percent) 14.3 92.1 49.4Non-Hispanic black (percent) 37.7 1.1 23.6Non-Hispanic Asian (percent) 3.9 2.8 7.5Non-Hispanic other (percent) 21.0 2.7 5.0Hispanic or Latino (percent) 23.1 1.3 14.5
Female (percent) 53.0 54.3 51.9Foreign-born (percent) 34.5 14.9 25.8Education profilec
Less than high school (percent) 33.3 9.3 21.09High school (percent) 3.9 18.9 41.97Some college (percent) 21.8 21.9 19.37Bachelor’s degree or more (percent) 14.0 49.9 35.56
Income profileLess than $30,000 (percent) 46.9 16.5 34.39$30,000–$50,000 (percent) 22.5 16.7 20.65$50,000–$100,000 (percent) 23.5 38.3 30.39$100,000 or more (percent) 6.1 28.5 14.57Median household income 30,792 66,650 39,629Per capita income 14,671 31,973 23,353Below poverty (percent) 24.9 3.2 19.53
Household language profileSpeaking English at home (percent) 47.31 79.18 66.57Speaking Spanish at home (percent) 23.42 3.51 12.57Speaking another language at home (percent)d 29.27 17.31 20.86
Female-headed households with children (percent) 31.64 9.99 16.21Lived in the same house last five years (percent) 57.4 62.3 47.77Occupied units that are owner-occupied (percent) 29.46 73.31 32.24
Total population 13,102 9,029 589,141Total household 4,132 3,593 239,603
aCensus tracts 912, 913, 914, and 915 were used to approximate the boundaries of Upham’s Corner.bCensus tracts 1302 and 1303 were used to approximate the boundaries of West Roxbury.cIndividuals 25 years of age or over.d“Other language” indicates neither English nor Spanish.Source: U.S. Census 2000.
linguistic composition, the most salient difference that we observed is ethnoracial di-versity. Even though some respondents remarked on the socioeconomic differences be-tween the two neighborhoods in terms of availability of resources and amenities, it wasquite clear to us that ethnoracial diversity was the most salient dimension of difference.Table 1 provides information on key neighborhood characteristics, drawing on data fromthe 2000 Census. Compared to the city as a whole, Upham’s Corner is more diverse,transient, and renter-occupied, whereas West Roxbury is more homogenous, affluent,owner-occupied, and less transient. On racial composition, Upham’s Corner is 14.3 per-cent white, 37.7 percent black, 23.1 percent Latino, and 31 percent “Other.” One thirdof the population is foreign-born and a quarter report speaking Spanish at home. In con-trast, West Roxbury’s population is 92.1 percent white and 14.9 percent foreign-born. Onsocioeconomic characteristics, one third of the population in Upham’s Corner has lessthan a high school education, one quarter lives in poverty, and one half of the house-holds reported annual income of less than $30,000. In contrast, West Roxbury is home to
195

CITY & COMMUNITY
Boston’s middle-class, including many who work in the city’s public sector: civil servants,fire-fighters, and teachers; 49.9 percent had a bachelor’s degree, 28.5 percent reportedannual income of $100,000 or more, and 73.3 percent reported owning their home.
Between 2000 and 2010, there was no change in the ethnoracial composition of Up-ham’s Corner, whereas West Roxbury has become slightly more diverse. That said, WestRoxbury remains predominantly white, along with a small influx of Hispanics. For exam-ple, the size of the white population slightly declined from 92.1 percent to 84.9 percentwhereas Hispanics grew from 1.3 percent to 5.5 percent. This is in keeping with the over-all trend for the city of Boston where the white population registered a decline from49.4 percent to 47 percent during the same period, compared to an increase from 14.5percent to 17.5 percent among Hispanics.
On the ground, West Roxbury is a “family-oriented” community with mostly single-family homes, lots of green space and a convenient location by the regional rail. Givenits high rate of home ownership, our respondents perceive it to be a “close-knit” commu-nity, and some families have been there for several generations. Furthermore, the Irish-Catholic parishes create a dense network of educational, religious, and social institutionsthat connect neighborhood residents to each other (Gamm 1999). This strong sense ofcommunity emerged as quite important for those who live there. The West Roxbury MainStreets program, an initiative by the city of Boston to support local businesses, has furtherstrengthened the local businesses, which include many restaurants, boutique shops, andamenities along Main St., the neighborhood’s center thoroughfare.
In contrast, Upham’s Corner is home to many immigrant groups from both LatinAmerica and the West Indies. Walking down the streets, one can hear multiple foreignlanguages being spoken and see a dazzling array of immigrant businesses, from Jamaicanrestaurants and Portuguese barbershops to African churches and Mexican bodegas. Theneighborhood is notable for its socioeconomic diversity and has significantly gentrifiedover the last decade, as evidenced by the recent opening of the neighborhood CVS storeand the vibrant commercial strip at the heart of the neighborhood on Columbia Road.This recent wave of gentrification was spearheaded by the local LGBT population thatarrived in search of affordable housing from the South End, the city’s historically gayneighborhood that has increasingly become more upscale and affluent. Middle-class par-ents with young children along with some of the LGBT population and artistic crowdsaccount for the majority of the neighborhood’s white population, although Upham’sCorner remains heavily renter-based and is more transient. The local residents in ourstudy also noted that it is a rather friendly and convenient place to live, with many localamenities and retail shops, as well as easy access to public transportation.
MEASURING ORGANIZATIONAL INVOLVEMENT: DOMAIN- ANDGROUP-BASED TIES
The BNPO survey measures individuals’ organizational ties using both the group- anddomain-based approaches. First, we asked our respondents about their ties to organiza-tions using the standard list from the GSS, which includes the following 13 groups6:fraternal, veteran, environmental, political, hobby or garden, advocacy, nationality, lit-erary or art discussion, community centers, charity or welfare, civic or business or ser-vice, labor unions, and neighborhood organizations. Second, we ask respondents about
196

PARTICIPATION IN CONTEXT
TABLE 2. Group-Based versus Domain-Based Organizational Ties by Neighborhood
Upham’s Corner West Roxbury GSS 2004
Individual Ties to Organizations Mean SD Mean SD Mean SD
Group-based tiesA fraternal group 0.03 0.17 0.07 0.23 0.03 0.18A veteran’s group 0.03 0.19 0.06 0.23 0.03 0.16An environmental group 0.03 0.19 0.12 0.31 0.03 0.16A hobby or garden club 0.04 0.21 0.09 0.27 0.06 0.23A political advocacy group 0.07 0.28 0.16 0.34 0.02 0.14A racial, ethnic, or nationality group 0.09 0.30 0.11 0.29 0.02 0.12A literary, art, or discussion group 0.11 0.34 0.17 0.35 0.06 0.23A political organization or campaign 0.12 0.36 0.19 0.37 – –A labor union 0.12 0.35 0.17 0.35 – –A charity or welfare group 0.14 0.38 0.29 0.42 0.05 0.22A community center 0.18 0.42 0.24 0.39 0.16 0.37A civic, business, or service club 0.22 0.45 0.21 0.37 0.05 0.22A neighborhood organization 0.32 0.51 0.25 0.40 – –Total number of group-based ties 1.49 1.89 2.14 2.01 – –
Domain-based tiesReligious organizations 1.39 2.10 1.40 1.78 – –Healthcare organizations 1.13 0.78 1.15 0.69 – –Schools (including kindergarten) 0.99 1.86 1.29 1.89 – –Recreational facilities 0.48 0.93 0.80 1.14 – –Daycare organizations 0.33 0.86 0.52 1.36 – –Volunteering organizations 0.31 0.86 0.74 1.28 – –Other informal groups 0.27 1.07 0.28 0.77 – –Total number of domain-based ties 5.77 4.18 8.00 4.85 – –
N 111 102 2,806
Note: For dichotomous and categorical variables, mean values reported are actual percentages.Source: BNPO (2007) and GSS (2004).
involvements with organizations in seven domains: healthcare, daycare, schools, recre-ation, churches, volunteering, and any “other groups.” We view these two approaches tomeasuring individuals’ organizational ties as complementary. For our multivariate anal-yses, we created two composite measures that count the total number of organizationalties7 for both the domain- and group-based approaches.
Table 2 presents these bivariate results from our survey for the two neighborhoods andcomparable results at the national level from the 2004 GSS. These bivariate results areconsistent with the hypothesis that ethnically homogenous neighborhoods have higherlevels of organizational involvements than ethnically diverse neighborhoods. Using thegroup-based measures, residents in Upham’s Corner reported fewer ties to organizationsthan those in West Roxbury across most of these groups. Two tailed t-tests showed thatmany of these differences are statistically significant (results not presented, but availableupon request). For some groups (e.g., fraternal or environmental) these results are gen-erally consistent with those reported by the GSS. For others (e.g., ethnoracial, charity,or welfare), the proportions are higher than those in the GSS, reflecting the diverseurban setting and the higher concentration8 of religious and social service groups inBoston compared to the organizational context in the national sample in GSS. On thedomain-based results, respondents also reported fewer ties to organizations in Upham’s
197

CITY & COMMUNITY
Corner than in West Roxbury. Across domains, organizational involvement is highest inreligion, healthcare, and schools while lowest in recreation and daycare.
The nature of individuals’ organizational ties varies by neighborhood. In Upham’sCorner, 32 percent of the respondents reported belonging to a neighborhood organi-zation, the highest rate in this neighborhood among the 13 types of groups that weasked about in the survey. Our qualitative interviews also pointed to the active role ofneighborhood associations, such as the Annapolis Neighborhood Association in Upham’sCorner,9 in facilitating involvements among local residents. Our qualitative respondentsrecalled joining this organization when they first moved to the neighborhood, so thatthey could stay abreast of what was happening to their neighborhood and get acquaintedwith neighbors through regular meetings. In West Roxbury, the most common organi-zational ties related to charity or welfare groups, with 29 percent of the respondentsreporting such a tie. This is consistent with our qualitative interviews, which also revealedthe central role that churches and charity organizations play in the neighborhood. GivenWest Roxbury’s Irish Catholic roots, many respondents have lived in the neighborhoodtheir whole lives, having raised their children there, and participated actively in the localcommunity.
To provide an overall picture, we also tabulated the total number of organizationalties based on both approaches. Using the group-based approach, residents reported 1.49organizational ties in Upham’s Corner compared to 1.89 in West Roxbury. Using thedomain-based approach, residents reported 5.77 organizational ties in Upham’s Cornercompared to 8 in West Roxbury. Overall, the domain-based approach revealed muchhigher levels of organizational involvement than the group-based approach. These re-sults would suggest that surveys using the standard group-based approach underestimatethe actual level of organizational involvement. These results are all the more relevant,given that we focused on only seven social domains, compared to thirteen specific groups,so the latter approach provided more specificity, which should presumably improve theaided-recall process. Furthermore, these two approaches capture potential differences inthe meaning of involvement. The domain-based approach might make accessible to therespondents the organizational ties that are meaningful and consequential to their dailylives instead of their formal memberships in organizations that might be more remoteand less important.
UNPACKING ORGANIZATIONAL INVOLVEMENT: PRIMARY ANDSECONDARY TIES
Because we were interested in the meaning of these connections, we included in our sur-vey an innovative series of questions that probe the nature of respondents’ organizationalties. For organizations in each social domain, we inquired about both primary and sec-ondary involvements. For example, a respondent’s primary involvement with a healthcarecenter was to receive healthcare. Once we established this primary tie, we then followedup with: “Sometimes people go to hospitals or health clinics for things other than healthcare. In the last year, have you done anything at all, other than receive healthcare, at orfor a hospital or health clinic?” Among those reporting secondary ties, we further askedwhether the respondent worked for, volunteered at, donated money to, fundraised for,
198

PARTICIPATION IN CONTEXT
0
10
20
30
40
50
60
Healthcare Daycare Schools Churches Recreation
Percentage
Work Volunteer Participate Donate Fundraise
FIG. 2. Frequency of secondary involvement by social domain.Source: BNPO (2007).
or participated in social activities at the organization. We also asked if they made newfriends or socialized with those whom they met through these organizations.
On secondary involvements, Figure 2 presents results across five social domains. Inaddition to primary ties, a substantial number of individuals reported secondary ties.Respondents reported the highest levels of secondary involvements with churches andschools and the lowest levels of involvements with daycare and healthcare centers. Amongthose who reported a secondary involvement, 52.1 percent donated money to theirchurch, 34.7 percent volunteered at their local gym, 26 percent participated in socialactivities either at their church or their children’s schools, and 15.5 percent organizeda fundraising event for their schools. This variation in secondary involvements across so-cial domains is partially due to differences in structural opportunities to be involved. Themeaning of involvement can also vary significantly by domain, because some organiza-tions are more likely to rely heavily on individual participation than others. Therefore,these results capture both the individuals’ propensity to participate and the organiza-tional structures for involvement. On the formation of interpersonal ties in these orga-nizational contexts, Figure 3 presents the relevant results on “making new friends” and“socializing with others.” The questions on friendships and socializing were asked of allrespondents who reported that they had a primary tie to an organization within a do-main. Among those who reported a primary involvement, about one third reported ei-ther socializing with or becoming friends with those whom they had met in the healthcaredomains, whereas about half reported the formation of interpersonal ties in all the otherdomains, with churches and schools being the most likely places for such ties to develop.Our qualitative interviews revealed many instances where respondents’ involvement with
199

CITY & COMMUNITY
33.3
56.853.5
62.9
46.9
38.1
56.8 56.9
48.551.8
0
20
40
60
80
Healthcare Daycare Schools Churches Recreation
Percentage
Socializing with others Making friends
FIG. 3. Formation of interpersonal ties by social domain.Source: BNPO (2007).
the neighborhood school, the community center, or the local parish led to sustainedrelationships with friends and acquaintances that they had met in these organizationalsettings. These relationships range from “saying hi” when seeing each other in the neigh-borhood and “speaking on the phone” once in a while to “meeting up for dinners” and“taking dance lessons” together. When asked about these relationships, respondents inboth neighborhoods reported that these organizations provide them with crucial infor-mation about their neighborhood and relevant resources. However, we do not want tosuggest that everyone was unstinting in his or her organizational involvement. For ex-ample, some respondents reported that they were simply not “joiners,” pointing to theirbusy schedules or their concern about making a commitment that they cannot honor asthe main reasons for not being more involved.
The formation of social ties routinely occurred within organizational contexts. Formany of our respondents, their organizational involvement was multifaceted and notconfined to the primary reason for which they initially became involved with the lo-cal organization. Most organizations provided individuals with not only opportunitiesto connect with a particular set of resources, but also the possibility of meeting andbefriending a particular set of individuals who were members of the same organiza-tions. However, not every organization provides the same opportunities for participa-tion and this difference is captured by the variation in secondary involvement acrossdomains. Many of these ties were also locally based because our qualitative respondentsreported basing their initial choice of neighborhood to live on recommendations fromfriends and acquaintances. These same friends and neighbors also provided informa-tion about the local organizations. From schools and churches to book clubs and base-ball leagues, our respondents recounted how neighborhood-based social ties shaped thenavigation of their neighborhood and the types of organizations to which they becameconnected.
On consequences of involvement, many respondents described neighborhood asso-ciations as catalysts of social ties, as mediators of conflicts between neighbors, or as
200

PARTICIPATION IN CONTEXT
hubs of information exchange among neighbors about local events and other resources.Beyond promoting interactions among residents in the neighborhood, these associationsalso provided the forum for collective action on specific issues facing the neighborhood.The following respondent describes how local residents advocated for the placement ofa stop sign on a busy intersection to prevent speeding.
I mean the organization that I belong to is the Annapolis Neighborhood Associationwhich is my neighborhood association and that also helped with getting to know myneighbors other than just people walking by and saying hi [ . . . ]. But by havingcommon issues or at least, you know, issues raised in a setting where we’re all sittingthere and you know someone will say, well I really, can I get a stop, what do we needto do to get a stop sign here, people are speeding and, you know, it just dawns onme that, oh yeah, that’s right I always see cars flying down that street. One of themembers will pass out flyers and, you know, so you come home and it’s on your door,reminding you that the meeting is . . . plus e-mail (46-year-old white male, Upham’sCorner).
NEIGHBORHOOD DIVERSITY AND ORGANIZATIONALINVOLVEMENT
The literature on diversity and social capital would predict that residents in West Rox-bury have more social and organizational ties than residents in Upham’s Corner. We em-pirically investigate this hypothesis through multivariate analyses. The two dependentvariables were the total number of group- and domain-based organizational ties. Becauseour measures of organizational involvements were actual counts (i.e., the number of or-ganizational ties), we fitted three nested negative binomial models for each outcome. InModel 1, our key independent variable is “neighborhood” (i.e., West Roxbury coded as1 and Upham’s Corner as 0), to address the association between neighborhood diversityand participation. In Model 2, we further control for observable demographic variables,along with three measures of neighborhood-based interpersonal ties: number of friendsin the neighborhood, number of family members in the neighborhood, and numberof years the respondent has lived in their neighborhood.10 In Model 3, we add interac-tion terms for neighborhood and the neighborhood-based interpersonal ties.11 Becausepersonal contacts matter for participation (Letski 2008), we expect interpersonal connec-tions to matter in diverse neighborhoods as much as, if not more than, in homogenousneighborhoods. Because the dependent variables contain count data (i.e., the numberof organizational ties), the negative binomial regression coefficients were calculated asthe log of the rate ratio. The incidence rate ratios, in turn, are logged transformations ofthese coefficients. For ease of interpretation, we reported the incidence rate ratios in allmodels.
Table 3 provides multivariate results on group-based organizational ties. Model 1shows that residents reported a higher rate of organizational ties in West Roxbury thanin Upham’s Corner, with an estimated rate ratio of 1.37. Controlling for observablecovariates, Model 2 reverses this pattern and shows that residents in Upham’s Cor-ner were more likely than those in West Roxbury to be connected, although blacks
201

CITY & COMMUNITY
TABLE 3. Negative Binomial Regressions on Group-Based Organizational Ties
Variables Model 1 Model 2 Model 3
West Roxbury vs. Upham’s Corner 1.370* 0.703* 0.868(0.222) (0.127) (0.234)
Black vs. white 0.575** 0.611*
(0.155) (0.167)Other vs. white 0.658 0.646
(0.209) (0.209)Immigrant 0.944 0.987
(0.207) (0.217)Female 1.120 1.116
(0.175) (0.173)Age 1.012* 1.014**
(0.007) (0.007)Education (in years) 1.132*** 1.138***
(0.041) (0.0419)Income (in $10,000) 1.001 1.001
(0.002) (0.002)Employed 1.435* 1.417*
(0.299) (0.298)Married 1.242 1.254
(0.216) (0.220)Number of children under 18 0.917 0.921
(0.073) (0.074)Number of friends in neighborhood 1.089* 1.176**
(0.056) (0.097)Number of family members in neighborhood 0.978 0.951
(0.032) (0.039)Number of years in neighborhood 0.998 1.002
(0.006) (0.008)Neighborhood * Number of friends 0.890
(0.097)Neighborhood * Number of family members 1.067
(0.067)Neighborhood * Number of years 0.993
(0.010)Constant 1.538*** 0.108*** 0.079***
(0.177) (0.073) (0.057)Log-likelihood − 362.798 − 337.56 − 336.27
N 200 200 200
Notes: Incidence rate ratio reported. Standard errors are in parentheses. *p < 0.10; **p < 0.05; ***p < 0.01.Source: BNPO (2007).
reported fewer organizational ties compared to whites (0.703). Furthermore, the num-ber of friends in the neighborhood is a significant predictor of organizational ties(1.089). Model 3 adds interactions for neighborhood and neighborhood-based socialties. The coefficient size for the interaction term for neighborhood and number offriends was not significant. However, the magnitude (0.890) suggests that friendshipties in West Roxbury might matter less for organizational ties compared to Upham’sCorner.
Table 4 provides multivariate results on domain-based organizational ties. Model1 shows that residents in West Roxbury reported significantly more organizational
202

PARTICIPATION IN CONTEXT
TABLE 4. Negative Binomial Regressions on Domain-Based Organizational Ties
Variables Model 1 Model 2 Model 3
West Roxbury vs. Upham’s Corner 1.399*** 1.018 0.990(0.129) (0.114) (0.158)
Black vs. white 0.983 0.982(0.149) (0.151)
Other vs. white 0.825 0.840(0.154) (0.163)
Immigrant 0.827 0.839(0.103) (0.105)
Female 1.171* 1.176*
(0.109) (0.109)Age (in years) 1.000 1.000
(0.004) (0.004)Education (in years) 1.073*** 1.073***
(0.023) (0.023)Income (in $10,000) 1.001 1.001
(0.001) (0.001)Employed 1.015 0.994
(0.116) (0.115)Married 1.241** 1.223**
(0.124) (0.123)Number of children under 18 1.106** 1.110**
(0.047) (0.047)Number of friends in neighborhood 1.059* 1.087*
(0.031) (0.048)Number of family members in neighborhood 0.989 0.974
(0.018) (0.022)Number of years in neighborhood 0.999 0.998
(0.003) (0.005)Neighborhood * number of friends 0.946
(0.057)Neighborhood * number of family members 1.045
(0.038)Neighborhood * number of years 1.002
(0.006)Constant 5.602*** 1.508 1.495
(0.366) (0.578) (0.592)Log-likelihood − 362.798 − 337.556 − 336.272
N 194 194 194
Note: Incidence rate ratio reported. Standard errors are in parentheses. *p < 0.10; **p < 0.05; ***p < 0.01.Source: BNPO (2007).
involvements than did those in Upham’s Corner (1.399). Model 2 shows that the ini-tial difference in organizational ties between the two neighborhoods was explained awayafter controlling for observable covariates (1.018). Among the demographic variables,being female, being educated, having kids, and being married were positive predictorsof organizational ties whereas there is no difference by race. In addition, the numberof friends in the neighborhood was associated with a higher rate of involvement (1.059).Model 3 adds interactions for neighborhood and neighborhood-based social ties. The co-efficients for the interaction terms were not significant but their direction was consistentwith the findings for group-based organizational ties.
203

CITY & COMMUNITY
This set of results showed the following. First, once we control for observable covari-ates, residents in Upham’s Corner were slightly more likely than those in West Roxburyto be connected to local organizations. Second, residents with more friends in the neigh-borhood reported higher numbers of ties to organizations in both neighborhoods. Third,these core findings are robust with regards to both measures of group- and domain-basedorganizational ties. Finally, we found no clear evidence for lower levels of participation inUpham’s Corner, even though we had expected to do so.
SENSITIVITY ANALYSES
One potential confounder is the possibility that the neighborhoods differ in their or-ganizational ecology, which might lead to differential opportunities for involvement. Toaddress this concern, we drew on the GuideStar database, a comprehensive source ofdata on nonprofits, to provide an accurate count of the organizations located withinthe two neighborhoods. We supplemented this administrative data source with our owninternet searches and research on the two neighborhoods. We then combined thesesources and deleted all duplicate records to arrive at a comprehensive list of nonprofitsby neighborhood.12 They are mostly “local organizations” within the domains of arts andculture, charity, religion, recreation, and social service, serving the local population. Ourown sense of the local ecology, based on personal observations and our interviews, wasthat there was no major difference between the two neighborhoods on this dimension.
Organizational ecology is unlikely to explain the difference in organizational involve-ment across the two neighborhoods because the number of nonprofits in both neigh-borhoods is quite similar (i.e., 46 in Upham’s Corner and 42 in West Roxbury). How-ever, the organizations in both neighborhoods differ slightly in their main focus andmission. Nonprofit organizations in Upham’s Corner tend to be more religion-based(17) and service-oriented (12), followed by organizations on art and culture (5), edu-cation (4), and health (3). Nonprofit organizations in West Roxbury are more evenlydistributed across domains, including religion (11), education (7), charity (5), and thearts (5). This difference in the distribution of organizational type might have contributedto some of the differences in organizational involvement across the neighborhoods (inTable 2).
Since we asked people about their ties to organizations in seven domains, we wouldsuggest that these differences in neighborhood organizational ecology make our resultsmore conservative. If respondents in the more diverse Upham’s Corner have local accessto a less diverse pool of organizations, they should report lower organizational involve-ment than those in West Roxbury. Instead, when we control for individual characteristics,residents in Upham’s Corner reported higher or similar levels of organizational involve-ment. Because we only compare the organizational ecology of our two field neighbor-hoods, we cannot rule out the possibility that some respondents in one neighborhoodmight be more or less likely than those in the other neighborhood to be involved withorganizations “outside” of their neighborhood. In the domain-based portion of the sur-vey, we did ask individuals about the location of the organizations they are connected to,but we do not have comparable data on the organizations that we solicited based on thegroup-based approach, making a systematic analysis of such data difficult. Although ourqualitative interviews show that the local boundaries of participation are quite fluid and
204

PARTICIPATION IN CONTEXT
vary significantly across social domains, they are also predominantly locally based, con-firming the enduring significance of neighborhoods (Sampson 2012). Given Boston’spublic transportation system, we expect similar respondents living in the two neighbor-hoods to have equal access to organizations beyond their neighborhood.
DISCUSSION AND CONCLUSION
First, the domain-based approach to organizational ties is complementary to the group-based approach, and has the advantage of generating a significantly higher number oforganizational ties. This finding has both theoretical and empirical implications. On theone hand, it calls attention to the increasingly fluid and multifaceted nature of localparticipation. In an age of instant communication, the widespread use of social mediasuch as Facebook and Twitter has made it easier than ever before for individuals to stayconnected and to get involved on both a local and global scale (Hampton et al. 2011).For example, some respondents mentioned the increasing use of local email listservsas an important tool to stay connected with local organizations, while others mentionedthat an email listserv is, in fact, the organization. On the other hand, it illustrates that howwe approach the question of participation also shapes the empirical data we collect andanalyze. By asking people about specific social domains, we imposed no rigid distinctionsbetween formal versus informal participation. As a result, we captured a more diverse rangeof responses and organizational types.
Second, our findings underscore how primary involvement often leads to both sec-ondary involvement and the formation of new interpersonal ties. These ties are oftenquite meaningful and consequential. For example, local social ties not only increase acommunity’s collective capacity to mitigate the effect of neighborhood disadvantage onparticipation, but also help residents stay engaged with issues in their community. Thisfinding highlights the central role of local organizations in the social fabric of urbancommunities. Furthermore, understanding why some organizations are more effectivein facilitating both secondary involvements and the formation of new social ties will beuseful in future research. Such an effort will help address a gap in the current literatureon social capital, namely, “[w]hen, where, and for whom do social ties produce positiveor negative consequences” (Daly and Silver 2008: 563). Future research should examinehow networks of local organizations intersect to serve the needs of all local residents.
Third, residents in the diverse Upham’s Corner reported marginally higher rates ofgroup-based organizational ties and similar levels of domain-based organizational tiesthan in homogenous West Roxbury, once we accounted for observable covariates. Putdifferently, we did not find evidence, after controls, that neighborhood diversity dampens orga-nizational involvement. We also show that neighborhood-based social ties predict organi-zational involvement. In contrast to previous work, one contribution of this study lies inidentifying the role of neighborhood-based social ties as a mechanism which, in combina-tion with typical controls, fully accounts for the relationship between diversity and partic-ipation. While after controls, Upham’s Corner has slightly lower levels of neighborhood-based social ties than West Roxbury, the role of social ties on participation is no lessimportant in the diverse neighborhood than in the homogenous one.
Our qualitative interviews further revealed that many of respondents’ interpersonalties are also neighborhood-based. Some respondents reported that they chose to move
205

CITY & COMMUNITY
to the neighborhoods based on recommendations by friends, relatives, or realtors wholived in the same neighborhood. Once there, they are often introduced by these friendsto the local organizations: the neighborhood association, the local school, the commu-nity center, the football league, and the local church. These initial organizational ties,once established, provide new venues for them to meet others, which in turn gener-ate further interpersonal and organizational ties. These insights have implications for“neighborhood effects” research by pointing to the nonrandom nature of neighborhoodselection. Individuals’ decision to move to a neighborhood is often shaped by preex-isting social networks within a neighborhood and their neighborhood choice set is of-ten limited by these social ties. As a result, advantages in one’s social networks can of-ten lead to neighborhood advantages, and vice versa. This points to the need to betterunderstand how neighborhood-based social ties might matter for neighborhood selec-tion and social mobility among the disadvantaged population, a key direction for futurework.
Fourth, these findings also point to new directions of analysis for urban poverty re-search on social networks and social support. In this research literature, individuals’ in-terpersonal ties and organizational ties are often either collapsed together under theencompassing concept of “social capital” or examined as if they were unrelated to eachother. We show that the formation of individuals’ interpersonal ties often occurs in spe-cific organizational settings, especially those with institutional structures that facilitateinvolvements, such as schools and churches. Furthermore, this process might be drivenby necessity (e.g., having to get involved in school because of a child or staying in touchwith the community health center) or by choice (e.g., going to church because a friendalso goes there or attending a neighborhood meeting because a neighbor says that it isa good way to stay informed). On a broader note, most previous studies have focused onthe impact of ethnic diversity on either interpersonal or organizational ties. Instead, weexplored both sets of ties and show that they are quite intricately connected. Althoughwe do not address the causal relationship between the two sets of ties, our qualitative andquantitative evidence provides support for both sets of predictions. Organizational tieslead to the creation of interpersonal ties, and preexisting interpersonal ties also facilitateindividuals’ involvements with organizations both within and beyond the neighborhood.
We now note several limitations. First, our research design does not allow us to statisti-cally distinguish the impact of neighborhood diversity from other neighborhood socioe-conomic characteristics, even though our careful case-based analysis suggested stronglythat ethnic diversity is the most salient dimension of difference between the neighbor-hoods, especially after we controlled for variation in respondent’s background character-istics. Furthermore, neighborhood attributes that are positively associated with diversity,such as lower income, education, or median age and higher social disorder, mistrust, orcrime, would negatively affect residents’ social ties. For this reason, if ethnic diversity am-plifies rather than stifles local interpersonal ties or organizational ties, our findings arelikely conservative estimates of these relationships. Second, our data cannot address otherfactors beyond geographical proximity that might have shaped respondents’ involve-ments, such as respondents’ needs and preferences to participate in a particular organi-zation because it serves a particular purpose in their lives, regardless of where the organi-zation might be located vis-a-vis their own neighborhood. Third, our findings are limitedto two neighborhoods in one urban setting. Whether the patterns we identified areapplicable to other neighborhoods and cities remains an open empirical question that
206

PARTICIPATION IN CONTEXT
awaits further research. Given that we have conducted a survey-based comparative casestudy, our conclusions should be tested in a larger study with multiple neighborhoods.
Acknowledgments
We are grateful to Peter Marsden, Heather McIndoe, and Mark Moore for feedback onthe project. We also thank Eva Rosen, Hilary Silver, Mary Waters, and the reviewers fromCity & Community for their thoughtful comments. Funding for this research was providedby a Hauser Center for Non-Profits Pre-Dissertation Fellowship at Harvard University (toCorina Graif and Van Tran) and by Princeton University (to Mario Small).
Notes
1Geographically, the organizations reported by our respondents are located both within and outside of our
two field neighborhoods, but the majority of these organizations are located within the Greater Boston area.
Thus, this study does not consider varying organizational density of the two neighborhoods.2This extends beyond the case of Upham’s Corner, because diverse neighborhoods in Boston and other
metropolitan areas also have higher concentrations of the foreign-born population and are more transient.
Prior research has also shown that few neighborhoods remain stably integrated, although the number of inte-
grated neighborhoods has increased over the last two decades (Ellen et al. 2012).3Even though the study’s main purpose was to study the role of nonprofits, our survey instrument solicits the
widest range of organizations that local residents are connected to, regardless of their nonprofit status.4Specifically, we used the following two questions. On volunteering, we asked: “in the last year, did you volun-
teer or help raise money for any groups or organizations that you haven’t already told me about?” On, all other
groups, we asked: “in the last year, have you been a member of or participated in any other group that plays
a useful or important role in your life – such as a book group, knitting group, sports team, or neighborhood
council?”5We did not ask about “secondary involvement” in the last two “residual domains” because the purpose of the
last two domains was simply to capture the residual groups so that we can arrive at an exhaustive count of the
domain-based organizational ties.6We use the term “groups” to refer to the membership groups that the GSS uses to solicit individuals’ con-
nections to organizations. These groups might be based on common interests, identity, or ideology.7We focus on the total count of all organizations because this count provides a good summary of local partici-
pation and an efficient way to compare across the two summary measures of participation. Although we cannot
address the extent and nature of involvement, our qualitative interviews provide some important insights. What
we learned surprised us. People described in some detail how each of the organizations they are connected to
serves particular purposes in their life. Examples range from the local book group from which an elderly woman
in West Roxbury draws support to the neighborhood association from which a young couple in Upham’s Corner
received information about local events and childcare support.8We address the question of organizational density in some detail in our sensitivity analyses.9This is but one of the neighborhood associations in Upham’s Corner, but it is quite active and engaged.10For descriptive statistics of the variables, please see Table S1 on the journal’s website.11We also tested for interactions between neighborhoods and other covariates in two ways. First, we fitted
neighborhood-specific negative binomial regressions on each of the two dependent variables and the results
did not differ substantively from those reported. Second, we selectively tested for interactions between neigh-
borhood and demographic covariates, but none of them turned out to be statistically significant.
207

CITY & COMMUNITY
12The full list is available upon request. We focused our comparison of organizational ecology on overall
count and organizational type. Although we could compare the size of organizations, their budgets, etc., using
data from GuideStar, such an analysis is beyond the scope of our article and we did not pursue it here.
REFERENCES
Alesina, Alberto, and Eliana La Ferrara. 2000. “Participation in Heterogeneous Communities.” The QuarterlyJournal of Economics 115(3):847–904.
Allard, Scott W. 2009. Out of Reach: Place, Poverty, and the New American Welfare State. New Haven, CT: Yale Univer-sity Press.
———, and Mario L. Small. 2013. “Reconsidering the Urban Disadvantaged: The Role of Systems, Institutions,and Organizations.” The Annals of the American Academy of Political and Social Science 647:6–21.
Allport, Gordon. 1954. The Nature of Prejudice. Cambridge, MA: Addison-Wesley.Bakker, Linda, and Karien Dekker. 2012. “Social Trust in Urban Neighbourhoods: The Effect of Relative Ethnic
Group Position.” Urban Studies 49(10):2031–47.Blalock, Hubert. 1967. Toward a Theory of Minority-Group Relations. New York, NY: Wiley and Sons.Briggs, Xavier de Souza. 2007. “‘Some of My Best Friends Are . . . ’: Interracial Friendships, Class, and Segrega-
tion in America.” City & Community 6(4):263–90.Coleman, James S. 1990. Foundations of Social Theory. Cambridge, MA: Harvard University Press.Costa, Dora L., and Matthew E. Kahn. 2003. “Civic Engagement and Community Heterogeneity: An Economist’s
Perspective.” Perspectives on Politics 1:103–11.Daly, Mary, and Hilary Silver. 2008. “Social Exclusion and Social Capital: A Comparison and Critique.” Theory
and Society 37:537–66.Dominguez, Silvia, and Celeste Watkins-Hayes. 2003. “Creating Networks for Survival and Mobility: Social
Capital among African-Americans and Latin-Americans Low-Income Mothers.” Social Problems 50(1):111–35.
Ellen, Ingrid, Katherine O’Regan, and Keren Horn. 2012. “Pathways to Integration: Examining Changes inthe Prevalence of Racially Integrated Neighborhoods.” Cityscape: A Journal of Policy Development and Research14(3):33–53.
Fischer, Claude S. 1982. To Dwell among Friends: Personal Networks in Town and City. Chicago, IL: University ofChicago Press.
———. 1975. “Toward a Subcultural Theory of Urbanism.” American Journal of Sociology 80(6):1319–41.Galaskiewicz, Joe, Wolfgang Bielefeld, and Myron Dowell. 2006. “Networks and Organizational Growth: A Study
of Community Based Nonprofits.” Administrative Science Quarterly 51:337–80.Gamm, Gerald. 1999. Urban Exodus: Why the Jews Left Boston and the Catholics Stayed. Cambridge, MA: Harvard
University Press.Graif, Corina, and Robert J. Sampson. 2009. “Spatial Heterogeneity in the Effects of Immigration and Diversity
on Neighborhood Homicide Rates.” Homicide Studies 13(3):242–60.Greif, Meredith J. 2009. “Neighborhood Attachment in Multiethnic Metropolis.” City & Community 8(1):27–45.Guest, Avery M., and Susan K. Wierzbicki. 1999. “Social Ties at the Neighborhood Level: Two Decades of GSS
Evidence.” Urban Affairs Review 35(1):92–111.Hampton, Keith N., Chul-Joo Lee, and Eun Ja Her. 2011. “How New Media Affords Network Diversity: Direct
and Mediated Access to Social Capital through Participation in Local Social Settings.” New Media & Society13(7):1031–49.
Hipp, John R., and Andrew J. Perrin. 2009. “The Simultaneous Effect of Social Distance and Physical Distanceon the Formation of Neighborhood Ties.” City & Community 8(1):5–25.
Hopkins, Daniel J. 2011. “The Limited Local Impacts of Ethnic and Racial Diversity.” American Politics Research39(2):344–79.
Iceland, John. 2009. Where We Live Now: Immigration and Race in the United States. Berkeley, CA: University ofCalifornia Press.
Kesler, Christel, and Irene Bloemraad. 2010. “Does Immigration Erode Social Capital? The Conditional Effectsof Immigration-Generated Diversity on Trust, Membership, and Participation across 19 Countries, 1981–2000.” Canadian Journal of Political Science 43(2):319–47.
208

PARTICIPATION IN CONTEXT
Lancee, Bram, and Jaap Dronkers. 2011. “Ethnic, Religious and Economic Diversity in Dutch Neighbourhoods:Explaining Quality of Contact with Neighbours, Trust in the Neighbourhood and Inter-Ethnic Trust.” Journalof Ethnic and Migration Studies 37(4):597–618.
Laurence, James. 2011. “The Effect of Ethnic Diversity and Community Disadvantage on Social Cohesion: AMulti-Level Analysis of Social Capital and Interethnic Relations in U.K. Communities.” European SociologicalReview 27(1):70–89.
Letski, Natalia. 2008. “Does Diversity Erode Social Cohesion? Social Capital and Race in British Neighbor-hoods.” Political Studies 56:99–126.
Lin, Nan. 2001. Social Capital: A Theory of Social Structure and Action. Cambridge, UK, and New York: CambridgeUniversity Press.
Martinez, Jr., Ramiro, and Abel Valenzuela, Jr. (eds.) 2006. Immigration and Crime: Ethnicity, Race, and Vio-lence. New York, NY: New York University Press.
Marwell, Nicole P. 2007. Bargaining for Brooklyn: Community Organizations in the Entrepreneurial City. Chicago, IL:University of Chicago Press.
McRoberts, Omar. 2003. Streets of Glory: Church and Community in a Black Urban Neighborhood. Chicago, IL: Uni-versity of Chicago Press.
McQuarrie, Michael, and Nicole Marwell. 2009. “The Missing Organizational Dimension in Urban Sociology.”City & Community 8(3):247–68.
McVeigh, Rory. 2006. “Structural Influences on Activism and Crime: Identifying the Social Structure of Discon-tent.” American Journal of Sociology 112(2):510–66.
Murphy, Alexandra K., and Danielle Wallace. 2010. “Opportunities for Making Ends Meet & Upward Mobility:Differences in Organizational Deprivation across Urban & Suburban Poor Neighborhoods.” Social ScienceQuarterly 91:1164–86.
Putnam, Robert D. 2000. Bowling Alone: The Collapse and Renewal of American Community. New York, NY: Simon &Schuster.
———. 2007. “E Pluribus Unum: Diversity and Community in the Twenty-First Century the 2006 Johan SkyttePrize Lecture.” Scandinavian Political Studies 30(2):137–74.
Sampson, Robert J. 2012. Great American City: Chicago and Enduring Neighborhood Effect Chicago, IL:University of Chicago Press.
———, and Corina Graif. 2009. “Neighborhood Social Capital as Differential Social Organization: Resident andLeadership Dimensions.” American Behavioral Scientist 52(11):1579–605.
———, Doug McAdam, Heather MacIndoe, and Simon Weffer-Elizondo. 2005. “Civil Society Reconsidered:The Durable Nature and Community Structure of Collective Civic Action.” American Journal of Sociology111(3):673–714.
Shaw, Clifford R., and Henry H. McKay. 1942. Juvenile Delinquency and Urban Areas. Chicago, IL: University ofChicago Press.
Small, Mario L. 2006. “Neighborhood Institutions as Resource Brokers: Childcare Centers, Inter-organizationalTies, and Resource Access among the Poor.” Social Problems 53(2):274–92.
———. 2009. Unanticipated Gains: Origins of Network Inequality in Everyday Life. Cambridge, UK: Oxford UniversityPress.
———. 2011. “How to Conduct a Mixed Method Study: Recent Trends in a Rapidly Growing Literature.” AnnualReview of Sociology 37:55–84.
———, and Monica McDermott. 2006. “The Presence of Organizational Resources in Poor Urban Neighbor-hoods: An Analysis of Average and Contextual Effect.” Social Forces 84(3):1697–724.
———, and Laura Stark. 2005. “Are Poor Neighborhoods Resource Deprived? A Case Study of Childcare Cen-ters in New York.” Social Science Quarterly 86:1013–36.
Watkins-Hayes, Celeste. 2009. The New Welfare Bureaucrats: Entanglements of Race, Class, and Policy Reform. Chicago,IL: The University of Chicago Press.
Wellman, Barry. 1979. “The Community Question: The Intimate Networks of East Yorkers.” American Journal ofSociology 84(5):1201–31.
Wilson, William J. 1987. The Truly Disadvantaged: The Inner-City, the Underclass and Public Policy. Chicago, IL:University of Chicago Press.
Yin, Robert K. 2003. Case Study Research: Design and Methods. Thousand Oaks, CA: Sage Publications.
209
CITY & COMMUNITY
Participacion en Contexto: Diversidad Barrial e Involucramiento Organizacional enBoston (Van C. Tran, Corina Graif, Alison D. Jones, Mario L. Small y ChristopherWinship)
ResumenUsamos informacion unica del Estudio sobre Organizaciones Sin Fines de Lucro enBoston, una encuesta innovadora que contiene informacion rica sobre participacion enorganizaciones en siete dominios sociales en dos barrios de Boston, para examinar larelacion entre diversidad etnica y participacion en organizaciones locales. En particular,identificamos lazos sociales a nivel barrio como un mecanismo clave que media en la aso-ciacion negativa entre diversidad y participacion. En contraste con trabajos previos, medi-mos participacion usando la aproximacion a nivel dominio y a nivel grupo, siendo la primeraaproximacion la que descubre un gran rango de conexiones organizacionales quemuchas veces son desapercibidas por la segunda aproximacion. Tambien investigamosla relacion entre lazos interpersonales y lazos organizacionales, y mostramos como uninvolucramiento primordial con una organizacion facilita el desarrollo de vınculos inter-personales posteriores y formas secundarias de involucramiento organizacional. Luegodiscutimos las implicancias de nuestros resultados para la investigacion sobre pobrezaurbana.
Supporting Information
Additional Supporting Information may be found in the online version of this article atthe publisher’s web site:
Table S1: Means and Standard Deviations of Key Variables.
210


![From slum[1] to ordinary neighborhood in a provincial town ...From slum[1] to ordinary neighborhood in a provincial town of South India: Resident-induced practices of participation](https://img.dokumen.tips/doc/110x75/604546dbcd19fd1e73477b2d/from-slum1-to-ordinary-neighborhood-in-a-provincial-town-from-slum1-to-ordinary.jpg)