Embed Size (px)
Citation preview
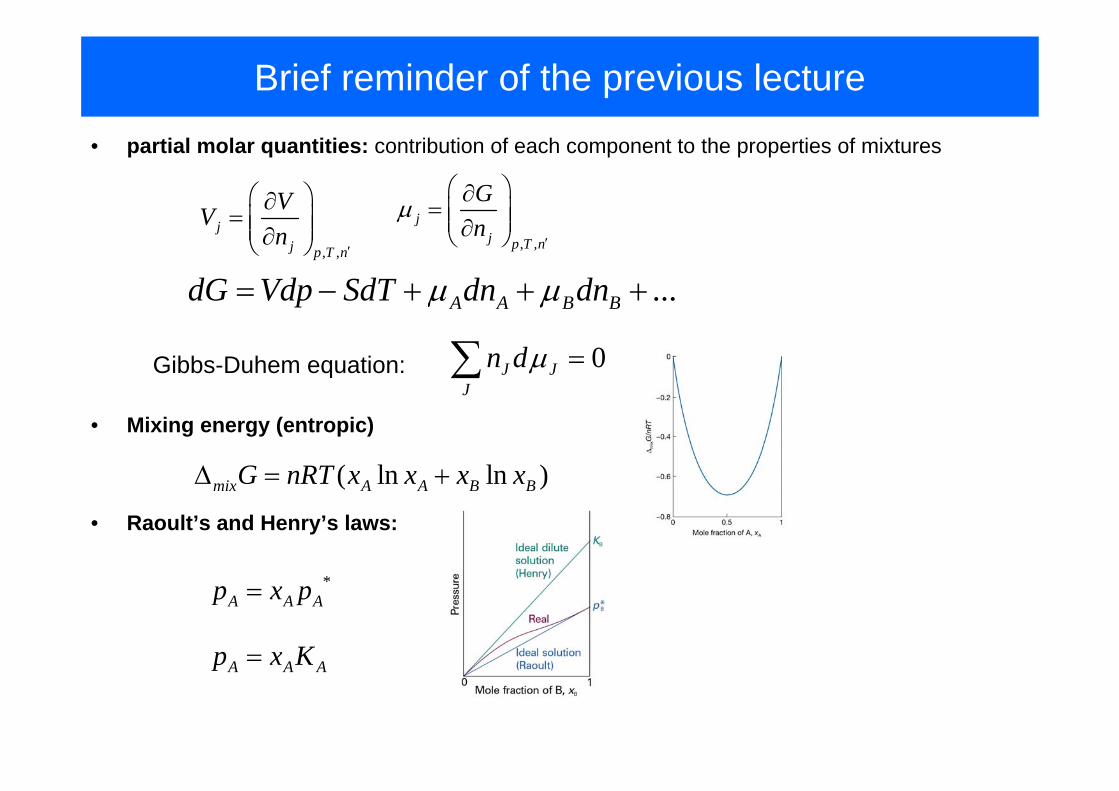
Brief reminder of the previous lecture
• partial molar quantities: contribution of each component to the properties of mixtures
, ,
jj p T n
VVn
′
⎛ ⎞∂= ⎜ ⎟⎜ ⎟∂⎝ ⎠ , ,
jj p T n
Gn
µ′
⎛ ⎞∂= ⎜ ⎟⎜ ⎟∂⎝ ⎠
...A A B BdG Vdp SdT dn dnµ µ= − + + +
Gibbs-Duhem equation: 0J JJ
n dµ =∑
( ln ln )mix A A B BG nRT x x x x∆ = +
• Mixing energy (entropic)
*A A Ap x p=
• Raoult’s and Henry’s laws:
A A Ap x K=

Brief reminder of the previous lecture
• Non-ideal mixtures: excess of enthalpy( ln ln )mix A A B B A BG nRT κ κ κ κ βκ κ∆ = + +
• Elevation of boiling point• Depression of freezing point• Osmotic pressure phenomenon

Lecture 4

Colligative properties: Osmosis• Osmosis – spontaneous passage of pure solvent into solution
separated by semipermeable membrane
Van’t Hoff equation: [ ] , [ ] /BB RT B n VΠ = =
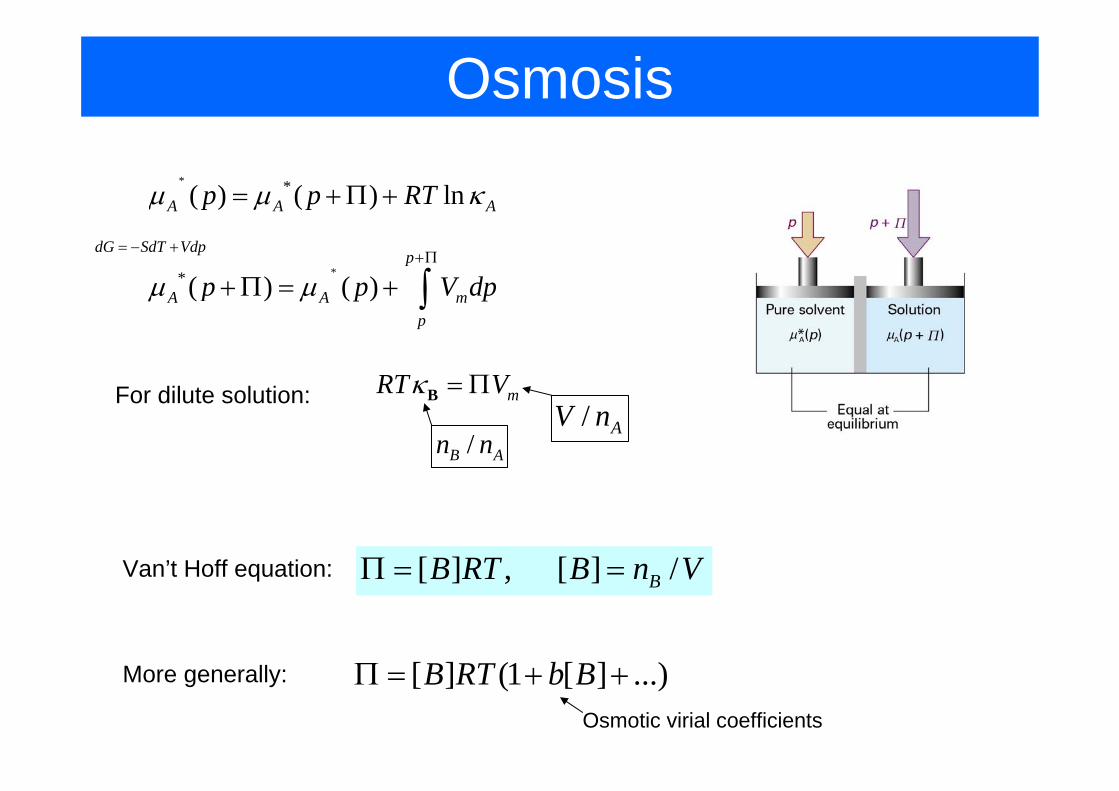
Osmosis* *( ) ( ) lnA A Ap p RTµ µ κ= +Π +
** ( ) ( )p
A A mp
p p V dpµ µ+Π
+Π = + ∫
For dilute solution: mRT Vκ = ΠB
/B An n/ AV n
More generally: [ ] (1 [ ] ...)B RT b BΠ = + +Osmotic virial coefficients
Van’t Hoff equation: [ ] , [ ] /BB RT B n VΠ = =
dG SdT Vdp= − +

Osmosis: Examples
• Calculate osmotic pressure exhibited by 0.1M solutions of mannitol and NaCl.
Mannitol (C6H8(OH)6)[ ] , [ ] /BB RT B n VΠ = =

Osmosis: Examples
Isotonic conditions
Hypotonic conditions:cells burst and dyehaemolysis (for blood)
Internal osmotic pressure keeps the cell “inflated”
Hypertonic conditions:cells dry and dye
Decreasing salt
concentration
Increasing salt
concentration

Application of Osmosis• Using osmometry to determine molar mass of a macromolecule
Osmotic pressure is measured at a series of mass concentrations c and a plot ofvs. c is used to determine molar mass.
/ cΠ
[ ] (1 [ ] ...)B RT b BΠ = + +
ghρ /c M
2 ...h RT bRT cc gM gMρ ρ= + +

Membrane potential
• Electrochemical potential
Fcyt
Fext0 ln[ ]j j j A j jz N e RT j z Fµ µ µ= + Φ = + + Φ
P-
P-
P-Na+
Na+ Na+
P-
P-
P-
Na+
Na+ Na+
0 0ln[ ] ln[ ]
[ ]ln[ ]
in in out outNa Na Na Na
out
in
RT Na z F RT Na z F
NaRTF Na
µ µ+ + + ++ +
+
+
+ + Φ = + + Φ
⎛ ⎞∆Φ = ⎜ ⎟
⎝ ⎠
• Example: membrane potential
Na salt of a protein

Activities• Let’s consider solvent in equilibrium with its vapour:
* **ln A
A AA
pRTp
µ µ= +
Generally:vapour pressure of A above solution
vapour pressure of A above pure A
* * lnA A ARTµ µ κ= +
For ideal solution
(Raoult’s law)
P*A
Pure solvent
PA
Solution
sol gasµ µ=

Activities• the aim: to modify the equations to make them applicable to real solutions
* * lnA A ART xµ µ= +
For ideal solution
(Raoult’s law)
For real solution:we introduce “effective” concentration related to the partial vapour pressure
* * lnA A ART aµ µ= + activity of A
* * ln lnA A A ART x RTµ µ γ= + +
activity coefficient of A
as 1A A Aa κ κ→ →

Solute activity• Ideal-dilute solution: Henry’s law B B Bp K κ=
* * ** *ln ln lnB B
B B B BB B
p KRT RT RT xp p
µ µ µ= + = + +
* 0 lnB B BRT xµ µ= +0
Bµ
• Real solutes* 0 lnB B BRT aµ µ= + B
BB
paK
=
• Other definitions of “standard” state– Activity in terms of molality
* 0 ln lnB B B BRT x RTµ µ γ= + +
* 00ln ; B
B B B B BbRT a ab
µ µ γ= + =– Biological standard state
0 lnH H H
RT aµ µ+ + += + 0 07 ln(10) 40 /H H H
RT kJ molµ µ µ+ + +⊕ = − = −
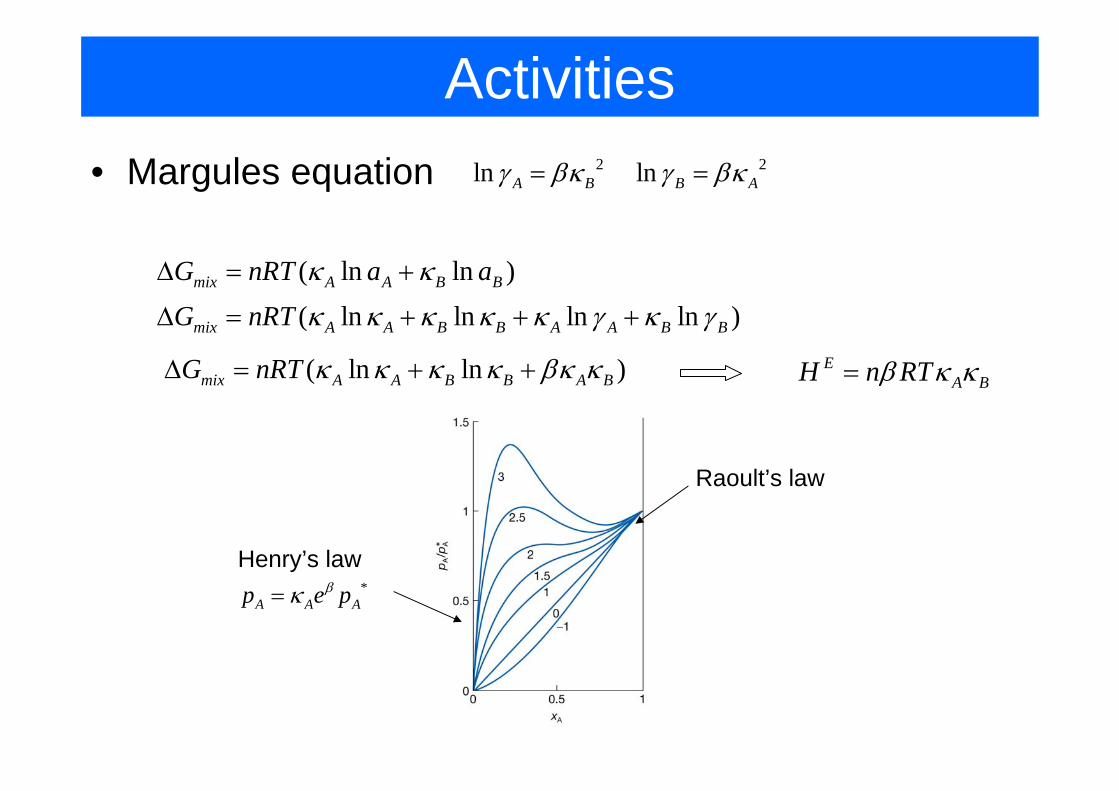
Activities• Margules equation 2 2ln lnA B B Aγ βκ γ βκ= =
( ln ln )mix A A B BG nRT a aκ κ∆ = +
( ln ln ln ln )mix A A B B A A B BG nRT κ κ κ κ κ γ κ γ∆ = + + +
( ln ln )mix A A B B A BG nRT κ κ κ κ βκ κ∆ = + + EA BH n RTβ κ κ=
*A A Ap e pβκ=
Henry’s law
Raoult’s law

Ion Activities0 lnRT aµ µ= +
standard state: ideal solution at molality b0=1mol/kg
0
bab
γ=
0 ln ln lnidealRT b RT RTµ µ γ µ γ= + + = +
ideal solution of the same molality b
Alternatively:
In ionic solution there is no experimental way to separate contribution of cationsand anions
lnideal idealmG RTµ µ µ µ γ γ+ − + − + −= + = + +
ln ; lnideal idealRT RTµ µ γ µ µ γ+ + ± − − ±= + = +
2γ ±
In case of compound MpXq: lnideal p qm mG p q G RTµ µ γ γ+ − + −= + = +
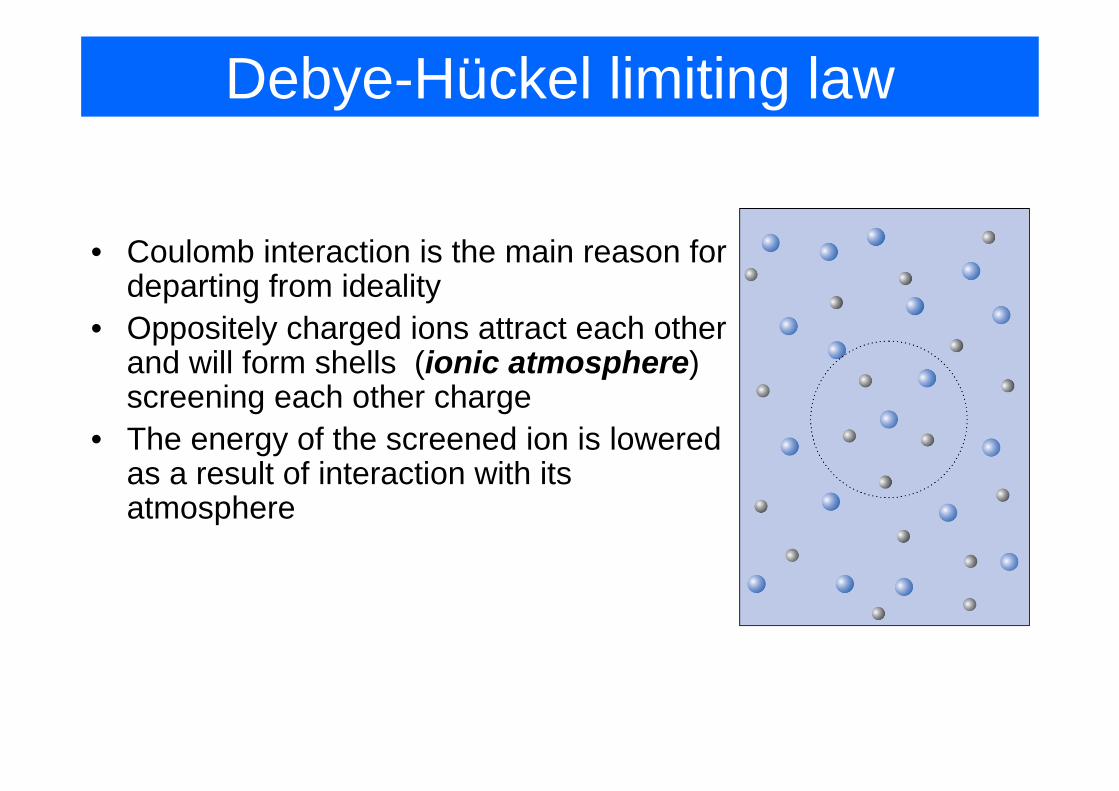
Debye-Hückel limiting law
• Coulomb interaction is the main reason for departing from ideality
• Oppositely charged ions attract each other and will form shells (ionic atmosphere) screening each other charge
• The energy of the screened ion is lowered as a result of interaction with its atmosphere

Debye-Hückel limiting law
12
2 0
log , 0.509 for water1where: ( / )2 i i
i
z z AI A
I z b b
γ ± + −= − = −
= ∑ Ionic strength of the solution (activity depends on all ions present!e.g. salting-in effect)
Example: calculate mean activity coefficient of 5 mM solution of KCL at 25C. 0 0 3
1 3 1/ 22
1 ( ) / / 5 102
log 0.509*(5 10 ) 0.0360.92
I b b b b b
z z AIγγ
−+ −
−± + −
±
= + = =
= − = − = −
=
i
i
In a limit of low concentration the activity coefficient can be calculated as:

Debye-Hückel limiting law
12log z z AIγ ± + −= −
12
12
log1
z z AI
BIγ + −± = −
+
Extended D-H law:

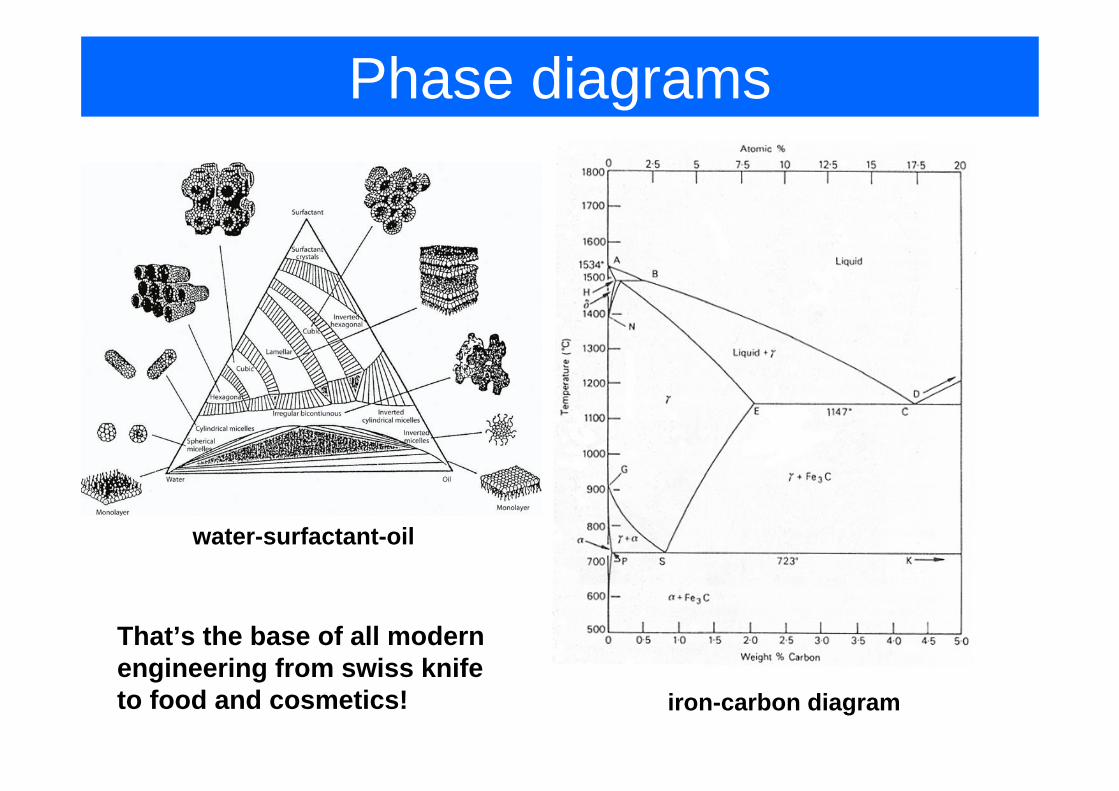
Phase diagrams
iron-carbon diagram
- what is the composition (number of phases and their amount and composition) at equilibrium at a given temperature;- what happens to the system when is cools down/heats up- we can predict the structure and the properties of the system at low temperature.
Phase diagrams
iron-carbon diagram
That’s the base of all modern engineering from swiss knife to food and cosmetics!
water-surfactant-oil

Phase diagrams• Constituent – a chemical species that is present• Component – a chemically independent constituent of the system (i.e.
not connected by a chemical reaction)
variance
number of components
number of phases
Indeed: number of variables would be: P*(C-1)+2number of equations: C*(P-1)
• Variance – the number of intensive variables that can be changed independently without disturbing the number of phases at equilibrium.
• Phase rule (J.W. Gibbs):F=C-P+2
3 2( ) ( ) ( )CaCO s CaO s CO g⎯⎯→ +←⎯⎯Phase1 Phase2 Phase3
2C =

One component diagramsC=1 therefore F=C-P+2=3-P

One component diagramsDetection of phase transitions and building a phase diagram is based on calorimetry measurements
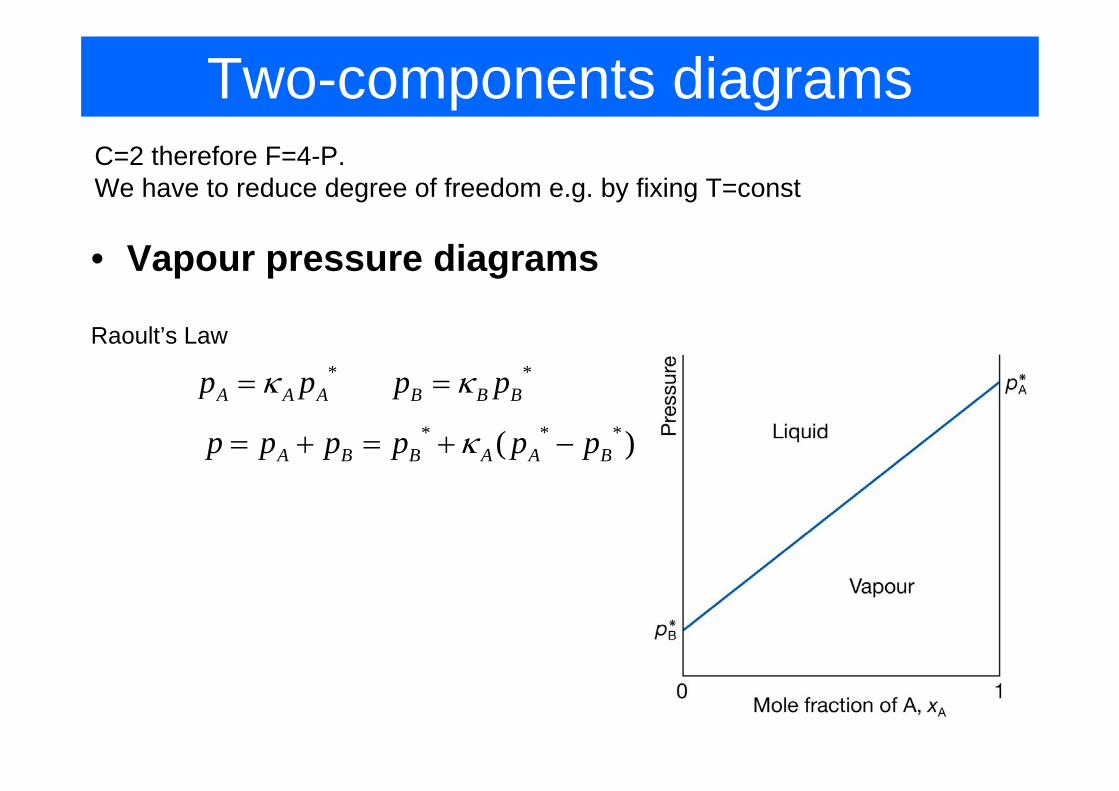
Two-components diagramsC=2 therefore F=4-P. We have to reduce degree of freedom e.g. by fixing T=const
• Vapour pressure diagrams
* *A A A B B Bp p p pκ κ= =
Raoult’s Law
* * *( )A B B A A Bp p p p p pκ= + = + −

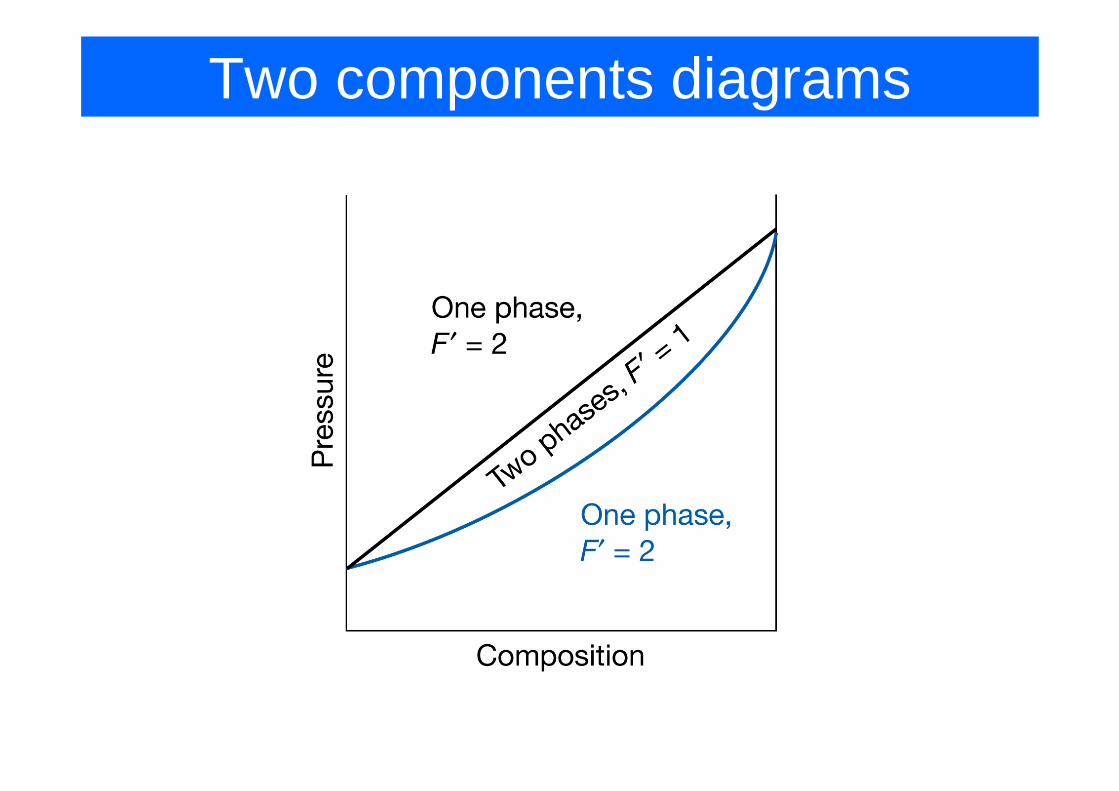
Two-components diagrams
• The composition of vapour
From Dalton’s law: ;
*; *
A BA B
A A A B B B
p py yp p
p x p p x p
= =
= =From Raoult’s law:
* ; 1* ( * *)
AA B A
B A B A
py y yp p p x
= = −+ −
*
*A
B
pp
Two components diagrams

Two components diagrams

Two components diagramsThe lever rule
n l n lα α β β=
( ) ( )
A A A
A A A
A A A A
A A A A
nz n x n y
nz n z n zn x n y n z n z
n x z n z y
α β
α β
α β α β
α α
= +
= +
+ = +
− = −
Proof:
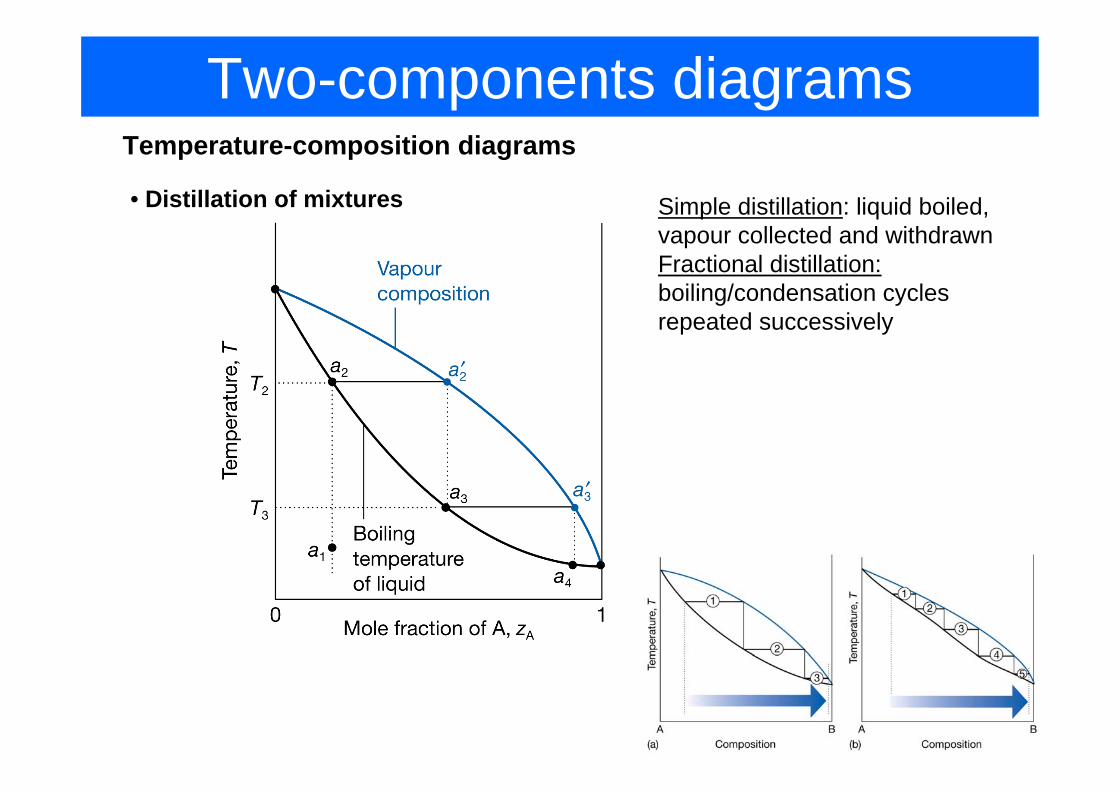
Two-components diagramsTemperature-composition diagrams
• Distillation of mixtures Simple distillation: liquid boiled, vapour collected and withdrawnFractional distillation:boiling/condensation cycles repeated successively

Two-components diagramsTemperature-composition diagrams
•Azeotropes
A-B interaction stabilizes the mixture
Azeotrope, evaporation w/o change in composition
n lα α
A-B interaction destabilizes the mixture
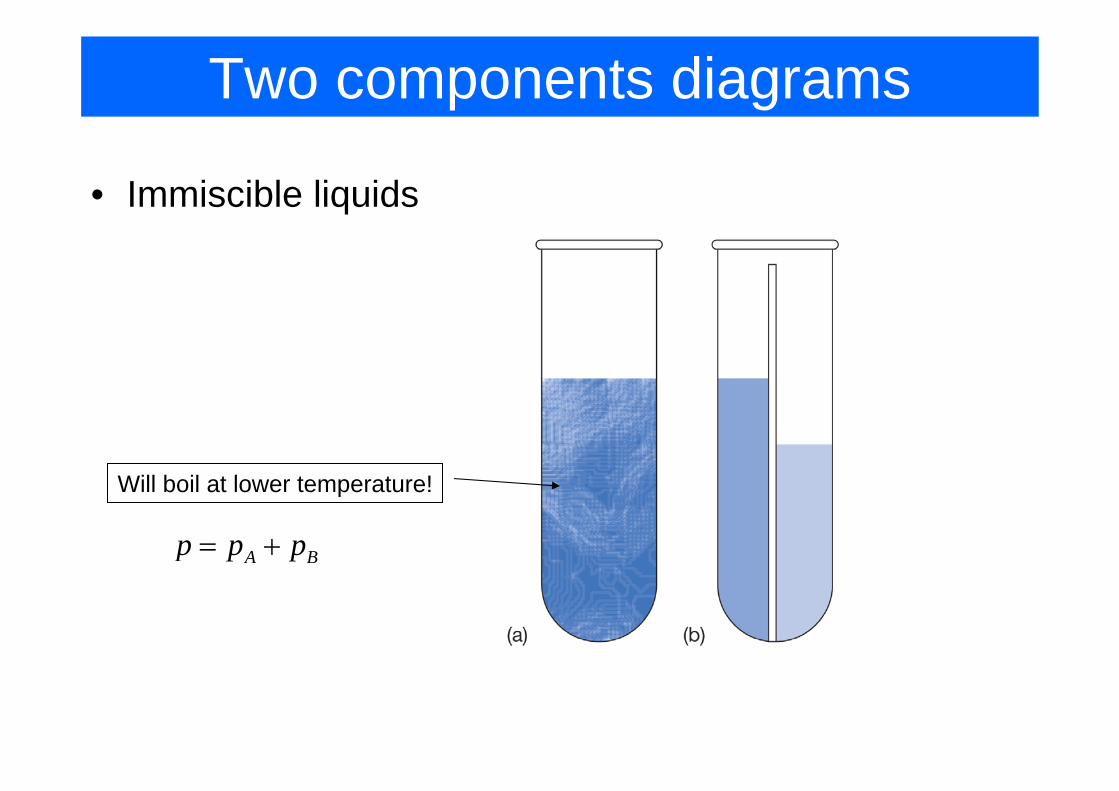
Two components diagrams
• Immiscible liquids
Will boil at lower temperature!
A Bp p p= +

Two components diagrams
• Liquid-liquid phase diagrams
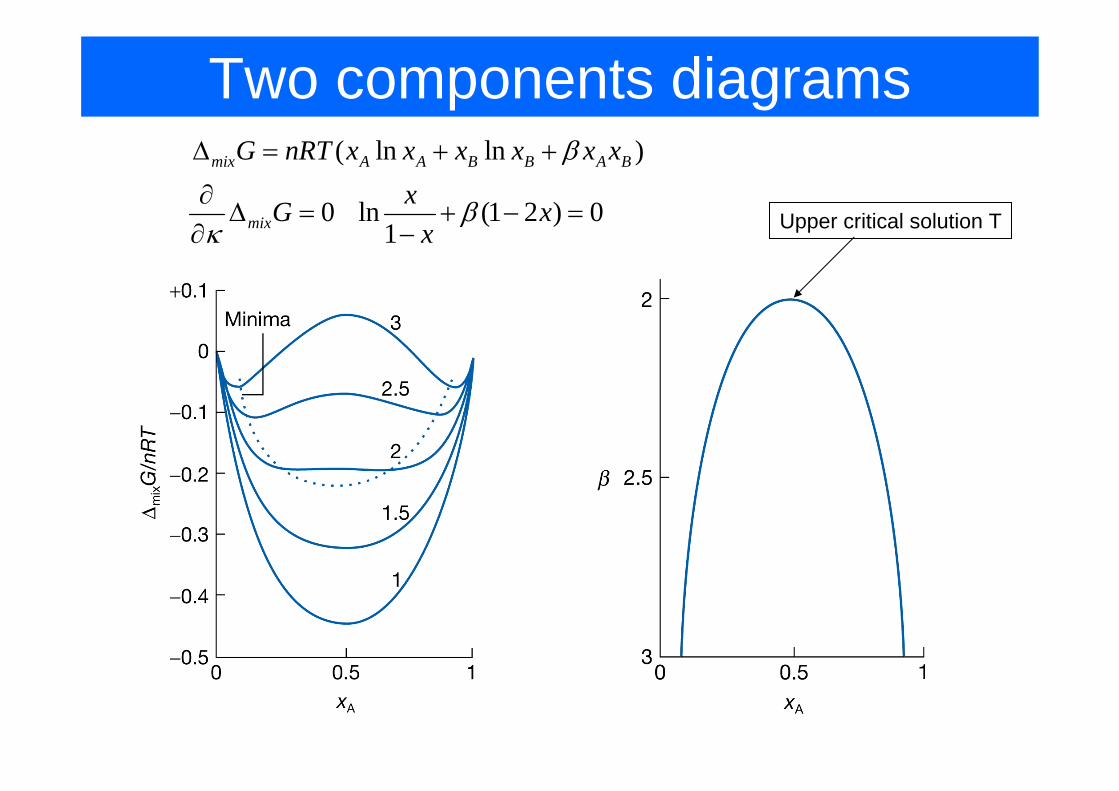
Two components diagrams
Upper critical solution T
( ln ln )mix A A B B A BG nRT x x x x x xβ∆ = + +
0 ln (1 2 ) 01mix
xG xx
βκ∂∆ = + − =
∂ −

Two components diagrams
Lower critical temperature is usually caused by breaking a weak complex of two components

Two components diagrams
Upper critical temperature is less than the boiling point
Boiling occur before liquids are fully miscible

Two components (liquid-liquid)
• Example:what happens when solution of composition a1 is boiled and vapour condensed?
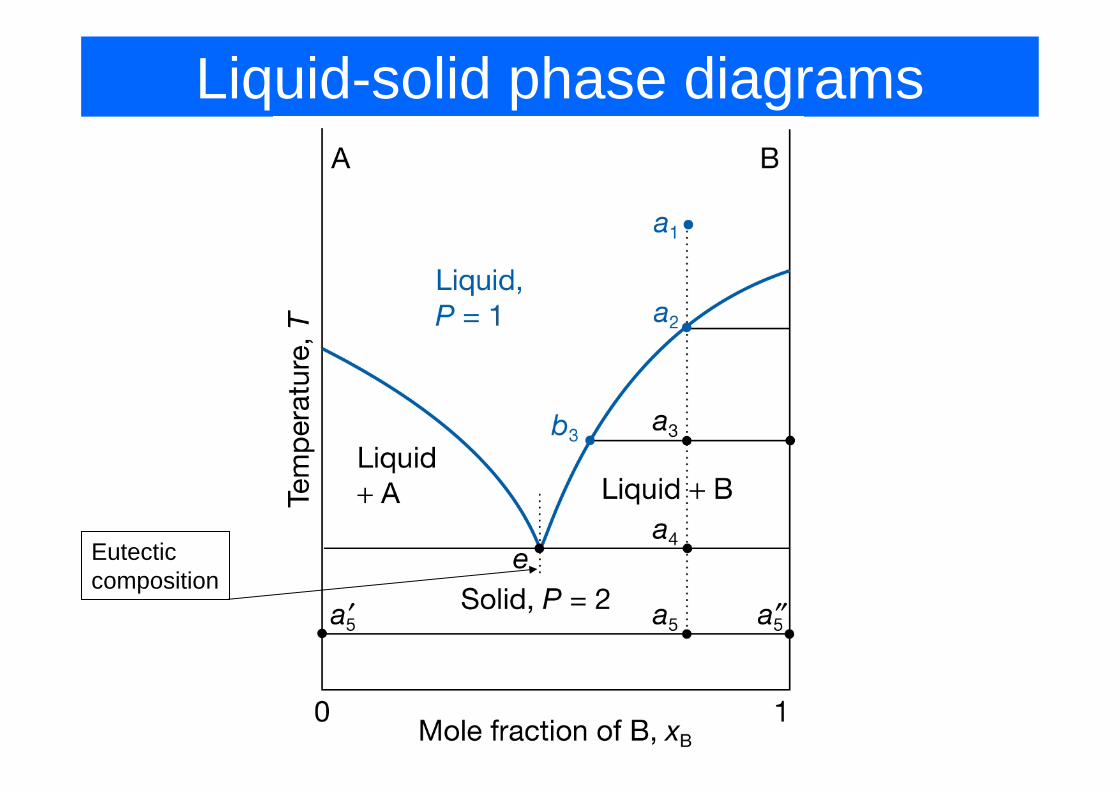
Liquid-solid phase diagrams
Eutectic composition

Liquid-solid phase diagrams
Eutectic halt
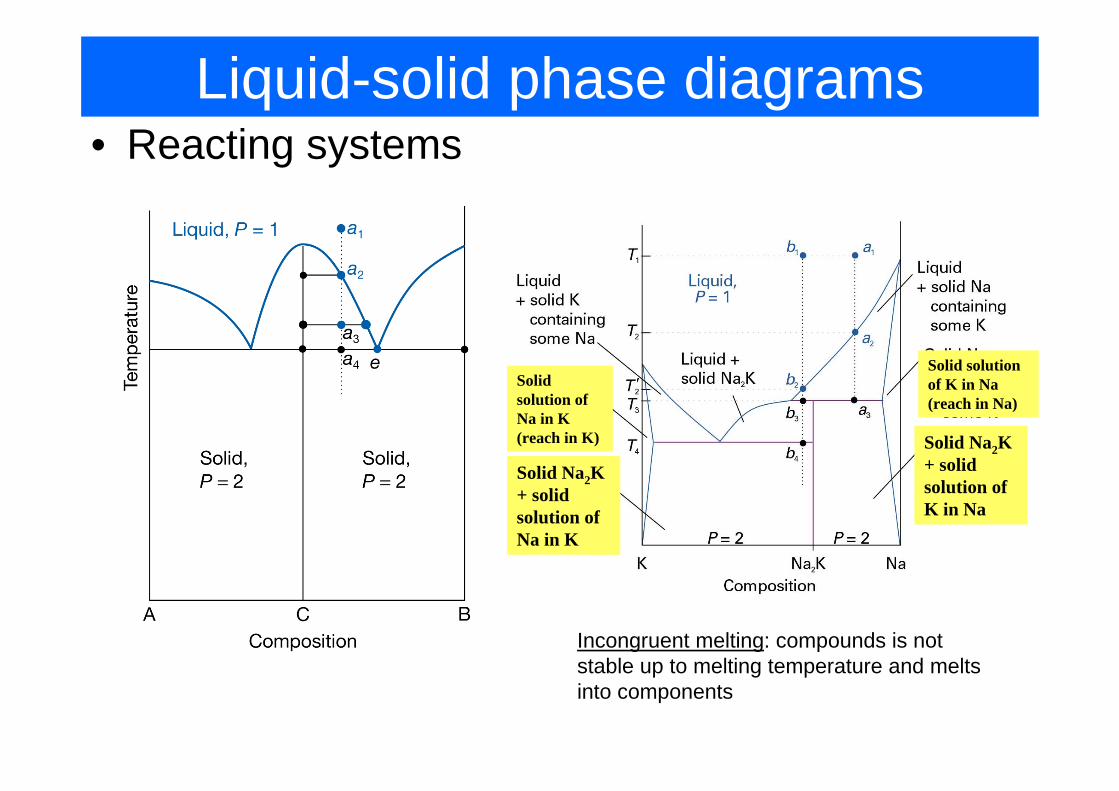
Liquid-solid phase diagrams• Reacting systems
Incongruent melting: compounds is not stable up to melting temperature and melts into components
Solid solution of Na in K (reach in K)
Solid Na2K + solid solution of Na in K
Solid solution of K in Na (reach in Na)
Solid Na2K + solid solution of K in Na
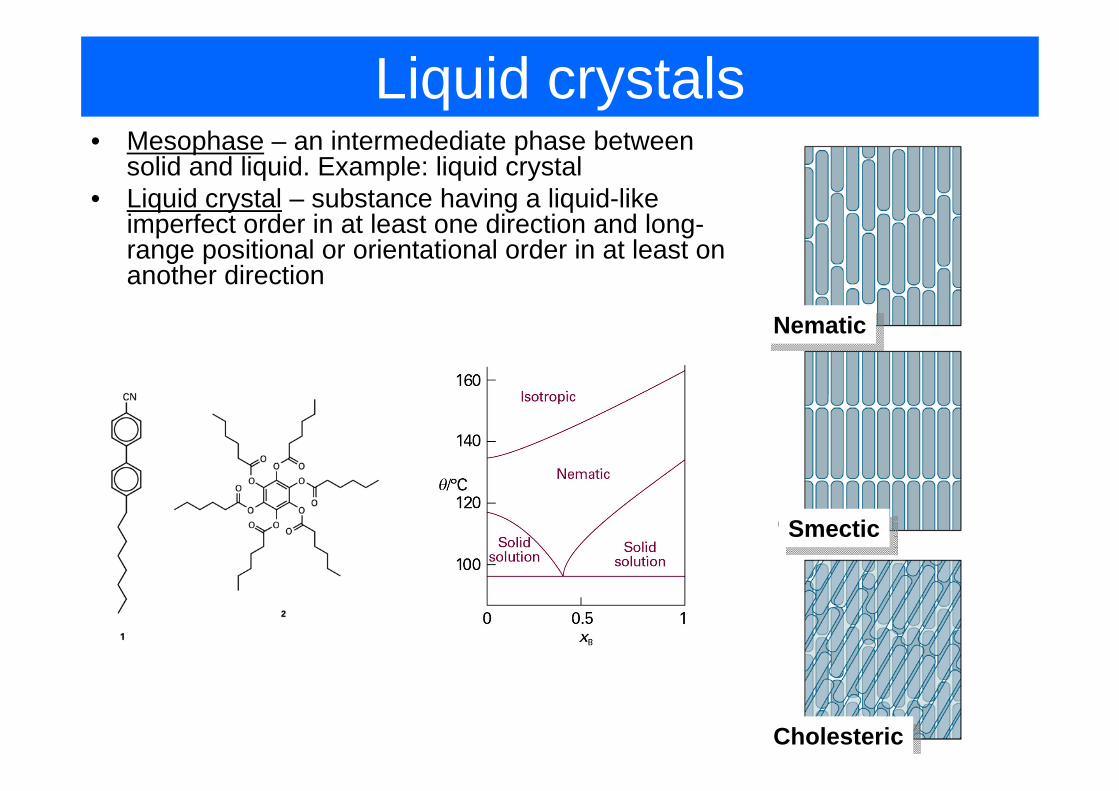
Liquid crystals• Mesophase – an intermedediate phase between
solid and liquid. Example: liquid crystal• Liquid crystal – substance having a liquid-like
imperfect order in at least one direction and long-range positional or orientational order in at least one another direction
NematicNematic
SmecticSmectic
CholestericCholesteric

Nematic crystals in LCD

Zone refining (or how to make ultrapure materials)
Equipment for Float Zone (FZ) Crystal Growth
Carrier lifetime: 1-20 msO and C impurity: <1016 atoms/cm3
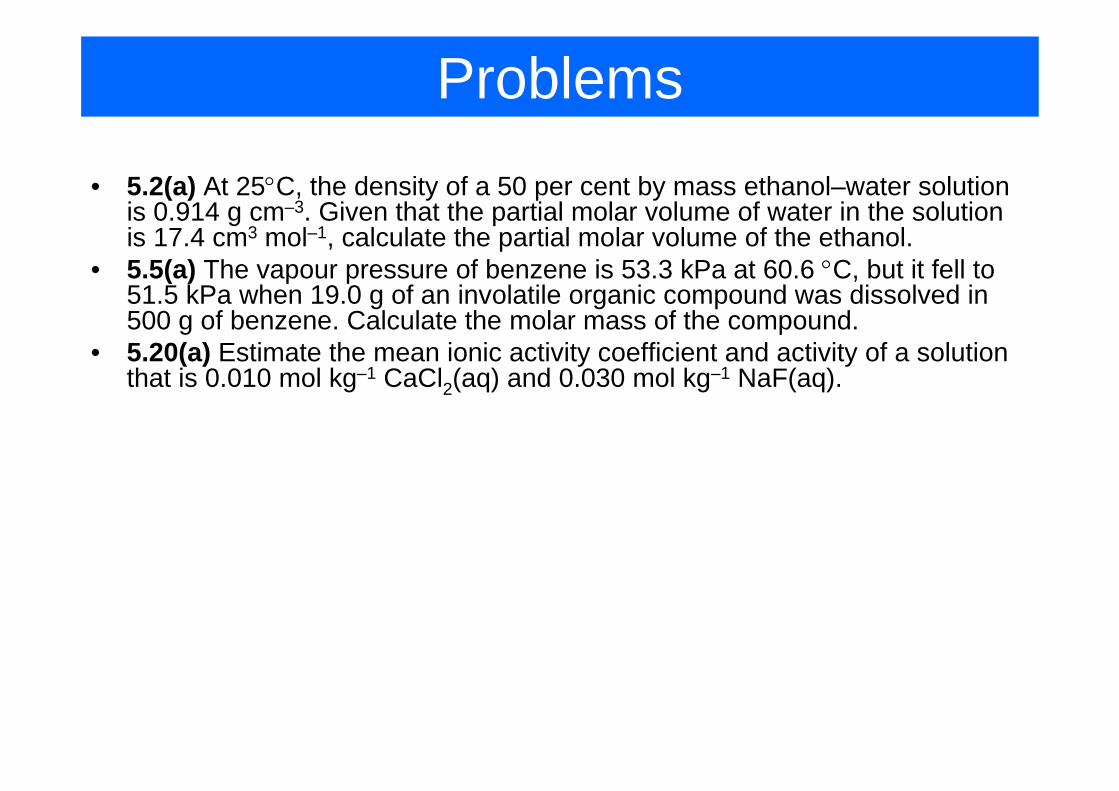
Problems• 5.2(a) At 25°C, the density of a 50 per cent by mass ethanol–water solution
is 0.914 g cm–3. Given that the partial molar volume of water in the solution is 17.4 cm3 mol–1, calculate the partial molar volume of the ethanol.
• 5.5(a) The vapour pressure of benzene is 53.3 kPa at 60.6 °C, but it fell to 51.5 kPa when 19.0 g of an involatile organic compound was dissolved in 500 g of benzene. Calculate the molar mass of the compound.
• 5.20(a) Estimate the mean ionic activity coefficient and activity of a solution that is 0.010 mol kg–1 CaCl2(aq) and 0.030 mol kg–1 NaF(aq).
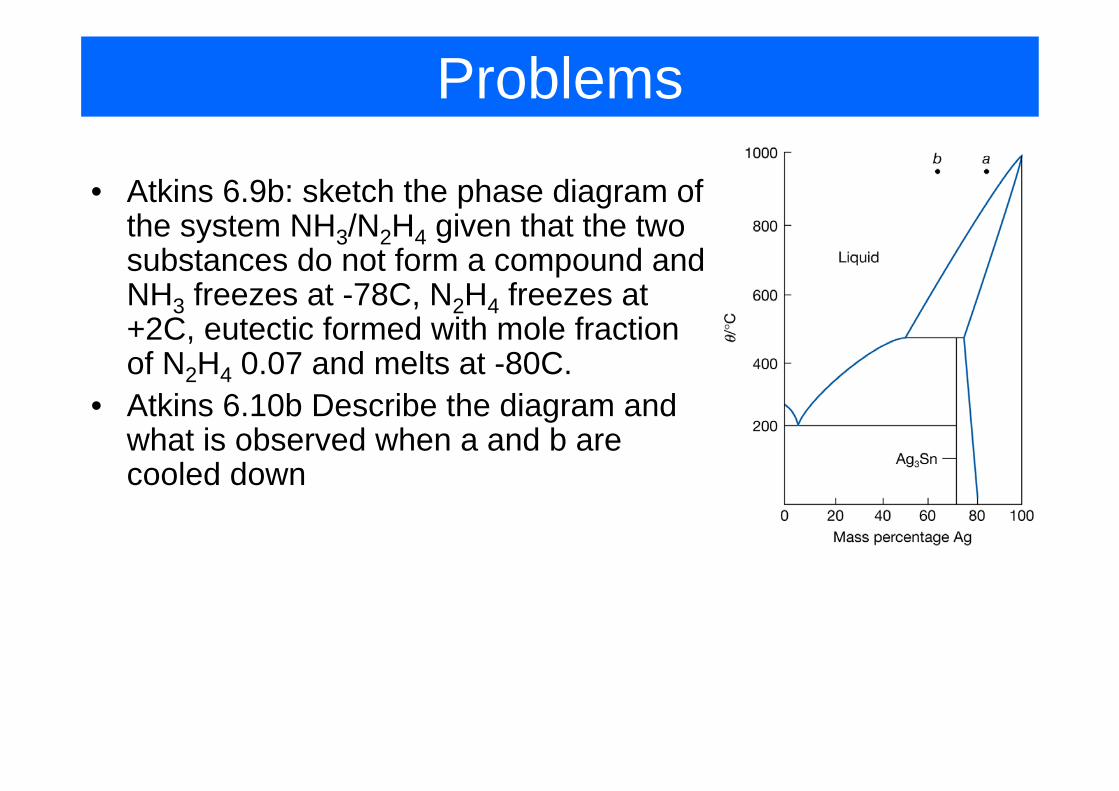
Problems
• Atkins 6.9b: sketch the phase diagram of the system NH3/N2H4 given that the two substances do not form a compound and NH3 freezes at -78C, N2H4 freezes at +2C, eutectic formed with mole fraction of N2H4 0.07 and melts at -80C.
• Atkins 6.10b Describe the diagram and what is observed when a and b are cooled down