Embed Size (px)
Citation preview

PARTIAL DISCHARGE CHARACTERISTIC OF
ELECTRICAL TREES IN POLYMERIC CABLE
INSULATION
________________________________________
A Thesis submitted in partial fulfillment of the Requirements
for the Award of the degree of
Master of Technology
In
Industrial Electronics
By
SUDHANSU SEKHAR BEHERA
ROLL No: 212EE5441
May, 2014
Department of Electrical Engineering
National Institute of Technology, Rourkela
Rourkela-769008, India
http//:www.nitrkl.ac.in

PARTIAL DISCHARGE CHARACTERISTIC OF
ELECTRICAL TREES IN POLYMERIC CABLE
INSULATION ________________________________________________________________
A Thesis submitted in partial fulfillment of the Requirements
for the Award of the degree of
Master of Technology
In
Industrial Electronics
By
SUDHANSU SEKHAR BEHERA
Under the Guidance of
Prof. Subrata Karmakar
Department of Electrical Engineering
National Institute of Technology, Rourkela
Rourkela-769008, India
http//:www.nitrkl.ac.in
National Institute of Technology
Rourkela
CERTIFICATE
This is to certify that the thesis entitled, “Partial discharge characteristics of electrical
trees in polymeric cable insulation” submitted by Sudhansu Sekhar Behera (Roll No.
212EE5441) in partial fulfillments for the requirements for the award of Master of Technology
Degree in Electrical Engineering with specialization in “Industrial Electronics” during 2012-2014
at National Institute of Technology, Rourkela is an authentic work carried out by him under my
supervision and guidance.
To the best of my knowledge, the matter embodied in the thesis has not been submitted to
any other University / Institute for the award of any degree or diploma.
Date: 02/05/2014 Prof. S. Karmakar
Department of Electrical Engineering
National Institute of Technology
Rourkela-769008

ACKNOWLEDGEMENT I have been very fortunate to have PROF. S. KARMAKAR, Department of Electrical Engineering, National
Institute of Technology; Rourkela as my project supervisor. I am highly indebted to him and express my
deep sense of gratitude for his guidance and support. I am grateful to my supervisor, who gave me the
opportunity to realize this work. He encouraged, supported and motivated me with much kindness
throughout the work. In particular, he showed me the interesting side of the high voltage engineering and
those of the highly interdisciplinary project work. I always had the freedom to follow my own ideas, which I
am very grateful for him. I really admire him for patience and staying power to carefully read the whole
manuscript. I am also grateful to our head of department, PROF. A. K. PANDA, who gave me the
opportunity to work in this field.
I express my sincere gratitude to all the faculty members of the Department of Electrical Engineering,
NIT Rourkela for their unparalleled academic support.
I render my respect to all my family members for giving me mental support and inspiration for carrying
out my research work.
Date: 02/05/2014 Sudhansu Sekhar Behera
Roll. No.: 212EE5441
M. Tech (Regular)
Dept. of Electrical Engineering

CONTENT
Topics Page no.
Abstract I
List of Abbreviation II
List of Symbol III
List of Figure IV
List of Table V
Chapter 1 INTRODUCTION 1
1.1 INTRODUCTION 2
1.2 LITRETURE REVIEW 3
1.3 MOTIVATION AND OBJECTIVE OF THE THESIS
1.3.1 MOTIVATION
1.3.2 OBJECTIVE OF THE THESIS
4
4
4
1.4 ORGANISATION OF THE THESIS 5
Chapter 2 CONCEPT OF ELECTRICAL TREE 6
2.1 INTRODUCTION 7
2.2 NECESSITY OF DETECTION OF ELECTRICAL TREES IN XLPE CABLE 7
2.3 CLASSIFICATION OF ELECTRICAL TREE 8
2.4 EFFECT OF ELECTRICAL TREE IN POLYMERIC INSULATION 10
2.5 ELECTRICAL TREE GROWTH PHASE CHARACTERISTIC 11
Chapter 3 A NUMERICAL MODEL OF ELECTRICAL TREE 12
3.1 TREE FORMULATION UNDER ELECTRICAL STRESS 13
3.2 TREE FORMULATION UNDER MECHANICAL STRESS 13
3.3 TREE FORMULATION UNDER COMBINED STRESS 14
3.4 ELECTRICFIELD CALCULATION 16
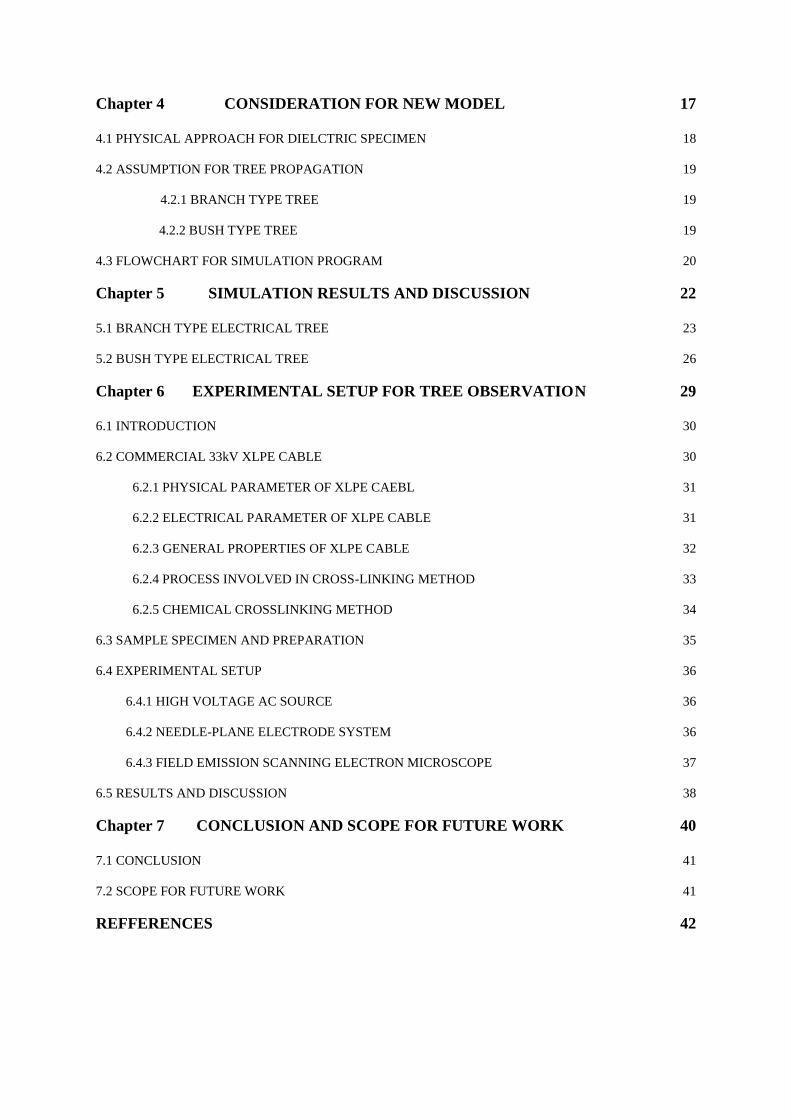
Chapter 4 CONSIDERATION FOR NEW MODEL 17
4.1 PHYSICAL APPROACH FOR DIELCTRIC SPECIMEN 18
4.2 ASSUMPTION FOR TREE PROPAGATION
4.2.1 BRANCH TYPE TREE
4.2.2 BUSH TYPE TREE
19
19
19
4.3 FLOWCHART FOR SIMULATION PROGRAM 20
Chapter 5 SIMULATION RESULTS AND DISCUSSION 22
5.1 BRANCH TYPE ELECTRICAL TREE 23
5.2 BUSH TYPE ELECTRICAL TREE 26
Chapter 6 EXPERIMENTAL SETUP FOR TREE OBSERVATIO N 29
6.1 INTRODUCTION 30
6.2 COMMERCIAL 33kV XLPE CABLE
6.2.1 PHYSICAL PARAMETER OF XLPE CAEBL
6.2.2 ELECTRICAL PARAMETER OF XLPE CABLE
6.2.3 GENERAL PROPERTIES OF XLPE CABLE
6.2.4 PROCESS INVOLVED IN CROSS-LINKING METHOD
6.2.5 CHEMICAL CROSSLINKING METHOD
30
31
31
32
33
34
6.3 SAMPLE SPECIMEN AND PREPARATION 35
6.4 EXPERIMENTAL SETUP
6.4.1 HIGH VOLTAGE AC SOURCE
6.4.2 NEEDLE-PLANE ELECTRODE SYSTEM
6.4.3 FIELD EMISSION SCANNING ELECTRON MICROSCOPE
36
36
36
37
6.5 RESULTS AND DISCUSSION 38
Chapter 7 CONCLUSION AND SCOPE FOR FUTURE WORK 40
7.1 CONCLUSION 41
7.2 SCOPE FOR FUTURE WORK 41
REFFERENCES 42
Page | I
ABSTRACT
The growth mechanism of electrical tree in high voltage and extra high voltage dielectric system is
needed for early identification, in order to resist the complete insulation failure. In power system
equipment, electrical tree formation prevention is very much crucial for reliable and long term operation
of cable section. There are so many varieties of electrical tree structure can formed from a weak region or
a imperfection site in cable insulation viz branch-type trees, bush-type trees and bush-branch type trees
depending on the voltage applied. Electrical treeing was developed in a needle-plane geometry using 5µm
tip radius hyperbolic needle shape and a 2 mm gap from the tip of the needle to plane electrode in
polymeric samples. This project was conducted by simulations based work in order to understand the
characteristics of electrical trees in solid dielectric materials. In this work, electrical tree formation
mechanism in solid dielectric material was modeled using MATLAB environment and done experimental
work in high voltage laboratory with the application of 100 kV AC source with 50 Hz supply voltage.
After the experiment the sample was viewed under FESEM for observation of electrical tree growth. It
was found that the FESEM was particularly useful for searching for electrical damage in the polymeric
insulation material where treeing phenomena takes place.

Page | II
LIST OF ABBREVIATION
Abbreviation Acronyms
PD Partial Discharge
HV High Voltage
EHV Extra High Voltage
XLPE Crosslink polyethylene
SEM Scanning electron microscope
FESEM Field emission scanning electron
microscope
CSM Charge simulation method
GA Genetic Algorithm

Page | III
LIST OF SYMBOL
Symbol Name of symbol
E Electric field
𝐸𝑐 Critical electric field
𝑊𝑒 Electrostatic energy density
𝜖0 Permittivity of the free space
𝜖𝑟 Relative permittivity
𝑊𝑚 Mechanical energy density
𝜎 Mechanical stress
𝛾 Modulus of elasticity
G Toughness
Kc Critical crack number
Emax Maximum electric field strength
V Applied voltage
r Needle tip radius
d Gap between tip to ground
electrode
q Apparent charge
k Coulomb constant

Page | IV
LIST OF FIGURE
Figure No Figure Title Page No. Figure 2.1 Branch type tree at 9kV 8
Figure 2.2 Bush-branch type trees at 12kV 8
Figure 2.3 Bush type tree at 18kV 9
Figure 2.4 Electrical treeing growing characteristics 10
Figure 4.1 Model for voids distribution in dielectric specimen 18
Figure 4.2 Flow chart model of electrical tree simulation program 21
Figure 5.1 Branch type tree at 5 kV applied voltage 24
Figure 5.2 Branch type tree at 8 kV applied voltage 24
Figure 5.3 Branch type tree at 10 kV applied voltage 25
Figure 5.4 Branch type tree at 12 kV applied voltage 25
Figure 6.1 Cross-sectional view of commercial 33kV XLPE cable 31
Figure 6.2 Schematic representations for cross linking of polyethylene 34
Figure 6.3 Molecular structure of Crosslink polyethylene 34
Figure 6.4 Schematic diagram of specimen 35
Figure 6.5 Schematic diagram of experimental setup 36
Figure 6.6 Field emissionscanning electron microscope setup 37
Figure 6.7 XLPE sample viewed under FESEM 400 X magnification 38

Page | V
LIST OF TABLE
Table No. Table title Page No.
2.5 The double structure propagation process of electrical tree 11
5.2 Comparison between 30 and 20 times iteration of simulated trees 27
6.2.1 Physical parameter of XLPE cable 31
6.2.2 Electrical parameter of XLPE cable 31
6.2.3 General properties of XLPE cable 32

Page | 1
CHAPTER 1
INTRODUCTION
Introduction
Literature review
Motivation and objective of the thesis
Organization of the thesis

Page | 2
Chapter 1
INTRODUCTION
1.1 INTRODUCTION
In recent year, XLPE cable is widely used for high voltage (HV) power system application such
as power distribution and transmission lines up to 765 kV for its extremely good properties such
as electrical, mechanical and thermal characteristics. When it is subjected to electrical stress its
electrical properties deteriorate or degrade over the time similar to other type of insulating
materials. One of the important causes for the long-term deterioration in case of polymeric
insulating materials used in high voltage application is electrical tree. At the time high electrical
stresses, the polymeric insulation undergoes localized degradation at stress enhancement due to
contaminants within insulation interfaces. This degradation process is known as electrical treeing
which is a tree like structure having numerous branching at the point of degradation. It has three
phases such as tree initiation, tree propagation and at last final breakdown which is the final
stage of the insulation failure. Electrical treeing is considered the most relevant mechanism of
insulation breakdown in different solid insulating materials. Till now so many different methods
have been given for the simulation of the short-lived propagation of electrical trees. Niemeyer et
al was given a stochastic model for the electrical tree development assuming the conductive tree
channels are collectively a local growth probability and relative to a certain power of the electric
field [1].
The mechanism of electrical treeing in solid insulation was reported by many researchers that
electrical tree is originating at points where different contaminants like impurities, bubbles, gas
void, mechanical cracks or conducting projection cause extreme electrical and mechanical stress
within small portion or local area of the dielectric materials. One of the main fundamental tools
for the characterization of an insulation defect in case of insulation material is partial discharge
(PD) measurement. It will provide early detection of electrical tree in various insulating medium.
Electrical treeing is one of partial discharge phenomena in a dielectric system of XLPE insulated
cable.
Overlay in one line, Partial discharge is the cause and electrical tree is the effect. Electrical
treeing is not just the principle component for influencing the unwavering quality of cable
insulation, additionally the last destructive condition of cable insulation working in the long time
period. Once it is initiated, it would grow up and bring a severe damage and failure in daily life

Page | 3
and the economy. The dielectric strength of XLPE is very high nearly about 1000 kV/mm but the
actual operating voltage is very much lower than this value. In the electrical treeing process, the
branching paths are known as degradation process which is caused mainly due to high voltage
stress and their growth can be observed experimentally. Usually in case of high voltage (HV)
and extra high voltage (EHV) power transmission cable system, electrical treeing phenomena are
the main cause for cable failure. Recently, it has been identified that testing the underground
cables in case of damage or defects, under the application of composite voltage formed due to
AC/DC is more reliable compared to the AC/DC voltage test [2]. In this present work, an
experimental and also simulation studies were carried out to recognize the growth dynamic
process of electrical trees in underground XLPE cables under the AC power supply.
1.2 LITERATURE REVIEW
In the most recent century, when the high voltage engineering was presented for electrical power
generation, transmission and distribution framework, an electrical trees sensation because of the
Partial discharges have been perceived as a destructive hotspot for the solid insulation maturing
in the high voltage power device. Diverse methods are created for identification, estimation and
conduct investigation of electrical trees inside or outside of the solid polymeric insulation.
Numerous creators have displayed their work about the discovery and estimation of electrical
trees. Ramanujam Sarathi, Arya Nandini and Michael G. Danikas an endeavour has been made
to recognize the partial discharges created because of the beginning and propagation of electrical
trees receiving UHF method. And explained the various issues related to the electrical tree
propagation in solid dielectric medium [3]. A. El-Zein, M. Talaat, and M. M. El Bahy given a
proposed Model for Electrical Tree Growth in Solid Insulation. They have given another model
for examining the electrical tree development in solid dielectric medium utilizing a hyperbolic
needle-to-ground plane gap. The needle is installed in the dielectric medium. Tree shape
characterized relying upon the electric field value. They have exhibited a model for re-enacting
electrical tree development in a three dimensional field [4]. L. A. Dissado, J. M. Alison, J. V.
Champion, S. J. Dood and P. I. Williams had given a report on The Propagation Structures of
Electrical Tree in Solid Polymeric insulation. They have given two interchange methodologies to
electrical tree propagation as per stochastic model that ascribe of tree structures to irregular
probabilistic elements and in release avalanche model field variances are capable. It has been
inferred that both models give the fractal structures of tree [5]. A. El-Zein, M. Talaat and M. El
Bahy have given a Model of Simulation study for Electrical Tree in Solid Insulation Using CSM
Coupled with GAs [6].

Page | 4
1.3 MOTIVATION AND OBJECTIVE OF THE THESIS 1.3.1 MOTIVATION
The presence of Partial discharge is a main problem for insulation deterioration of polymeric
cable used in the underground cable system. It is seen that most of the cable insulations are
manufactured with great care so that no impurity is added or remain in the insulation. But some
small amount of impurity is always present during its manufacturing process. The impurities are
appearing in the form of solid, liquid or gas. During the time of manufacturing process of such
cable insulation the impurity is present in the form of air bubble and voids which creates a weak
field inside the insulation. Most of the failure of such insulation occurs due to presence of PD at
the weak zones with high voltage stress in the polymeric cable insulation. One of the primary
reasons of the dielectric degradation of the XLPE cable framework is known as the electrical
treeing. Electrical treeing is not just the primary variable influencing the unwavering quality of
cross-linked polyethylene (XLPE) cable protection, additionally the final destructive form of
cable protection working in the long run.
1.3.2 THE MAIN OBJECTIVE OF THE THESIS
The important objectives are
To study the growth mechanism of electrical trees in high voltage XLPE polymeric
insulation.
Early Identification of PD in the solid dielectric insulation system in order to resist the
complete dielectric insulation failure of the cable.
Characterization of electrical tree formation in different applied voltages in MATLAB
simulation environment.
Experimentally, visualize the insulation degradation by the application of high electric
field in solid XLPE insulation specimen.
PD prevention is crucial to guarantee reliable and long term operation of the high voltage
electrical appliances.

Page | 5
1.4 ORGANIZATION OF THESIS This thesis sorted out into seven separate chapters including an introduction Chapter 1: This chapter incorporates the introduction, motivation & objective of the thesis. It
likewise contains the writing review subject on electrical treeing polymeric
insulation protection and association of the thesis.
Chapter 2: This Chapter describes the concept of electrical trees and the necessity of
electrical trees detection in XLPE cable insulation, its classification and the effects
of electrical treeing in solid cable insulation and also its growth characteristics.
Chapter 3: This chapter discussed about a numerical model of electrical tree growth which
includes the tree growth under electrical stress, under mechanical stress and both
combined stress and also calculates the electric field stress.
Chapter 4: This chapter contains physical approach for the dielectric specimen and flow chart
model for simulation project and investigation of the created model has been talked
about.
Chapter 5: This chapter contains the simulation results and its discussion.
Chapter 6: In this chapter experimental setup is used for detection of electrical trees using
the needle-plate electrode system in XLPE cable and about the FESEM that has
been used for the study of experimental results are shown in figure.
Chapter 7: Finally this chapter concludes the project work and scope for the future work is
discussed in brief.

Page | 6
CHAPTER 2
Concept of electrical trees
Introduction
Necessity of detection of electrical trees in XLPE cable
Classification of electrical trees
Effect of electrical trees in polymeric insulation

Page | 7
Chapter 2
CONCEPT OF ELECTRICAL TREES
2.1 INTRODUCTION
Now a day in all over world, polymeric insulated cables are widely used for the rapid
development in solid dielectric manufacturing techniques. The polymeric cables are very much
popular for HV and EHV application. The main polymer insulation material used for cable
insulation is XLPE, due to its good electrical and mechanical properties. But at the time of
production there is any manufacturing defects such as gas voids, bubbles, mechanical cracks,
impurity those are influencing aging and breakdown process in cables when they are utilized
within useful environment and electrical treeing phenomena is for the most part in charge of the
XLPE cable's insulation failures. In the process of electrical treeing, tree shape degradation paths
which are formed mainly due to high electric field stress in polymer and we can observe the tree
shape experimentally. Thus, an electrical tree defined as pre-breakdown phenomena by which
formation of degradation channels in solid polymeric insulation due to high electrical stress. The
path formed by this process look like tree shaped hollow channels.
2.2 NECESSITY OF ELECTRICAL TREE DETECTION IN SOLID
INSULATION
The process of manufacturing polymeric insulation structure involves several stages starting
from selection and preparation of raw material, processing of raw material and also thermal or
chemical treatment. The whole process provides a good electrical insulation to the high voltage
system. But practically it is very difficult to achieve a perfect insulation because during the
manufacturing process, there is some impurity contaminants may present that influence
insulation failure followed by breakdown which is hazardous to mankind and economy. Due to
the above reason electrical tree finding and observation is mandatory for forecasting of
insulation life span in high voltage and extra high voltage system appliances.

Page | 8
2.3 CLASSIFICATION OF ELECTRICAL TREE
The electrical trees are categorized according to their channel patterns (a) Branch type electrical
tree (b) Bush type electrical tree (c) Branch-bush type electrical tree [7].
(a) BRANCH TYPE ELECTRICAL TREE
Electrical tree generated under low voltage usually 6 kV to 10 kV having the characteristics of
branch type because of less number of conducting channel under the application of weak electric
field. The conducting channels are growing from needle tip to grounding electrode and progress
rapidly.
Figure 2.1 Branch type electrical trees at 9 kV [8]
(b) BUSH-BRANCH TYPE ELECTRICAL TREE
Electrical tree generated under medium voltage usually within 11 kV to 17 kV having the
characteristics of bush-branch type because of less number of conducting channel followed by
more number of conducting channel under the application of applied electric field. The
conducting channels are growing from needle tip to grounding electrode and progress rapidly
with respect to time.
Figure 2.2 Bush-branch type electrical trees at 12 kV [8]
Page | 9
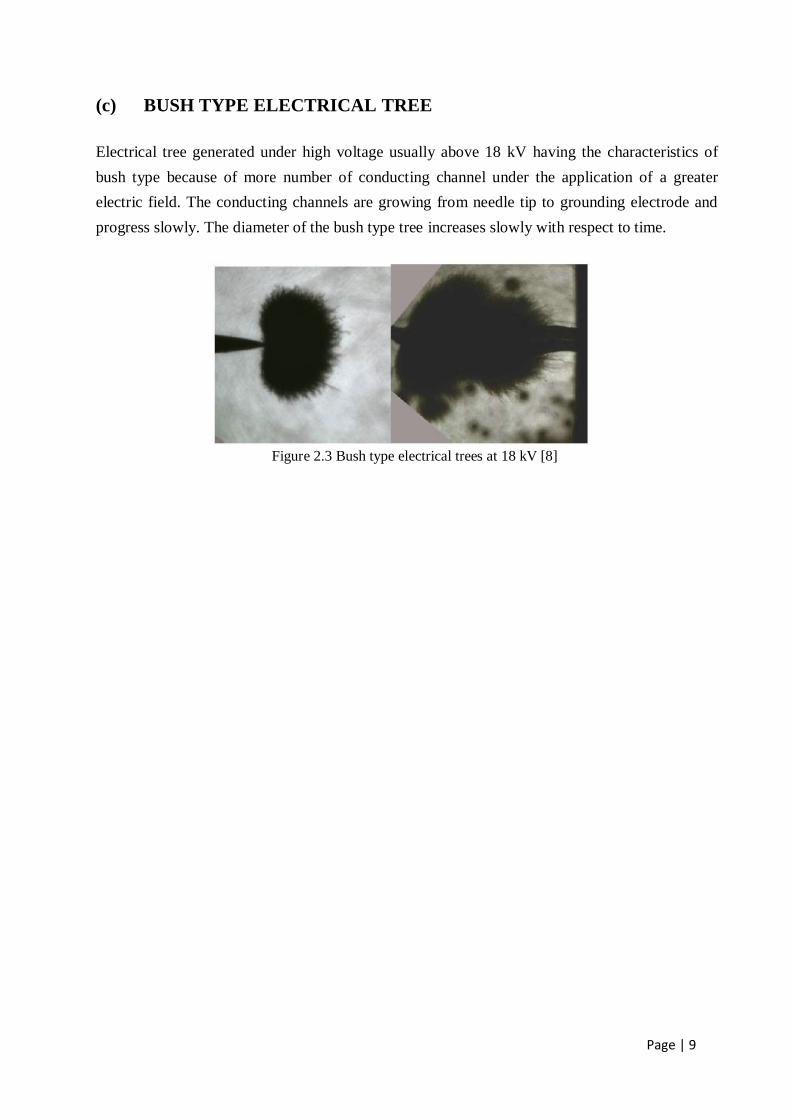
(c) BUSH TYPE ELECTRICAL TREE
Electrical tree generated under high voltage usually above 18 kV having the characteristics of
bush type because of more number of conducting channel under the application of a greater
electric field. The conducting channels are growing from needle tip to grounding electrode and
progress slowly. The diameter of the bush type tree increases slowly with respect to time.
Figure 2.3 Bush type electrical trees at 18 kV [8]

Page | 10
2.4 EFFECT OF ELECTRICAL TREE IN POLYMERIC INSULATION
The formation of electrical tree in the dielectric basically consists of three different phases.
These are inception, propagation and final breakdown. On first stage i.e. in the inception stage,
damage gathers at the current range where defects are available. In propagation stage, number of
branching channels begins from that defect territory and spreads over the dielectric. The tree
propagation structure comprises of hollow channels and its development includes the
inflammation of electrical discharges in existing channels. Despite the fact that the electric field
stress has an essential part in driving the development, however in auxiliary, mechanical stress
has additionally been demonstrated to influence the tree structure. At last, in breakdown stage,
the channels have bridged the gap between the tips of inception to the ground electrode [9].
Figure 2.4 Electrical tree growth characteristics of polymeric insulation
The effect of tree generation crack begins in a solid insulating medium. At the time the strain
energy deliver more than that required to overcome the dielectric strength of materials. As a
result electrical breakdown and insulation failure takes place.

Page | 11
2.5. ELECTRICAL TREE GROWTH PHASE CHARACTERISTIC
The electrical tree growth phase can be explained by the tree growth rate characteristic. Table 2.5
show the electrical tree propagation process in an insulation sample where the double structure
of electrical tree goes through all the growth phases such as initiation, propagation and final
breakdown [10].
Table 2.5: The double structure dispersion process of electrical tree
Item
Growth
Phase
Electrical tree structure
changing process
Growth characteristics
In the process In the end
1. Electrical
tree initiation
phase
1. Electrical tree
initiated at needle tip
when charge injection
and extraction to
insulation.
2. Initiation of a single
branch
2. Electrical
tree
propagation
phase
1. Charge injection and
extraction to dielectric
from conducting
channel.
2. The Dense branching
electrical tree appears
3. The double
structure
formation
phase
1. Growth of channels
is rapid.
2. The insulation
broken down and
failure occurred.
Page | 12
CHAPTER 3
ELECTRICAL TREE GROWTH
NUMERICAL MODEL
Proposed model of electrical tree
Electric field calculation
Page | 13
Chapter 3
ELECTRICAL TREE GROWTH NUMERICAL
MODEL
3.1 ELECTRICAL TREES FORMULATION UNDER ELECTRICAL
STRESS
In case of Electrical tree, each spark filament is taken as one crack [11]. Very high electric field
(E) will produced at the tip of the filament which will give rise to mechanical stress.
𝑊𝑒 is known as the electrostatic energy density at the tip of the crack.
𝑊𝑒 =1
2𝜖˳𝜖𝑟𝐸
2 (1)
Where𝜖˳: Permittivity of the free space
𝜖ᵣ: Relative permittivity of the insulating medium
3.2 ELECTRICAL TREES FORMULATION UNDER MECHANICAL
STRESS
The strain energy density (𝑊𝑚 ) is given as
𝑊𝑚 =𝜎2
2𝛾 J/𝑚3 (2)
Where 𝜎 is known as mechanical stress and 𝛾 is known as modulus of elasticity.
They are initiated some extra area during crack which is known as toughness (G) and produced
by energy per unit area and considering a mechanical crack the strain energy density is greater
than toughness.
i.e. 𝜎2
2𝛾 > G

Page | 14
3.3 TREES UNDER COMBINED MECHANICAL AND ELECTRICAL
STRESS
The mechanical stress induced by existing electric field (E) will be
𝜎 =1
2𝜖˳𝜖𝑟𝐸
2 (3)
After adding the strain energy (𝑊𝑚 ) with the electrostatic energy (𝑊𝑒 ) we can get total
energy (W) regarding volume [12].
𝑊 = 𝜎2
2𝛾+
1
2𝜖𝑜𝜖𝑟𝐸
2 𝜋𝑟2𝑑𝑙 (4)
Where r is the crack radius
But under the application of breakdown field, 𝑊𝑚 ˃˃ 𝑊𝑒 .
Therefore, 𝑊 = [𝜎2
2𝛾]𝜋𝑟2𝑑𝑙
= [1
4𝜖0
2𝜖𝑟2𝐸4
2𝛾]𝜋𝑟2𝑑𝑙
= [𝜖0
2𝜖𝑟2𝐸4
8𝛾]𝜋𝑟2𝑑𝑙 (5)
By considering a tubular shape crack having distance dl, it can overcome the crack
deformation energy (𝑊𝑓) and crack surface energy (𝑊𝑠) of the crack. So, the total energy must
be higher than (𝑊𝑠 + 𝑊𝑓 ).
Where, 𝑊𝑠 = 2𝜋rG 𝑑𝑙 (6)
𝑊𝑓 = 𝜋𝑟2𝛾 𝑑𝑙 (7)
From the above equation (5), the total energy is proportional to 𝐸4
So, W ∝ 𝐸4

Page | 15
At critical electric field (𝐸𝑐 ) if this energy considered as the critical energy (𝑊𝑐 ) then it will
reached for tree initiation.
𝑊𝐶 = 𝜋𝑟2𝐸𝑐
4𝜖02 𝜖𝑟
2
8𝛾𝑑𝑙0 (8)
And
𝑊
𝑊𝑐=
𝐸
𝐸𝑐
4= 𝑘 (9)
By applying an equal volume criterion, 𝜋𝑟02𝑑𝑙0 is taken equal to 𝜋𝑟2𝑑𝑙. At critical electric
field 𝐸𝑐 , 𝑑𝑙0 is consider as crack length and 𝑟0 is crack radius and energy destroy factor denoted
as 𝑘 which is constant.
In this approach the volume of one crack =1
3𝜋𝑟2 and total volume of the destroyed volume
with radius R is 4
3𝜋𝑅3 .In destroyed volume, the number of cracks covers the entire volume of
bush type tree and in destroyed volume having spherical shape, the total number of cracks (K)
with radius 𝑅𝑑 will be
𝐾 =4
3𝜋𝑅𝑑
3
1
3𝜋𝑟0
2𝑅𝑑= 4
𝑅𝑑
𝑟0
2
(10)
In 3- Dimensional space for bush type tree, the number of k in collapse zone is
𝑘 = 0.064𝐾 = 25.6
But in 2- Dimension, the critical number of cracks (𝐾𝑐) for bush tree is
𝑘𝑐= 𝐾3
=2.944
But substituting this value in equation (9) we can get
𝑊
𝑊𝑐= 𝑘𝑐
And 𝐸
𝐸𝐶= 𝑘𝑐
4 = 1.31
From the above analysis, we conclude that
𝐸
𝐸𝐶< 1.31 Indicates a branch type tree
𝐸
𝐸𝐶> 1.31 Indicates a bush type tree [13]

Page | 16
3.4 ELECTRIC FIELD CALCULATION
The electric field strength in needle-plane electrode by assuming no space charge around the tree
tip approximately can be [14],
𝐸𝑚𝑎𝑥 =2𝑉
𝑟𝑙𝑛 (1+4𝑑
𝑟) (11)
Where 𝐸𝑚𝑎𝑥 = Maximum electric field strength
V = Applied voltage at the needle tip
r = Needle-tip radius
d = the space between the needle tip to ground electrode
When the electric field value reaches at 4 MV/cm at that time the electric field competent to
overtake the mechanical strength and crack starts. This electric field is known as a critical
electric field𝐸𝑐 .
𝑉 =1
4𝜋𝜖0 𝑞
𝑟 (12)
Where q is the apparent charge and r is radius of the point charge
𝑞 = 4𝜋𝜖𝑟𝜖0𝑉𝑟 (13)
= 32 𝜋𝜖𝑟𝑉𝑟 × 10−12
And 𝜖0 = 8.85 × 10⁻¹²𝐹𝑚 is known as permittivity of the free space
Electric field at every point charge
E = 1
4𝜋𝜖0𝜖𝑟
𝑞
𝑟2 (14)
Where 𝐾 = 1
4𝜋𝜖0= 8.98 × 10⁹ is known as coulomb constant

Page | 17
CHAPTER 4
CONSIDERATION FOR A NEW
MODEL
Physical approach for dielectric specimen
Assumptions taken for tree propagation
Flowchart model for tree structure

Page | 18
-0.01 -0.008 -0.006 -0.004 -0.002 0 0.002 0.004 0.006 0.008 0.010
10
20
30
40
50
60
70
80
90
100
Width of the Sample (in mm)
Hei
gh
t o
f th
e S
am
ple
(in
mm
)
Chapter 4
CONSIDERATION FOR A NEW MODEL
4.1 PHYSICAL APPROACH FOR DIELECTRIC SPECIMEN
Considering a dielectric material having dimension 20 𝑚𝑚 × 5 𝑚𝑚 is divided into several 100
layers, each layer having 50 𝜇𝑚 contains random number of voids with random location in a two
dimension specimen depending upon the value of voids by using binomial distribution function.
Here we are choosing one simulated needle having hyperbolic shaped, with radius 𝑟 = 5 𝜇𝑚
and d = 5 𝑚𝑚. Where „r‟ is the needle tip radius and „d‟ is the separation gap between the
metallic needle tip and ground electrode.
Figure 4.1 Model for air bubbles distribution in dielectric specimen
Tip of the needle
Voids
Page | 19
4.2 CONDITIONS FOR ELECTRICAL TREE PROPAGATION
4.2.1 BRANCH TYPE ELECTRICAL TREE
When the electric field reaches at 4 MV/cm, tree inception starts and formation of
branching begins [12].
At 𝐸
𝐸𝑐= 1 one branch will form. If
𝐸
𝐸𝑐= 1.189 two crack paths will added. When
𝐸
𝐸𝑐≥ 1.31 more than two crack path will add [20].
The electric tree starts at needle tip having a high electric field to the nearest defect
which is in minimum distance.
In next step tree tip, which is previously formed have the highest electric field and
branching will be formed from tree tip to nearest void. This process continued until
the total breakdown occurs.
4.2.2 BUSH TYPE ELECTRICAL TREE
In bush type tree case complete breakdown of dielectric material occurs and at that time
𝐸
𝐸𝑐≥ 1.31.

Page | 20
4.3 FLOWCHART MODEL FOR SIMULATION PROGRAM
Sample height divided into 100 layers.
Each layer thickness 5 µm
Count first layer (l) =1
Choose a random number in range of 40
by Binomial distribution
Set the number as void no. in layer l
Random locations for voids are by using
binomial distribution in range of X (l)
l = = 1 Y (l) = Y (l-1)-50𝜇𝑚
Y (l) = 5 mm- 50𝜇𝑚
c
NO
YES
Space between needle to
ground electrode is 5 mm
START
Read the location of needle (X0, Y0)
The value of V, r, d

Page | 21
Figure 4.2 Flow chart model of electrical tree simulation program
Calculate electric field at each point of
void location by considering the needle tip
as a point charge
l == 1
Calculate E/Ec
Where E is Electric field at final branch
tip and Ec is the critical electric field
Calculate E/Ec
Where E is Electric field at needle tip
and Ec is the critical electric field
The value of E/Ec indicates the
required no. of adding branches
If branches ≥ 3 Complete breakdown
Select the maximum values of E at
void position according to required
no. of branches
Connect the selected voids at position x (l), y (l)
with one of the last branches tip position x(l-1),
y(l-1) nearer to the selected void
Hold on the Figure and update E
& tip position
l= l+1
l == 100
STOP
c
YES
NO
YES
NO
NO
YES

Page | 22
CHAPTER 5
Simulation result and discussion
Branch type Electrical tree
Bush type Electrical tree

Page | 23
Chapter 5
SIMULATION RESULT AND DISCUSSION
In this proposed simulating program, gives the predicting electrical tree growth behavior in a
solid insulation sample which is shown in figures. From these figures, the tree pattern in
different voltages will predict. The growth of electrical trees was simulated by means of two
dimensional numerical models. The newly introduced algorithm is based on the charge
simulation method (CSM) along with genetic algorithm (GA) in one or more homogeneous
media [15, 16]. Two main types of treeing, Branch-type and Bush-type trees were simulated
in respect to their shape and voltage dependency. To simulate the electrical tree activity
inside the polymeric insulation sample having dielectric constant 𝜖𝑟 = 2.3 and the dimension
of the horizontal axis is 20 mm and the vertical axis is 5 mm are taken in consideration by
MATLAB programming.
5.1 BRANCH TYPE ELECTRICAL TREE
The electric tree starts at needle tip having a high electric field to the nearest defect which is
in minimum distance. Formation of branching or channel starts when an electric field reaches
a value 4 MV/cm generally known as critical value. At the time of formation of branches in
one direction other branches considered dead without any charge during simulation [17].

Page | 24
Figure 5.1 Branch type electrical tree at 5 kV applied voltage
Figure 5.2 Branch type electrical tree at 8 kV applied voltage
-2 0 2 4 6 8 10
x 10-3
0
0.5
1
1.5
2
2.5
3
3.5
4
4.5
5
x 10-3
Width of the Sample (in mm)
Heig
ht
of
the
Sa
mple
(in
mm
)
-2 -1.5 -1 -0.5 0 0.5 1 1.5 2
x 10-3
1
2
3
4
5
6
7
8
9
x 10-4
-2 0 2 4 6 8 10
x 10-3
0
0.5
1
1.5
2
2.5
3
3.5
4
4.5
5
x 10-3
Width of the Sample (in mm)
Heig
ht
of
the
Sa
mple
(in
mm
)
-1 -0.5 0 0.5 1
x 10-3
0
0.5
1
1.5
2
2.5
3
3.5
4
4.5
5
x 10-4

Page | 25
Figure 5.3 Branch type electrical tree at 10 kV applied voltage
Figure 5.4 Branch type electrical tree at 12 kV applied voltage
-2 0 2 4 6 8 10
x 10-3
0
0.5
1
1.5
2
2.5
3
3.5
4
4.5
5
x 10-3
Width of the Sample (in mm)
Hig
ht
of
the
Sam
ple
(in
mm
)
-1 -0.5 0 0.5 1
x 10-3
0
0.5
1
1.5
2
2.5
3
3.5
4
4.5
5
x 10-4
-2 0 2 4 6 8 10
x 10-3
0
0.5
1
1.5
2
2.5
3
3.5
4
4.5
5
x 10-3
Width of the Sample (in mm)
Hig
ht
of
the
Sam
ple
(in
mm
)
-1 -0.5 0 0.5 1
x 10-3
0
0.5
1
1.5
2
2.5
3
3.5
4
4.5
5
x 10-4

Page | 26
In Fig. 5.1 the supplied voltage of 5 kV and corresponding with its tree pattern is shown and
likewise increasing applied voltage such as 8 kV, 10 kV, 12 kV simulate the tree pattern. The
entire simulated tree has been zoomed from (0-0.5) mm in height and -0.2 mm to 0.2 mm in
width for visualizing tree pattern clearly and understanding the mechanism of formation of
electrical tree channel.
In Figure 5.1, from the tip of needle 9 numbers of branches are formed i.e. at that
point the critical electric field ratio 𝐸
𝐸𝑐≥ 1.31 and in next layer 3 channels are added with 2
numbers of branches which are previously formed where 𝐸
𝐸𝑐≥ 1.31 and single channel is
added with 3 branches from previous layer where 𝐸
𝐸𝑐= 1 and 4 branches can‟t added any
further branches due to the insufficient critical electric field ( 𝐸𝑐 ).
In Figure 5.2, from the tip of needle 12 numbers of branches are formed i.e. at that
point the critical electric field ratio 𝐸
𝐸𝑐≥ 1.31 and in next layer 4 channels are added with a
single branch which are previously formed where 𝐸
𝐸𝑐≥ 1.31 and 2 channels are added with 4
branches from previous layer where 𝐸
𝐸𝑐= 1.189 and 6 branches can‟t added any further
branches due to the insufficient critical electric field.
In Figure 5.3, from the tip of needle 17 numbers of branches are formed i.e. at that point
the critical electric field ratio 𝐸
𝐸𝑐≥ 1.31 and in next layer 3 channels are added with a single
branch which are previously formed where 𝐸
𝐸𝑐≥ 1.31 and 2 channels are added with 4
branches from previous layer where 𝐸
𝐸𝑐= 1.189 and 6 channel are added with 6 branches
from previous layer where 𝐸
𝐸𝑐= 1 and 6 branches can‟t added any further branches due to the
insufficient critical electric field.
In Figure 5.4, from the tip of needle 17 numbers of branches are formed i.e. at that point
the critical electric field ratio 𝐸
𝐸𝑐≥ 1.31 and in next layer 3 channels are added with a single
branch which are previously formed where 𝐸
𝐸𝑐≥ 1.31 and 6 channels are added with 6
branches from previous layer where 𝐸
𝐸𝑐= 1 and 10 branches can‟t added any further branches
due to the insufficient critical electric field.

Page | 27
-2 -1.5 -1 -0.5 0 0.5 1 1.5
x 10-3
0
0.5
1
1.5
2
2.5
3
3.5
4
4.5
5
x 10-4
5 kV
-2 -1.5 -1 -0.5 0 0.5 1 1.5
x 10-3
0.5
1
1.5
2
2.5
3
3.5
4
4.5
5
x 10-4
5 kV
-1.5 -1 -0.5 0 0.5 1 1.5
x 10-3
0.5
1
1.5
2
2.5
3
3.5
4
4.5
x 10-4
8 kV
-1.5 -1 -0.5 0 0.5 1 1.5
x 10-3
0
0.5
1
1.5
2
2.5
3
3.5
4
4.5
x 10-4
8 kV
-1.5 -1 -0.5 0 0.5 1 1.5
x 10-3
0.5
1
1.5
2
2.5
3
3.5
4
4.5
5
x 10-4
10 kV
-1.5 -1 -0.5 0 0.5 1 1.5
x 10-3
0
0.5
1
1.5
2
2.5
3
3.5
4
4.5
x 10-4
10 kV
-1.5 -1 -0.5 0 0.5 1 1.5
x 10-3
0.5
1
1.5
2
2.5
3
3.5
4
4.5
x 10-4
12 kV
-2 -1.5 -1 -0.5 0 0.5 1 1.5 2
x 10-3
0.5
1
1.5
2
2.5
3
3.5
4
4.5
5
x 10-4
12 kV
5.2 BUSH TYPE ELECTRICAL TREE
For a statistical analysis, electrical tree pattern of 30 and 20 simulations were superimposed
at 5 kV, 8 kV, 10 kV, 12 kV applied voltages and displayed in Table 5.2. Generally electrical
trees at higher voltage stress needs less time for electrical breakdown [18].
Table 5.2 Comparison between 30 and 20 times iteration of simulated trees
Applied
Voltage
Number of Iteration
30 20
5 kV
8 kV
10 kV
12 kV

Page | 28
By comparing 30 and 20 times number of iteration of simulating tree under the application of
different voltages concluded that by increasing the iteration the number of channel increases
corresponding with applied voltage. The time required for computer simulation program of
30 number of iteration is more than 20 number of iteration.
From the above analysis, it is concluded that with increase in supply voltage the number of
initial channel increases. The number of initial cracks which determines the electrical tree
growth and depends upon the energy level of the electric field stress at the tip of the needle
relative to the critical electric field 𝐸𝑐 .
For Branch type tree
When, 𝐾𝑐 = 1 i.e. 𝐸
𝐸𝑐= 1 at that time one crack will form.
When, 𝐾𝑐 = 2 i.e. 𝐸
𝐸𝑐= 1.189 at that time two cracks formed.
For Bush type tree
When, 𝐾𝑐 = 2.949 i.e. 𝐸
𝐸𝑐≥ 1.31 at that time more than two cracks formed.
The shape of electrical trees is separating in choosing the life of electrical insulation subject to
this type of degradation. Case in point a bush tree may not prompt breakdown sooner than a
branch tree which may be organized at a higher electric field.
In this model, electrical tree propagation which is firstly depend on voids location in the
insulation medium, combines with the electrical field distribution in the medium to explain the
local area damage features encircling the tree tip, and enables this action of compressive to
predict the electrical tree growth.
The present model has the ability to quantitatively forecast the electrical tree enlargement
shape with different types of tree patterns.

Page | 29
CHAPTER 6
EXPERIMENTAL SET UP FOR
ELECTRICAL TREE OBSERVATION
Introduction
Sample preparation
Experimental set up
Experimental results

Page | 30
Chapter 6
EXPERIMENTAL SET UP FOR ELECTRICAL
TREE OBSERVATION
6.1 INTRODUCTION
In this experimental study a commercial 33 kV XLPE cable and a needle-plane electrode system
used to analyze the electrical tree growth. We are providing AC high voltage 50 Hz supply to the
test sample and observed the fractal dimension of electrical tree by using FESEM.
6.2 COMMERCIAL 33kV XLPE CABLE
In this experiment, all sample specimens were taken from a commercial 19/33 kV three core
XLPE insulated armored cable having aluminum conductors 35 mm in diameter and 8.80 mm
insulation thickness as shown in Figure 6.1. Mainly for the underground distribution purpose this
type of cables are used.
Figure 6.1 Cross-sectional view of commercial 33 kV XLPE cable
Page | 31
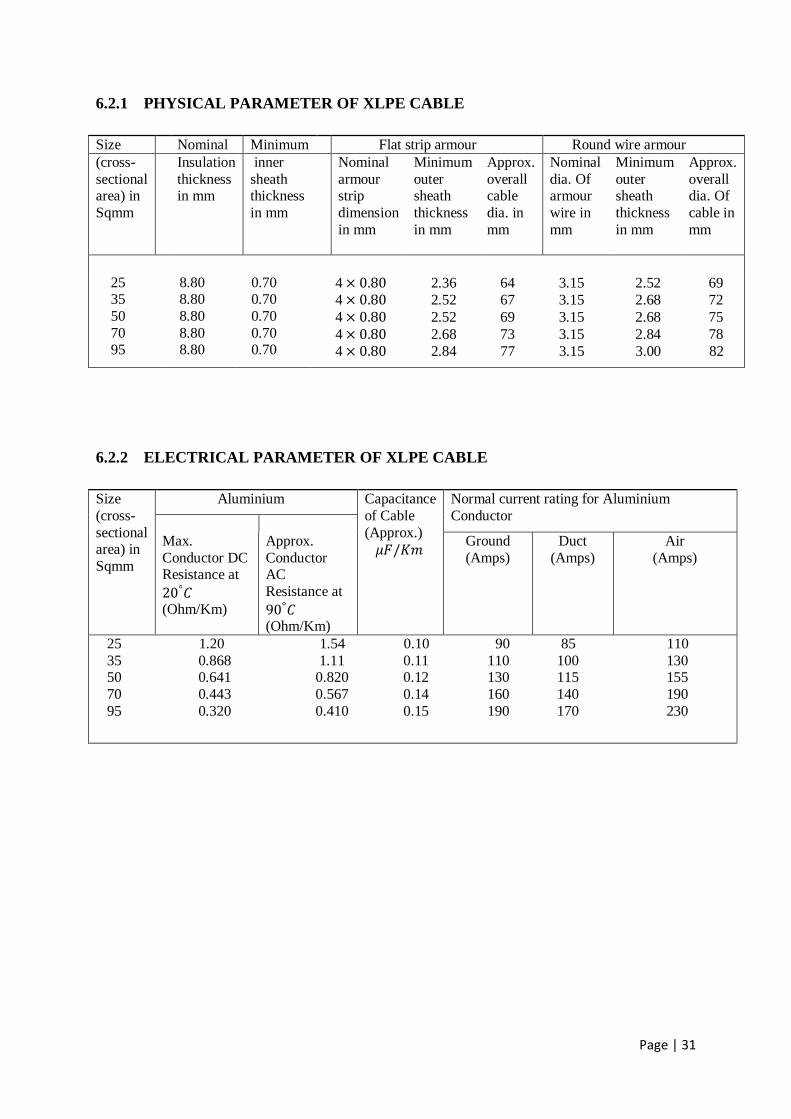
6.2.1 PHYSICAL PARAMETER OF XLPE CABLE
Size Nominal Minimum Flat strip armour Round wire armour
(cross-
sectional area) in
Sqmm
Insulation
thickness in mm
inner
sheath thickness
in mm
Nominal
armour strip
dimension
in mm
Minimum
outer sheath
thickness
in mm
Approx.
overall cable
dia. in
mm
Nominal
dia. Of armour
wire in
mm
Minimum
outer sheath
thickness
in mm
Approx.
overall dia. Of
cable in
mm
25 35
50
70 95
8.80 8.80
8.80
8.80 8.80
0.70 0.70
0.70
0.70 0.70
4 × 0.80 2.36 64 3.15 2.52 69
4 × 0.80 2.52 67 3.15 2.68 72
4 × 0.80 2.52 69 3.15 2.68 75
4 × 0.80 2.68 73 3.15 2.84 78
4 × 0.80 2.84 77 3.15 3.00 82
6.2.2 ELECTRICAL PARAMETER OF XLPE CABLE
Size
(cross-
sectional area) in
Sqmm
Aluminium Capacitance
of Cable
(Approx.)
𝜇𝐹/𝐾𝑚
Normal current rating for Aluminium
Conductor
Max.
Conductor DC Resistance at
20°𝐶 (Ohm/Km)
Approx.
Conductor AC
Resistance at
90°𝐶 (Ohm/Km)
Ground
(Amps)
Duct
(Amps)
Air
(Amps)
25 1.20 1.54 0.10 90 85 110
35 0.868 1.11 0.11 110 100 130 50 0.641 0.820 0.12 130 115 155
70 0.443 0.567 0.14 160 140 190
95 0.320 0.410 0.15 190 170 230

Page | 32
6.2.3 GENERAL PROPERTIES OF XLPE CABLE
By the process of cross-linking, the thermoplastic characteristics of polyethylene can be
converted into a stable thermosetting compound. In between parallel chains of polyethylene
molecules perpendicular molecular bonds are formed by the process of cross linking and two
dimensional polymeric structures converted into a three dimensional structure. As a result this
compound exhibits all superior properties than polyethylene.
Properties XLPE Cable
Rated temperature(℃)
Normal 90
130
250
1.9
200-350
1018
2.3
20
Excellent
Excellent
Good
Good
Good
Good
Excellent
Excellent
Excellent
Overload
Short circuit
Tensile strength (𝑘𝑔 𝑚𝑚2 )
Elongation (%)
Volume resistivity at 20℃ (𝛺. 𝑐𝑚)
Dielectric constant, 1kHZ
Dielectric strength (kV/mm)
Aging resistance
100℃
120℃
150℃
Resistant to heat deformation
Solvent resistance
Resistance to weather
Resistant to oil
Resistant to organic chemical
Resistant to inorganic chemical

Page | 33
6.2.4 PROCESS INVOLVED IN CROSS-LINKING METHOD
In cross-linking process carbon atoms of same or different polyethylene chains are attached
together to form three dimensional molecular structures. These cross-linking bonds may be
directly between carbon to carbon or a chain between two or more carbon atoms. The cross-
linking process of polyethylene can be taking place in different steps; such as Initiation,
Propagation, Bonding and Termination [19].
Initiation:
The first step involves the generation of free radicals by the process of chemical reaction or
energy radiation. Decomposition of the initiators is mainly peroxides or hydrogen atom abstracts
generated by energy radiation process.
(1) Decomposition of peroxide
*2ROROOR
**PROHPHRO
(2) High energy radiation
**PHPH
hv
Propagation:
Free radicals and atmospheric oxygen will react to form peroxide radicals and cross-linking takes
place after a series of reaction like this.
** 2 POOPO
**PPOOHPHPOO
Bonding:
Network formation starts when P* added on both sides,
**POOHPOOH
**PPOHPHPO
Termination:
Due to the presence of impurities and additives, termination takes place;
PPPP **
2
**OPOOPPOOPOO
PHHPO **

Page | 34
6.2.5 CHEMICAL CROSS-LINKING METHOD
Peroxide cross linking is the most common method for polyethylene cross-linking. In this
process, organic peroxide is used as initiator. The chemical reaction involves the formation of
Crosslink polyethylene is shown in Figure 6.2.
Figure 6.2 Schematic representations for cross linking of polyethylene
Polyethylene compound converted to a XLPE compound by cross-linked the long molecular
bonds to form a network structure is shown in Figure 6.3.
Polyethylene Compound
XLPE Compound
Figure 6.3 Molecular structure of Crosslink polyethylene

Page | 35
6.3 SAMPLE SPECIMEN AND PREPARATION
A commercial 33 kV high voltage XLPE cable was taken for the sample preparation. The
extruded semiconductor layer, i.e. insulation screening above the XLPE material have been
separate before the experiment. The cable insulation was cut cross-sectional like hollow disc
having a thickness of 4 mm shown in Figure 6.4. The electrode generally a stainless steel
metallic needle having point-plane geometry with tip radius curvature of 5 ± 1 𝜇𝑚 .the needle
electrode was inserted into the sample after the specimen was heated to 1400𝐶 for approximately
20-25 minutes to minimize mechanical stress and residual stress around the needle tip region and
after inserting needle cooled down in room temperature for 5 hours shown in Figure 6.4. The
extruded semiconducting conductor screening layer was not removed during the process because
it provides good contact with XLPE insulation with the ground electrode.
Figure 6.4: (a) Cross-sectional schematic diagram of specimen (b) Side view of sample with metal needle electrode

Page | 36
6.4 EXPERIMENTAL SETUP
The experiment equipment system used for the electrical treeing test is shown in Figure 6.5. The
main equipments are 230 V/100 kV HV transformer, needle-plane electrode system, field
emission scanning electron microscope (FESEM) and HV testing chamber. During the
experiment the sample was kept in transformer oil to control the temperature i.e. cooling purpose
and another thing is that to prevent flashover or external discharge. The experiment was
conducted at room temperature and samples were tested at 10 kV, 12 kV, 15 kV, 20 kV rms AC
voltages stress and observed the fractal structure of electrical tree growth under FESEM.
Figure 6.5 Schematic diagram of experimental setup
6.4.1 HIGH VOLTAGE AC SOURCE
The high voltage AC supply was generated by using 230 V/100 kV, 15 kVA discharge free
test transformer. By using a capacitive divider, the supply AC voltage was measured and in
regular interval of time the supply voltage was increased up to a certain limit as per required test
voltage level.
6.4.2 NEEDLE-PLANE ELECTRODE SYSTEM
In this experiment, electrical trees were generated by using needle-plane electrode system
which was made by a glass chamber containing one sharp metal needle electrode and one ground
electrode and both fixed with XLPE insulation sample. The sample was inserted in transformer

Page | 37
oil for preventing corona or external discharge and helps to maintained temperature balanced.
After providing the required amount of voltage to the sample, it was observed under the field
emission scanning electron microscope (FESEM).
6.4.3 FIELD EMISSION SCANNING ELECTRON MICROSCOPE
The FESEM facilitates ultra-high resolution micro structural characterization and analysis of
insulation, ceramic and metallic samples. FESEM provides elemental and also topographical
information at magnification of 10 X to 300,000 X with unlimited depth of field. FESEM
produced clear, less distorted image with spatial resolution 1.4 nm @ 1 kV with compared to
SEM.
Figure 6.6 Field emission scanning electron microscope (FESEM) set up
APPLICATION
Analysis of microstructure in nano to micrometer range.
Cross-sectional analysis of film thickness and construction details of semiconductor
device.
Determination of structure, uniformity and elemental composition mapping.

Page | 38
6.5 RESULTS AND DISCUSSION
To understand the electrical treeing phenomena practically inside the 33 kV XLPE cable
insulation was examined by supplying 12 kV AC voltage stress 50 Hz frequency for 5 minutes at
the needle tip and keeping the gap between the needle tips to ground electrode was 2 mm. After
the experiment the sample was viewed under FESEM for observation of electrical tree growth.
Figure 6.7 XLPE sample viewed under FESEM at 400 X magnification (a) New sample without Testing (b) Tested
sample after time 3 minutes (c) Tested sample after time 5 minutes

Page | 39
It was found that the FESEM was particularly useful for searching for electrical damage in the
polymeric insulation material where treeing phenomena takes place. Due to the propagation of
tree channel, the polymeric insulation morphology changes due to the presence of impurities.
FESEM studied carried out to determine the morphology of the XLPE insulation after the
application of electrical stress. Three XLPE sample were tested by varying time period before
testing, second one is after 3 minutes and third one is after 5 minutes, keeping supply voltage
constant i.e. 12kV and viewed under FESEM as shown in Figure 6.7 (a), Figure 6.7 (b) and
Figure 6.7 (c) respectively. By increasing time period the tree channel increases as shown in
Figure 6.7.

Page | 40
CHAPTER 7
CONCLUSION AND SCOPE FOR THE
FUTURE WORK
Conclusion
Scope for future work
Page | 41
Chapter 7
CONCLUSION AND SCOPE FOR THE FUTURE
WORK
7.1 CONCLUSION
The above model indicates the structure of electrical tree growth, which is critical to calculating
the time period of solid polymeric insulation and presented by combining both mechanical and
electrical stress successfully. By introducing a new critical ratio of E/Ec which indicates the
electrical tree shape, E/Ec < 1.31 indicates to branch-type tree and E/Ec > 1.31 to bush-type tree.
For predicting tree growth behavior one must consider the void distribution and the effect of
electrical field stress in a practical solid insulating material under the application of high
voltages. This proposed model has the capability to predict the electrical tree growth
quantitatively having different tree patterns. Some experimental results have been given to study
the morphology of the solid insulation under FESEM after the formation of electrical tree.
7.2 SCOPE FOR FUTURE WORK
In the present study different tree patterns have been studied under the application of high
voltages. This study is kindly helpful to identify the tree pattern with respect to aging.
The present research work would be further carried out
By detecting the tree process inside the solid polymeric insulation using different
detection technique and by condition monitoring for increase the reliability and life
span.
Prediction of the effect of high temperature and frequency on the electrical tree
growth rate.
To develop Artificial Intelligence (AI) software to diagnose electrical treeing faults
in solid insulation.

Page | 42
REFFERENCES
[1] L. Niemeyer, L. Pietronero and H. J. Wiesmann, "Fractal dimension of dielectric
breakdown" Phys. Rev. Lett., vol. 52, pp.1033–1036, 1984.
[2] Grzybowski, S. McMelllon, R, R. “Electrical Breakdown Strength of XLPE Cables under
Combined ac-dc Voltage”. 9th ISH, Paper No. 1086, Graz, Austria, August, 1995.
[3] R. Sarathi, A. Nandini and M. G. Danikas, “Understanding Electrical Treeing
Phenomena in XLPE cable Insulation Adopting UHF Technique”. IEEE Trans. Of
Electrical Engineering, Vol. 62, No. 2, 2011.
[4] A. El-Zein, M. Talaat, and M. M. El Bahy. “A Numerical Model of Electrical Tree
Growth in Solid Insulation” under review for publication in IEEE Trans. Dielectric and
Electrical Insulation,Vol. 16, No. 4, August 2009.
[5] L. A. Dissado, S. J. Dood, J. V. Champion, P. I. Williams and J. M. Alison. "Propagation
of Electrical Tree Structures in Solid Polymeric Insulation". IEEE Trans. Dielectric and
Electrical Insulation, Vol. 4, No. 3, pp. 259-279, June 1997.
[6] A. El-Zein, M. M. El Bahy, and M. Talaat. “A Simulation Model for Electrical Tree in
Solid Insulation Using CSM Coupled with GAs” IEEE Annual Report CEIDP, pp. 645-
649, October 2008.
[7] A. Xie, X. Zheng and G. Chen, “Investigations of Electrical Trees in the Inner Layer of
XLPE Cable Insulation Using Computer-aided Image Recording Monitoring”, IEEE
Transactions on Dielectrics and Electrical Insulation Vol. 17, No. 3; June 2010.
[8] Wei Wang, Heng Sui, Yanlong Yu, Yankun Wu and Guanghui Chen, “The growth of
electrical tree and its PD in inner and outer layer of 110 kV XLPE cable insulation”
under publication in IEEE Trans. Power and Energy Engineering, August 2012.
[9] A. L. Barclay and G. C. Stevens, "Statistical and Fractal Characteristics of Simulated
Electrical Tree Growth", IEE 6th Intern. Conf. Dielectric Materials, Measurements and
Applications, pp. 17-20, 1992.
[10] X. Q. Zheng and G. Chen, “Propagation Mechanism of Electrical Tree in XLPE Cable
Insulation by Investigating a Double Electrical Tree Structure”, IEEE Trans. Dielectr.
Electr. Insul. Vol. 15, pp. 800-807, 2008.
[11] J. C. Fothergill, "Filamentary Electromechanical Breakdown", IEEE Trans. Elec. Ins.,
Vol. 26, No. 6; pp. 1124-1129, December 1991.
[12] A. El-Zein, "Effect of Extrusion Pressure on Polyethylene Cable Insulation Treeing", 9th
Inter. Symposium on High Voltage Eng. (ISH) Austria; pp. 1018-1_1018-4, 1995.
[13] A. El-Zein, M. M. El Bahy, and M. Talaat, "Types of Electrical Trees in Solid Insulation
under Electrical and Mechanical Energy Basis", IEEE, 12th International Middle-East
Power System Conference (MEPCON), pp. 80-84, 2008.
Page | 43
[14] L. A. Dissado. "Review Understanding Electrical Trees in Solids: from Experimental to
Theory". IEEE Trans. On Dielectric and Electrical Insulation, Vol. 9, No. 4, pp. 483-497,
August 2002.
[15] N. H. Malik. “A Review of the Charge Simulation Method and its Applications”. IEEE
Transactions on Electrical Insulation, Vol. 24 No. 1, pp. 3-20, February 1989.
[16] M.M. Abouelsaad and M.M. El Bahy. "Accurate Field Computation of Needle-Plane
Gaps using an Optimized Charge Simulation Method". IEEE CEIDP, pp. 506 -509, 2000.
[17] K. S. Bromley, L. A. Dissado and J. C. Fothergill. “Local Field Calculations for
Electrical Trees in Point-Plane Geometry”. IEEE Annual Report - CEIDP, pp. 304-307,
Minneapolis, October, 1997.
[18] T. Farr, R. Vogel sang, K. Froehlich: "A new deterministic model for tree growth in
polymers with barriers", Conference on Electrical Insulation and Dielectric Phenomena,
CEIDP 2001, Kitchener, Ontario, Canada.
[19] S. M. Tamboli, S. T. Mhaske and D. D. Rale, “Crosslinked Polyethylene” , Indian
Journal of Chemical Technology, Vol. 11, pp. 853-864, November 2004.
[20] A. El-Zein, M. Talaat, and M. M. El Bahy. “A New Method to Predict The Electrical
Tree Growth in Solid Insulation” under review for publication in IEEE Trans. High
Voltage Engineering.