Embed Size (px)
Citation preview

8/20/2019 Part12 - Bi Sem
http://slidepdf.com/reader/full/part12-bi-sem 1/35
Integrated business processes with SAP ERP
Script 12: Business Intelligence &
Strategic Enterprise Management in SAP ERP
Prof. Dr. Heimo H. Adelsberger
Dipl.-Wirt.-Inf. Pouyan Khatami
Dipl.-Wirt.-Inf. Taymaz Khatami

8/20/2019 Part12 - Bi Sem
http://slidepdf.com/reader/full/part12-bi-sem 2/35
Integrated business processes with SAP ERP
page 2
Copyright Prof. Dr. Heimo H. Adelsberger/Dipl.-Wirt.-Inf. Pouyan Khatami/
Dipl.-Wirt.-Inf. Taymaz Khatami
Table of contents
Table of contents ........................................................................................................................ 2
Table of figures .......................................................................................................................... 3
Copyright .................................................................................................................................... 4
1
Introduction: Business Intelligence & Strategic Enterprise Management in SAP ERP .... 5
1.1
Unit objectives “Business Intelligence & Strategic Enterprise Management in SAP
ERP“ 5
1.2
Scenario ....................................................................................................................... 5
2 Theory – Business Intelligence .......................................................................................... 6
2.1
Business Intelligence: Information Warehouse ........................................................... 6
2.1.1 Business Intelligence: Terminology ..................................................................... 7
2.1.1.1
InfoObject ..................................................................................................... 7
2.1.1.2
InfoCube ....................................................................................................... 8
2.1.1.3 InfoProvider .................................................................................................. 8
2.1.1.4
Operational Data Store (ODS) ...................................................................... 9
2.1.1.5 Administrator Workbench (AWB) ............................................................... 9
2.1.2
Business Intelligence: Architecture .................................................................... 10
2.2 Business Intelligence: Reporting ............................................................................... 11
2.2.1
Business Intelligence: Choose SAP BEx query ................................................ 12
2.2.2 Business Intelligence: Create query ................................................................... 13
2.2.3
Business Intelligence: Query Designer – new query ......................................... 14
2.2.4
Business Intelligence: Filtering data in the query definition .............................. 15
2.2.5 Business Intelligence – Including text elements into BEx analyzer reports ...... 16
2.2.6
Business Intelligence: Search for a query .......................................................... 17
2.2.7
Business Intelligence: Web query ...................................................................... 18 3
Theory – ERP Analytics: Strategic Enterprise Management ........................................... 19
3.1 SEM and value-based management ........................................................................... 20
3.2 SEM-BW integration ................................................................................................. 21
3.3
SEM-CPM – Corporate Performance Monitor .......................................................... 22
3.4 Strategy Management ................................................................................................ 23
3.5
Management Cockpit ................................................................................................. 25
3.5.1 Wall overview .................................................................................................... 26
3.5.2
Logical view ....................................................................................................... 26
3.6 SEM-BCS – Legal and management consolidation .................................................. 28
3.7
SAP SEM Business Planning .................................................................................... 29
3.8
Integrated enterprise planning ................................................................................... 30
3.9
Influence of stakeholder groups on companies ......................................................... 31
4
Reflections – Business Intelligence .................................................................................. 32
4.1 Questions ................................................................................................................... 32
4.2
Standard solution – Business Intelligence ................................................................. 33
5 Reflections – Strategic Enterprise Management .............................................................. 34
5.1
Questions ................................................................................................................... 34
5.2 Standard solution ....................................................................................................... 35

8/20/2019 Part12 - Bi Sem
http://slidepdf.com/reader/full/part12-bi-sem 3/35
Integrated business processes with SAP ERP
page 3
Copyright Prof. Dr. Heimo H. Adelsberger/Dipl.-Wirt.-Inf. Pouyan Khatami/
Dipl.-Wirt.-Inf. Taymaz Khatami
Table of figuresFigure 1: Business Intelligence: Information Warehouse .......................................................... 7
Figure 2: Business Intelligence - InfoObjects ............................................................................ 7
Figure 3: Business Intelligence - InfoCube ................................................................................ 8
Figure 4: Business Intelligence – InfoProvider .......................................................................... 9
Figure 5: Business Intelligence - Architecture ......................................................................... 10
Figure 6: Business Intelligence - Reporting ............................................................................. 12
Figure 7: Business Intelligence: Choose SAP BEx query ....................................................... 13
Figure 8: Business Intelligence: Create query .......................................................................... 14
Figure 9: Business Intelligence: Query Designer – new query ................................................ 15
Figure 10: Business Intelligence: Filtering data in the query definition .................................. 16
Figure 11: Business Intelligence – Including text elements into BEx analyzer reports ........... 17
Figure 12: Business Intelligence: Search for a query ............................................................... 18
Figure 13: Business Intelligence: Web Query .......................................................................... 18
Figure 14: Strategic Enterprise Management ........................................................................... 19
Figure 15: SEM and value-based management ........................................................................ 20
Figure 16: SEM-BW integration .............................................................................................. 21
Figure 17: SEM-CPM – Corporate Performance Monitor ....................................................... 22
Figure 18: Strategy Management ............................................................................................. 23
Figure 19: Balanced Scorecard................................................................................................. 24
Figure 20: Management Cockpit .............................................................................................. 25
Figure 21: Wall overview ......................................................................................................... 26
Figure 22: Logical view profitability ....................................................................................... 27
Figure 23: SEM-BCS – Legal and management consolidation ............................................... 28
Figure 24: SAP SEM Business Planning ................................................................................. 29
Figure 25: Integrated enterprise planning ................................................................................ 30 Figure 26: Influence of stakeholder groups on companies....................................................... 31
8/20/2019 Part12 - Bi Sem
http://slidepdf.com/reader/full/part12-bi-sem 4/35
Integrated business processes with SAP ERP
page 4
Copyright Prof. Dr. Heimo H. Adelsberger/Dipl.-Wirt.-Inf. Pouyan Khatami/
Dipl.-Wirt.-Inf. Taymaz Khatami
Copyright
This document is mostly based on publications for the TERP10 course “mySAP ERP –
integrated business processes“– those parts are subject to the copyright of SAP AG.
All figures used within this course are created in the style of TERP10, if not labeled
else wise. Those parts are subject to the copyright of SAP AG. All screenshots used within this document, even if displayed in extracts, are subject to
the copyright of SAP AG.
Special thanks to Dipl.-Wirt.-Inf. Taymaz Khatami for his efforts preparing this course
– he managed to align the TERP10 course material with our pedagogic approach in
order to allow course participants to gain a profound knowledge of complex issues,
i.e. to allow for the development of competences in the area of enterprise resource
planning
Distri bution and reproduction of th is document or parts of th is document i n any
form is prohibited without the written permission of Prof. Dr. Heimo H.
Adelsberger , Dipl.-Wi r t.-Inf . Pouyan Khatami, and Dipl.-Wir t.-Inf . Taymaz
Khatami .

8/20/2019 Part12 - Bi Sem
http://slidepdf.com/reader/full/part12-bi-sem 5/35
Integrated business processes with SAP ERP
page 5
Copyright Prof. Dr. Heimo H. Adelsberger/Dipl.-Wirt.-Inf. Pouyan Khatami/
Dipl.-Wirt.-Inf. Taymaz Khatami
1 Introduction: Business Intelligence & Strategic
Enterprise Management in SAP ERP
1.1 Unit objectives “Business Intelligence & Strategic Enterprise
Management in SAP ERP“
This unit aims at giving you an understanding of the solutions Business Intelligence (BI) and
Strategic Enterprise Management (SEM) in SAP.
At the conclusion of this unit, you will be able to:
- explain the basic principles and the architecture of SAP Business Intelligence
-
explain, how reporting and analysis tools in SAP Business Intelligence support
different business processes-
explain the components of SEM including their most important functions
- explain the positioning of SEM and data usage for analyses
1.2 Scenario
Note:
In this unit, you will exclusively deal with theory regarding Business Intelligence and
Strategic Enterprise Management. If you are interested in these topics and their application,
you can enroll into the courses “Introduction in SAP BI ” & “SAP BI – Advanced Business
Intelligence” (this semester both courses available in German only) that deals with detailed
content regarding SAP BI. To this course and the subsequent exam however, only the
theoretical content of this chapter is relevant.

8/20/2019 Part12 - Bi Sem
http://slidepdf.com/reader/full/part12-bi-sem 6/35
Integrated business processes with SAP ERP
page 6
Copyright Prof. Dr. Heimo H. Adelsberger/Dipl.-Wirt.-Inf. Pouyan Khatami/
Dipl.-Wirt.-Inf. Taymaz Khatami
2 Theory – Business Intelligence
2.1 Business Intelligence: Information WarehouseSAP BW (Business Information Warehouse) is a software product of SAP AG. SAP BW is a
data warehouse solution, which allows for analyzing data from operative SAP ERP
applications and any other business applications. Moreover, it allows for extracting and
analyzing data from external sources such as databases, online services, and the internet.
The system (data storage, loading and reporting) that is preconfigured by business content for
core areas and processes, assures multiple views on company-wide relationships.
Introducing SAP BW aims at:
- providing a data warehouse system with optimized data structures for reporting and
analysis ,- a separate system so that operative systems (SAP ERP) are not loaded
- providing an OLAP (online analytical processing) engine and OLAP functions,
- providing an encompassing data warehouse architecture,
- automatically management of the data warehouse, and
- pre-configuration according to global business know-how of SAP.
To reach these goals, SAP AG developed a separate data warehouse solution that handles
reporting operating as autonomous business components and that provides a separate server
with autonomous database and SAP system. The corresponding product is called SAP
Business Information Warehouse .All mentioned requirements and goals were fulfilled in the conception and architecture of
SAP BW. Implementing SAP BW and its metadata repository (data description) gives the
customer the enormous advantage of being able to profit from comprehensive business know-
how and the many years of experience of SAP in the area of business software solutions. SAP
R/3-Systeme and SAP ERP systems can be configured as source system, providing data for
the entire SAP business content.
Note: In this script, we use the terms Business Intell igence and Business (I nformation)
Warehouse synonymously. This is done according to the SAP guidelines from the SAP
documents, since only their content is relevant to the exam. Business Intelligence (or after
taking over the French company Business Objects also referred to as Business Objects ), isthe successor of Business Warehouse. Correspondingly, this is not the same product.
However, both SAP products are data warehouse solutions of SAP AG.

8/20/2019 Part12 - Bi Sem
http://slidepdf.com/reader/full/part12-bi-sem 7/35
Integrated business processes with SAP ERP
page 7
Copyright Prof. Dr. Heimo H. Adelsberger/Dipl.-Wirt.-Inf. Pouyan Khatami/
Dipl.-Wirt.-Inf. Taymaz Khatami
Figure 1: Business Intelligence: Information Warehouse
2.1.1 Business Intelligence: Terminology
2.1.1.1 InfoObject
InfoObjects are business-related analysis objects (companies, sales volumes, etc.) in SAP BW
and they can be structured in characteristics and key figures. In turn, characteristics can be
subdivided into units, time characteristics, and technical characteristics (e.g., request ID). Key
figures include all data fields containing values and quantities (sales volumes, net sales, costs,etc.). Characteristics define the affiliation of key figures.
Figure 2: Business Intelligence - InfoObjects

8/20/2019 Part12 - Bi Sem
http://slidepdf.com/reader/full/part12-bi-sem 8/35
Integrated business processes with SAP ERP
page 8
Copyright Prof. Dr. Heimo H. Adelsberger/Dipl.-Wirt.-Inf. Pouyan Khatami/
Dipl.-Wirt.-Inf. Taymaz Khatami
2.1.1.2 InfoCube
InfoCubes are the central data containers forming the basis for reports and analyses in
SAP BW. They contain key figures (sales volumes, incoming orders, actual costs, etc.) and a
link with characteristics (master data in SAP BW, such as cost centers, customers, material,
etc.). Key figures and characteristics are InfoObjects . Each InfoCube should contain a
separate data set since queries primarily refer to one InfoCube.Master data in the BW system consist of attributes (e.g., the person in charge of a cost
center), as well as hierarchies and texts of a characteristic.
An InfoCube consist of several database tables that are correspondingly related according to
the star schema. This includes a fact table with the key figures of the InfoCube as well as
several dimension tables containing links to the characteristics.
- each InfoCube has a fact table and a maximum of 16 dimension tables
-
each fact table can contain a maximum of 233 key figures
-
a dimension can contain a maximum of 248 freely available characteristics
InfoCubes are stored in structures in SAP BW. For saving InfoCubes, you can use existingfolders or you can create new ones. This is quite similar to data storage on your PC. In SAP
BW, these folders are called InfoAreas.
Figure 3: Business Intelligence - InfoCube
2.1.1.3 InfoProvider
InfoProvider is the super-ordinate term for an object that can be used for creating reports in
the Business Explorer (BEx). InfoProvider are report-relevant objects or views and contain
different database meta-objects, which provide data for query definition. The type of data
provision depends of the used InfoProvider; however, this does not affect reporting.
InfoProvider provide data that can be analyzed using queries.
8/20/2019 Part12 - Bi Sem
http://slidepdf.com/reader/full/part12-bi-sem 9/35
Integrated business processes with SAP ERP
page 9
Copyright Prof. Dr. Heimo H. Adelsberger/Dipl.-Wirt.-Inf. Pouyan Khatami/
Dipl.-Wirt.-Inf. Taymaz Khatami
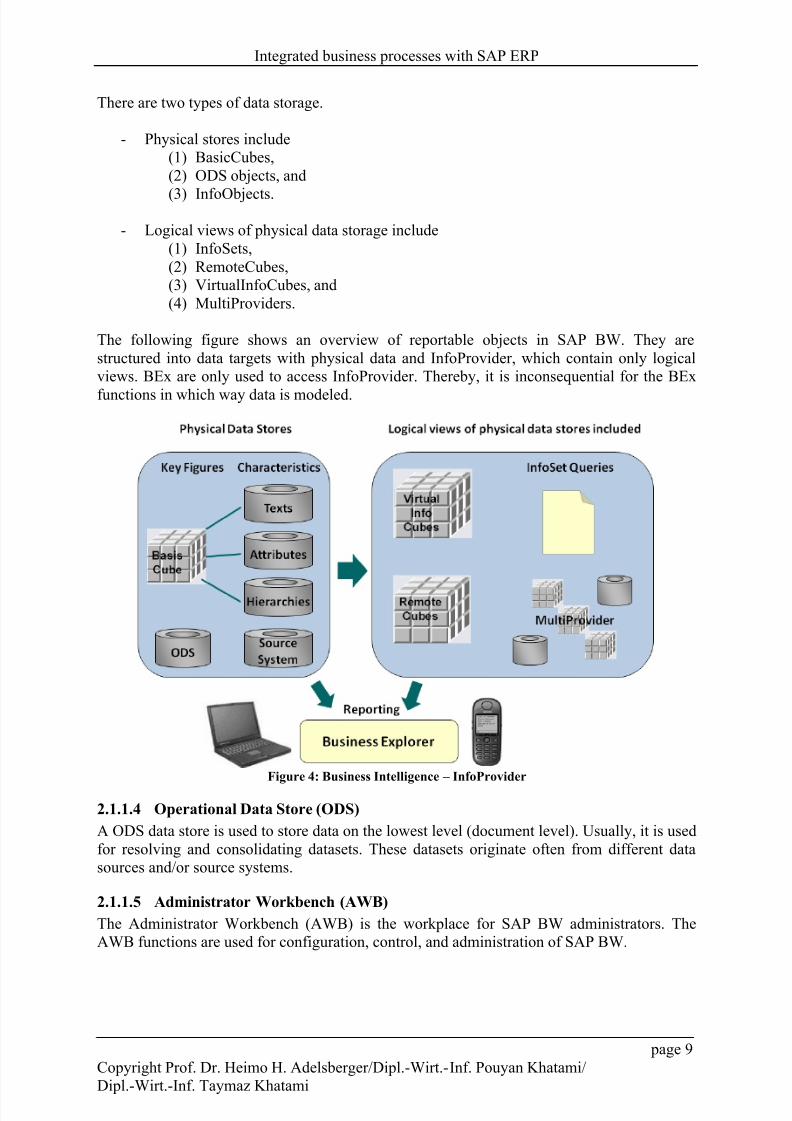
There are two types of data storage.
- Physical stores include
(1)
BasicCubes,
(2) ODS objects, and
(3)
InfoObjects.
-
Logical views of physical data storage include
(1) InfoSets,
(2) RemoteCubes,
(3) VirtualInfoCubes, and
(4) MultiProviders.
The following figure shows an overview of reportable objects in SAP BW. They are
structured into data targets with physical data and InfoProvider, which contain only logical
views. BEx are only used to access InfoProvider. Thereby, it is inconsequential for the BEx
functions in which way data is modeled.
Figure 4: Business Intelligence – InfoProvider
2.1.1.4 Operational Data Store (ODS)
A ODS data store is used to store data on the lowest level (document level). Usually, it is used
for resolving and consolidating datasets. These datasets originate often from different data
sources and/or source systems.
2.1.1.5 Administrator Workbench (AWB)
The Administrator Workbench (AWB) is the workplace for SAP BW administrators. The
AWB functions are used for configuration, control, and administration of SAP BW.

8/20/2019 Part12 - Bi Sem
http://slidepdf.com/reader/full/part12-bi-sem 10/35
Integrated business processes with SAP ERP
page 10
Copyright Prof. Dr. Heimo H. Adelsberger/Dipl.-Wirt.-Inf. Pouyan Khatami/
Dipl.-Wirt.-Inf. Taymaz Khatami
2.1.2 Business Intelligence: Architecture
SAP BW aims at analyzing business data. Thereby, you can access operative SAP
applications (SAP ERP) as well as all other business applications and external data sources
such as databases, online services, and the internet.
Using the AWB functions (administrator workbench), you can control, monitor, andadminister all processes of data procurement.
SAP BW features an online analytical processing (OLAP) engine for staging information
from large amounts of operative and historical data. The OLAP technology allows for multi-
dimensional analyses according to different business aspects.
The BW server is pre-configured by business contents for core areas and processes and thus
assures numerous views on company-wide relations. Business contents provide targeted
information for companies, structured according to roles, helping employees to process their
tasks. Along with roles, business content contains other pre-configured objects such as
InfoCubes, queries, key figures, and characteristics. These objects facilitate the
implementation of SAP BW.
The Business Explorer (BEx) component provides you with comprehensive analysis options.
Figure 5: Business Intelligence - Architecture

8/20/2019 Part12 - Bi Sem
http://slidepdf.com/reader/full/part12-bi-sem 11/35
Integrated business processes with SAP ERP
page 11
Copyright Prof. Dr. Heimo H. Adelsberger/Dipl.-Wirt.-Inf. Pouyan Khatami/
Dipl.-Wirt.-Inf. Taymaz Khatami
2.2 Business Intelligence: Reporting
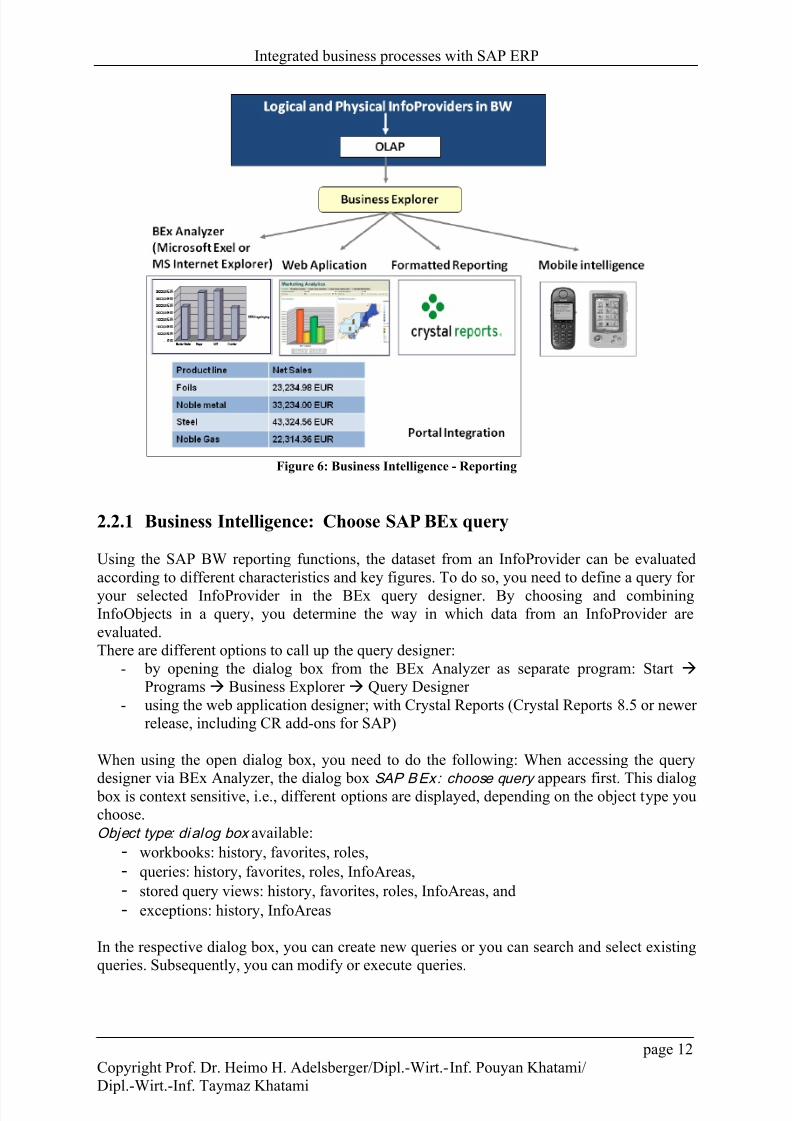
The SAP BW component Business Explorer (BEx) provides flexible reporting and analyses
tools to execute strategic analyses and to support decision-making processes in a company.
Employees with corresponding authorization can analyze historical and current data atdifferent detail levels considering different perspectives.
BEx allows access to information in SAP BW for a wide user range. Access is carried out via
the enterprise portal using an iView. iViews can be used alongside applications for data
extraction via internet or intranet (web application design), or can be called up using a mobile
device (such as WAP-enabled mobile telephones or PDAs).
The web application design enables the implementation of generic OLAP navigation
functions in web applications and in business intelligence cockpits. Thus, simple and highly
individual scenarios are created. Using standard languages such as HTML you can, for
example, create individual scenarios with user-defined GUI-elements. Web application design
includes a wide spectrum of interactive, web-based business intelligence scenarios that can be
adjusted to your requirements using standard web technology.
Portal Integration contains
-
a single point of entry,
-
role-based staging of information,
- personalization,
-
publication of iViews, and
- integration of unstructured data.
Query, reporting, and analysis include
- query design with BEx Analyzer,
- multi-dimensional analyses (OLAP),
- geographical analyses,
- ad-hoc-reports, and
- alerts.
Web application design contains
- interactive analytical content,
- information cockpits and dashboards,
- the basis for creating analytical reports,
- the creation of iViews for a portal, and
- an assistant as a help-tool.
8/20/2019 Part12 - Bi Sem
http://slidepdf.com/reader/full/part12-bi-sem 12/35
Integrated business processes with SAP ERP
page 12
Copyright Prof. Dr. Heimo H. Adelsberger/Dipl.-Wirt.-Inf. Pouyan Khatami/
Dipl.-Wirt.-Inf. Taymaz Khatami
Figure 6: Business Intelligence - Reporting
2.2.1 Business Intelligence: Choose SAP BEx query
Using the SAP BW reporting functions, the dataset from an InfoProvider can be evaluated
according to different characteristics and key figures. To do so, you need to define a query for
your selected InfoProvider in the BEx query designer. By choosing and combining
InfoObjects in a query, you determine the way in which data from an InfoProvider are
evaluated.
There are different options to call up the query designer:
- by opening the dialog box from the BEx Analyzer as separate program: Start
Programs Business Explorer Query Designer
- using the web application designer; with Crystal Reports (Crystal Reports 8.5 or newer
release, including CR add-ons for SAP)
When using the open dialog box, you need to do the following: When accessing the query
designer via BEx Analyzer, the dialog box SAP BEx: choose query appears first. This dialog box is context sensitive, i.e., different options are displayed, depending on the object type you
choose.
Object type: dialog box available:
- workbooks: history, favorites, roles,
- queries: history, favorites, roles, InfoAreas,
- stored query views: history, favorites, roles, InfoAreas, and
- exceptions: history, InfoAreas
In the respective dialog box, you can create new queries or you can search and select existing
queries. Subsequently, you can modify or execute queries.

8/20/2019 Part12 - Bi Sem
http://slidepdf.com/reader/full/part12-bi-sem 13/35
Integrated business processes with SAP ERP
page 13
Copyright Prof. Dr. Heimo H. Adelsberger/Dipl.-Wirt.-Inf. Pouyan Khatami/
Dipl.-Wirt.-Inf. Taymaz Khatami
Figure 7: Business Intelligence: Choose SAP BEx query
2.2.2 Business Intelligence: Create query
To define a new query, start the query designer and choose the option new query .
Subsequently, the required InfoProvider is chosen from the dialog box new query:
InfoProvider . The SAP BW system displays subsequently the screen shown in the figure.
The query designer is structured into six subareas:
1. Directory tree of the selected InfoProvider – After selecting the required
InfoProvider, all available objects (dimensions, key figures, and structures) are
displayed in the directory tree on the left hand side of the query designer. In the
example shown below, you can see the directory tree for the InfoProvider InfoCube
Customer Cube T_SDDEMO2.
2. Columns – In this area, columns concerning the report to be generated are created.
3. Rows – In these areas, the rows for the report to be generated are created.
4. Free characteristics – The characteristics that are not displayed in the initial view of
the results when executing the query in the BEx analyzer or on the web are transferred
to the free characteristics area. Subsequently, these characteristics can be integratedinto the results over several navigation steps. The free characteristics are used to select
filter values in the report.
5. Filter – The characteristics in this subarea are displayed neither in the drilldown nor
as free characteristics in the query analysis. These characteristics are merely used as
global filter for the InfoCube data. You have the option to use a key figure as filter
(also in combination with characteristics).
6. Preview (highlighted grey in the following figure) – In this area, a preview of the
query results is displayed. To create a query, the InfoProvider directories can be
expanded or collapsed using the plus or minus symbols. By expanding, for example,
the node “key figures”, you branch into the list of all key figures in the InfoProvider.

8/20/2019 Part12 - Bi Sem
http://slidepdf.com/reader/full/part12-bi-sem 14/35
Integrated business processes with SAP ERP
page 14
Copyright Prof. Dr. Heimo H. Adelsberger/Dipl.-Wirt.-Inf. Pouyan Khatami/
Dipl.-Wirt.-Inf. Taymaz Khatami
Figure 8: Business Intelligence: Create query
2.2.3 Business Intelligence: Query Designer – new query
Using drag & drop the selected objects must subsequently be dragged of the InfoProvider to
the relevant subarea (e.g. rows, columns, or free characteristics) on the right hand area of the
screen.

8/20/2019 Part12 - Bi Sem
http://slidepdf.com/reader/full/part12-bi-sem 15/35
Integrated business processes with SAP ERP
page 15
Copyright Prof. Dr. Heimo H. Adelsberger/Dipl.-Wirt.-Inf. Pouyan Khatami/
Dipl.-Wirt.-Inf. Taymaz Khatami
Figure 9: Business Intelligence: Query Designer – new query
2.2.4 Business Intelligence: Filtering data in the query definition
The following figure shows the selection screen for the material characteristics. Quite often,
you have to filter characteristics according to particular values in a report. For example, if you
are interested in the sales volume of a particular division of a global group, but the
InfoProvider contains only the sales volumes for the entire company, you can limit the query
definition to a particular division. Thus, the report contains only the key figures for the
desired division. Characteristic values of a characteristic can be filtered according to rows,
columns, user-defined characteristics, and filters by the QueryDesigner.
There are two options to limit characteristics:
1. A characteristic is selected from the InfoProvider (the tree structure on the left hand
side). Subsequently, you call up the selection menu for fixed values by double-
clicking values . You can select individual values or value ranges. The selected fixed
values are displayed in the directory under values. You can add them to a query
definition by drag & drop.
2.
Characteristics that were already included into the definition can also be limited. Todo so, call up the context menu and choose restrict. Thus, you see the dialog screen
selection for .
On the left screen area, all characteristic values available for the selected characteristic are
displayed. The right screen area contains the characteristic values that can be used for filtering
the characteristic. You select a characteristic value on the left screen by highlighting it. You
can select one or several characteristic values. Using the entry field on the bottom left screen
area, you can enter the description or the technical name to find particular characteristic
values. The found values are then automatically selected. After that, use drag & drop to copy
the values to the right area of the screen. You can also use the arrow to do so. To remove the
restriction, execute the described procedure the other way around.

8/20/2019 Part12 - Bi Sem
http://slidepdf.com/reader/full/part12-bi-sem 16/35
Integrated business processes with SAP ERP
page 16
Copyright Prof. Dr. Heimo H. Adelsberger/Dipl.-Wirt.-Inf. Pouyan Khatami/
Dipl.-Wirt.-Inf. Taymaz Khatami
Figure 10: Business Intelligence: Filtering data in the query definition
2.2.5 Business Intelligence: Including text elements into BEx analyzer
reports
The SAP BW system allows you to include different text elements with additional
information in a query (e.g., author, date of last change, InfoProvider, etc.). These text
elements are also referred to as header data of the query.To display text elements, choose Layout and then display text elements. You can either
display all or individual text elements (general, filter, variables). The text elements are
displayed between the filter cells and the results area. Using the menu functions in Microsoft
Excel, you can move or delete corresponding cells to move or delete text elements.
Explanation of text elements:
- Author: user who defined the query.
- Last changed: user who last changed the query definition. Navigation steps are not
displayed as changed to the definition. .
- InfoProvider: InfoProvider whose data is evaluated in the query.
- Query, technical name: the technical name that was entered when the query was saved.
- Key date: the date for which the time-dependent master data is selected. The key dateis either determined in the query definition (under query properties) or can be entered
by the value of a variable. If no key date is set, the system date is used instead.
- Changed at: date and time of the last change to the query definition.
- Status of data: time at which the data from the last request was copied to the
InfoProvider. This can be evaluated in reporting.
Note: For MultiProviders, current InfoPackages are determined from individual
BasicCubes. Thereby, the one with the oldest date is referred to the status of the data.
- Current user: the user that currently opened the query or who inserted it into a
workbook.
- Last refreshed: date and time of the last update of query data. This update is carriedout when displaying text elements (the system must update queried to be able to
display text elements).

8/20/2019 Part12 - Bi Sem
http://slidepdf.com/reader/full/part12-bi-sem 17/35
Integrated business processes with SAP ERP
page 17
Copyright Prof. Dr. Heimo H. Adelsberger/Dipl.-Wirt.-Inf. Pouyan Khatami/
Dipl.-Wirt.-Inf. Taymaz Khatami
- Depending on the current query definition, these text elements (variables, filter values,
and exceptions) can be displayed additionally.
Figure 11: Business Intelligence – Including text elements into BEx analyzer reports
2.2.6 Business Intelligence: Search for a query
Looking for a query for which you know a part of the description or other information can be
carried out using the f ind function. On the search for queri es screen, you have to enter the
technical name or the description of the query. If required, you can limit your search
according to additional criteria. After that, choose f ind .
When working with the BEx Analyzer and after calling up the dialog box choose query , you
receive the result in form of an analyzer report. When using the search function in the query
designer, the query definition is displayed.

8/20/2019 Part12 - Bi Sem
http://slidepdf.com/reader/full/part12-bi-sem 18/35
Integrated business processes with SAP ERP
page 18
Copyright Prof. Dr. Heimo H. Adelsberger/Dipl.-Wirt.-Inf. Pouyan Khatami/
Dipl.-Wirt.-Inf. Taymaz Khatami
Figure 12: Business Intelligence: Search for a query
2.2.7 Business Intelligence: Web query
To publish a query on the web, you have to save it and then choose query on the web. The
query is displayed in a standard web template. If required, the standard template can be
modified.
Figure 13: Business Intelligence: Web Query

8/20/2019 Part12 - Bi Sem
http://slidepdf.com/reader/full/part12-bi-sem 19/35
Integrated business processes with SAP ERP
page 19
Copyright Prof. Dr. Heimo H. Adelsberger/Dipl.-Wirt.-Inf. Pouyan Khatami/
Dipl.-Wirt.-Inf. Taymaz Khatami
3 Theory – ERP Analytics: Strategic Enterprise
ManagementStrategic management including the balances scorecard is an instrument to convert business
strategies into comprehendible, meaningful goals. Individual targets are assigned to a perspective or view. The standard scorecard contains 4 views:
- financial,
- customer,
- internal processes, and
- learning & growth.
Performance measurement and other created visual information units allow the management
to grasp complex situations at a glance and to decide more quickly. The management cockpit
in its traditional form features 4 walls, one for each view of a company.
Business consolidations take care of settling interdependent accounting entries and allows for
integration planned and operating results with consolidation of investments.
Business Planning (BPS) allows for an integrative operative and strategic planning on
application level using data from a specified InfoCube for each planning area.
Stakeholder Relationship Management (SRM) allows for data management and
documentation of different business partners and for the option to execute corresponding
queries.
Business Document Service (BDS) represents general and easy to integrate document
management functionalities for different SAP applications.
Figure 14: Strategic Enterprise Management
8/20/2019 Part12 - Bi Sem
http://slidepdf.com/reader/full/part12-bi-sem 20/35
Integrated business processes with SAP ERP
page 20
Copyright Prof. Dr. Heimo H. Adelsberger/Dipl.-Wirt.-Inf. Pouyan Khatami/
Dipl.-Wirt.-Inf. Taymaz Khatami
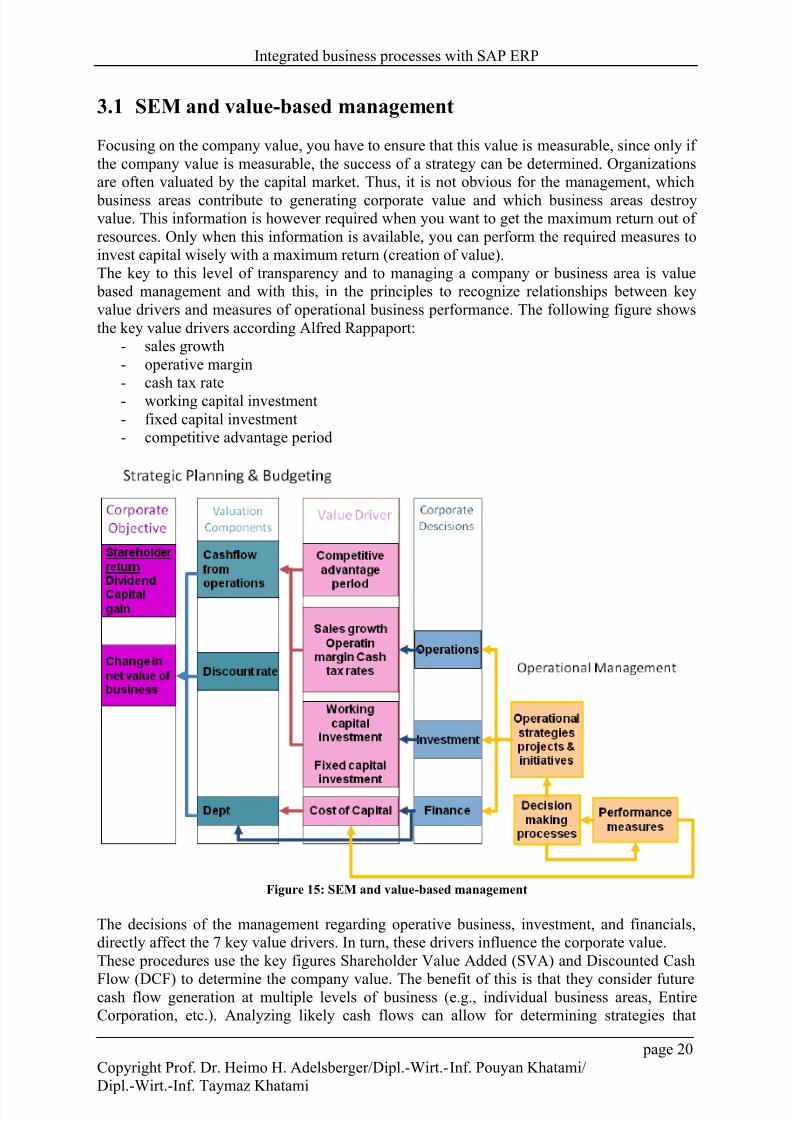
3.1 SEM and value-based management
Focusing on the company value, you have to ensure that this value is measurable, since only if
the company value is measurable, the success of a strategy can be determined. Organizations
are often valuated by the capital market. Thus, it is not obvious for the management, which
business areas contribute to generating corporate value and which business areas destroyvalue. This information is however required when you want to get the maximum return out of
resources. Only when this information is available, you can perform the required measures to
invest capital wisely with a maximum return (creation of value).
The key to this level of transparency and to managing a company or business area is value
based management and with this, in the principles to recognize relationships between key
value drivers and measures of operational business performance. The following figure shows
the key value drivers according Alfred Rappaport:
- sales growth
- operative margin
-
cash tax rate
-
working capital investment
- fixed capital investment
- competitive advantage period
Figure 15: SEM and value-based management
The decisions of the management regarding operative business, investment, and financials,
directly affect the 7 key value drivers. In turn, these drivers influence the corporate value.
These procedures use the key figures Shareholder Value Added (SVA) and Discounted Cash
Flow (DCF) to determine the company value. The benefit of this is that they consider futurecash flow generation at multiple levels of business (e.g., individual business areas, Entire
Corporation, etc.). Analyzing likely cash flows can allow for determining strategies that

8/20/2019 Part12 - Bi Sem
http://slidepdf.com/reader/full/part12-bi-sem 21/35
Integrated business processes with SAP ERP
page 21
Copyright Prof. Dr. Heimo H. Adelsberger/Dipl.-Wirt.-Inf. Pouyan Khatami/
Dipl.-Wirt.-Inf. Taymaz Khatami
generate and acceptable rate of return and thus provide additional value to shareholders. This
valuation method is also useful because it is increasingly used by financial markets as
important method to determine future value potentials of a company.
3.2 SEM-BW integration
The following figure represents the link of the SEM component with the BW. Please note that
all components use the same data base. Thus, data consistency and data actuality are ensured,
regardless of the location from which data are accessed.
For example, managers often access balanced scorecards for their monthly reports since the
balanced scorecard focuses only of the most important key figures. Subsequently, you can
navigate to the BW database to further evaluate data in more detail. After that, a manager can
decide to perform a rolling forecast or to enter new data in the BW. Both tasks can be carried
out with the link from the balanced scorecard to the BPS. In the BPS, you can execute
forecasts or enter new data. After saving, the data are immediately available for reports in the
balanced scorecard. This procedure is subject to the buffering policy.
Another example of the link of the components is that the stakeholder can call up important
reporting information or balanced scorecards or from the cockpit using a special web tool and
SRM.
You can also use the system to return data to SAP ERP, e.g., planning data of the BPS.
Alternatively, data can be transferred from BPS to BCS to consolidate the plan and to return it
to the BW.
This integration between the SEM components and the BW and other SAP tools via the BW
(Portals, ERP, APO, CRM etc.) is a major benefit of SEM.
Figure 16: SEM-BW integration

8/20/2019 Part12 - Bi Sem
http://slidepdf.com/reader/full/part12-bi-sem 22/35
Integrated business processes with SAP ERP
page 22
Copyright Prof. Dr. Heimo H. Adelsberger/Dipl.-Wirt.-Inf. Pouyan Khatami/
Dipl.-Wirt.-Inf. Taymaz Khatami
3.3 SEM-CPM – Corporate Performance Monitor
The InfoCubes in the SEM database are part of OLAP structures of the SAP Business
Information Warehouse. This can be the SEM system instance itself, or a remote SAP BW
that stores additional data in the SEM database.
The Balanced Scorecard is a management tool for modeling and applying strategies. Applyingstrategies can be measured by linking them to the corresponding Key Performance Indicators
(KPIs).
Risk Management is the representation and valuation of strategic risks in the context of the
scorecard function. Value Driver Trees allow for the visualization and simulation of value
creation relationships, independent of strategy.
The Management Cockpit is an ergonomic concept for the representation of Key Performance
Indicators (KPI). The Measure Builder is a tool for creating a central key figure database
containing standardized business descriptions of key figures.
You are already familiar with the Business Explorer. The Business Explorer allows for a
multi-dimensional analysis of BEx reports and can be linked with SEM-CPM so that it can be
used from there directly.
Figure 17: SEM-CPM – Corporate Performance Monitor

8/20/2019 Part12 - Bi Sem
http://slidepdf.com/reader/full/part12-bi-sem 23/35
Integrated business processes with SAP ERP
page 23
Copyright Prof. Dr. Heimo H. Adelsberger/Dipl.-Wirt.-Inf. Pouyan Khatami/
Dipl.-Wirt.-Inf. Taymaz Khatami
3.4 Strategy Management
The Balanced Scorecard is a tool to transfer business strategies into understandable,
communicable, and meaningful goals. It is a collection of financial and non-financial aspects
of the business. The individual objectives are assigned to perspectives, e.g., financials,customer, internal business processes, and learning and growth.
The Balanced Scorecard contains the four mentioned perspectives:
- financials: strategy for growth and profitability from a shareholder point of view
-
customer: strategy for creating value and differentiation from a customer point of view
- internal business processes: priorities for excellent performance in different business
processes to increase customer and shareholder satisfaction
- learning and growth: measures to generate a climate supporting changes, innovation,
and growth within a company
Figure 18: Strategy Management
The four described views represent the standard perspectives of the balanced scorecard. These
perspectives are presented in the context of their main focus. Each perspective contains
strategic goals with assigned activities and strategic initiatives.

8/20/2019 Part12 - Bi Sem
http://slidepdf.com/reader/full/part12-bi-sem 24/35
Integrated business processes with SAP ERP
page 24
Copyright Prof. Dr. Heimo H. Adelsberger/Dipl.-Wirt.-Inf. Pouyan Khatami/
Dipl.-Wirt.-Inf. Taymaz Khatami
Figure 19: Balanced Scorecard

8/20/2019 Part12 - Bi Sem
http://slidepdf.com/reader/full/part12-bi-sem 25/35
Integrated business processes with SAP ERP
page 25
Copyright Prof. Dr. Heimo H. Adelsberger/Dipl.-Wirt.-Inf. Pouyan Khatami/
Dipl.-Wirt.-Inf. Taymaz Khatami
3.5 Management Cockpit
The visual information units of the management cockpit allow the management to understand
complex situations at a glance. Thus, management decision processes are facilitated and
accelerated.In correspondence to the classic balanced scorecard concept, the management cockpit room
features four walls:
- the black wall contains financial key figures and critical success factors
- the red wall contains markets, customers, and competitors
-
the blue wall shows internal processes
- the white wall is used to monitor strategic processes
The virtual management cockpit room in SAP-CPM can contain up to nine walls. Each wall
reflects predefined goals for the area and key figures to measure them. The key figures can be
combined freely from accounting, logistics, or human resources data.
The management cockpit in SEM-CPM uses many different informative graphics. These
graphics provide an easy navigation and a well thought out structure for displaying visual
information. The management cockpit in SEM-CPM is entirely compatible with leading web
browsers and can thus be called up from the web.
Figure 20: Management Cockpit

8/20/2019 Part12 - Bi Sem
http://slidepdf.com/reader/full/part12-bi-sem 26/35
Integrated business processes with SAP ERP
page 26
Copyright Prof. Dr. Heimo H. Adelsberger/Dipl.-Wirt.-Inf. Pouyan Khatami/
Dipl.-Wirt.-Inf. Taymaz Khatami
3.5.1 Wall overview
The wall element is subordinate to the cockpit element. A presentation can contain up to nine
wall elements and summarizes data in a particular manner.
By clicking a wall, a logical view, or a frame you can open a new screen displaying the
presentation object. In case of the logical view, a window is displayed containing the selectedview with the corresponding frames. The current data are obtained at the time of presentation
from the data source (BW system, query, cube, key figure) determined for each frame when
the cockpit was created.
Figure 21: Wall overview
3.5.2 Logical view
The logical view element is subordinate to the wall element. A wall element consists of up tosix logical views. Logical views are used to summarize information in a particular manner.
A logical view is created to focus on an area presented in a wall in more detail, for example,
internal view. Simultaneously, a logical view can be used to define general business factors
(e.g., product quality) resulting from several key figures (e.g., scrap rate, sales returns,
guarantees).
The following figure shows possible logical views for profitability.

8/20/2019 Part12 - Bi Sem
http://slidepdf.com/reader/full/part12-bi-sem 27/35
Integrated business processes with SAP ERP
page 27
Copyright Prof. Dr. Heimo H. Adelsberger/Dipl.-Wirt.-Inf. Pouyan Khatami/
Dipl.-Wirt.-Inf. Taymaz Khatami
Figure 22: Logical view profitability

8/20/2019 Part12 - Bi Sem
http://slidepdf.com/reader/full/part12-bi-sem 28/35
Integrated business processes with SAP ERP
page 28
Copyright Prof. Dr. Heimo H. Adelsberger/Dipl.-Wirt.-Inf. Pouyan Khatami/
Dipl.-Wirt.-Inf. Taymaz Khatami
3.6 SEM-BCS – Legal and management consolidation
The smallest unit used as basis of consolidation in a corporate structure is the consolidation
unit. In the consolidation tool in SAP ERP (EC-CS), the unit for management reporting is a
combination of companies and profit centers or business areas. The consolidation unit of legalconsolidation is the company. The two units are structured into different views. Accordingly,
subsidiaries receive two data records: one for the legal unit and one for the management
entity. In each period, adjustments must be made between the two views accordingly.
With consolidation on the basis of BW, you have the matrix consolidation option. Thus means
that two consolidation units can be processed in one data record. To use two entities as
consolidation units, two InfoObjects must be assigned to the consolidation unit role in the
BCS database. In thus business scenario, the subsidiaries are obliged to unify values before
data is transferred to SEM-BCS. Each data record in the entire consolidation process contains
two consolidation units.
You have also the option to retain the dual accounting approach, i.e., to process legal and
management entities in two records. This would be the same architecture as in the ECC-based
EC-CS. Thus, it is up to you with which architecture you set up your SEM-BCS.
Figure 23: SEM-BCS – Legal and management consolidation

8/20/2019 Part12 - Bi Sem
http://slidepdf.com/reader/full/part12-bi-sem 29/35
Integrated business processes with SAP ERP
page 29
Copyright Prof. Dr. Heimo H. Adelsberger/Dipl.-Wirt.-Inf. Pouyan Khatami/
Dipl.-Wirt.-Inf. Taymaz Khatami
3.7 SAP SEM Business Planning
The intention is not to replace other SAP planning systems with SEM business planning.
SEM is merely an addition with special tools, such as planning in the operational area of the
SAP system.
SEM could for example be used in a supply chain for modeling strategy and measuring theoverall success of a sales and production plan regarding increased customer satisfaction,
increased shareholder value, reduced inventories, increased efficiency of cycle times, and
maximized return on assets. Detailed planning can be processed with special systems such as
APO/CRM that are rather oriented at customers and vendors.
Another example is CO-PC (product costing) in the SAP ERP system. From a SEM point of
view, decisions could be of interest in higher-level strategic dimensions as well. For example,
barriers to product marketing or which plant in which country produced the product cost and
time efficient could be of special interest. You might be interested in an overall summary of
product costing information, but you would expect that SAP CO-PC provides detail
aggregation since CO-PC has the transaction data and the required functions. This does not
exclude the option that you can also execute operative planning in SEM if desired. You can
carry out budgeting for cost centers in SEM and subsequently retract data for further
processing into the operative area of the SAP system.
Figure 24: SAP SEM Business Planning

8/20/2019 Part12 - Bi Sem
http://slidepdf.com/reader/full/part12-bi-sem 30/35
Integrated business processes with SAP ERP
page 30
Copyright Prof. Dr. Heimo H. Adelsberger/Dipl.-Wirt.-Inf. Pouyan Khatami/
Dipl.-Wirt.-Inf. Taymaz Khatami
3.8 Integrated enterprise planning
The following figure shows an integration scenario in enterprise planning. Starting from
market analysis and market simulation, you can set targets in the SEM system for sales
planning. In the APO system (Advanced Planner and Optimizer), the sales targets are
transferred to the sales plans and aligned with the entire supply chain. The results of thelogistics components are then in turn considered in profitability planning in SEM.
Figure 25: Integrated enterprise planning

8/20/2019 Part12 - Bi Sem
http://slidepdf.com/reader/full/part12-bi-sem 31/35
Integrated business processes with SAP ERP
page 31
Copyright Prof. Dr. Heimo H. Adelsberger/Dipl.-Wirt.-Inf. Pouyan Khatami/
Dipl.-Wirt.-Inf. Taymaz Khatami
3.9 Influence of stakeholder groups on companies
Globalization is a double-edged sword by offering benefits but also by challenging your
company and the management in a new way.
Each company today must satisfy its stakeholders; otherwise, management can find itself introuble quite rapidly. Institutional investors have a relatively great influence and do not
hesitate to use it to replace management teams that do not meet their requirements.
Also other stakeholder groups such as business partners, customers, employees and
communities are more demanding. Considering that a bad reputation on the employee market,
the customer market, or, more generally, in the community can significantly decrease a
company’s ability to carry out proper business operations, the management needs to consider
the stakeholders expectations when making major business decisions.
Therefore, in the last couple of years changes to the best practice techniques of enterprise
management occurred. Instead of managing a company inside-out, which is based on the
assumption that proper product development and efficient production and efficient customer
service are the basis of a company’s success, today’s approach of successful management is
rather oriented at a real understanding of stakeholder expectations and the ability to
outperform it. Hence resulting, the principle of enterprise management shifts from inside-out
to outside-in.
Figure 26: Influence of stakeholder groups on companies

8/20/2019 Part12 - Bi Sem
http://slidepdf.com/reader/full/part12-bi-sem 32/35
Integrated business processes with SAP ERP
page 32
Copyright Prof. Dr. Heimo H. Adelsberger/Dipl.-Wirt.-Inf. Pouyan Khatami/
Dipl.-Wirt.-Inf. Taymaz Khatami
4 Reflections – Business Intelligence
4.1 Questions
1. Fill in the blank to complete the sentence
Business analysis objects (product line, net sales, sales volumes, and so on) are called
__________ in SAP BW.
2. Fill in the blank to complete the sentence
The central data containers that form the basis for reports and analyses in SAP BE are called
_________.
3. Fill in the blank to complete the sentence
_________ is the super-ordinate term for an object that you can use to create reports in
Business Explorer (BEx).
4. Determine whether this statement is true or false.
The query designer is divided into six subareas.
5. Determine whether this statement is true or false.
There are four ways of restricting characteristics.

8/20/2019 Part12 - Bi Sem
http://slidepdf.com/reader/full/part12-bi-sem 33/35
Integrated business processes with SAP ERP
page 33
Copyright Prof. Dr. Heimo H. Adelsberger/Dipl.-Wirt.-Inf. Pouyan Khatami/
Dipl.-Wirt.-Inf. Taymaz Khatami
4.2 Standard solution – Business Intelligence
1. Fill in the blank to complete the sentence
Business analysis objects (product line, net sales, sales volumes, and so on) are calledInfoObjects in SAP BW.
These InfoObjects can be divided into characteristics and key figures. Characteristics can be
further divided into units, time characteristics, and technical characteristics.
2. Fill in the blank to complete the sentence
The central data containers that form the basis for reports and analyses in SAP BE are called
InfoCubes.
They contain key figures (sales volumes, incoming orders, actual costs, and so on) and a link
to the characteristics (master data of the SAP BW system such as cost centers, customers,
materials, and so on).
3. Fill in the blank to complete the sentence
InfoProvider is the super-ordinate term for an object that you can use to create reports in
Business Explorer (BEx).
InfoProvider are objects or views that are relevant to reporting.
4. Determine whether this statement is true or false.
The query designer is divided into six subareas.
True:
1. Directory tree of the selected InfoProvider
2. Columns
3. Rows4. Free Characteristics
5. Filter
6. Preview
5. Determine whether this statement is true or false.
There are four ways of restricting characteristics.
False! There are two ways of restricting characteristics.
-
By selecting a characteristic from the InfoProvider- You can also restrict a characteristic that you have already included in the
definition.

8/20/2019 Part12 - Bi Sem
http://slidepdf.com/reader/full/part12-bi-sem 34/35
Integrated business processes with SAP ERP
page 34
Copyright Prof. Dr. Heimo H. Adelsberger/Dipl.-Wirt.-Inf. Pouyan Khatami/
Dipl.-Wirt.-Inf. Taymaz Khatami
5 Reflections – Strategic Enterprise Management
5.1 Questions
1. Name the five components of SEM. ___________________________________
___________________________________
___________________________________
___________________________________
___________________________________
2. Determine whether this statement is true or false
The underlying data used by SEM is stored in the main OLTP system.
________________________________________________________________________
________________________________________________________________________
________________________________________________________________________
3. List the four perspectives if the Balanced Scorecard. ___________________________________
___________________________________
___________________________________ ___________________________________
4. Determine whether this statement is true or false.
The management cockpit is used in strategy management.
________________________________________________________________________
5. List the components of the management cockpit. ___________________________________
___________________________________
___________________________________
___________________________________

8/20/2019 Part12 - Bi Sem
http://slidepdf.com/reader/full/part12-bi-sem 35/35
Integrated business processes with SAP ERP
5.2 Standard solution
1. Name the five components of SEM.- BPS (Business Planning and Simulation),
-
BCS (Business-Consolidations),- SRM (Stakeholder Relationship Management)
- SM (Strategy Management) and
- PM (Performance Measurement).
2. Determine whether this statement is true or false.
The underlying data used by SEM is stored in the main OLTP system.
False, it is stored in BI.
3. List the four perspectives if the Balanced Scorecard.
Financial, Customer, Internal Business Process, and Learning and Growth.
4. Determine whether this statement is true or false.
The management cockpit is used in strategy management
False, the management cockpit is used in performance measurement. The Balanced Scorecard
is a component of strategy management.
5. List the components of the management cockpit.
The cockpit is made up of up to 9 walls, which in turn could each have up to six logical views
to represent some contention that needs to be supported, and each view in turn could have up
to six configurable frames representing the data or “answer” to the contention.