Embed Size (px)
Citation preview

1
Part-time Work, Wages and Productivity: Evidence from Matched Panel Data
Alessandra Cataldi
(Università di Roma "La Sapienza" and SBS-EM)
Stephan Kampelmann
(Université de Lille, CLERSE, SBS-EM)
François Rycx
(Université Libre de Bruxelles, SBS-EM and IZA)
Abstract
Using detailed matched employer-employee panel data for Belgium over the period 1999-2006, the authors investigate the relationship between working time, wages and productivity. More precisely, they are among the first to examine how changes in the proportions of short and long part-time workers affect the productivity of firms (measured by the value-added per hour worked) and to test for the presence of productivity-wage gaps. Their findings, controlled for a large range of individual and firm characteristics and robust to various econometric issues (including time-invariant unobserved firm heterogeneity, endogeneity and state dependence), suggest that long part-time workers are significantly more productive than short part-time and full-time workers. Their results further indicate that average hourly wages within firms do not significantly depend on the incidence of part-time jobs. Overall, this leads to the conclusion that short part-time workers are paid at their marginal productivity while long part-time workers appear to be “underpaid”.
Key words: Wages, productivity, part-time employment, matched panel data, GMM.
JEL Codes: J22, J24, J31.
__________________ * We would like to thank Statistics Belgium for giving access to the data. The usual disclaimer applies.

2
1 INTRODUCTION In the past two decades, part-time jobs have become a prominent feature of many structural
changes that occurred on European labour markets. For instance, part time has been one of the
main factors underpinning processes of labour market flexibilization (Branine 1999; Edwards
and Robinson 2000). What is more, part time has risen sharply during the latest economic
downturn. In an attempt to retain incumbent workers, many firms have preferred to reduce
working hours over layoffs (Employment in Europe 2010). In other words, part-time
arrangements appear to function as a buffer during critical stages of the business cycle
(OECD 2010).
In light of this evolution, an accurate understanding of the different repercussions of
part-time work has emerged as an increasingly salient problem. In particular, the impact of
reduced working hours on different measures of labour market performance is still not
properly understood. In this paper we address the following questions: i) Do part-time
workers differ from full-time workers in terms of wages and productivity outcomes?, and ii)
Are part-time workers paid at their marginal productivity?
A growing literature examines the impact of working time on workers’ wages.
Empirical results typically document a significant gap between hourly wages of part- and full-
time workers. By and large, this gap has been attributed to substantial heterogeneity between
jobs and/or between individuals (Hirsch, 2005; Manning and Petrongolo, 2008). Yet, for some
countries a significant fraction of this gap remains unexplained after controlling for
observable heterogeneity. This may point to other forms of labour market inequality or
discrimination against part-time workers (Bardasi and Gornick 2008). Besides, few studies
have focused on productivity differences between full-time and part-time workers. In fact, the
relationship between working hours and productivity has not been clearly established: both
extant theory and empirical results are inconclusive (Branine 2003; Lewis 2003; Nelen et al.
2011). Finally, as far as we know, there are no studies investigating whether part-time
workers are paid at their marginal productivity using accurate information on both wages and
productivity.
The present paper contributes to this literature by estimating the effect of part-time
work on productivity, wages and productivity wage-gaps. More precisely, we are among the
first to examine how changes in the proportions of short and long part-time workers affect the
productivity of firms and test for the presence of productivity-wage gaps. To do so, we use
detailed longitudinal matched employer-employee data covering the Belgian private sector

3
over the period 1999-2006. Our data offer several advantages. First, the panel provides
accurate information on average productivity and wages within firms (i.e. on the average
value added per hour worked and the mean hourly wage) and allows to control for a wide
range of worker and firm characteristics (such as education, age, occupation, sex, type of
contract, firm size, firm age and sector). Second, we are able to address important
measurement issues such as firm-level fixed unobserved heterogeneity, endogeneity of
working time and state dependence of firm productivity and wages. Hence, our data allows us
to tackle various potential biases that are not always accounted for in the existing literature.
Finally, it should be emphasized that the distinction between short and long part-time work,
too often neglected in the literature, is an important feature of our study (Hirsch 2005; Russo
and Hassink 2008). Indeed, the repercussions of part-time arrangements on wages and
productivity are likely to differ substantially according to whether the individual is absent
during much of the work week (e.g. an employee with peripheral tasks coming in only one or
two days a week) or whether she is almost working full time (e.g. an employee that works like
her full-time colleagues during the entire week but leaves the office on Friday noon).
2 REVIEW OF THE LITERATURE
2.1 Theoretical background
Economic theory advances several possible explanations for differences in hourly pay and
productivity between part-time and full-time workers. These explanations can be grouped into
four main clusters that are not mutually exclusive but rather tend to overlap and reinforce each
other.
The first cluster of reasons pertains to labour supply and demand interactions, the
argument being that some categories of persons prefer to work part-time rather than full-time
(and vice versa). This is particularly stated to be the case with regard to young workers
(students), parents with heavy home responsibilities and older workers, all of whom may be
seen to have a more marked preference for part-time employment and, for this reason, accept
wages lower than those associated with full-time employment. Note, nevertheless, that such
preferences in terms of work hours may just as well be constrained as free. However,
differences in preferences for part-time employment are not enough to generate a part-time
wage penalty. In order for this to occur, workers must be heterogeneous and it cannot be that
employers are indifferent to the way they schedule work hours among workers. Hence, only a
mix of workers’ preferences, skill differences and employer preferences can generate a part-
4
time wage penalty. However, these same forces may also work in the opposite direction.
Flexible working hours and other alternatives to the traditional full-time work schedule have
been shown to increase productivity and, consequently, also wages (Shepard et al. 1996). A
part-time wage premium is typically observed in industries that face seasonal or fluctuating
demand for or supply of their output that cannot be managed through the carrying of
inventories; employers then consent to pay high wages during peak periods when productivity
is high to part-time workers willing to work short intensive shifts. Hence, if a firm has a
particularly high labour demand during short intervals of time, and workers prefer to work
long hours at a stretch rather than space out this working time, then part-time wages may
exceed full-time wages, as there is not enough labour supply to meet labour demand. A lack
of geographical mobility may also contribute to the part-time/full-time wage gap. Ermisch
and Wright (1991) state that part-timers are more strongly bound by spatial constraints
because they are less willing to pay high costs to commute to and from work the more so
since they are often just secondary breadwinners in the household. Given this lack of labour
supply elasticity, the local labour market is in the hands of firms practising monopsonistic
power. Led by their rationality as profit-maximising economic agents, they tend to adjust
part-time wages downwards.
The second cluster concerns the cost structure of firms. The existence of fixed costs –
including the administrative costs of maintaining records for each employee, recruitment and
firing costs and any components of fringe benefits that are independent of hours worked –
means that firms’ total labour costs do not increase proportionally with hours worked
(Montgomery, 1988). As a result, part-time workers are relatively more costly to firms and
may therefore receive lower wages. It can also be argued that part-time workers may generate
coordination problems, especially in firms where their number is marginal in comparison with
full timers (Lewis 2003). Furthermore, while part time can be easily managed in a Taylorist
organisation in which workers can be substituted to each other, jobs that put a greater
emphasis on task-specific skills are more difficult to manage on a part-time basis since
outcomes such as the continuity of output or relationships with customers might be negatively
affected (Bonamy and May 1997; Edward and Robinson 2004). In addition, managers might
not always adjust correctly their expectations when employees are moving from full to part
time, thus influencing the effectiveness of flexible work arrangement policies. For instance,
working reduced hours might often mean having to deal in a shorter time with what
effectively remains a full-time workload (Edwards and Robinson 2000; Lewis 2001, 2003).

5
The third cluster of factors that can account for a part-time wage penalty is directly
related to workers’ productivity. Several theories relate productivity to the number of hours
worked. An argument in one direction is that, due to start-up effects, productivity rises slowly
at the beginning of a working day. As a result, the worker’s productivity during the last hour
of work is above the average daily level of productivity (Barzel, 1973). Hence, part-time
workers who work less hours are less productive and therefore paid lower wages. However,
other authors contest this model and point out that tiredness associated with long working
hours might significantly influence work ability so that part-time workers might perform
better than full timers (Brewster and al. 1994). In addition, flexible working time
arrangements and part-time jobs might allow individuals to make a better use of the circadian
rhythm and may reduce the amount of stress, thus increasing the correspondence between
their abilities and job requirements, potentially leading to higher performance (Pierce and
Newstrom 1983; Baltes et al. 1999).
The fourth cluster of issues is related to the institutional settings in a specific region or
country. Several studies have shown that part-timers have a lower level of union membership
(Riley 1997). In a theoretical paper by Skåtun (1998), the higher demand for part-timers is
explained by the individual bargaining process that allows the firm to increase the surplus
from the bargain. Hence, part-timers are paid less as they have less power. Moreover, given
the progressive tax structure in some countries, part-timers, who by definition earn a lower
annual gross wage than full-timers, are taxed less and, therefore, union bargaining will often
lead to a lower hourly gross wage for part-timers than for full-timers (Koskela and Vilmunen,
1996). This is the effect of unions tending to reason in terms of net wages. Indeed, unions will
be less likely to push as hard for higher gross wages for part-timers than for full-timers as the
former face a lower average tax rate. Also, the composition of income and payroll taxes may
influence the wage difference between full-time and part-time workers (Koskela and Schöb
1999). However, payroll taxation is also found to decrease the wage rate with the number of
hours worked. Vella (1993) argues that the “true” wage is held constant but that the hourly
wage rate decreases and is replaced by fringe benefits that are not taxable. Finally, anti-
discrimination legislation may also have a decisive effect on the existence or not of a pay
penalty.
6
2.2 Empirical background
2.2.1 The impact on wages
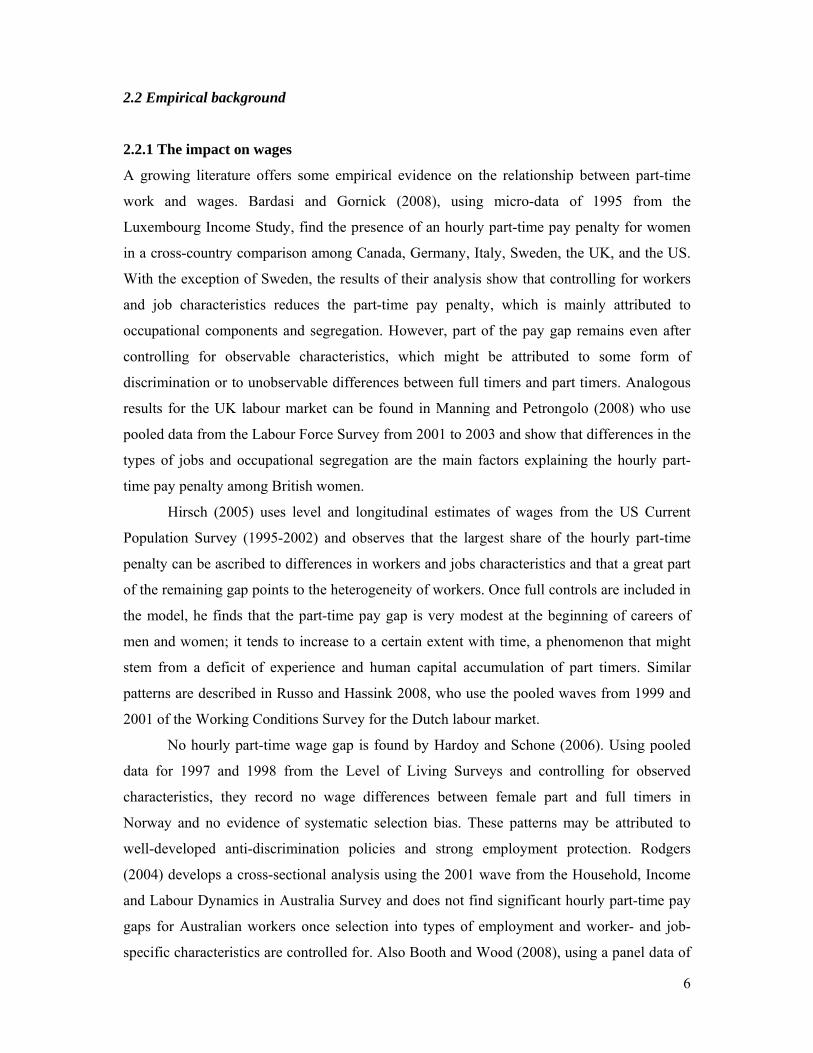
A growing literature offers some empirical evidence on the relationship between part-time
work and wages. Bardasi and Gornick (2008), using micro-data of 1995 from the
Luxembourg Income Study, find the presence of an hourly part-time pay penalty for women
in a cross-country comparison among Canada, Germany, Italy, Sweden, the UK, and the US.
With the exception of Sweden, the results of their analysis show that controlling for workers
and job characteristics reduces the part-time pay penalty, which is mainly attributed to
occupational components and segregation. However, part of the pay gap remains even after
controlling for observable characteristics, which might be attributed to some form of
discrimination or to unobservable differences between full timers and part timers. Analogous
results for the UK labour market can be found in Manning and Petrongolo (2008) who use
pooled data from the Labour Force Survey from 2001 to 2003 and show that differences in the
types of jobs and occupational segregation are the main factors explaining the hourly part-
time pay penalty among British women.
Hirsch (2005) uses level and longitudinal estimates of wages from the US Current
Population Survey (1995-2002) and observes that the largest share of the hourly part-time
penalty can be ascribed to differences in workers and jobs characteristics and that a great part
of the remaining gap points to the heterogeneity of workers. Once full controls are included in
the model, he finds that the part-time pay gap is very modest at the beginning of careers of
men and women; it tends to increase to a certain extent with time, a phenomenon that might
stem from a deficit of experience and human capital accumulation of part timers. Similar
patterns are described in Russo and Hassink 2008, who use the pooled waves from 1999 and
2001 of the Working Conditions Survey for the Dutch labour market.
No hourly part-time wage gap is found by Hardoy and Schone (2006). Using pooled
data for 1997 and 1998 from the Level of Living Surveys and controlling for observed
characteristics, they record no wage differences between female part and full timers in
Norway and no evidence of systematic selection bias. These patterns may be attributed to
well-developed anti-discrimination policies and strong employment protection. Rodgers
(2004) develops a cross-sectional analysis using the 2001 wave from the Household, Income
and Labour Dynamics in Australia Survey and does not find significant hourly part-time pay
gaps for Australian workers once selection into types of employment and worker- and job-
specific characteristics are controlled for. Also Booth and Wood (2008), using a panel data of

7
the first four waves of the same survey (2001–2004), do not detect a part-time penalty in
Australia - in fact they observe the opposite. Once unobserved individual heterogeneity is
taken into account, they find a pay premium for part-time women and men. Among the
hypothesized explanations for such a pay premium they cite the structure of the Australian tax
system and the possibility that it is less likely for part-time than for full-time workers to do
overtime hours (which reduces measured hourly wages). They also suggest that part timers
might be more productive than full timers due to the fatigue effects we mentioned above.
However, these results should be interpreted with caution given that the Australian study does
not include information on productivity levels.
Few studies investigate wage differentials among part and full timers on the Belgian
labour market. The analyses of Jepsen (2001) and O’Dorchai et al. (2007), based on data from
the 1990s respectively from the Household Panel Survey and the Structure of Earnings
Survey, show that the hourly wage gap between part-time and full-time workers almost
disappears after controlling for observables. This result is attributed to the effective protection
of part-time workers by Belgian anti-discrimination policies.
2.2.2 The impact on productivity
Empirical evidence on the difference between part-time and full-time workers in terms of
productivity outcomes is quite scarce. Moreover, results seem contradictory and difficult to
compare due to the diversity in analytical methods (Lewis 2003). Extant studies rely both on
quantitative and qualitative analyses in which measures of productivity range from objective
(e.g., sales and gross revenue) to subjective indicators of performance (e.g., employment
commitment and stress).
Some analyses are in line with the hypothesis that part time can be more effective than
full time in improving workers performance and firm’s productivity. Hagemann et al. (1994),
using a survey of 3,000 employees in five German companies from different industries, show
that: i) standard part time (i.e. employees working fewer hours per day) increases motivation
and reduces absenteeism; ii) cyclical part time allows to manage peaks and troughs in demand
more efficiently (e.g. in industries such as tourism and banking); and iii) shift-based part time
might extend firm operating hours, leading to a more intense use of capital. Perry-Smith and
Blum (2000) focus on family-friendly practices. They apply uni- and multivariate analysis of
covariance using cross-sectional data from the National Organizations Survey of U.S. firms
and control for firm level characteristics, showing that the higher the incidence of such
practices, the higher the level of perceived market and organizational performance, profits,

8
and sales growth. The analysis of Nelen et al. (2011) points in the same direction. They study
a matched employer–employee cross-sectional dataset of Dutch pharmacies in 2008, applying
internal instrumental variable analysis in order to assess causality and address potential
endogeneity of employment shares while controlling for observable characteristics. Their
results show that the larger the share of part-time employment, the higher the firm
productivity when the latter is measured by the number of prescriptions delivered to
customers.
Conversely, Arvanitis (2003) develops cross-section estimates on data from a survey
among Swiss enterprises in the business sector and finds that part-time work correlates
negatively with sales per employee (the study controls for technology, workplace
organization, and industry affiliation). The study of Branine (2003) is based on data obtained
from a questionnaire and interviews from hospitals in the UK, France, and Denmark and
shows mixed results. Respondents stated that, on the one hand, part time work is usually
associated with low absenteeism and less stress. On the other hand, it is also associated with
higher turnover, lack of continuity of the service, low employment commitment, and
relatively lower skills.
The difficulties associated with managing a part-time workforce have been recorded
by Edwards and Robinson (2004). The latter study consists in a qualitative analysis of the UK
nursing profession based on a questionnaire submitted to a sample of nurses and managers.
Respondents claim that among the main advantages of part time work there is retention of
mature staff, less stress, coverage of peaks in demand, less absenteeism, and harder work.
Among the disadvantages they mention problems of communication, an increase in
administrative costs, and overheads associated with training and difficulties with continuity of
service. In addition, part-time nurses declare to be less satisfied than their full-time colleagues
with better opportunities as regards qualification and promotion. Similar patterns emerged in
Edwards and Robinson's (2000) study that presents a qualitative analysis of the metropolitan
police service in the UK. Benefits from introducing part time are the retention of experienced
people who would otherwise exit the labour force (especially women) and an increase in job
satisfaction and commitment. Disadvantages are worsened communication and service
continuity as well as the marginalization of part-time workers in terms of training and
promotion. Difficulties with part-time practices are also documented in the case study of a
London borough in 1995 by Stanworth (1999): interviews reveal that many part-time workers
felt that they were doing a full-time job in part-time hours since managers did not correctly
adjust expectations when workers moved from full to part time.

9
Finally, some analyses do not find any significant effect of part-time work on
productivity. Stavrou (2005) uses data of all sectors of the economy for fourteen EU member
states and estimates logistic regressions without finding any evidence of a relationship
between part time and subjective measures of performance (as assessed by the highest ranking
corporate officer). Similarly, according to the regression analysis of Valverde (2000), who
draws on data from the Cranet-E dataset covering the manufacturing and service sectors of
twelve countries, the effect of part time on the reported gross revenue of companies is not
statistically significant.
3 METHODOLOGY
The empirical results presented in this article are based the separate estimation of a value-
added function and a wage equation at the firm level. The value-added function yields
parameter estimates for the average marginal product of each category of workers (short part-
time workers, long part-time workers, full-time workers), while the wage equation estimates
the respective impact of each group on the average wage paid by the firm. Estimating both
equations with the same set of control variables allows to directly compare the parameters
regarding the marginal product and the wage of each group of workers. This technique was
pioneered by Hellerstein et al. (1999) and refined by Aubert and Crépon (2003), van Ours
(2009), Göbel and Zwick (2009), van Ours and Stoeldraijer (2011), and others.
Equation (1) is a function linking a range of inputs of firm i to its added value Yi.
),( iii QLKFY (1)
where Ki represents the firm's capital stock and QLi is a quality of labour term. The latter
allows introducing a heterogeneous labour force into the value-added function.
There is an abundant econometric literature on the estimation of relationships as the
one depicted in Equation (1). Various authors have proposed different specifications, allowing
e.g. for different elasticities of substitution between the factors of production, in order to
reflect more accurately the production process inside the firm. However, our focus is not on
the production process itself, but rather on the comparison between productivity and wage for
different types of workers. We therefore use a simple Cobb-Douglas version of Equation (1),
with substitution elasticities equal to one and the assumption of firms operating at the

10
efficiency frontier. Such assumptions do not appear problematic as previous firm-level studies
have shown that productivity coefficients obtained with a Cobb-Douglas structure are robust
to other functional specifications (see, e.g. Hellerstein and Neumark, 2004). Equation (2) is
the basic (Cobb-Douglas) value-added function:
)log()log()log()log( iiii QLKAY (2)
where Ai is a constant. The parameters α and β are the respective marginal productivities of
each input factor. QLi can be written as:
G
j i
jijiii L
LLQL
1
,, )1(1 (3)
where Li is the total labour force of the firm i and Li,j/Li the proportion of group j in the total
labour force. In our case, each group j includes all individuals on the same working time
arrangement (i.e. short part-time, long part-time, full-time work). Substituting Equation (3)
into (2) allows for different marginal productivities for each of the G working time categories.
If for group j the parameter θj is bigger (smaller) than unity, then this group has a higher
(lower) marginal impact on productivity than the reference category, which, in our case,
contains all individuals working 35 or more hours per week (i.e. all full-time workers). If all
groups have ’s equal to one, then Equation (3) becomes QLi = Li , i.e. labour is perfectly
homogeneous.
As for the wage equation, Aubert and Crépon (2003) show that the average wage of
firm i can be expressed as:
G
j i
ji
i
jii
G
j i
ji
i
jiiG
jji
G
jjiji
iL
L
w
ww
L
L
w
ww
L
Lw
w}0{
,
0,
,0,
1
,
0,
,0,
1,
1,,
11 (4)
where wi,j is the average wage of Li,j and j = 0 the reference working time category with the
wage wi,0. Similar to the interpretation of θ in the production function, if the ratio wj/w0 is
bigger (smaller) than unity, then the marginal impact of group j on the average wage in the
firm is higher (lower) compared to the reference category. Comparing marginal productivities

11
and wage differentials across groups boils down to comparing j with the corresponding
wj/w0.
4 DATA AND DESCRIPTIVE STATISTICS
Our empirical analysis is based on a combination of two large data sets covering the years
1999-2006. The first, carried out by Statistics Belgium, is the Structure of Earnings Survey
(SES). It covers all firms operating in Belgium that employ at least 10 workers and with
economic activities within sections C to K of the NACE Rev. 1 nomenclature.1 The survey
contains a wealth of information, provided by the management of firms, both on the
characteristics of the latter (e.g. sector of activity, number of workers, level of collective wage
bargaining) and on the individuals working there (e.g. age, education, tenure, gross earnings,
paid hours, sex, occupation).2 The SES provides no financial information. Therefore, it has
been merged with a firm-level survey, the Structure of Business Survey (SBS). The SBS, also
conducted by Statistics Belgium, provides information on financial variables such as firm-
level value added and gross operating surplus per hour. The coverage of the SBS differs from
the SES in that it does not include the whole financial sector (NACE J) but only Other
Financial Intermediation (NACE 652) and Activities Auxiliary to Financial Intermediation
(NACE 67). The merger of the SES and SBS datasets has been carried out by Statistics
Belgium using firms’ social security numbers.
1 It thus covers the following sectors: i) mining and quarrying (C), ii) manufacturing (D), iii) electricity, gas and water supply (E), iv) construction (F), v) wholesale and retail trade, repair of motor vehicles, motorcycles and personal and household goods (G), vi) hotels and restaurants (H), vii) transport, storage and communication (I), viii) financial intermediation (J), and ix) real estate, renting and business activities (K). 2 The SES is a stratified sample. The stratification criteria refer respectively to the region (NUTS-groups), the principal economic activity (NACE-groups) and the size of the firm. The sample size in each stratum depends on the size of the firm. Sampling percentages of firms are respectively equal to 10, 50 and 100 percent when the number of workers is lower than 50, between 50 and 99, and above 100. Within a firm, sampling percentages of employees also depend on size. Sampling percentages of employees reach respectively 100, 50, 25, 14.3 and 10 percent when the number of workers is lower than 20, between 20 and 50, between 50 and 99, between 100 and 199, and between 200 and 299. Firms employing 300 workers or more have to report information for an absolute number of employees. This number ranges between 30 (for firms with between 300 and 349 workers) and 200 (for firms with 12,000 workers or more). To guarantee that firms report information on a representative sample of their workers, they are asked to follow a specific procedure. First, they have to rank their employees in alphabetical order. Next, Statistics Belgium gives them a random letter (e.g. the letter O) from which they have to start when reporting information on their employees (following the alphabetical order of workers’ names in their list). If they reach the letter Z and still have to provide information on some of their employees, they have to continue from the letter A in their list. Moreover, firms that employ different categories of workers, namely managers, blue- and/or white-collar workers, have to set up a separate alphabetical list for each of these categories and to report information on a number of workers in these different groups that is proportional to their share in total firm employment. For example, a firm with 300 employees (namely, 60 managers, 180 white-collar workers and 60 blue-collar workers) will have to report information on 30 workers (namely, 6 managers, 18 white-collar workers and 6 blue-collar workers). For more details see Demunter (2000).

12
Two filters have been applied to the original data set. Firstly, we deleted firms that are
publicly controlled and/or operating in predominantly public sectors from our sample. This
filter derives its rationale from neoclassical productivity theory, which relies on the
assumption that prices are economically meaningful. All regressions are therefore applied to
privately controlled firms only.3 Secondly, we have eliminated firms with less than 10
observations. The reason for this is that we use average values at the firm level. In order to
ascertain that averages are based on a minimum number of observations, we filtered out firms
that provided information on less than 10 employees.4
Our final sample consists of an unbalanced panel of 9,225 firms yielding 20,537 firm-
year-observations during the six year period (1999-2006), the exact number depending on the
estimation method adopted. It is representative of all firms employing at least 10 employees
within sections C to K of the NACE Rev. 1 nomenclature, with the exception of large parts of
the financial sector (NACE J) and almost all the electricity, gas, and water supply industry
(NACE E). However, given that the sampling percentages of firms in our data set increase
with the size of the latter, medium-sized and large firms are over-represented in econometric
specifications requiring firm information on several consecutive years.
The definition of earnings we use in the estimation corresponds to the total gross wages,
including premia for overtime, weekend or night work, performance bonuses, commissions,
and other premia. The work hours correspond to the total effective remunerated hours in the
reference period (including paid overtime hours). The firm's value added per hour is measured
at factor costs and calculated with the total number of hours effectively worked by the firm's
employees. All variables in the SES-SBS are not self-reported by the employees but provided
by the firm's management and therefore more precise compared to employee or household
surveys.
The thresholds we use to distinguish between different working time regimes
correspond to widely used practice in the literature. This being said, several definitions of
part-time work exist. According to the ILO Part-Time Work Convention (1994; No. 175), a
part-time worker is an “employed person whose normal hours of work are less than those of
comparable full-time workers”, where the normal hours of work referred to may be calculated
“weekly or on average over a given period of employment”. By the same token, many authors
define part time with reference to national standard of full-time working hours (Bardasi and
3 More precisely, we eliminate firms for which public financial control exceeds 50%. This exclusion reduces the sample size by less than 4%. 4 This selection is unlikely to affect our results as it leads to a small drop in sample size.

13
Gornick 2008; Manning and Petrongolo 2008). By contrast, some studies rely on subjective
self-assessment to distinguish different work regimes (OECD, 2010). What is more, the
definition of what constitutes part-time work might also vary across sectors and occupations.
In Belgium, the national statutory maximum working scheme consists of 38 hours per
week and 8 hours per day. However, these thresholds are collective renegotiated by social
partners in most industries and/or firms. As a result, actual statutory maximum working hours
are much closer to 35 hours per week and 7 hours per day. Working hours that exceed these
thresholds are typically treated as overtime. Part-time work is defined as regular and
voluntary work that is shorter than these thresholds. It cannot be shorter than three successive
hours and, on a weekly basis, not less than a third of the working time of a full-time worker
(O’Dorchai and Meulders 2009). In line with standard practice, we defined part-time work as
less than 35 hours per week (as similar approach has been adopted in e.g. in Booth and Wood
2008; Rodgers 2004; Hirsch 2005). Yet, past research has highlighted considerable
heterogeneity among part-time workers (Hirsch 2005; O’Dorchai et al. 2007; Russo and
Hassink 2008). For instance, the repercussions of part-time arrangements might differ
according to whether the individual is absent during much of the work week (e.g. an
employee with peripheral tasks coming in only one or two days a week) or whether she is
almost working full time (e.g. an employee that works like her full-time colleagues during the
entire week but leaves the office on Friday noon). In order to capture these differences, we
defined three groups of individuals: up to 25 hours (short part timers); between 25 and 35
hours (long part timers); and 35 or more working hours per week (full timers).5
[Insert Table 1 here]
Table 1 sets out the means and standard deviations of selected variables. We observe that
firms have a mean value added per hour worked of 57.77 Euros and that workers’ mean gross
hourly wage stands at 16.76 Euros. In all, 16 per cent of total hours are accumulated among
people working up to 25 hours per week, 6 per cent of hours are due to the group between 25
and 35 hours per week, and 78 per cent of hours are worked by people with 35 hours or more
5 The proportion of workers receiving payments for overt-time hours is relatively limited in our sample. Moreover, the mean number of over-time hours among these workers is generally not very large. Yet, robustness tests have been performed (not reported in the paper due to space constraints but available upon request) to make sure that econometrics results reported in section 5.2 are not biased do to the misclassification of workers in the long part-time or full-time categories due to the inclusion of overtime hours.

14
per week. We also find that 57 per cent of hours are worked by blue collar workers6, 36 per
cent of hours by people with a low level of education (i.e. lower or lower secondary education
at most), and 4 per cent of hours by people on non-standard employment contracts. Overall,
65 per cent of workers in our sample are employed in relatively big firms (i.e. firms with at
least 100 employees) and are essentially concentrated in the manufacturing sector (52
percent), wholesale and retail trade, repair of motor vehicles, motorcycles and personal and
household goods (12 per cent), construction (13 per cent) and real estate, renting and business
activities (12 per cent).
5 SPECIFICATION AND RESULTS
5.1 Functional specifications of the model
In this section we describe different specifications of the equations (2) and (4). The model
formed by equations (5) and (6) is our baseline specification and similar to the model in
Hellerstein et al. (1999). The βj (with j = 1, 2) in equation (5) is the relative marginal impact
of workers’ share j on average firm level hourly productivity [note that βj corresponds to θj - 1
in equation (3)]. In equation (6), *j is the relative marginal impact of workers’ share j on the
average firm level hourly wage (*j corresponds to wj/w0 - 1 in equation (4)). The terms ti ,
and *,ti represent the error terms.
tititititi XAAHoursAddedValue ,,,22,11,log (5)
*,,
*,2
*2,1
*1
*,log tititititi XAAHoursWagesTotal (6)
The dependent variable in equation (5) is firm i's hourly value added, obtained by
dividing the total value added by the firm i in period t by the total number of work hours
(taking into account paid overtime hours) that have been declared for the same period. The
dependent variable in equation (6) is firm i's average hourly gross wage (including premia for
overtime, weekend or night work, performance bonuses, commissions, and other premia). It is
obtained by dividing the firm's total wage bill by the total number of work hours. Hence, the
6 Blue-collar occupations include “Craft and related trades workers”, “Plant and machine operators, and assemblers”, and “Elementary occupations”.

15
dependent variables in the estimated equations are firm averages of value added and wage on
an hourly basis. The independent variables are also measured in terms of shares in total work
hours (which means that part-time shares are measured in terms of the proportion of hours
worked by part-time workers over the total amount of hours worked within the firm). The
main variables of interest are the shares of hours worked by each of our three working time
categories, ( tiA ,1 , tiA ,2 , tiA ,3 ): up to 25 hours per week (short part time), between 25 and 35
hours per week (long part time) and more than 35 hours per week (full time); we consider the
share of full-time workers ( tiA ,3 ) as our reference category.7
In addition to the shares in total work hours, we also included the vector Xi,t. It
contains a set of variables controlling for observable characteristics of the firm and its labour
force. More precisely, it includes four dummies for the size of the firm (i.e. the number of
employees), respectively four and eight dummies for the educational and occupational
composition of the workforce, the proportion of female employees, four dummies for
workers’ age (between 15 and 29, between 30 and 44, between 45 and 59 and over 60 years),
the fraction of workers with a fixed-term employment contract and eight dummies for the
years of observations. Since the firms’ capital stock is not available in the SES-SBS data set,
capital is proxied with dummy variables for nine economic sectors at the one-digit level of the
NACE nomenclature. This is likely to compensate for the omission of capital since the latter
tends to be correlated with the type of activity of the firm. Moreover, van Ours and
Stoeldraijer (2011) argue on the basis of previous studies that including or not including
capital stock doesn’t seem to affect the parameter estimates of production functions based on
firm-level micro survey data (see also Hellerstein et al. 1999; Aubert and Crépon 2003;
Dostie 2011).8
Estimating equations (5) and (6) allows to gauge the effect of different working
patterns on firm productivity and wages, but it does not allow to test directly whether the
difference between the value added and the wage coefficients for a given group of workers is
statistically significant. A simple method to obtain a test for the significance of productivity-
wage gaps has been proposed by van Ours and Stoeldraijer (2011). We apply a similar
approach and estimate a model in which the difference between firm i's hourly value added
and hourly wage is regressed on the same set of explanatory variables as in equations (5) and
7 As highlighted earlier, results reported in this paper are robust to the inclusion or exclusion of over-time hours. 8 For the modalities of all control variables and corresponding descriptive statistics see table 1.

16
(6). This produces coefficients for the two part-time groups and measures directly the size and
significance of their respective productivity-wage gaps.
We have estimated equations (5) and (6), as well as the productivity-wage gap, with
three different methods. The baseline regression is a pooled Ordinary Least Squares (OLS)
estimator with robust standard errors (we use a Huber/White/sandwich estimate of variance,
i.e. the errors are robust to heteroscedasticity and serial correlation (see Wooldridge 2002)).
This estimator is based on both the cross-section variability between firms and the
longitudinal variability within firms over time.
Pooled OLS estimators of value added models have been criticized for their potential
“heterogeneity bias” (Aubert and Crépon 2003: 116). This bias is due to the fact that firm
productivity depends to a large extent on firm-specific, time-invariant characteristics that are
not measured in micro-level surveys. As a consequence, the working time coefficients of
these estimators might be biased since unobserved firm characteristics may affect
simultaneously the firm's level of value added (or wage) and its workforce composition. This
is referred to as a problem of spurious correlation and could be caused by factors such as an
advantageous location, firm-specific assets like the ownership of a patent, or other firm
idiosyncrasies. One way to deal with unobserved time-invariant heterogeneity of firms is to
reformulate equations (5) and (6) as follows:
tiititititi XAAHoursAddedValue ,,,22,11,log (7)
*,,
*,2
*2,1
*1
*,log tiititititi XAAHoursWagesTotal (8)
where i is a dummy variable for each firm that captures time-invariant individual
unobserved characteristics. In order to remove unobserved firm characteristics that remain
unchanged during the observation period we use a fixed-effect model.
Next, the model is estimated using the dynamic system GMM estimator proposed by
Arellano and Bover (1995) and Blundell and Bond (1998). Such estimator allows us to
address the endogeneity of our explanatory variables.9 Share of part timers are likely to be
endogenous for several reasons: firstly, workers might choose or accept to work either part
time or full time according to their degree of job commitment; secondly, any shock in wages
or in productivity levels might generate correlated changes in the firm’s workforce and in
9 Technically, variables in the differenced equation are instrumented by their lagged levels and variables in the level equation are instrumented by their lagged differences.

17
labour productivity that are not due to changes in the firm’s workforce composition per se: for
instance, in periods of cyclical downturn firms might reduce workers’ time schedules in order
to save on labour costs. Furthermore, the dynamic GMM estimator allows us to control for the
potential path dependency of firm-level productivity and wages. To this end, we add a one
year lag of the dependent variables in Equations (5) and (6) to the set of explanatory
variables:
tiitititititi XAAHoursAddedValueHoursAddedValue ,,,22,111,, loglog (9)
*,,
*,2
*2,1
*11,
**, loglog tiitititititi XAAHoursWagesTotalHoursWagesTotal (10)
5.2 Estimation results
We first estimate Equations (5) and (6), as well as the productivity wage gap with pooled
OLS. In the first estimation we do include neither worker nor firm controls. Focusing at first
on the productivity equation, Table 2 shows that short part timers and long part timers are
significantly less productive than full timers. Indeed, the regression coefficient associated
with short part time is equal to -1.16 and the coefficient associated to long part time is equal
to -0.19. This means that if the fraction of long part-time workers within a firm increases by
one unit (i.e. one percentage point), productivity decreases on average by 0.19 per cent (i.e. -
0.19 * 0.01 = -0.0019 = 0.19 per cent) and if the fraction of workers working short part time
increases by one percentage point productivity decreases by 1.16 per cent. Regression
coefficients can thus be roughly interpreted as elasticities between productivity and group
shares. Yet, one should keep in mind that a change in one group of (short part-time, long part-
time or full-time) workers modifies the incidence of workers in other groups. Turning to the
relationship between part time and wages, results show that a one percentage point increase in
short part timers decreases mean hourly wages within firms by 0.71 per cent and that mean
hourly wage decreases by 0.08 per cent following a one percentage point increase in the
fraction of long part timers. The comparison of estimates for the productivity and wage
equations suggests that the productivity-wage gap is negative for both short and long part
time. This means that, according to OLS estimates, the two categories are overpaid. Results
from the productivity-wage gap regression support this finding. Indeed, the impact of short
part-time and long part-time workers on the productivity-wage gap is found to be significantly
negative (-0.44 and -0.11 respectively).

18
Introducing worker and firm controls in the regression modifies results as follows. As
to the productivity equation, the sign of the coefficients remains the same but their magnitude
is reduced: the coefficient for short part time drops to -0.40 and the coefficient for long part
time to -0.08. Considering the wage equation, the right part of Table 2 illustrates that a
relative increase in short part timers reduces mean hourly wages by 0.10 per cent and an
increase in the share of long part timers increases it by 0.07 per cent. Turning to the
productivity-wage gap, results are in line with the previous ones: both short and long part
timers are found to be overpaid (the respective coefficients are -0.30 and -0.15).
[Insert Table 2 here]
Findings reported so far should be interpreted with caution given that they are subject
to several methodological limitations. In particular, time-invariant unobserved workplace
characteristics are not accounted for. The Breusch and Pagan (1980) Lagrangian multiplier
(10441.58 for the value added and 10218.84 for the wage equation) indicates that we have to
refute the adequateness of pooled OLS for the estimation of equations (5) and (6). In addition,
the Hausman test (894.50 for the value added and 1792.59 for the wage equation) calls for a
fixed-effects model.
Results based on a fixed-effect estimator are reported in Table 3 and substantially
differ from OLS results. Regarding the value added equation, findings (not controlling for the
lagged dependent variable) show that the share of part timers does not affect average
productivity at the firm level since both the coefficients for short part time and long part time
are positive but not significant (0.03 and 0.01, respectively). As to the wage equation, the
coefficient for short part time turns out to be positive and equal to 0.13, while the coefficient
for long part time remains positive but decreases to 0.05. Findings for the productivity-wage
gap equation show that the gap is negative and significant both for short part time (-0.11) and
for long part time (-0.04). Overall, once fixed effects are taken into account, results still
indicate that short and long part time workers are slightly overpaid, but we do not find any
negative effect of part time workers on average firm level productivity.10
[Insert Table 3 here]
10 Results are quite similar if the lagged dependent variable is controlled for (see the last three columns of Table 3), except that the productivity-wage gap for long part time is only significant at the 15 percent level.

19
Yet, it could still be argued that fixed-effects estimates are biased and inconsistent due to the
endogeneity of the shares of short and long part-time workers. To address this issue,
controlling at the same time for firm fixed effects and the state dependency of firm
productivity and wages, we estimate our model using the dynamic system GMM estimator
proposed by Arellano and Bover (1995) and Blundell and Bond (1998). To examine the
reliability of the corresponding estimates, we first apply the Hansen (1982) test of
overidentifying restrictions and the Arellano-Bond’s (1991) test for second-order
autocorrelation in the first-difference errors. As shown in Table 4, they respectively do not
reject the null hypothesis of valid instruments and of no autocorrelation. As expected, we also
find that current productivity and mean wages at the firm level are significantly related to
their past values.
[Insert Table 4 here]
Furthermore, estimates of the value added equation show a positive (0.01) but
insignificant coefficient for short part time and a positive (0.14) and significant coefficient for
long part time. Contrary to the theory of start-up costs (Barzel 1973), our estimates thus
suggest that part time can be beneficial for firm productivity, at least if it exceeds 25 hours per
week. In other words, it appears that certain part timers perform the equivalent of full-time
jobs but within slightly fewer hours. This interpretation is supported by the literature arguing
that, for various reasons, many part timers continue to be confronted with full-time workloads
(Lewis 2001; Lewis 2003; Edwards and Robinson, 2000; Stanworth 1999). Yet, other
theoretical explanations (e.g. reciprocity theories; the appropriateness of part time in light of
the circadian rhythm; or end-of-the-day fatigue) are also in line with our results for long part
time. As to the wage equation, neither the short nor the long part-time coefficient (0.05 and
0.02, respectively) is significantly different from zero. Results thus indicate that there is no
part-time wage gap in the Belgian private sector when controlling for a large number of
worker and firm characteristics (including firm fixed effects) and endogeneity issues. Finally,
findings from the productivity-wage-gap regression indicate that short part timers are paid at
their marginal productivity (the coefficient is negative (-0.04) but not significant), whereas
long part-timers would be ‘underpaid’ (the coefficient is significant and equal to 0.12).
Results for the productivity-wage gap, consistent with those obtained separately on the basis
of productivity and wage regressions, suggest that anti-discriminatory policies on the Belgian
labour market are more effective to protect short than long part-time workers.

20
6 CONCLUSION
During the last two decades, part time has become one of the main vectors of labour market
flexibility in Europe and elsewhere. It has also risen sharply during the recent economic
downturn (Employment in Europe 2010). In OECD countries, on average one in four women
and one in ten men work part time (OECD 2010).
A growing literature examines the impact of working time on workers’ wages.
Empirical results typically document a significant gap between hourly wages of part- and full-
time workers. By and large, this gap has been attributed to substantial heterogeneity between
jobs and/or between individuals (Hirsch, 2005; Manning and Petrongolo, 2008). Yet, for some
countries a significant fraction of this gap remains unexplained after controlling for
observable heterogeneity. This may point to other forms of labour market inequality or
discrimination against part-time workers (Bardasi and Gornick 2008). Besides, few studies
have focused on productivity differences between full-time and part-time workers. In fact, the
relationship between working hours and productivity has not been clearly established: both
extant theory and empirical results are inconclusive (Branine 2003; Lewis 2003; Nelen et al.
2011). Finally, as far as we know, there are no studies investigating whether part-time
workers are paid at their marginal productivity using accurate information on both wages and
productivity.
The present paper contributes to this literature by estimating the effect of part-time
work on productivity, wages and productivity wage-gaps. More precisely, we are among the
first to compare the productivity and wage profiles of three groups of workers: those working
less than 25 hours (short part time), between 30 and 35 hours (long part time), and more than
35 hours per week (full time). To do so, we used detailed longitudinal matched employer-
employee data covering the Belgian private sector over the period 1999–2006. Our data
allows to tackle a range of measurement issues that have not been addressed in the existing
literature: the panel data provides precise information on average productivity and wages
within firms; controls for a wide range of worker and firm characteristics; and permits to deal
with time-invariant unobserved firm heterogeneity, the endogeneity of part-time shares, and
the state dependence of firm productivity and wages. The distinction between short and long
part-time workers, too often neglected in the literature, is an important feature of our study
(Hirsch 2005; Russo and Hassink 2008). Indeed, the repercussions of part-time arrangements
on wages and productivity are likely to differ according to whether the individual is absent
during much of the work week (e.g. an employee with peripheral tasks coming in only one or

21
two days a week) or whether she is almost working full time (e.g. an employee that works like
her full-time colleagues during the entire week but leaves the office on Friday noon).
Results from our preferred specification, based on the dynamic system GMM
estimator, indicate that average hourly wages within firms do not significantly depend on the
incidence of short and long part-time workers. They thus highlight the absence of any part-
time wage gap. Nevertheless, results from the OLS model show that wage penalties
associated to short part time employment are explained by differences in individual and job
characteristics, meaning that individuals working less than 25 hours per week are
concentrated in “low-paid” jobs. This segregation effect is less apparent for long part timers
(the gross wage differentials in the OLS model is much smaller for this group).
Regarding productivity, GMM results indicate that a marginal increase in the share of
short part-time workers does not affect average firm productivity. This could mean that the
negative and positive effects of short part time on productivity that have been hypothesised in
the theoretical literature either cancel each other or simply don't exist. On any account, short
part time seems to be paid at marginal productivity and we find no signs of wage
discrimination for this group. This result might be attributed to Belgium's relatively effective
anti-discrimination policies that strive to protect part-time workers. As regards part time jobs
that exceed 25 weekly working hours, however, GMM estimations indicate that a marginal
increase in the share of long part time has a positive effect on firm productivity and we find
that this group is paid below its marginal productivity.
Overall, our empirical results suggest that part time has no strongly detrimental effect
on firm productivity. For part-time jobs with more than 25 weekly work hours the opposite
seems to be the case. We argued that this could be due to workers in long part-time jobs
facing what are effectively full-time workloads. In other words, individuals that work almost
full time are effectively carrying out full-time jobs in part-time hours, for instance due to
management not taking into account working time reductions when establishing work plans or
performance expectations (Stanworth 1999; Edwards and Robinson, 2000; Lewis 2001,
2003). It should be noted, however, that other theoretical explanations are also in line with our
results (e.g. reciprocity theories; the appropriateness of part time in light of the circadian
rhythm; or end-of-the-day fatigue).

22
REFERENCES
Arellano, Manuel, and Bond Stephen. 1991. Some Tests of Specification for Panel Data:
Monte Carlo Evidence and an Application to Employment Equations. Review of Economic
Studies 58(2): 277-97.
Arellano, Manuel, and Bover Olympia. 1995. Another look at instrumental variables
estimation of error-component models. Journal of Econometrics 68(1): 29–51.
Arvanitis, Spyros. 2003. Numerical and Functional Labour Flexibility at Firm Level: Are
There Any Implications for Performance and Innovation? Evidence for the Swiss
Economy, KOF-Arbeitspapiere/Working papers no. 80. September, Zurich.
Aubert, Patrick, and Bruno Crépon. 2003. La productivité des salariés âgés: une tentative
d’estimation. Economie et Statistique, 368: 95-119.
Baltes, Boris. B., Briggs, Thomas E., Huff, Joseph W., Wright, Julie A. and Neuman, George
A. 1999. Flexible and compressed workweek schedules: A meta-analysis of their effects on
work-related criteria. Journal of Applied Psychology, 84(4): 496–513.
Bardasi, Elena, and Gornick, Janet C. 2008. Working for Less? Women's Part- Time Wage
Penalties Across Countries. Feminist Economics, 14(1): 37-72.
Barzel, Yoram. 1973. The Determination of Daily Hours and Wages. Quarterly Journal of
Economics, 87(2): 220–238.
Blundell, Richard, and Bond Stephen. 1998. Initial conditions and moment restrictions in
dynamic panel data models. Journal of Econometrics, 87(1): 115-143.
Bonamy, Joel, and May Nicola. 1997. Service and Employment Relationship. The Services
Industries Journal, 17(4): 544-563.
Booth, Alison, and Wood Margi. 2008. Back-to-front down-under? Part-time/full-time wage
differentials in Australia. Industrial Relations, 47(1): 114-135.
Branine, Mohamed. 1999. Part time work in the public health service of Denmark, France and
the UK. International Journal of Human Resource Management, 10(3): 411–429.
Branine, Mohamed. 2003. Part-time work and job sharing in health care: Is the NHS a family-
friendly employer?. Journal of Health Organization and Management, 17(1): 53-68.
Breusch, Trevor, and Pagan, Adrian R. 1980. The LM test and its application to model
specification in econometrics. Review of Economic Studies, 47(1): 239–254.
Brewster, Chris, Hegewisch, Ariane, and Mayne Lesley. 1994. Flexible working practices: the
controversy and the evidence. In Brewster Chris, Hegewisch Ariane, (Eds), Policy and

23
Practice in European Human Resource Management: The Price Waterhouse Cranfield
Survey. Routledge, London.
Demunter, Christophe. 2000. Structure and distribution of earnings survey: Analysis 1995.
Statistics Belgium Working paper, Brussels.
Dostie, Benoit. 2011. Wages, productivity and aging. De Economist, 159(32): 139-158.
Edwards, Christine and Robinson Olive. 2000. Managing part-timers in the police service: A
study of inflexibility. Human Resource Management Journal, 9(4): 5-18.
Edwards, Christine and Robinson Olive. 2004. Evaluating the Business Case for Part-time
Working amongst Qualified Nurses. British Journal of Industrial Relations, 42(1): 167–
183.
Employment in Europe 2010, Directorate-General for Employment, Social Affairs and Equal
Opportunities, European Commission.
Ermisch, John F., and Wright, Robert E. 1991.Wage offers and full-time and part-time
employment by British women. Journal of Human Resources, 25(1): 111-33.
Göbel, Christian and Zwick, Thomas. 2009. Age and productivity - Evidence from linked
employer employee data. ZEW Discussion Paper no. 09-020, Mannheim.
Hagemann, Helmut, Sommerfeldl Klaus, Dingier Markus, Miiffer Wolfgang, Neuberger
Clans and Delker Christel. 1994. Divide to Win: The Potential in Flexible Part-time Work,
McKinsey & Company.
Hansen, Lars. 1982. Large Sample Properties of Generalized Method of Moments Estimators.
Econometrica, 50(4), 1029-54.
Hardoy, Inés and Schøne Pål. 2006. The part-time wage gap in Norway: How large is it
really?. British Journal of Industrial Relations, 44(2): 263-82.
Hellerstein, Judith K., Neumark David and Troske, Kenneth R. 1999. Wages, productivity
and worker characteristics: Evidence from plant-level production functions and wage
equations. Journal of Labor Economics, 17(2): 409-446.
Hellerstein, Judith K., and Neumark David. 2004. Production function and wage equation
estimation with heterogeneous labor: Evidence from a new matched employer-employee
data set. NBER Working Paper no. 10365, Cambridge, MA.
Hirsch Barry, T. 2005. Why do part-time workers earn less? The role of worker and job skills.
Industrial and Labor Relations Review, 58(4): 525-551.
Jepsen, Maria. 2001. Evaluation des différentiels salariaux en Belgique: hommes – femmes et
temps partiel – temps plein. Reflets et perspectives de la vie économique, XL(1-2): 51-63.

24
Koskela, Erkki and Ronnie Schöb. 1999. Does the composition of wage and payroll taxes
matter under Nash bargaining?. Economics Letters, 64(3): 343-349.
Koskela, Erkki and Vilmunen Jouko. 1996. Tax progression is good for employment in
popular models of trade union behavior. Labour Economics, 3(1):65-80.
Lewis, Suzan. 2001. Restructuring workplace cultures: The ultimate work–family challenge?
Women in Management Review, 16(1): 21–29.
Lewis, Suzan. 2003. Flexible Working Arrangements: Implementation, Outcomes and
Management. International Review of Industrial and Organizational Psychology, 18: 1-28.
Manning, Alan, and Petrongolo Barbara. 2008. The Part-Time Pay Penalty for Women in
Britain. Economic Journal, 118(526): F28-F51.
Meulders, Danièle and O'Dorchai Sile. 2009. Gender and flexibility in working time in
Belgium. Working paper DULBEA, Research Report, N°09-08.RR, March.
Montgomery, Mark. 1988. Hours of Part-time and Full-Time Workers at the Same Firm.
Industrial Relations, 27(3): 394-406.
Nelen, Annemarie, de Grip Andries and Fouarge Didier. 2011. Is Part-Time Employment
Beneficial for Firm Productivity?. Research Memoranda 002. Maastricht. ROA, Research
Centre for Education and the Labour Market.
O’Dorchai, Sile, Plasman Robert and Rycx Francois. 2007. The part-time wage penalty in
European countries: how large is it for men?. International Journal of Manpower, 28(7):
571-603.
OECD. 2010. Employment Outlook 2010, Moving Beyond the Crisis. OECD, Paris.
Pierce, Jon L., and Newstrom, John W. 1983. The design of flexible work schedules and
employee responses: Relationships and process. Journal of Occupational Behavior, 4(4):
247-262.
Riley, Nicola-Maria. 1997. Determinants of union membership: a review. Labour, 11(2):265-
301.
Rodgers, Joan R. 2004. Hourly wages of full-time and part-time employees in Australia.
Australian Journal of Labour Economics, 7(2): 231-54.
Russo, Giovanni and Hassink, Wolter. 2008. The Part-Time Wage Gap: a Career Perspective.
De Economist, 156 (2): 145- 174.
Shepard, Edward, Clifton, Thomas and Kruse, Douglas. 1996. Flexible work hours and
productivity: Some evidence from the pharmaceutical industry. Industrial Relations,
35(1): 123-139.
25
Skåtun, John D. 1998. Divide the hours and conquer the surplus: part-time workers and pay.
Economics Letters, 61(2): 235-42.
Stavrou, Eleni T. 2005. Flexible work bundles and organizational competitiveness: a cross-
national study of the European work context. Journal of Organizational Behavior, 26(8):
923–947.
Stanworth, Celia M. 1999. A best case scenario? Non-manual part-time work and job-sharing
in UK local govemment in the 1990s. Community, Work & Family, 2(3): 295- 310.
Van Ours, Jan C. 2009. Will you still need me: When I’m 64?. De Economist, 157(4): 441-
460.
Van Ours, Jan C. and Stoeldraijer, Lenny. 2011. Age, wage and productivity in Dutch
manufacturing. De Economist, 159(2): 159-192.
Vella, Francis.1993. Nonwage benefits in a simultaneous model of wages and hours: Labour
supply functions of young female. Journal of Labor Economics, 11(4): 704-723.
Wooldridge, Jeffrey (2002), Econometric Analysis of Cross Section and Panel Data, MIT
Press.

26
TABLE 1. DESCRIPTIVE STATISTICS (1999-2006) Variables: Mean Std. Dev.
Added value per hour (2006 Euros) 57.77 525.98 Hourly wage (2006 Euros) 16.76 5.57 Share of workers < 30 years 0.23 0.16 Share of workers between 30 and 44 years 0.49 0.16 Share of workers between 45 and 59 years 0.27 0.17 Share of workers >= 60 years 0.01 0.03 Education: Lower education 0.08 0.17 Lower secondary education 0.28 0.30 General upper secondary school 0.19 0.24 Technical/artistic/professional upper secondary school 0.21 0.25 Short higher education 0.15 0.18 Long higher education or university 0.09 0.15 Occupations: Managers 0.03 0.08 Professionals 0.10 0.19 Technicians and associate professionals 0.08 0.15 Clerical support workers 0.17 0.22 Service and sales workers 0.05 0.19 Craft and related trades workers 0.26 0.33 Plant and machine operators, and assemblers 0.22 0.30 Elementary occupations 0.09 0.20 Working time:
Short Part time (< 25 work hours per week) 0.16 0.14 Long Part time (25 to 35 hours per week) 0.06 0.07 Full time (>= 35 work hours per week) 0.78 0.19
Not standard (i.e. non open-ended) employment contract 0.04 0.10 Number of employees per firm:
< = 19 0.03 20 to 49 0.14 50 to 99 0.18 100 to 199 0.25 200 to 499 0.26 > = 500 0.14
Sector (%): Mining and quarrying (C) 0.00 Manufacturing (D) 0.52 Electricity, gas and water supply (E) 0.00 Construction (F) 0.13 Wholesale and retail trade, repair of motor vehicles, motorcycles and personal and household goods (G) 0.12 Hotels and restaurants (H) 0.02 Transport, storage and communication (I) 0.08 Financial intermediation (J) 0.01 Real estate, renting and business activities (K) 0.12 Number of observations 20,537 Number of firms 9,225

27
TABLE 2 – POOLED OLS ESTIMATES, 1999-2006 Without control variables With control variables a
Dependent variable: Value added per hour worked
(ln)
Mean wage per hour worked
(ln)
Value added-wage gap
(ln)
Value added per hour worked
(ln)
Mean wage per hour worked
(ln)
Value added-wage gap
(ln) Short Part-time (0, 25) -1.16***
(0.04) -0.71***
(0.02) -0.44***
(0.03) -0.40***
(0.04) -0.10***
(0.02) -0.30***
(0.04) Long Part-time [25, 35) -0.19***
(0.03) -0.08***
(0.02) -0.11***
(0.02) -0.08** (0.03)
0.07*** (0.01)
-0.15*** (0.03)
Sig. model (p-value) 0.00 0.00 0.00 0.00 0.00 0.00R² 0.06 0.08 0.01 0.25 0.65 0.05 Number of observations 20,537 20,537 20,537 20,537 20,537 20,537 Number of firms 9,225 9,225 9,225 9,225 9,225 9,225 Notes: ***/**/* significant at the 1, 5 and 10% level. Robust standard errors are reported between brackets. a We control for workers characteristics that include the educational and occupational composition of the firm’s workforce (4 and 8 categories, respectively), share of female employees, worker’s age (4 categories), share of non-standard work contracts and worker’s tenure. We control for firm characteristics that include size (4 dummies), industry (8 dummies) and year dummies (7). .

28
TABLE 3 –FIXED EFFECTS ESTIMATES, 1999-2006 Without lagged dependent variable With lagged dependent variable Dependent variable: Value added
per hour worked (ln)
Mean wage per hour worked
(ln)
Value added-wage gap
(ln)
Value added per hour worked
(ln)
Mean wage per hour worked
(ln)
Value added-wage gap
(ln) Lagged dependent variable 0.11*
(0.06) 0.13*** (0.02)
0.08 (0.06)
Short Part-time (0, 25) 0.03 (0.05)
0.13*** (0.03)
-0.11* (0.06)
-0.09 (0.08)
0.12*** (0.03)
-0.21** (0.09)
Long Part-time [25, 35) 0.01 (0.02)
0.05*** (0.01)
-0.04* (0.02)
-0.01 (0.03)
0.04*** (0.01)
-0.05 (0.03)
Sig. model (p-value) 0.00 0.00 0.00 0.00 0.00 0.00 Within R² 0.02 0.49 0.00 0.20 0.63 0.02 Number of observations 20,537 20,537 20,537 6,753 6,753 6,753 Number of firms 9,225 9,225 9,225 2,487 2,487 2,487 Notes: ***/**/* significant at the 1, 5 and 10% level. Robust standard errors are reported between brackets. a We control for workers characteristics that include the educational and occupational composition of the firm’s workforce (4 and 8 categories, respectively), share of female employees, worker’s age (4 categories), share of non-standard work contracts and worker’s tenure. We control for firm characteristics that include size (4 dummies), firm industry (8 dummies) and year dummies (7).

31
TABLE 4 – DYNAMIC SYSTEM GMM ESTIMATES, 1999-2006 Dependent variable: Value added
per hour worked (ln)
Mean wage per hour worked
(ln)
Value added- wage gap
(ln) Lagged dependent variable 0.22**
(0.11) 0.32*** (0.08)
0.20*** (0.05)
Short Part-time (0, 25) 0.01 (0.11)
0.05 (0.05)
-0.04 (0.14)
Long Part-time [25, 35) 0.14** (0.05)
0.02 (0.03)
0.12* (0.06)
Sig. model (p-value) 0.00 0.00 0.00 Arellano Bond test for AR(2) (p-value)
0.92
0.51
0.65
Hansen test (p-value) 0.53 0.16 0.45 Number of observations 6,753 6,753 6,753 Number of firms 2,487 2,487 2,487Notes: ***/**/* significant at the 1, 5 and 10% level. Robust standard errors are reported between brackets. We control for worker characteristics that include the educational and occupational composition of the firm’s workforce (4 and 8 categories, respectively), share of female employees, worker’s age (4 categories), share of non-standard work contracts and worker’s tenure. We control for firm characteristics that include size (4 dummies), industry (8 dummies) and year dummies (7). First and second lags of explanatory variables, excluding time dummies, are used as instruments.