Embed Size (px)
Citation preview

PART IV
CORROSION INHIBITION STUDIES OF
SCHIFF BASES ON MILD STEEL

139
CHAPTER 1
INTRODUCTION
Aggressive acid solutions are extensively used in the industries for
manufacturing processes and other applications like acid pickling, acid
cleaning, acid de-scaling and oil well cleaning1. Metals which are subjected
to painting, enameling, galvanizing, electroplating, phosphate coating, cold
rolling etc. must have a clean surface free from salt or oxide scaling. To
remove unwanted scale such as mill scale rust, the metal is immersed in an
acid solution known as acid pickling bath. The most commonly used acids in
industrial process are hydrochloric acid, sulphuric acid, nitric acid,
hydrofluoric acid, citric acid, formic acid, acetic acid etc. Hydrochloric acid
is extensively used in the pickling baths because of its easy economic
regeneration from the depleted pickling solution. The use of acids makes the
industrial pipe lines and metal vessels to corrode and there by reducing the
production and causing economical loss.
Corrosion inhibitor
A corrosion inhibitor is a substance which when added in small
quantities to a corroding medium brings about an appreciable reduction of the
corrosive action. Corrosion inhibitors are commonly added in small amounts
to acids, cooling waters, steam and other environments, either continuously or
intermittently to prevent serious corrosion. The selection of suitable inhibitor

140
depends on the type of acid, its concentration, temperature, flow velocity, the
presence of dissolved inorganic or organic substance and type of metallic
material exposed to the acid solution.
Corrosion is an electrochemical phenomenon and inhibitors decrease
the velocity of electrochemical electrode reactions2,3. Depending upon the
mechanism of their action corrosion inhibitors are classified as anodic
inhibitors, cathodic inhibitors and organic or mixed type inhibitors. Anodic
inhibitors are substances, which reduce the anode area by acting on the anodic
sites and polarize the anodic reaction and displace the corrosion potential in
the positive direction. Chromates, nitrates, tungstate, molybdates are some
examples of anodic inhibitors.
Cathodic inhibitors reduce the cathode area by acting on the cathodic
sites and polarize the cathode reaction and displace the corrosion potential in
the negative direction. They reduce corrosion current and thereby retard the
cathodic reaction and suppress corrosion rate. Examples for cathodic
inhibitors are phosphates, silicates and borates.
Substances which affect both cathodic and anodic reaction are called
mixed inhibitors. In general these are organic compounds, which are also
known as organic or adsorption type inhibitors, which absorb on the metal
surface and suppress metal dissolution and reduction reaction. Organic
inhibitors affect the entire surface of the corroding metal when present in
sufficient concentration. Both the anodic and cathodic areas are probably

141
inhibited but to varying degrees, depending on the potential of the metal,
chemical structure of the inhibitor molecule, and the size of the molecule
Schiff bases as corrosion inhibitors in acid solutions – A review
Compounds containing functional groups with hetero atoms, which can
donate lone pair of electrons, are found to be very efficient as inhibitors
against metal corrosion in many environments. Many N-heterocyclic
compounds with polar groups and/or π electrons are also acting as efficient
corrosion inhibitors in acidic solutions. Schiff base, an organic compound
which has both these features combined in one molecule, will be a potential
inhibitor. Schiff bases have been previously reported as effective corrosion
inhibitors for steel, copper and aluminum in acid medium like hydrochloric
acid, sulphuric acid, acetic acid, formic acid etc.4-26.
Emregul and Atakol4 studied the corrosion inhibition efficiency of
Schiff base compounds N-(2-hydroxyphenyl)salicyaldimine, N,N'-bis-(salicy-
aldehyde)-1,3-diaminopropane, N,N'-bis-(2-hydroxybenzyl)1,3-diaminopro-
pane on iron in 1M HCl using weight loss, polarization and electrochemical
impedance spectroscopy (EIS) techniques. All these Schiff bases act as good
inhibitors and among the three compounds N,N'-bis-(2-hydroxybenzyl) 1,3-
diaminopropane showed maximum inhibition efficiency. Sorkhabi et al.5
determined the inhibition efficiency of pyridinimic Schiff bases, benzilidene-
pyrimidine-2-yl-amine, (4-methyl-benzilidene)–pyrimidine-2-yl-amine, (4-
142
choloro-benzilydene)–pyrimidine-2-yl-amine towards mild steel (MS) in 1M
HCl medium by weight loss and electrochemical polarization methods. These
results reveal that these compounds act as good corrosion inhibitors even at
very low concentrations and adsorption followed Langmuir isotherm.
In terms of molecular parameters, Lukovits6 explained the variation in
the inhibition efficiency of thiosemicarbazide and thiosemicarbazones
derivatives using quantitative structure activity relationships (QSAR). It was
found that in the studied series of thiosemicarbazide and thiosemicarbazone
derivative corrosion inhibition efficiency depends on the EHOMO and the dipole
moment, or alternatively, on the minimal electronic excitation energy. Rehim
et al.7 have tested 4-amino antipyrine (AAP) for the corrosion inhibition of
MS in 2M HCl using weight loss, potentiodynamic polarization and EIS
methods. The results showed that AAP is an inhibitor for MS and the
inhibition was assumed to take place via adsorption of the inhibitor molecule
on the metal surface.
Quraishi and co-workers8 investigated the influence of three macro
cyclic compounds on corrosion of MS in HCl using weight loss method,
potentiodynamic polarization, AC impedance and hydrogen permeation
techniques. All the investigated compounds showed significant efficiencies
and reduced permeation of hydrogen through MS in HCl. Potentiodynamic
polarization results reveal that macrocyclic compounds acted as mixed
inhibitors.

143
The influence of pyridinium chloride (PC) and n-hexa decyl
pyridinium chloride (HDPC) on the corrosion of MS in 5N HCl and 5N
H2SO4 has been studied using weight loss, gasometric, linear polarization,
potentiodynamic polarization, and small amplitude cyclic voltametric
techniques9. It was found that HDPC is more inhibitive than PC and both
compounds perform better in H2SO4. The corrosion inhibition on SS 400 by
Schiff base compounds derived from diamines and o-hydroxy, o-methoxy
aromatic aldehyde was investigated by weight loss, electrochemical
measurements and surface analysis in various aqueous solutions such as tap
water, concentrated tap water and HCl solutions by Shokry10. It was found
that 93% inhibition efficiency was achieved for N,N′-bis(salicyladehyde)-
1,12-diaminododecane and adsorption obeyed Langmuir isotherm.
Dadgarnezhad et al.11 synthesised new tetradendate Schiff base, bis –
(2-hydroxy-1-naphthaldehyde)1, 6-hexadiamine and studied its corrosion
inhibition on carbon steel in 1M HCl and 0.5M H2SO4 using EIS, polarization
curves and weight loss techniques. Potentiodynamic polarization tests
showed that this inhibitor act as both cathodic and anodic inhibitor and
efficiency of 95% was achieved for a 100 ppm concentration. The inhibitor
effect of Schiff base compounds N,N'-bis-(salicylidene)-2-hydroxy-1,3-
propanediamine and N,N'-bis-(2-hydroxyacetophenlidene)-2-hydroxy-1,3-
propane diimine on MS in 2M HCl medium were studied using weight loss,
polarization and impedance methods12. The results revealed that the latter

144
Schiff base showed better inhibition property than the former one and both the
inhibitors appear to function through the Langmuir adsorption isotherm.
Sorkhabi et al. 13 have carried out the corrosion inhibition studies on
MS in 1M HCl medium using the Schiff bases benzylidine-pyridine-2-yl-
amine, (4-benzylidene)-pyridine-2-yl-amine and (4-chloro-benzidiline)-
pyridine-2-yl-amine by weight loss measurements and electro chemical
methods. Results showed that these compounds were excellent inhibitors and
inhibition efficiency increased with increase in inhibitor concentration and
varied with the type of functional groups substituted on benzene ring. The
polarization curves reveal that compounds are mixed type inhibitors and
experimentally obtained adsorption isotherms follow the Langmuir equation.
The inhibition efficiency of Schiff bases, 2-((1E)-2-aza-2-pyrimidine-
2-ylvinyl)thiophene, 2-((1Z)-1-aza-2-(2-pyridyl)vinyl)pyrimidine, 2-((1E)-2-
aza-2-(1,3-thiazol-2-yl)vinyl)thiophene, 2-((1Z)-1-aza-2(2-thienyl)(vinyl)
benzothiazole containing hetero aromatic substituents on carbon steel in 0.1
M HCl, using potentiodynamic polarization and EIS studies have been carried
out by Yurt et al.14 Polarization studies reveal that studied Schiff bases act as
anodic inhibitors. The variation of inhibition efficiency mainly depends on
the type and nature of the substituents present in the inhibitor molecule and
these compounds are adsorbed on the steel surface and the adsorption obeys
Temkin’s isotherm. Desai et al.15 studied seven Schiff bases as corrosion
inhibitors for MS in HCl solutions by weight loss and electrochemical

145
methods. Polarization data indicate that all these compounds act as
predominantly cathodic inhibitors.
Quraishi and Sardar16 have synthesised organic compounds like 5-
mercapto-3-butyl-4-salicylidine-1,2,4-triazole (MBST), 5-mercapto-3-butyl-
4-benzilidineiminio-1,2,4-triazole (MBBT) and 5-mercapto-3-butyl-4-cinna-
mylidineimino-1,2,4-triazole(MBCT) and investigated their corrosion
inhibition capacity on MS in 1N HCl and 1N H2SO4 by weight loss and
potentiodynamic polarization techniques. Inhibition efficiency was found to
vary with respect to temperature, concentration and immersion time. The
adsorption of these compounds on the steel surface for both acids was found
to obey Temkin’s adsorption isotherm. The potentiodynamic polarization
data have shown that compounds studied are mixed type inhibitors.
The inhibition capacity of Schiff bases, 2-hydroxyacetophenone-
etansulphonylhydrazone, salicyladehyde-etansulphonylhydrazone, 5-bromo
salicyladehyde-etansulphonylhydrazone and 5-chlorosalicylaldehyde-etansul-
phonylhydrazone on AA3102 aluminum in 0.1M HCl by means of hydrogen
evolution tests and EIS technique have been carried out in 200417. Maximum
efficiencies were obtained for third and fourth Schiff bases because they have
electronegative atoms like chlorine and bromine as para substituents on
phenol ring.
Bansiwal et al.18 conducted weight loss and thermometric methods to
study the inhibition of aluminum corrosion in HCl solution by four Schiff

146
bases such as 2-anisalidine-pyridine, 2-anisalidine-pyrimidine, 2-salicylidine-
pyridine, 2-salicylidine-pyrimidine and have shown that they are effective
inhibitors for the corrosion of aluminum in HCl. Desai et al.19 carried out the
corrosion inhibition testing of Schiff bases derived from benzaldehyde,
aliphatic and aromatic primary amines on aluminium alloy 51S in HCl.
Schiff bases showed fairly good inhibition efficiency and conversion of an
amine into its Schiff base improved its inhibitive action.
The corrosion inhibition of copper in 0.5 M HCl by 1,3,4-thiadiazole-
2,5-dithiol(bismuthiol) using potentiodynamic polarization technique has
been reported20. It was found that bismuthiol was chemically adsorbed on
the copper surface and follows Langmuir isotherm. Li and co-workers21
examined inhibiting effect of Schiff base N, N'-O-phenylen-bis(3-methoxy
salicyaldenimine) on corrosion of copper in 1.0 M HCl and NaCl solutions
using potentiostatic polarization and EIS techniques. The results show a
remarkable decrease in the corrosion rate in the presence of Schiff base.
Fouda22 investigated the inhibition action of semicarbazide, thiosemi-
carbazide and diphenylcarbazide towards corrosion of zinc in HCl using
weight loss, thermometric and polarization techniques. From the weight loss
measurements it was observed that the rate of corrosion depends on the nature
of inhibitor and its concentration. The polarization studies reveal that these
inhibitors act as mixed type inhibitors. The increase in adsorption is due to
electron density at the reactive C=S and C=O groups and N atoms.

147
Corrosion inhibition of Zinc on HCl using Nypa Fruticans Wurmb
extract and 1,5 Diphenylcarbazone were tested by Okorosaye et al.23 using
weight loss technique. Maximum inhibition efficiency was obtained at an
optimum concentration. The corrosive behaviour of Zinc in HCl solution
containing various concentrations of glutaraldehyde, glycine, methionine and
their condensation products formed between was examined using chemical
and electrochemical methods by Rajappa et al24. The condensation product
of glutaraldehyde and methionine acted as cathodic inhibitor showing an
efficiency of 92.5% and adsorption followed Temkin isotherm.
Hosseini et al.25 have synthesised and studied corrosion inhibition
efficiency of Schiff bases N,N'-ortho-phenylene(salicylaldimine-acetyl
acetoneimine) and N,N'-ortho-phenylene(salicylaldimine-2-hydroxy-1-napth
aldimine) on MS in 0.5M H2SO4 using weight loss, polarization and EIS
techniques. These compounds achieved 95% efficiency at a concentration of
400 ppm and identified both compounds as good inhibitors.
Quraishi et al.26 have investigated the inhibition efficiency of three
Schiff bases 1-vanillinthiosemicarbazone, 1-salicyaldehyde thiocarbazone,
1-dimethyl aminobenzaldehyde thiosemicarbazone towards MS in aqueous
solutions containing 20% formic and 20% acetic acid media by weight loss
and potentiodynamic polarization methods. These compounds acted as mixed
inhibitors and shown good inhibition efficiency in formic acid solutions.

148
Scope of present investigation
Organic compounds are used to control the corrosion of MS in acid
solutions. Due to the presence of the -C=N group, an electron cloud on the
aromatic ring, the electronegative N,O and S atoms in the molecule, Schiff
bases may be good corrosion inhibitors. As part of our study four new Schiff
bases have been synthesised. The corrosion inhibition studies of these Schiff
bases on MS in HCl are not yet reported. Taking into consideration of above
factors, the inhibition efficiency studies of four Schiff bases towards MS in
1M HCl are investigated using weight loss and electrochemical methods. An
adsorption isotherm which describes the adsorptive behaviour of a corrosion
inhibitor provides important clues to the nature of metal inhibitor interaction
for the inhibition process. Assignment of suitable adsorption isotherms for the
corrosion inhibition of MS in the presence of Schiff bases is also attempted.

149
CHAPTER 2
MATERIALS, METHODS AND INSTRUMENTS
The corrosion inhibition efficiency of Schiff bases was determined
using weight loss measurements and electrochemical methods like
potentiodynamic polarization and electrochemical impedance spectroscopy
techniques. The method of determining the weight loss of metal coupons
exposed to the corrosive environment using laboratory immersion corrosion
testing method is the traditional and most widely used method for in situ
corrosion monitoring3,27. As a classical corrosion test method, the weight loss
coupon method has provided a great deal of useful information.
Materials
Preparation of inhibitor solution
Schiff bases FTSC, FATP, FAP and FSC were prepared by the
methods described in the Part I and employed for the corrosion inhibition
studies. The molecular structures of the Schiff bases FTSC, FSC, FAP and
FATP are also given in the Part I. 1M HCl solution is used as the test solution
(corrodent) and is prepared from the reagent grade HCl (E-Merck) using
deionised water. 0.0001M, 0.0002M, 0.0004M, 0.001M, 0.002M, 0.003M,
0.004M and 0.008M solutions of inhibitor solution were employed for
inhibition studies and were prepared by dissolving the required amount of the
FTSC, FATP, FAP and FSC in 50 ml of 1M HCl by stirring at room

150
temperature. 50 ml of 1 M HCl without inhibitor is considered as blank test
solution.
Preparation of test specimens
The MS having 99.22% Fe, 0.019% Mn, 0.28% Ni and 0.30% carbon
as determined by the chemical analysis using Philips PW 2400 model X-ray
fluorescence spectrophotometer were selected as test samples for corrosion
studies. These MS sheets were cut into coupons having 1cm x 1cm x 0.1cm
size using a LeCo VC-50 diamond wheel cutting machine and polished with
different grade emery papers (120, 220, 400, 600, 800, 1500 and 2000 grade)
to mirror polish. Then these coupons were washed with methanol, acetone
and distilled water, dried and weighed using electronic balance having
0.0001g accuracy. The exposed area of the MS coupons was found out using
Vernier calipers.
Methods
In laboratory immersion corrosion testing method, the metal coupons
are exposed to the corrosive environment like acid solutions and weight loss
of the metal coupons are measured at regular time intervals and corrosion rate
is calculated from the weight loss measurements. The inhibition capacity of
the inhibitor is calculated from the corrosion rates. In the present
investigation, American Society for Testing and Materials (ASTM) G31-72
standard procedure for laboratory immersion corrosion testing published in

151
the year 1990 was adopted for the determination of weight loss and corrosion
rate of MS coupons in HCl28,29
The polished MS coupons were immersed in hanging position in 50 ml
of test solution taken in stoppered glass bottles with the help of a fishing line
at room temperature (30°C). The specimens were taken out in 24 hours
interval, cleaned with acetone and water, dried and weighed. The weight loss
of these coupons immersed in the 1M HCl was recorded for a consecutive
seven days period.
The corrosion rate (CR), expressed in millimeter per year (mmY-1), is
calculated using the equation (1)
( ) ( )( ) ( ) ( ) )1(
g/ccin coupon of Density hours in Time cm in Areagrams in sslo Weight 87600)mmY(CR 2
1
=−
The density of the coupon is substituted with density value of
iron i.e. 7.88g/cc. The percentage inhibition efficiency ( )%WLη of a corrosion
inhibitor is calculated from the corrosion rate values using the equation (2)
( ) ( )
−=η 100x
WWW%W
'
L (2)
where W and W′ is the corrosion rate of the MS coupons in the absence and
presence of inhibitor respectively4. The surfaces of the MS coupons were
examined using Olympus Japan make BX 51 model optical microscope.

152
Electrochemical methods for corrosion rate measurement
Most corrosion phenomena are of electrochemical nature and consist of
reactions on the surface of the corroding metal. Therefore electrochemical
test methods can be used to characterise corrosion mechanism and predict
corrosion rates. Electrochemical methods are used routinely for the
evaluation of the efficiency of corrosion inhibitors30,31. The advantages of
electrochemical methods are short measurement time and mechanistic
information that they provide which help not only in the design of corrosion
protection strategies but also in the design of new inhibitors.
When a metal is immersed in a given solution, electrochemical
reactions characteristic of the metal solution interface occur at the surface of
the metal, assuming the metal to corrode. These reactions create an
electrochemical potential called the corrosion potential Ecorr or open circuit
potential at the metal solution interface. At the Ecorr the rate of oxidation
process is equal to rate of reduction. At Ecorr the system is electronically
neutral and said to be at equilibrium. The value of either the anodic or
cathodic current at E corr is called corrosion current icorr .
Calculation of corrosion rates requires determination of corrosion
currents. The corrosion rate is decided by the current produced in the
oxidation and reduction reactions. The amount of current is controlled by the
kinetics of the reactions and the diffusion of reactants both towards and away
from the electrode. The measurement of corrosion rate is actually equivalent

153
to the determination of kinetics of the corrosion electrochemical process. The
common electrochemical techniques used for the determination of corrosion
rates and the characterisation of corrosion systems are potentiodynamic
polarization and electrochemical impedance spectroscopy.
Potentiodynamic polarization method
The theoretical model used for the corrosion process assumes that the
electrochemical corrosion is an activation controlled process. In activation
controlled process, an activation controlled reaction is involved for which the
rate of reaction is controlled solely by the rate of the electrochemical charge
transfer process at the metal surface.
The Butler-Volmer equation
The fundamental formula describing the kinetics of an electrochemical
reaction is the Butler-Volmer equation developed by Butler and Volmer30,31.
The relationship between current density and potential of anodic and cathodic
electrode reactions under charge transfer control is given by the Butler –
Volmer equation as shown in the equation (3)
η
β−−
ηα
=RT
FnexpRTnFexpii
'
corr (3)
where η is the over potential defined as the difference between applied
potential E and corrosion potential Ecorr , η = E-Ecorr, i is the measured current
density, icorr is the corrosion current density, F is Faraday’s constant, R is the

154
Universal gas constant, T is the absolute temperature, n and n' are the number
of electron transferred in the anodic and cathodic reactions, and α and β are
coefficients related to the potential drop through the electrochemical double
layer32. While the Butler-Volmer equation is valid over the full potential
range, for practical applications to calculate the electrochemical corrosion
current, it has to be simplified for more restricted ranges of potential. The
two most commonly used simplified forms of the Butler –Volmer equation
are Tafel equation and the Stern–Geary equation.
The Tafel Equation and Tafel plots
The Tafel equation was first found empirically by Tafel in 19051.
This can be deduced from the equation (3) for sufficiently high values of
applied potential. As over potentials, either positive or negative, become
larger than about 5x10⁻²V, the second or the first term of Butler-Volmer
equation becomes negligible, respectively.
For anodic polarization, when η>> RT/βn′F, the following equation
are obtained.
ηα
=RTnFexpii corr (4)
i.e. ilogFRT303.2ilog
FRT303.2
corr α+
α−=η (5)
or , for cathodic polarization, when - η>> RT/αnF
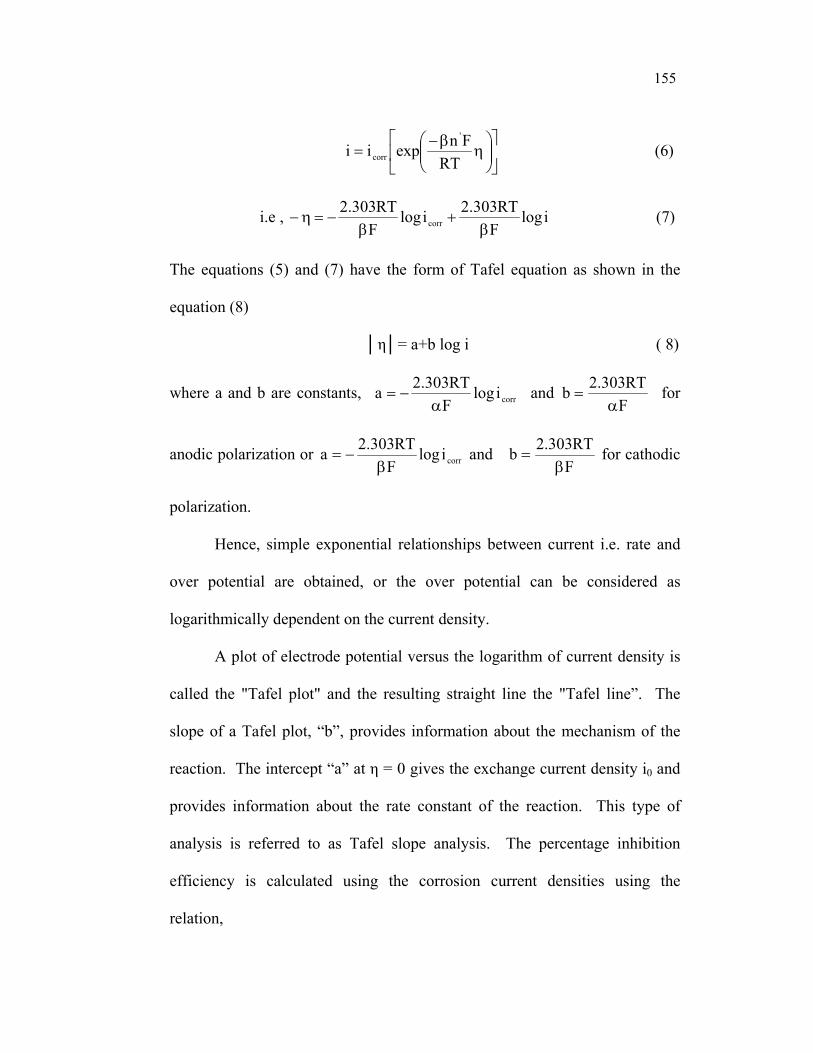
155
η
β−=
RTFnexpii
'
corr (6)
i.e , ilogFRT303.2ilog
FRT303.2
corr β+
β−=η− (7)
The equations (5) and (7) have the form of Tafel equation as shown in the
equation (8)
η= a+b log i ( 8)
where a and b are constants, corrilogFRT303.2a
α−= and
FRT303.2b
α= for
anodic polarization or corrilogFRT303.2a
β−= and
FRT303.2b
β= for cathodic
polarization.
Hence, simple exponential relationships between current i.e. rate and
over potential are obtained, or the over potential can be considered as
logarithmically dependent on the current density.
A plot of electrode potential versus the logarithm of current density is
called the "Tafel plot" and the resulting straight line the "Tafel line”. The
slope of a Tafel plot, “b”, provides information about the mechanism of the
reaction. The intercept “a” at η = 0 gives the exchange current density i0 and
provides information about the rate constant of the reaction. This type of
analysis is referred to as Tafel slope analysis. The percentage inhibition
efficiency is calculated using the corrosion current densities using the
relation,

156
100xi
ii%
corr
corr'
corrpol
−=η (9)
where icorr and i'corr are uninhibited and inhibited corrosion current densities
respectively5,25.
Electrochemical impedance spectroscopy (EIS)
Electrochemical impedance spectroscopy is a powerful technique for
the characterisation of electrochemical systems and provides a wealth of
kinetic and mechanistic information. For this reason this technique is being
applied to an increasing extent to understand corrosion process in solution, to
study rate determination, inhibitor performance, coating performance and
passive layer characteristics33-39.
Impedance, Z, is a measure of a circuit’s tendency to resist (or impede)
the flow of an alternating electrical current. The EIS instrument records the
real (resistance) and imaginary (capacitance) components of the impedance
response of the system. In EIS measurements, frequency dependent
impedance ( )ωZ is obtained by applying a sinusoidal alternating potential
signal to test system in a range of frequencies. The expression for Z(ω) is as
follows
( ) ( ) )(jZZ)tsin(I
tsinV)t(I)t(VZ "'
0
0 ω+ω=θ+ω
ω==ω (10)
157
where ω = frequency, t= time, V(t) = sinusoidal alternating potential signal,
Vo Sinωt, I(t) time dependent current response, Io sin (ωt +θ), and θ = phase
angle between V(t) and I(t).
Impedance is given by a complex number with real Z′(ω) and imaginary
Z′′(ω) component as given in the equation (11)
( ) ( ) )("' ωωω jZZZ +== (11)
where j =√-1 .
EIS applies very small voltages generally in the range of 5 to 10mV
between a specimen and a reference electrode. A typical electrochemical
impedance experimental set up consists of an electrochemical cell (the system
under investigation), a potentiostat/galvanostat, and a frequency response
analyzer (FRA). The FRA applies the sine wave and analyses the response of
the system to determine the impedance of the system.
When the impedance is measured at a number of frequencies and is
plotted on the Cartesian axes, the resulting plot is called a Nyquist plot some
time referred as Cole–Cole plot or a Complex plane plot with Z′(ω) versus
Z′′(ω) is obtained as shown in the figure 4.2.1. In the figure 4.2.1 RΩ is the
uncompensated resistance between the working electrode and reference
electrode or solution resistance, Rp is the polarization resistance at the
electrode/solution interface. At high frequencies, the impedance of the
system is almost entirely created by the ohmic resistance (solution resistance)
RΩ. The frequency reaches its high limit at the leftmost end of the semicircle,

158
where the semicircle touches the x axis. The frequency reaches its low limit
at the rightmost end of the semicircle.
Figure 4. 2. 1 A typical Nyquist plot for a simple corrosion of metal
Polarization resistance is correlated unequivocally to the corrosion
current density in the relatively simple corrosion systems characterised by a
charge transfer controlled process40. Since Rp is inversely proportional to the
corrosion current it can be used to calculate the inhibitor efficiency from the
relation
100xR
RR%
p
p'
pEIS
−=η (12)
where Rp and R′p denote polarization resistance of electrode with and
without inhibitor respectively4.

159
Equivalent circuit model
The characterisation of electrochemical systems with impedance
spectroscopy requires the interpretation of the data with the help of suitable
models. These models can be divided into two broad categories, equivalent
circuit model and process model. These models are regressed to experimental
data to estimate parameters that can describe the experimental data adequately
and can be used to predict the behaviour of the system under various
conditions. Electrochemical systems such as coated surfaces or corroding
metals often behave like simple electronic circuits. The equivalent circuit is a
simple circuit which can be built from electronic parts which behaves exactly
in the same manner of an electrochemical system built from electrodes and
electrolytes when an alternating current is applied. These models are built
with the help of well-known passive elements such as resistors, capacitors,
and inductors and distributed elements such as constant phase element and
Warburg impedance. These elements can be combined in series and parallel
to give complex equivalent circuits and certain physical meaning is then
assigned to the various elements of the equivalent circuit37, 38.
Experimental set up for electrochemical measurements
The electrochemical experiments potentiodynamic and EIS were
carried out using a computer controlled Autolab make Metro Ohm PGSTAT
30 model potentiostat/galvanostat having a frequency response analyzer set

160
up. A three electrode cell consisting of a working electrode, a platinum
counter electrode and a saturated calomel electrode (SCE) as a reference
electrode were used for the measurements.
The polished MS coupon with an exposed area of 1cm2 was used as the
working electrode. 1M HCl acid was taken as electrolyte. The working
electrode was immersed in the test solution for 2 hours prior to the
measurements to establish a steady state open circuit potential
The potentiodynamic polarization (Tafel plot method) curves were
obtained with a scan rate of 5 mV/Sec in the potential range from -250mV to
+250mV relative to the open circuit potential. All the potentials reported
versus that of the SCE. Corrosion current density values were obtained by
Tafel extrapolation method. The percentage inhibition efficiency is calculated
using the corrosion current densities using the relation (9).
The three electrode cell and other setup used for potentiodynamic
polarization were used for the EIS measurements along with a Frequency
response analyzer. EIS measurements were performed at open circuit
potential in the frequency range from 20 kHz to 20 mHz with a 5 mV sine
wave as excitation signal.
From impedance measurements, the percentage inhibition efficiency is
calculated using the expression (12)

161
Adsorption isotherm studies
Adsorption plays an important role in the inhibition of metallic
corrosion by organic inhibitors. Adsorption isotherms are often shown to
demonstrate the performance of organic adsorbent type inhibitors and
important in determining the mechanisms of organic electrochemical
reactions. Establishment of isotherms that describe the adsorptive behaviour
of a corrosion inhibitor is an important part of its study as they can provide
important clues to the nature of metal inhibitor interaction. Three types of
adsorption isotherms are usually cover all the data relating to adsorption
isotherms. The most frequently used adsorption isotherms are Langmuir,
Temkin and Frumkin isotherms having the following surface coverage–bulk
concentration relationships1:
for Langmuir isotherm, KC1
=θ−
θ (13)
for Frumkin isotherm, KCe1
f =θ−
θ θ (14)
for Temkin isotherm, efθ = KC (15)
where θ is the degree of surface coverage, C is the inhibitor concentration in
the solution and K is the equilibrium constant or the molecular interaction
constant, a coefficient expressing interaction between adsorbed and adsorbing
molecule. The plots are usually given as θ−
θ1
log versus log C for Langmuir

162
isotherm, )1(C
logθ−
θ versus θ for Frumkin isotherm and θ versus log C for
Temkin isotherm. The plots which give straight line will be best suitable
adsorption isotherm. The values of θ can be calculated from the percentage
inhibition efficiency values obtained from weight loss method using the
following relation 25.
100
efficiency inhibition Percentage=θ (16)
Calculation of thermodynamic parameters
The values of activation energy for steel corrosion reaction (Ea) were
obtained from Arrhenius equation. The activation energy values were
calculated from the slopes of the log(corrosion rate) vs 1/T plots26,42,43. The
equilibrium constant for adsorption process is related to the free energy of
adsorption, ∆Gads by the relation
∆Gads = -RT ln (55.5Kads) (17)
where R is universal gas constant, T temperature in absolute scale, K is the
equilibrium constant for adsorption process and 55.5 concentration of water in
the solution5,41. The Kads is given by the relation
( ) inhads C1
Kθ−θ
= (18)
where θ is the degree of coverage on the metal surface and Cinh the
concentration of inhibitor in mol L-1.

163
Instruments
The following instruments are used for this study.
1. Philps Netherlands make PW 2400 model X-ray fluorescence
(XRF) spectrophotometer
2. LeCo VC -50 USA make diamond wheel cutting machine
3. Olympus Japan make BX 51 model optical microscope
4. Autolab make MetroOhm PGSTAT 30 model Potentiostat/
Galvanostat having a frequency response analyzer set up with
computer control.

164
CHAPTER 3
CORROSION INHIBITION STUDIES OF
SCHIFF BASES ON MILD STEEL IN 1M HCl
The results of weight loss experiments and electrochemical analysis
carried out to find the corrosion inhibition efficiencies of Schiff bases FTSC,
FATP, FAP and FSC on MS in HCl are presented in this chapter.
Weight loss method
The weight loss occurred for the MS coupons immersed in blank,
0.0001M, 0.0002M, 0.0004M, 0.001M, 0.002M, 0.003M, 0.004M and
0.008M inhibitor solutions of Schiff bases FTSC, FATP, FAP and FSC
prepared in 1M HCl solution, after 24 hours are given in table 4.3.1. The
figure 4.3.1 is the photograph of MS coupons after 48 hours immersion in
blank and different concentrations of FTSC inhibitor solutions. It is clear
from the photograph that the coupons immersed in the inhibitor solutions
were least corroded while the coupon in blank solution was severely corroded.
With increase in concentration a film formation on the surface of coupons
were observed. The optical microscopic images of the immersed MS
coupons for 24 hours in the blank solution and 0.003M solution of FATP are
given in the figure 4.3.2. The surface of the MS coupons immersed in the
blank solution was completely corroded as visible in the picture 4.3.2 (a).
The surface of the MS coupon immersed in the 0.003M FATP solution was

165
less corroded as observed in the figure 4.3.2(b) showing the inhibition
capacity of the inhibitor used. The weight loss recorded in 24 hours interval
for MS coupons immersed in the above eight concentrations of inhibitor
solutions of FTSC, FATP, FAP, FSC and blank for seven days duration were
plotted against immersion time and given in the figures 4.3.3 to 4.3.6.
Table 4. 3. 1 Weight loss occurred for MS in 24 hours time
with and without inhibitor
Weight loss (mg/cm2 ) Concentration
[M] FTSC FATP FAP FSC
Blank 162.66
0.0001 35.42 48.47 63.27 158.53
0.0002 20.77 31.86 47.49 154.10
0.0004 8.77 24.07 40.48 149.68
0.001 4.55 12.16 27.43 74.05
0.002 3.48 12.91 20.32 54.53
0.003 2.14 5.39 16.77 39.89
0.004 3.27 3.57 9.76 38.88
0.008 2.36 2.14 5.23 26.36

166
Figure 4. 3. 1 Photograph of MS coupons taken out after 48 hours
immersion in blank and FTSC inhibitor solutions. From left to right-
blank, 0.0001M, 0.0002M, 0.0004M, 0.001M, 0.002M, 0.003M of FTSC
( a ) (b)
Figure 4. 3. 2 Optical microscope images of MS coupons after 24 hours
immersion (a) blank and (b) 0.003 M FATP inhibitor solution

167
20 40 60 80 100 120 140 160 1800
10
20
30
40
50
60
70
80
Time (Hours)0.0001M
Blank 0.0002 M 0.0004 M 0.001 M 0.002 M 0.003 M 0.004 M 0.008 M
Wei
ght l
oss
(mg/
cm2 )
Time (Hours)
20 40 60 80 100 120 140 160 1800
50
100
150
200
250
300
350
400
Wei
ght l
oss
( mg/
cm2 )
Figure 4. 3. 3 Comparison of weight loss occurred for MS coupons
immersed in different concentrations of FTSC and blank for seven days.
(The weight loss for the Blank and 0.0001M are given as insert graph)
20 40 60 80 100 120 140 160 1800
50
100
150
200
250
300
350
400
B lank 0.0001 M 0.0002 M 0.0004 M 0.001 M 0.002 M 0.004 M
Wei
ght l
oss
(mg/
cm2 )
T im e (hours)
Figure 4. 3. 4 Comparison of weight loss occurred for MS coupons
immersed in different concentrations of FATP and blank for seven days

168
20 40 60 80 100 120 140 160 180
0
50
100
150
200
250
300
350
400
Blank 0.0001 M 0.0002 M 0.0004 M 0.001 M 0.002 M 0.003 M 0.004 M 0.008 M
Wei
ght l
oss
(mg/
cm2 )
Time (hours)
Figure 4. 3. 5 Comparison of weight loss occurred for MS coupons
immersed in different concentrations of FAP and blank for seven days
20 40 60 80 100 120 140 160 1800
100
200
300
400
Blank 0.0001 M 0.0002 M 0.0004 M 0.001 M 0.002 M 0.003 M 0.004 M 0.008 M
Wei
ght l
oss
(mg/
cm2 )
Time (Hours)
Figure 4. 3. 6 Comparison of weight loss occurred for MS coupons
immersed in different concentrations of FSC and blank for seven days

169
0.000 0.002 0.004 0.006 0.008
0
20
40
60
80
100
120
140
160
180
FTSC FATP FAP FSC
Wei
ght l
oss
(mg/
cm2 )
Molar concentration of Inhibitor
Figure 4. 3. 7 Comparison of weight loss of MS immersed in FTSC,
FATP, FAP and FSC inhibitor solutions for 24 hours time.
Minimum weight loss was occurred for the coupons immersed in the
inhibitor solution with high concentrations. Similar trends of decreasing the
weight loss with increase in inhibitor concentration were noticed for all Schiff
base studied. The loss of weight of the coupons in acid solutions was more
in the case of FSC and least in the case of FTSC. Among the studied Schiff
bases weight loss was decreasing in the order FTSC<FATP<FAP<FSC as
shown in the figure 4.3.7. It is clear from figures 4.3.3 to 4.3.6 that, the
weight loss of Schiff bases containing systems fall below, with respect to
Schiff bases free system indicating the inhibitive properties of the four Schiff
bases.
170
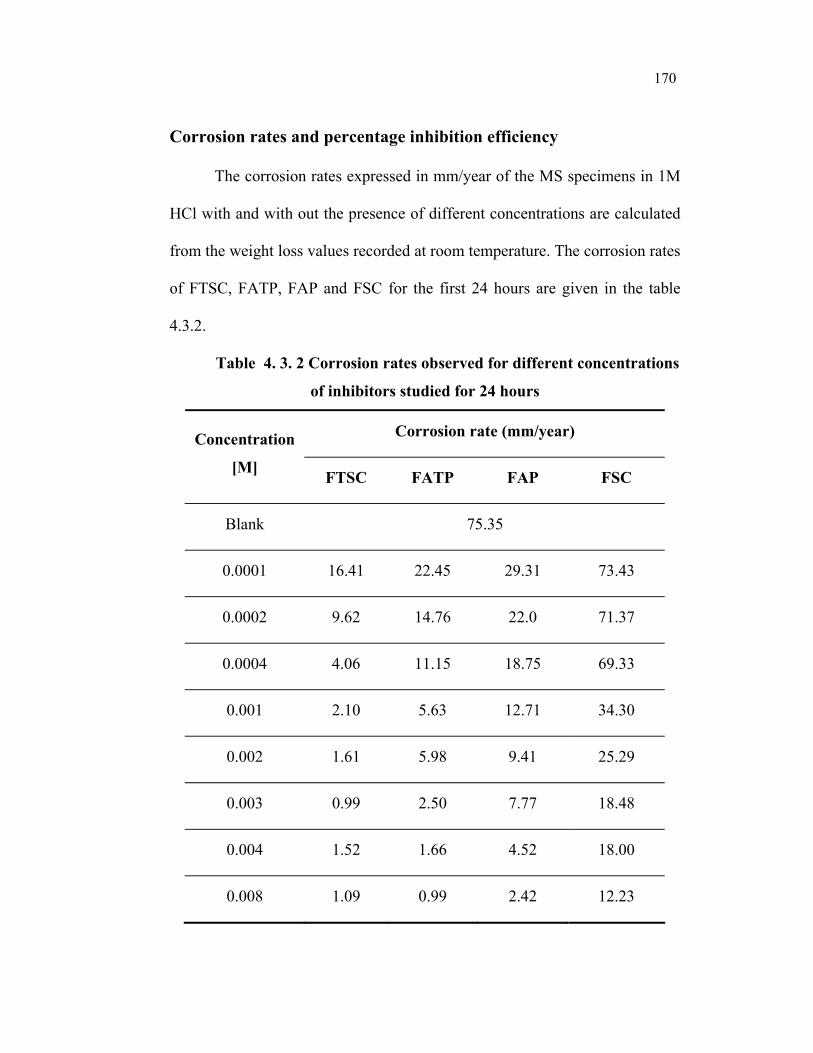
Corrosion rates and percentage inhibition efficiency
The corrosion rates expressed in mm/year of the MS specimens in 1M
HCl with and with out the presence of different concentrations are calculated
from the weight loss values recorded at room temperature. The corrosion rates
of FTSC, FATP, FAP and FSC for the first 24 hours are given in the table
4.3.2.
Table 4. 3. 2 Corrosion rates observed for different concentrations
of inhibitors studied for 24 hours
Corrosion rate (mm/year) Concentration
[M] FTSC FATP FAP FSC
Blank 75.35
0.0001 16.41 22.45 29.31 73.43
0.0002 9.62 14.76 22.0 71.37
0.0004 4.06 11.15 18.75 69.33
0.001 2.10 5.63 12.71 34.30
0.002 1.61 5.98 9.41 25.29
0.003 0.99 2.50 7.77 18.48
0.004 1.52 1.66 4.52 18.00
0.008 1.09 0.99 2.42 12.23

171
It was observed that the corrosion rate was decreasing with increase in
concentration of the Schiff base inhibitor used. The lowest corrosion rates
were observed for the higher concentrations of inhibitor solutions. FTSC has
shown least corrosion rates among the four Schiff bases studied.
The percentage inhibition efficiencies of the Schiff base inhibitors
towards the MS in 1M HCl were found out from the corrosion rates obtained
for 24 hours and are given in the table 4.3.3.
Table 4. 3. 3 Corrosion inhibition efficiencies obtained for FTSC, FATP,
FAP and FSC inhibitors
Concentration
[M]
FTSC
η WL%
FATP
η WL%
FAP
η WL%
FSC
η WL%
0.0001 78.82 70.2 61.00 2.53
0.0002 87.23 80.4 70.80 5.28
0.0004 94.61 85.2 75.11 7.98
0.001 97.21 92.52 83.12 54.47
0.002 97.86 92.06 87.51 66.47
0.003 98.68 96.68 89.69 75.47
0.004 97.98 97.80 94.00 76.00
0.008 98.55 98.68 96.79 83.80

172
In the case of FTSC an efficiency of ≈95% was achieved for a
comparatively lower concentration of 0.0004M equivalent to 106ppm
(0.016%) and a maximum efficiency of 98.68% at concentration of 0.003M
corresponding to 796ppm (0.0796%). It is also observed that the inhibition
efficiency of the FTSC was not further increased after 0.003M. 0.003 M is
found to be the optimum concentration for FTSC. In the case of FATP more
than 90% efficiency was obtained for 0.001M corresponding to 300ppm
(0.03%) and maximum of 98.68% for 0.008M corresponding to 2400 ppm
(0.12%). In the case of FAP 90% efficiency attained for a concentration of
0.003M corresponding to 850ppm (0.085%) and a maximum of 96% at
0.008M. Among the four Schiff bases studied the lowest inhibition efficiency
was observed in the case of FSC with a maximum efficiency of 83.5%
achieved at the highest concentration of 0.008M corresponding to 2286ppm
(0.2286%).
To compare the performance of the Schiff bases, the percentage
inhibition efficiencies obtained were plotted against the concentrations of
inhibitor solutions used and are shown in the figure 4.3.8. It has been found
that all these Schiff bases inhibit the corrosion of MS in HCl solution at all
concentrations used in this study except in the case of few lower
concentrations of FSC. It is also noticed that the inhibition efficiency for all
these compounds increase with increase in the concentration of inhibitor.

173
Among the four Schiff bases studied the FTSC shows maximum inhibition
efficiency and follows the order FTSC>FATP>FAP>FSC
0.0000 0.0015 0.0030 0.0045 0.0060 0.0075 0.00900
20
40
60
80
100
FTSC FATP FAP FSC
Perc
enta
ge in
hibi
tion
effic
ienc
y
Inhibitor Concentration [M]
Figure 4. 3. 8 Plot of percentage inhibition efficiencies against the
concentration of Schiff bases FTSC, FATP, FAP and FSC.
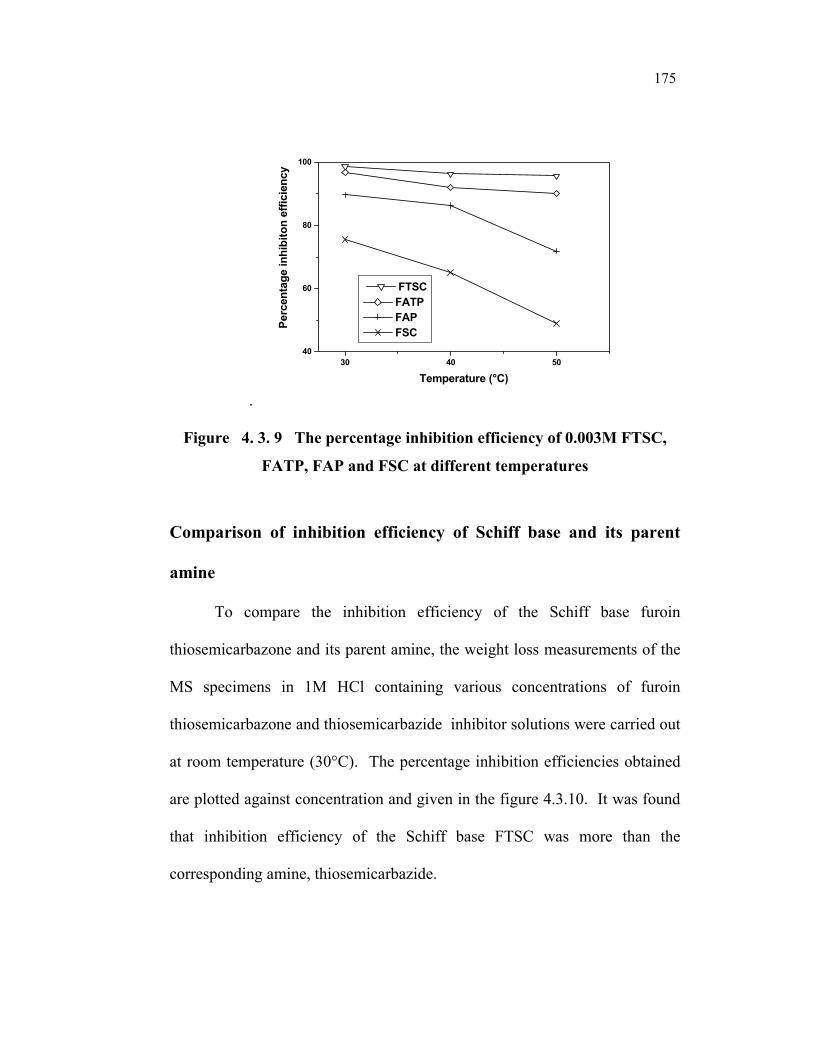
Effect of Temperature on the performance of Schiff base inhibitors
To study the effect of temperature on the inhibition efficiency, weight
loss measurements of MS specimens were carried at three different
temperatures 30°C, 40°C and 50°C with 0.003 M inhibitor solution of the
Schiff bases FTSC, FATP, FAP and FSC. The weight loss recorded,
corrosion rate and percentage inhibition efficiency are given in the table 4.3.4.
The percentage inhibition efficiencies obtained for four Schiff bases at
different temperatures are plotted and shown in the figure 4.3.9. Inhibition
efficiencies found to decrease with increase in temperature.

174
Table 4. 3. 4 Weight loss, corrosion rate and percentage inhibition
efficiency of 0.003M solutions of FTSC, FATP, FAP and FSC
at different temperatures
Inhibitor Temp. (°C)
Weight loss
(mg/cm2)
Corrosion rate (mm/year)
Per. inhibition efficiency (η WL%)
30 162.66 75.35
40 207.80 96.25 Blank
50 319.18 147.84
-
30 2.14 0.99 98.68
40 7.59 3.51 96.35 FTSC
50 13.76 6.37 95.68
30 5.39 2.50 96.68
40 16.52 7.65 92.05 FATP
50 31.58 14.63 90.10
30 16.77 7.77 89.69
40 28.46 13.18 86.3 FAP
50 58.37 27.04 71.90
30 39.89 18.48 75.47
40 72.66 33.65 65.03 FSC
50 162.58 75.31 49.06
175
.
30 40 5040
60
80
100
FTSC FATP FAP FSCPe
rcen
tage
inhi
bito
n ef
ficie
ncy
Temperature (°C)
Figure 4. 3. 9 The percentage inhibition efficiency of 0.003M FTSC,
FATP, FAP and FSC at different temperatures
Comparison of inhibition efficiency of Schiff base and its parent
amine
To compare the inhibition efficiency of the Schiff base furoin
thiosemicarbazone and its parent amine, the weight loss measurements of the
MS specimens in 1M HCl containing various concentrations of furoin
thiosemicarbazone and thiosemicarbazide inhibitor solutions were carried out
at room temperature (30°C). The percentage inhibition efficiencies obtained
are plotted against concentration and given in the figure 4.3.10. It was found
that inhibition efficiency of the Schiff base FTSC was more than the
corresponding amine, thiosemicarbazide.

176
0.000 0.001 0.002 0.00360
70
80
90
100
Furoin thiosemicarbazone ThiosemicarbazidePe
r. In
hibi
tion
effic
ienc
y
Concentration [M]
Figure 4. 3. 10 Plot of percentage inhibition efficiency against different
concentration of FTSC and thiosemicarbazide
Potentiodynamic polarization studies
Typical Tafel polarization curves obtained for MS in 1M HCl with and
without the presence of different concentrations of FTSC are shown in the
figure 4.3.11. Various corrosion parameters such as corrosion potential
(Ecorr), corrosion current density (icorr) and percentage inhibition efficiency,
( %polη ) are given in table 4.3.5.
It is observed that the presence of Schiff base inhibitor lowers icorr
values. The corrosion current obtained for MS coupons tested in the FTSC
inhibitor solutions are lower than solution without FTSC i.e. blank. This
shows that the presence of FTSC lowers icorr values. A lowest icorr value was
observed for a FTSC concentration of 0.002M. The percentage inhibition

177
efficiency increases with increase in the inhibitor concentrations and a
maximum efficiency of 97.68 % was obtained for a low concentration of
0.002M corresponding to 531ppm (0.0053%). The inhibition efficiency was
found to remain constant after achieving maximum efficiency at 0.002M.
This trend was also noticed in the case of weight loss measurements. It is also
observed from the table that there is no significant change in Ecorr values of
inhibited and uninhibited systems.
Table 4. 3. 5 Electrochemical polarization parameters for MS in 1M
HCl containing different concentrations of FTSC
Concentration [M]
Ecorr (V)
icorr
(A/cm2)
Per. inhibition efficiency (η pol %)
Blank -0.461 4.747 x 10⁻³ -
FTSC 0.0001 -0.464 1.373 x 10⁻³ 71.08
FTSC 0.0002 -0.478 1.42 x 10⁻³ 70.09
FTSC 0.0004 -0.469 1.44 x 10⁻³ 69.67
FTSC 0.001 -0.469 9.755 x 10⁻⁴ 79.41
FTSC 0.002 -0.476 1.102 x 10⁻⁴ 97.68
FTSC 0.003 -0.457 4.361 x 10⁻⁴ 90.81
FTSC 0.004 -0.445 4.149 x 10⁻⁴ 91.26
FTSC 0.008 -0.476 3.992 x 10⁻⁴ 91.59

178
-5.0 -4.5 -4.0 -3.5 -3.0 -2.5 -2.0 -1.5 -1.0 -0.5-0.8
-0.7
-0.6
-0.5
-0.4
-0.3
-0.2
Blank 0.0001 M 0.0004 M 0.002 M 0.003 M 0.008 M
E (V
)
log I (A/cm2)
Figure 4. 3. 11 Tafel plots of MS in 1M HCl in presence of
different concentrations of FTSC
The potentiodynamic polarization curves obtained for the other three
Schiff bases FATP, FAP and FSC for an inhibitor concentration of 0.008M
are shown in figure 4.3.12, to 4.3.14 and the electrochemical parameters
obtained are summerised in table 4.3.6. The corrosion current densities for
the 0.008 M solutions of the four Schiff bases are found to decrease in the
order FSC>FATP>FAP>FTSC. The variation of percentage inhibition
efficiencies achieved at 0.008 M were found to follow the order
FTSC>FAP>FATP>FSC.

179
Table 4. 3. 6 Electrochemical polarization parameters for MS in 1M
HCl containing 0.008 M of FTSC, FATP, FAP and FSC
Concentration
of inhibitor [M]
E corr (V)
i corr
(A/cm2)
Per. inhibition efficiency (η pol %)
Blank -0.461 4.747 x 10⁻³ -
FTSC 0.008 -0.476 3.992 x 10⁻⁴ 91.59
FATP 0.008 -0.425 1.212 x 10⁻³ 74.47
FAP 0.008 -0.441 3.953 x 10⁻⁴ 90.04
FSC 0.008 -0.456 2.532 x 10⁻³ 44.13
-4.0 -3.5 -3.0 -2.5 -2.0 -1.5 -1.0
-0.7
-0.6
-0.5
-0.4
-0.3
-0.2
-0.1
0.008 M FATP Blank
E(V)
log I ( A / cm2)
Figure 4. 3. 12 Tafel plots of MS in 1M HCl with and
without 0.008 M FATP

180
-5.0 -4.5 -4.0 -3.5 -3.0 -2.5 -2.0 -1.5 -1.0 -0.5-0.8
-0.7
-0.6
-0.5
-0.4
-0.3
-0.2
0.008 M FAP Blank
E(V)
log I ( A/cm2)
Figure 4. 3. 13 Tafel plots of MS in 1M HCl with and
without 0.008 M FAP
-4.0 -3.5 -3.0 -2.5 -2.0 -1.5 -1.0 -0.5-0.8
-0.7
-0.6
-0.5
-0.4
-0.3
-0.2
Blank 0.008 M FSC
E(V)
log I ( A / cm2)
Figure 4. 3. 14 Tafel plots of MS in 1M HCl with and
without 0.008 M FSC

181
Electrochemical impedance spectroscopy
Nyquist plots of MS in 1M HCl in the presence and absence of
different concentrations of FTSC are shown in the figure 4.3.15. The
impedance parameters like polarization resistance (Rp), solution resistance
(Rs), constant phase element or double layer capacitance (CPE), n and
percentage inhibition efficiency calculated from the Rp values are given in the
table 4.3.7.
Table 4. 3. 7 Impedance parameters and inhibition efficiency for the
corrosion of MS with and without different concentrations of FTSC
Con. [M]
Rs
(ohm) Rp
(ohm) CPE
(µF/cm2) n
Per. inhibition efficiency (η EIS %)
Blank 0.9523 4.69 279.53 0.8179
0.0001 0.7904 10.60 164.50 0.8018 55.72
0.0002 1.0470 16.47 157.05 0.7998 71.50
0.0004 1.0846 11.20 129.57 0.8065 58.06
0.001 0.8800 13.65 114.99 0.7790 65.61
0.002 0.9811 146.92 11.48 0.7996 96.80
0.003 0.7947 45.95 69.01 0.8195 89.78
0.004 0.7946 54.13 102.69 0.7984 91.33
0.008 0.9473 53.05 36.75 0.7192 91.15

182
All the Nyquist plots obtained were semicircle in nature and display a
single capacitive loop as seen in the figure 4.3.15. The diameter of the
semicircles was increased with increase in inhibitor concentration. The
results also show that Rp values were increased with increase in additive
concentration. The percentage inhibition efficiencies calculated from the Rp
indicate that the inhibition efficiency increases with increase in FTSC
concentration. A maximum inhibition efficiency of 96.80% was achieved for
the 0.002M FTSC and for further increase in concentration, inhibition
efficiency remained almost same as observed in the weight loss and Tafel
methods.
0 20 40 60 80 100 120 140 1600
20
40
60
80
100
0.0001M 0.003 M0.008 M
0.004 M
0.0002 M
Blank
0.002 M
-Z(Im
ag)/(
ohm
)
(Z)(Real)/(ohm)
Figure 4. 3. 15 Nyquist plots for MS in 1M HCl in the presence and
absence of different concentrations of FTSC

183
To study the inhibition efficiency of the other three Schiff bases FATP,
FAP and FSC, EIS spectrum of the 0.008M solutions of these inhibitors were
recorded as earlier. The Nyquist plot of the 0.008 M FTSC, FATP, FAP and
FSC are given in the figure 4.3.16. The impedance parameters Rp, Rs, CPE, n
and percentage inhibition efficiency, η EIS % are given in the table 4.3.8. As
in the case of FTSC, for other three Schiff bases also, the obtained Nyquist
plots are semicircle shaped with one single capacitive loop. The diameter of
semicircles and Rp values were varied with respect to their inhibition
efficiency.
Table 4. 3. 8 Impedance parameters for corrosion of MS in 1M HCl
with 0.008M solutions of FTSC, FAP, FATP and FSC.
Inhibitor Rs (ohm)
Rp (ohm)
CPE (µF/cm2) n
Per. inhibition efficiency (η EIS %)
Blank 0.9523 4.69 279.53 0.8179 -
FTSC 0.9473 53.05 36.75 0.7192 91.15
FATP 0.9668 26.85 46.39 0.6650 82.52
FAP 0.9932 47.15 67.41 0.7383 90.04
FSC 0.8317 8.08 267.86 0.8026 41.90

184
0 5 10 15 20 25 30 35 40 45 50 55 600
10
20
30
40
50
FSCFTSC
FAPFATP
(Z)(Real)/(ohm)
-ZIm
ag(o
hm)
Figure 4. 3. 16 Nyquist plots for MS in 1M HCl in the presence of
0.008M FTSC, FATP, FAP and FSC
Adsorption isotherm studies
In order to understand the mechanism of corrosion inhibition, the
adsorption behaviour of the organic adsorbate on the metal surface must be
known. The degree of the surface coverage (θ) was evaluated from the
weight loss measurement results of MS in 1 M HCl in the presence and
absence of the four Schiff bases conducted at 30°C using the equation (16) of
chapter 2. The values of surface coverage (θ) for four Schiff bases are given
in the table 4.3.9. The data were tested graphically by fitting to various
isotherms like Langmuir, Frumkin and Temkin isotherms. The Frumkin and
Temkin isotherm did not yield a satisfactory description of the experimental
adsorption behaviour. Among the three isotherms assessed Langmuir
isotherm found to provide best description of the adsorption behaviour of the

185
investigated Schiff bases. The plots of θ−
θ1
log versus logC give straight
lines and shows that the adsorption of studied Schiff base obeys Langmuir
adsorption isotherm. The Langmuir isotherm plots of FTSC, FATP, FAP and
FSC are shown in the figures 4.3.17 to 4.3.20.
Table 4. 3. 9 The value of θ for the Schiff bases FTSC, FATP, FAP and
FSC calculated from weight loss measurement results
Degree of surface coverage (θ) Con.
[M] FTSC FATP FAP FSC
0.0001 0.7822 0.7020 0.6110 0.0255
0.0002 0.8723 0.8040 0.7080 0.0528
0.0004 0.9461 0.8520 0.7512 0.0799
0.001 0.9721 0.9252 0.8313 0.5448
0.002 0.9798 0.9206 0.8751 0.6644
0.003 0.9868 0.9668 0.8969 0.7547
0.004 0.9798 0.9779 0.9400 0.7611
0.008 0.9855 0.9868 0.9679 0.8377

186
-4.0 -3.6 -3.2 -2.8 -2.4 -2.00.4
0.8
1.2
1.6
2.0
log(θ/(1−θ))
log [C]
Figure 4. 3. 17 Langmuir adsorption isotherm of FTSC
on MS in 1M HCl
-4.0 -3.6 -3.2 -2.8 -2.4 -2.0
-0.4
0.0
0.4
0.8
1.2
1.6
2.0
log(θ/(1−θ))
log [C]
Figure 4. 3. 18 Langmuir adsorption isotherm of FATP on
MS in 1M HCl

187
-4.0 -3.5 -3.0 -2.5 -2.0
0.0
0.2
0.4
0.6
0.8
1.0
1.2
1.4
log(θ/(1−θ))
log C
Figure 4. 3. 19 Langmuir adsorption isotherm of FAP on
MS in 1M HCl
-4.0 -3.6 -3.2 -2.8 -2.4 -2.0
-1.6
-1.2
-0.8
-0.4
0.0
0.4
0.8
log(θ/(1−θ))
log [C]
Figure 4. 3. 20 Langmuir adsorption isotherm of FSC
on MS in 1M HCl

188
The activation energy for the corrosion of MS in IM HCl in the
presence and absence of 0.003M FTSC, 0.003M FATP, 0.003M FAP and
0.003M FSC solutions are calculated using the Arrhenius equation. The
logarithmic values of corrosion rates obtained at temperatures 30°C, 40°C
and 50°C for the blank and 0.003 M FTSC, FATP, FAP and FSC are plotted
against 1000/T. From the slope of these Arrhenius plots activation energies
are calculated. The Arrhenius plots of blank, 0.003 M FTSC, 0.003 M
FATP, 0.003 M FAP and 0.003 M FSC are shown in the figure 4.3.21. The
activation energy for the corrosion of MS in 1M HCl in the presence of
0.003M solutions is given in the table 4.3.10.
3.10 3.15 3.20 3.25 3.30
0.0
0.5
1.0
1.5
2.0
2.5
FTSC FATP
FAPFSC
Blank
Log
(Cor
r.Rat
e)
(1000/T)
Figure 4. 3. 21 Plots of log corrosion rate vs. 1000/T for blank and
0.003M solutions of FTSC, FATP, FAP and FSC

189
Table 4. 3. 10 The activation energy and enthalpy of adsorption
obtained for the Schiff base inhibitors
Schiff base Ea( kJmol-1) ∆Hads
(kJmol-1)
Blank 27.28 -
FTSC 76.01 -49.871
FATP 72.07 -47.61
FAP 50.65 -49.52
FSC 57.06 -47.18
The free energy of adsorption (∆Gads) for the corrosion of MS in 1M
HCl in the presence of four Schiff bases was calculated using the relation
(17). The free energy of adsorption for the corrosion of MS in 1M HCl for
the four Schiff bases is given in the table 4.3.11. The values for free energy
of adsorption for the corrosion inhibition are negative.
The Langmuir adsorption isotherm may be expressed by the
following equation13
RT303.2QClogAlog
1log ads−+=
θ−θ (19)
The heats of adsorption (Qads), obtained from the slopes of the linear
portion of the log Kads vs 1000/T curves which are equal to –Q/ (2.303 R). In
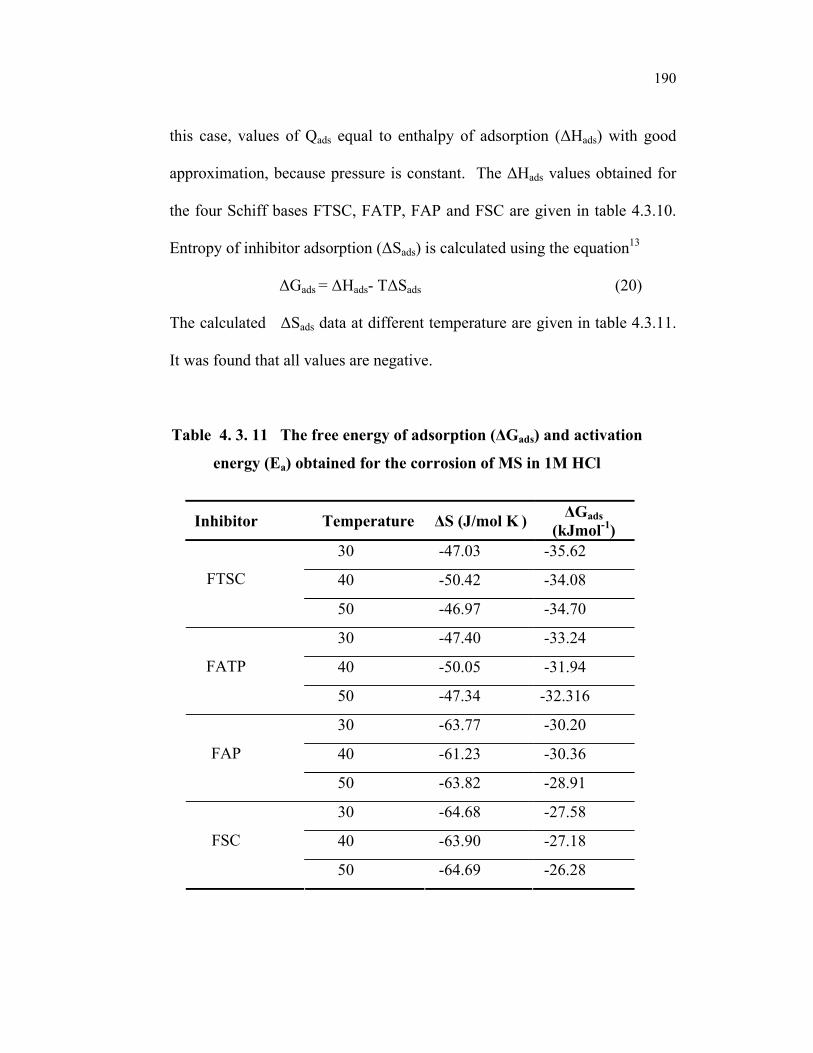
190
this case, values of Qads equal to enthalpy of adsorption (∆Hads) with good
approximation, because pressure is constant. The ∆Hads values obtained for
the four Schiff bases FTSC, FATP, FAP and FSC are given in table 4.3.10.
Entropy of inhibitor adsorption (∆Sads) is calculated using the equation13
∆Gads = ∆Hads- T∆Sads (20)
The calculated ∆Sads data at different temperature are given in table 4.3.11.
It was found that all values are negative.
Table 4. 3. 11 The free energy of adsorption (∆Gads) and activation
energy (Ea) obtained for the corrosion of MS in 1M HCl
Inhibitor Temperature ∆S (J/mol K ) ∆Gads (kJmol-1)
30 -47.03 -35.62
40 -50.42 -34.08 FTSC
50 -46.97 -34.70
30 -47.40 -33.24
40 -50.05 -31.94 FATP
50 -47.34 -32.316
30 -63.77 -30.20
40 -61.23 -30.36 FAP
50 -63.82 -28.91
30 -64.68 -27.58
40 -63.90 -27.18 FSC
50 -64.69 -26.28
191
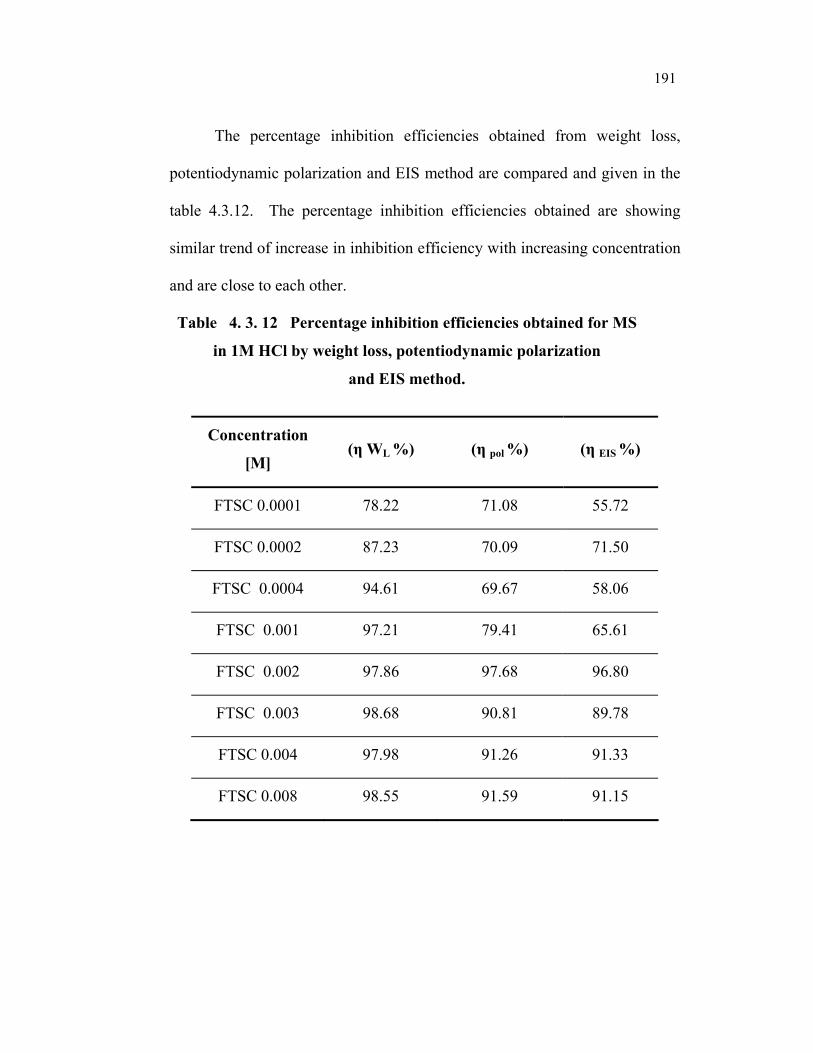
The percentage inhibition efficiencies obtained from weight loss,
potentiodynamic polarization and EIS method are compared and given in the
table 4.3.12. The percentage inhibition efficiencies obtained are showing
similar trend of increase in inhibition efficiency with increasing concentration
and are close to each other.
Table 4. 3. 12 Percentage inhibition efficiencies obtained for MS
in 1M HCl by weight loss, potentiodynamic polarization
and EIS method.
Concentration
[M] (η WL %) (η pol %) (η EIS %)
FTSC 0.0001 78.22 71.08 55.72
FTSC 0.0002 87.23 70.09 71.50
FTSC 0.0004 94.61 69.67 58.06
FTSC 0.001 97.21 79.41 65.61
FTSC 0.002 97.86 97.68 96.80
FTSC 0.003 98.68 90.81 89.78
FTSC 0.004 97.98 91.26 91.33
FTSC 0.008 98.55 91.59 91.15

192
Discussion
The basic action of an inhibitor is attributed to an increase in over
voltage of the hydrogen ion discharge as cathodic reaction of corrosion
process or an increase in ohmic resistance of an inhibitor film at the metal
electrolyte interface or due to some type of adsorption on the metal surface.1
The organic inhibitors like Schiff bases generally inhibit the corrosion process
through adsorption of the inhibitor on the metal solution interface44. The
adsorption was considered either as physical adsorption or chemical
adsorption. The physical adsorption may be due to the electrostatic attractive
forces between ionic charges or dipoles on the adsorbed species and the
electric charge on the metal at the metal/solution interface. The forces in
electrostatic adsorption are generally weak. The inhibiting species adsorbed
on the metal due to electrostatic force can also be desorbed easily. A main
feature of the electrostatic adsorption is that the ions are not in direct physical
contact with the metal. A layer of water molecule separates the metal from
the ions. The physical adsorption process has low activation energy and is
relatively independent of temperature1.
In chemisorption the adsorbed species is in contact with the metal
surface. A coordinate type of bond involving electron transfer from inhibitor
to the metal is assumed to take place in the process45. The chemisorption
process is slower than the electrostatic sorption that has higher activation
energy. The temperature dependency shows that higher inhibition efficiencies

193
at higher temperatures. Unlike electrostatic adsorption, it is specific for
certain metals and is not completely reversible.
Weight loss method
In this study it has been found that all the four Schiff bases FTSC,
FATP, FAP and FSC inhibit the corrosion of MS in HCl at all concentrations
of Schiff bases used. It can be seen that inhibition efficiency increases with
increase in inhibitor concentration. All the inhibitors reduce the corrosion
rate to a significant extent showing higher inhibition efficiencies. The results
of the corrosion inhibition studies of four Schiff bases on MS in 1M HCl by
weight loss measurements clearly indicates that all studied Schiff bases act as
efficient corrosion inhibitors for MS in HCl media as reported in the similar
type of Schiff base materials4,5,12,13 .
It was also observed that the corrosion inhibition efficiency is
increasing with increase in Schiff base concentration. The increase in the
inhibition efficiencies for MS corrosion in 1M HCl with increasing Schiff
base concentration suggests that inhibition is a result of adsorption of
inhibitor on the metal surface and these compounds act as adsorption
inhibitors5.
It was observed that corrosion inhibition efficiency of all the four
Schiff bases towards MS in 1M HCl was found to decrease with increase of
temperature. The decrease in inhibition efficiency with increasing

194
temperature, suggest a weak adsorption interaction between MS surface and
the additives, which is physical in nature23. This may due to desorption of
some adsorbed molecule from the MS surface with increase of
temperature5,23. This observation reiterates that type of adsorption is physical
in nature because if the adsorption was chemisorption type then the efficiency
will be increased with increase in temperature26. The inhibition efficiency of
the Schiff base, furoin thiosemicarbazone was more than corresponding
parent amine thiosemicarbazide. The presence of higher electron density of
the -C=N– group which is not present in the parent amine is responsible for
the higher inhibition efficiency of the Schiff base than its corresponding
amine. Thus conversion of an amine to Schiff base increases its inhibition
capacity 5,13,15,46.
Tafel plot analysis
The typical Tafel polarization curves obtained for different
concentrations of FTSC and blank shows the change in shape of the cathodic
and anodic curves. The corrosion parameters like icorr values of the inhibited
systems are lower than the uninhibited systems and icorr values decreases with
increase in concentration of FTSC. Thus the inhibition efficiency was
increasing with increasing concentration of the Schiff base as reported
earlier4,5,13,15. Increase in inhibition efficiency with increase of the
concentration of the studied Schiff bases shows that inhibition actions are due

195
to the adsorption on steel surface13. It is also observed from the polarization
results that there is no significant change in Ecorr values of inhibited and
uninhibited systems. This shows that the addition of studied Schiff bases
affected both anodic and cathodic reaction suggesting that the Schiff base
FTSC is a mixed type (anodic/cathodic) inhibitor 13,26.
The low values of the corrosion current obtained for the 0.008M
solutions of FATP, FAP and FSC compared to the blank values also reveal
the ability of these Schiff bases to inhibit the corrosion of MS in 1M HCl as
proved by the weight loss method. The results obtained from the potentio-
dynamic polarization method are in agreement with weight loss measurement
results.
EIS method
The electrochemical impedance results of different concentrations of
FTSC in 1M HCl clearly showing semicircle shaped Nyquist plots with
increasing radii with increasing concentration of Schiff base FTSC. The
appearance of single semi circle in all the cases corresponds to one capacitive
loop14. It is apparent from these plots that the impendence response of MS in
uninhibited HCl has significantly changed after the addition of Schiff bases in
to the corrosive solutions. The semicircle shaped Nyquist plots indicate the
formation of a barrier on the surface and a charge transfer process mainly
controlling the corrosion of MS17,47. The polarization resistance Rp values

196
were found to increase with increasing Schiff base concentrations. The values
of the constant phase element (CPE) are found to decrease with increase in
concentration. This behaviour is generally seen for system where inhibition
is the case and indicates the formation of a surface film by the adsorption of
inhibitor on the metal surface4,12,48. The nature of CPE can be derived from
the values of the n, which is purely resistive when n = 0, capacitive when
n = 1 or inductive when n = -1. The values of n obtained for these systems
are close to unity which shows that the interface behaves nearly capacitive25.
The increase in the Rp values with increase in the Schiff base concentration
indicates that inhibition is due to the adsorption of Schiff base on the MS 4,12.
In simple case, when corrosion is uniform and corrosion reactions are
strictly charge transfer controlled, the electrode impedance Nyquist will be
semicircle. This type of impedance behaviour can be explained with the help
of a simple and commonly used equivalent circuit diagram as shown in the
figure 4.3.22 which is composed of a constant phase element CPE, in parallel
with a resistor, RP, which corresponds to a single capacitive loop. The resistor
Rs is in series to the CPE and Rp. Rs is the uncompensated resistance between
the working electrode and reference electrode or solution resistance, Rp is the
polarization resistance at the electrode/solution interface, and CPE is the
double layer capacitance at the interface. The double layer capacity is in
parallel with the impedance due to the charge transfer reaction. These types of
circuit have been used previously to model the iron /acid interface4, 5,49.

197
The EIS studies clearly indicate that the Schiff base FTSC is a good
corrosion inhibitor for MS in HCl medium. The efficiency of the inhibitor
increases with increase in inhibitor concentration. Similar to the FTSC the
other three Schiff bases also showing semicircle shaped Nyquist plots with
higher radii and Rp values and ascertains their capacity to inhibit the corrosion
of MS. The percentage inhibition efficiency calculated from the EIS
measurement almost matches with the percentage efficiency obtained from
Tafel plot analysis.
Figure 4. 3. 22 The equivalent circuit for the corrosion behaviour
of MS in 1M HCl in the presence of Schiff base inhibitors
Adsorption isotherm studies
The adsorption of Schiff base was found to follow Langmuir
adsorption isotherm in all the cases. The inhibiting effects deviate somewhat
from the ideal Langmuir adsorption isotherm. It has been postulated in the
derivation of the Langmuir equation that the adsorbed molecule do not
interact with each other but this is not true in the case of organic molecule
having polar atoms or groups which are adsorbed on the cathodic and anodic

198
sites of the metal surface. Such adsorbed species may interact by mutual
repulsion or attraction18.
Thermodynamic parameters calculated with help of the adsorption
isotherm plots also gives indication of the type of adsorption process. The
values of free energy of adsorption obtained for the four Schiff bases FTSC,
FATP, FAP and FSC for the corrosion of MS in 1M HCl are -35.62, -33.24,
-30.20 and -27.58 kJmol-1 respectively. The low values of ∆Gads below -40
kJmol-1 indicate that adsorption of Schiff base on the MS is physical in nature
i.e. physisorption26,50. The chemisorption process is mainly characterised by
the large interaction potentials, which leads to high heats of adsorption often
approaching to the value of chemical bond. The low and negative values of
∆Gads indicate that the spontaneous adsorption of inhibitors on the surface of
MS. The negative values of ∆Gads also suggest the strong interaction of the
inhibitor molecule on the MS surface51,52. The decrease in inhibition
efficiency with increasing temperature suggests weak adsorption interaction
which is physical in nature.
It is found that the Ea values for inhibited systems are higher than Ea
values for the uninhibited systems which propose the conclusion that physical
adsorption occurs in the first stage, explains the nature of organic molecule-
metal interactions. On the other hand the higher values of activation energy
obtained in spite of the lower Ea values of physisorption (30-50kJmol-1) may

199
be due to competitive adsorption of water whose removal from the surface
requires some more activation energy 13,22,53.
The negative values of Qads indicated the adsorption of used inhibitors
on the MS surface is exothermic. The negative values also identify that the
adsorption is a physisorption process13. The obtained values of ∆S are
negative indicating that the entropy of inhibitor molecules in the solution
phase is higher than solid phase13.
The reason for the high inhibition efficiencies of these studied Schiff
bases towards MS in 1M HCl is due to the presence of azomethine (–C=N-)
group, an electron cloud on the aromatic ring and presence of nitrogen,
oxygen and sulphur atoms in the molecules. The Schiff bases are strongly
adsorbed via the donation of the lone pair of electrons of O atom in the
carbonyl group and S atom in the C=S group and N atoms to MS surface. The
extent of percentage inhibition depends on the molecular size and electron
density on the active groups and atoms22.
The difference of inhibition efficiencies of the studied Schiff bases
towards MS can be explained on the basis of the difference in molecular
structure of the Schiff bases and the presence of substituents that increase or
decrease electron density of azomethine (-C=N-) group. The higher inhibition
efficiency of FTSC compared to the FSC and FATP than FAP may be due to
the presence sulphur atom in FTSC and FATP in the place of oxygen atom in
FSC and FAP. Adsorption capacity of S is higher than O. Adsorption

200
capacities of heteroatom present in the organic inhibitor molecules is in the
order as reported earlier O<N<S<P54,55,56,57.
The synthesised four Schiff bases FTSC, FATP, FAP and FSC are
acting as good corrosion inhibitors of MS in 1M hydrochloric acid media.
Among the four Schiff bases FTSC got maximum efficiency. The inhibition
efficiency of the studied Schiff bases decrease in the order FTSC>
FATP>FAP>FSC as evidenced from the weight loss measurements. The
higher efficiency of the Schiff bases are due to the presence of azomethine
group, atoms like sulphur or oxygen, and nitrogen in the Schiff bases
molecule. The mechanism of the inhibition process is through the adsorption
of the Schiff bases on the MS through physisorption. Thermodynamic
parameters calculated and inhibition studies conducted at higher temperature
also support the physical adsorption of the Schiff base over the MS. The
conversion of an amine into its Schiff base increases the inhibition efficiency.
All the Schiff bases are best suited to Langmuir adsorption isotherm
behaviour. The results obtained by the weight loss, Tafel method and EIS
find better agreement with each other. This shows that the results obtained for
the weight loss method are acceptable in all the other cases.
Since all the Schiff bases studied exhibit corrosion inhibiting property
on MS in HCl, they can be used as corrosion inhibitors for industrial
applications.

201
REFERENCES
1. V. S. Sastri, “Corrosion Inhibition, Principles and Applications”, John
Wiley & Sons, New York (1998).
2. “Corrosion Basics an introduction”, National Association of Corrosion
Engineers, (NACE), Texas (1984) 127-133.
3. H. H. Uhlig, “Corrosion and Corrosion Control”, John Wiley and Sons,
New York (1985).
4. K. C. Emregul and O. Atakol, Mater. Chem. Phys., 83 (2004) 373–379.
5. H. A. Sorkhabi, B. Shaabani and D. Seifzadeh, Electrochem. Acta., 50
(2005) 3446 -3452.
6. I. Lukovits, A. Shaban and E. Kalman, Electrochem. Acta., 50 (2005)
4128-4133.
7. S. S. A. E. Rehim, M. A. M. Ibrahim and K. F. Khaled, J. Appl.
Electrochem., 29, 5 (1999) 593-599.
8. M. A. Quraishi, J. Rawat and M. Ajmal, Corrosion, 54, 12 (1998) 996.
9. T. Vasudevan, B. Muralidharan, S. Muralidharan and S. V. Iyer, Anti-
Corros. Method M., 45, 2 (1998) 120-126.
10. H. Shokry, M. Yuasa, I. Sekine, R. M. Issa, H. Y. El-Baradie and G. K.
Gomma, Corros. Sci., 40, 12 (1998) 2173-2186.
11. A. Dadgarnezhad, I. Sheikhoaie and F. Baghaei, Anti-Corros. Method
M., 51, 4 (2004) 266-271.
12. K. C. Emregul, A. A. Akay and O.Atakol, Mater. Chem. Phys., 93 (2005)
325–329.
13. H. A. Sorkhabi, B. Shaabani and D. Seifzadeh, Appl. Surf. Sci., 239
(2005) 154-164.
14. A. Yurt, A. Balaban, S. U. Kandemir, G. Bereket and B. Erk, Mater.
Chem. Phys., 85 (2004) 420-426.

202
15. M. N. Desai, M. B. Desai, C. B. Shah and S. M. Desai, Corros. Sci., 26,
10 (1986) 827-837.
16. M. A. Quraishi and R. Sardar, Indian J. Chem. Techn., 11 (2004) 103-
107.
17. A. Aytac¸ U. Ozmen and M. Kabasakaloglu, Mater. Chem. Phys., 89
(2005) 176 –181.
18. A. Bansiwal, P. Anthony and S. P. Mathur, British Corrosion Journal, 35,
4 (2000) 301-303.
19. M. N. Desai, M. M. Pandya, and G. V. Shah, Indian J. Techn., 19 (1981)
292-294.
20. H. Baeza, M.Guzman, P. Ortega and L.Vera, J. Chil. Chem. Soc., 48, 3
(2003).
21. S. L. Li, H. Y. Ma, S. B. Lei, R. Yu, S. H. Chen and D. X. Liu,
Corrosion, 54, 12 (1998).
22. A. S. Fouda, L. H. Madkour, A. A. El-Shafei and S. A. A. El Maksoud,
Bull. Korean .Chem. Soc., 16 (1995) 454-458.
23. O. K. Okorosaye and N.C. Oforka., Journal of Applied Sciences &
Environmental Management, 8, 1 (2004) 56-61
24. S. K. Rajappa and T. V.Venkatesha, Turk. J. Chem., 27(2003)189-196.
25. M. Hosseini, S. F. L. Mertens, M. Ghorbani and R. M. Arshadi, Mater.
Chem. Phys., 78 (2003) 800–808
26. M. A. Quraishi, D. Jamal and M. Luqman, Indian J. Chem. Techn., 9
(2002) 479-483.
27. R. H. Perry, D. W. Green and J. O. Maloney, “Perry’s Chemical
Engineers Hand Book”, International Edition, McGraw-Hill Book
Company, Singapore ( 1984 ) 23
28. ASTM G-31-72, “Standard Recommended Practice for the Laboratory
Immersion Corrosion Testing of Metals”, American Society for Testing
and Materials (ASTM) Philaldelphia, P.A (1990) 401.

203
29. G. S. Haynes and R. Baboian, “Laboratory Corrosion Tests and
Standards”, ASTM Special technical publication, 866, American Society
for Testing and Materials, (ASTM) Philadelphia, P A (1990).
30. A. J. Bard and L. R. Faulkner, “Electrochemical Methods, Fundamentals
and Applications”, Wiley Inter Science Publications, New York (2000).
31. S. W. Dean, R. A. Woodroof and J. S Nicholas, “Electrochemical
Methods for Evaluating Corrosion Inhibitors in Strong Acid Systems”, in
Laboratory corrosion tests and standards, ASTM STP 866, American
Society for Testing and Materials, Philadelphia (1985) 228-245.
32. N.G. Thompson and J. H. Payer, “D. C. Electrochemical test methods”,
National Association Corrosion engineers, Houston, TX (1984).
33. E. Barsoukov and J. R. Macdonald, “Impedance Spectroscopy, Theory,
Experiment and Applications”, 2nd Ed., Wiley Interscience publications,
New York (2005).
34. F. Mansfield, Electrochim. Acta., 35 (1990)1533.
35. M. Kendig, J. Scully, J. Electrochemical Society, 141 (1994) 1823.
36. Mansfeld. F and M. Kendig, “Evaluvation of Protective Coatings with
Impedance Measurements”, International Congress on Metalic corrosion,
3 (1984) 74-84.
37. G. Reinhard and U. Rammelt. Korrosion, 15 (1984) 175-193.
38. T. Strivens and Taylor. C, Mater. Chem., 7 (1982) 199-222.
39. F. Mansfeld and M. Kendig, Corrosion (1983) 255.
40. M. H. Metikos, R Babic and Z. Grutac, J. Appl. Electrochem., 32 (2002)
35
41. A. A. Sorkhabi, M. R. Majidi and K. Seyyedi, Appl. Surf. Sci., 225
(2004) 176.
42. M. Schorr and J. Yaholom , Corros. Sci., 12 (1972) 867.
43. R. T. Vashi and V. A. Champaneri, Indian J. Chem. Techn., 4 (1997) 180

204
44. A. Raman and P. Labine, “Reviews on Corrosion Inhibitor Science and
Technology” , 1, 11, NACE, Houston, TX (1986) 20.
45. N. Hockerman and R. M. Hurd, Proceedings of International Congress of
Metallic Corrosion, London, Butterworths (1962) 166.
46. E. G. Turbina, N. E. Bredikhina, V. V. Pikulev and T. R. Chelyabinsk,
Politekh. Inst., 91, 16 (1971).
47. C. Jeyaprabha, S. Sathiyanarayanan, S. Muralidharan and G.
Venkatachari, J. Braz. chem.Soc., 17,1 (2006) 61-67.
48. I. L. Rosenfield, “Corrosion Inhibitors”, McGraw-Hill, New York
(1981).
49. M. El. Azhar, B. Mernari, M. Traisnel, F. Bentiss and M. Lagrenee,
Corros. Sci., 43 (2001) 2229.
50. S. Briny, Z. Gruber, R. Basic and M. Metikos-Hukovic, 8th European
Symposium on Corrosion inhibition, 1 (1995) 197.
51. M. Elachouri, M.S. Hajji, M. Salem, S. Kertit, J. Aride , R. Coudert and
E. Essassi, Corrosion,52 (1996) 103.
52. B. V. Savathri and S. Mayanna, Indian. J. Chem. Techn., 3 (1996) 256.
53. Lj. M. Vracar and D. M. Dragic, Corros. Sci., 44 (2002) 1669.
54. J. G. N. Thomas, “Some New Fundamental Aspects in Corrosion
Inhibition”, 5th European Symposium of Corrosion Inhibitors, Ferra, Italy
(1981) 453.
55. B. D. C. Donnelly, T. C. Downie, R. Grzeskowiak, H. R. Hamburg and
D. Short, Corros. Sci., 18 (1977) 109.
56. A. B. Tadros and Y. Abdel-Naby, J. Electroanal. Chem., 224 (1988) 443.
57. N. C. Subramanyam, B. S. Sheshadri and S. A. Mayanna, Corros.
Science, 34 (1993) 563.


![Surface Interaction and Corrosion Inhibition of Mild Steel ... · PDF fileSurface Interaction and Corrosion Inhibition of Mild Steel ... natural honey [11–14] and animal ... of pyoverdine](https://img.dokumen.tips/doc/110x75/5a9ff1727f8b9a84178d7e00/surface-interaction-and-corrosion-inhibition-of-mild-steel-interaction-and-corrosion.jpg)