Embed Size (px)
Citation preview

PART IIMillennium Development Goals
Trends and Tables


109M
illennium D
evelopment G
oals109
Introduction to the Millennium Development Goals
In September 2000, leaders of 189 member states of the United Nations (UN) gathered for the Millennium Summit. During this largest gathering of world leaders, the Millennium Declaration, which committed the world to fighting poverty in its many dimensions, was adopted. A year later, the road map towards the implementation of the UN Millennium Declaration Report of the Secretary General translated this vision of fighting the many dimensions of poverty into what was subsequently referred to as the Millennium Development Goals (MDGs) to be achieved by 2015.
The eight goals laid out in the MDGs were discussed in international gatherings prior to the Millennium Declaration. For instance, the education MDG was part of the goals of the Education For All initiative. What was novel and unprecedented about the MDGs was that their framework sets forth specific, time-bound, and quantified targets by 2015 (with a 1990 baseline) to address extreme poverty in its many dimensions (income poverty, hunger, disease, lack of adequate shelter, and exclusion), while also promoting gender equality, education, and environmental sustainability. The MDGs made available a framework to focus attention and resources, including global aid, as well as provided an action agenda across economies, and among local governments and development partners within economies. Statistical indicators were identified for monitoring progress on attaining the goals and targets.
The first of the eight MDGs was about eradicating extreme poverty and hunger, with its first target identified as halving the proportion of people in extreme poverty by 2015 from what it was in 1990. Extreme poverty was defined using a poverty line of $1 per person per day by using 1990 purchasing power parity prices, and subsequently updated to $1.25 a day using 2005 purchasing power parity prices.
The monitoring framework for the MDGs was subsequently revised in 2007 to include four additional targets on:
• fullandproductiveemploymentanddecentworkforall,• accesstoreproductivehealth,• accesstotreatmentforHIV/AIDS,and• protectionofbiodiversity
that were agreed upon by UN member states at the 2005 World Summit. The indicators for these new targets became effective in January 2008.
Box 1 lists the eight MDGs, the 21 targets and the 60 indicators for monitoring progress in attaining the MDGs.
Progress in attaining the Millennium Development Goals and targets
With the MDGs agenda set to close this year, the progress of the Asian Development Bank (ADB) developing members toward attaining the MDGs and targets is discussed in this part of the 2015 Key Indicators for Asia and the Pacific. Each goal is accompanied by a short analysis and supporting statistical information presented in figures, boxes, and tables on the performance of economies (and regions in Asia and the Pacific) toward achieving the goals. The classification of progress was determined using the methodology outlined in Technical Note I of the report Making It Happen: Technology, Finance and Statistics for Sustainable Development in Asia

110 Key Indicators for Asia and the Pacific 2015110
Goals and Targets (from the Millennium Declaration)
Indicators for Monitoring Progress
Goal 1: Eradicate extreme poverty and hungerTarget 1.A: Halve, between 1990 and 2015, the proportion of people whose income
is less than one dollar a day1.1 Proportion of population below $1 (PPP) per day1
1.2 Poverty gap ratio 1.3 Share of the poorest quintile in national consumption
Target 1.B: Achieve full and productive employment and decent work for all, including women and young people
1.4 Growth rate of GDP per person employed1.5 Employment-to-population ratio1.6 Proportion of employed people living below $1 (PPP) per day1.7 Proportion of own-account and contributing family workers in total
employment Target 1.C: Halve, between 1990 and 2015, the proportion of people who suffer
from hunger1.8 Prevalence of underweight children under 5 years of age1.9 Proportion of population below minimum level of dietary energy consumption
Goal 2: Achieve universal primary educationTarget 2.A: Ensure that, by 2015, children everywhere, boys and girls alike, will be
able to complete a full course of primary schooling2.1 Net enrollment ratio in primary education2.2 Proportion of pupils starting grade 1 who reach the last grade of primary 2.3 Literacy rate of 15–24 year-olds, women and men
Goal 3: Promote gender equality and empower womenTarget 3.A: Eliminate gender disparity in primary and secondary education,
preferably by 2005, and in all levels of education no later than 20153.1 Ratios of girls to boys in primary, secondary, and tertiary education3.2 Share of women in wage employment in the nonagricultural sector3.3 Proportion of seats held by women in national parliament
Goal 4: Reduce child mortalityTarget 4.A: Reduce by two-thirds, between 1990 and 2015, the under-5 mortality
rate 4.1 Under-5 mortality rate4.2 Infant mortality rate4.3 Proportion of 1-year-old children immunized against measles
Goal 5: Improve maternal health Target 5.A: Reduce by three-quarters, between 1990 and 2015, the maternal
mortality ratio5.1 Maternal mortality ratio5.2 Proportion of births attended by skilled health personnel
Target 5.B: Achieve, by 2015, universal access to reproductive health 5.3 Contraceptive prevalence rate 5.4 Adolescent birth rate5.5 Antenatal care coverage (at least one visit and at least four visits)5.6 Unmet need for family planning
Goal 6: Combat HIV/AIDS, malaria and other diseasesTarget 6.A: Have halted by 2015 and begun to reverse the spread of HIV/AIDS 6.1 HIV prevalence among population aged 15–24 years
6.2 Condom use at last high-risk sex6.3 Proportion of population aged 15–24 years with comprehensive correct
knowledge of HIV/AIDS6.4 Ratio of school attendance of orphans to school attendance of nonorphans
aged 10–14 yearsTarget 6.B: Achieve, by 2010, universal access to treatment for HIV/AIDS for all
those who need it6.5 Proportion of population with advanced HIV infection with access to
antiretroviral drugsTarget 6.C: Have halted by 2015 and begun to reverse the incidence of malaria and
other major diseases
6.6 Incidence and death rates associated with malaria6.7 Proportion of children under 5 sleeping under insecticide-treated bednets6.8 Proportion of children under 5 with fever who are treated with appropriate
antimalarial drugs6.9 Incidence, prevalence, and death rates associated with tuberculosis6.10 Proportion of tuberculosis cases detected and cured under the Directly
Observed Treatment Short (DOTS) course Goal 7: Ensure environmental sustainabilityTarget 7.A: Integrate the principles of sustainable development into country policies
and programs and reverse the loss of environmental resources7.1 Proportion of land area covered by forest7.2 CO2 emissions, total, per capita and per $1 GDP (PPP)7.3 Consumption of ozone-depleting substances7.4 Proportion of fish stocks within safe biological limits7.5 Proportion of total water resources used
Target 7.B: Reduce biodiversity loss, achieving, by 2010, a significant reduction in the rate of loss
7.6 Proportion of terrestrial and marine areas protected7.7 Proportion of species threatened with extinction
Target 7.C: Halve, by 2015, the proportion of people without sustainable access to safe drinking water and basic sanitation
7.8 Proportion of population using an improved drinking water source7.9 Proportion of population using an improved sanitation facility
Target 7.D: By 2020, to have achieved a significant improvement in the lives of at least 100 million slum dwellers
7.10 Proportion of urban population living in slums2
Goal 8: Develop a global partnership for developmentTarget 8.A: Develop further an open, rule-based, predictable, nondiscriminatory
trading and financial system
Includes a commitment to good governance, development, and poverty reduction—both nationally and internationally
Target 8.B: Address the special needs of the least developed countries
Includes: tariff and quota free access for the least developed countries’ exports; enhanced programme of debt relief for heavily indebted poor countries (HIPC) and cancellation of official bilateral debt; and more generous ODA for countries committed to poverty reduction
Some of the indicators listed below are monitored separately for the least developed countries, Africa, landlocked developing countries, and small island developing states.Official Development Assistance (ODA)8.1 Net ODA, total and to the least developed countries, as percentage of
OECD/DAC donors’ gross national income8.2 Proportion of total bilateral, sector-allocable ODA of OECD/DAC donors
to basic social services (basic education, primary health care, nutrition, safe water, and sanitation)
8.3 Proportion of bilateral ODA of OECD/DAC donors that is untied8.4 ODA received in landlocked developing countries as a proportion of their
gross national incomes8.5 ODA received in small island developing states as a proportion of their gross
national incomes
continued.

111Introduction to the Millennium Development GoalsM
illennium D
evelopment G
oals111
Box 1 Millennium Development Goals (continued)
Target 8.C: Address the special needs of landlocked developing countries and small island developing States (through the Programme of Action for the Sustainable Development of Small Island Developing States and the outcome of the twenty-second special session of the General Assembly)
Target 8.D: Deal comprehensively with the debt problems of developing countries through national and international measures in order to make debt sustainable in the long term
Market Access8.6 Proportion of total developed country imports (by value and excluding arms)
from developing countries and least developed countries, admitted free of duty
8.7 Average tariffs imposed by developed countries on agricultural products and textiles and clothing from developing countries
8.8 Agricultural support estimate for OECD countries as a percentage of their gross domestic product
8.9 Proportion of ODA provided to help build trade capacity
Debt Sustainability8.10 Total number of countries that have reached their HIPC decision points and
number that have reached their HIPC completion points (cumulative)8.11 Debt relief committed under HIPC and MDRI Initiatives8.12 Debt service as a percentage of exports of goods and services
Target 8.E: In cooperation with pharmaceutical companies, provide access to affordable essential drugs in developing countries
8.13 Proportion of population with access to affordable essential drugs on a sustainable basis
Target 8.F: In cooperation with the private sector, make available the benefits of new technologies, especially information and communications
8.14 Telephone lines per 100 population 8.15 Cellular subscribers per 100 population8.16 Internet users per 100 population
AIDS = acquired immunodeficiency syndrome, CO2 = carbon dioxide, DAC = Development Assistance Committee, GDP = gross domestic product, HIPC = heavily indebted poor countries, HIV = human immunodeficiency virus, MDRI = Multilateral Debt Relief Initiative, ODA = official development assistance, OECD = Organisation for Economic Co-operation and Development, PPP = purchasing power parity.1 For monitoring country poverty trends, indicators based on national poverty lines should be used, where available.2 The actual proportion of people living in slums is measured by a proxy, represented by the urban population living in households with at least one of the four characteristics:
(a) lack of access to improved water supply; (b) lack of access to improved sanitation; (c) overcrowding (three or more persons per room); and (d) dwellings made of nondurable material.
Source: Millennium Development Goals Indicators: The Official United Nations Site for the MDG Indicators. July 2014.
and the Pacific (Economic and Social Commission for Asia and the Pacific [ESCAP], ADB, and United Nations Development Programme [UNDP] 2014/15). The rate of change is calculated mostly using the linear time trend of a suitable transformation of the indicator values. Economies are classified into four categories of progress such as, “achiever”, “on track”, “off track - slow”, or “no progress/regressing”, as measured by available data on target indicators since 1990:
• achieversareeconomiesthathavealreadyreachedthetarget,• ontrackindicatesthatanextrapolationoftrendsbasedonavailabledatabetween1990andmostrecent yearsshowsthatthetargetcanbeachieved,• offtrack-slowprogressappliestoeconomiesthatareexpectedtomeetthetargetbutafter2015,and,• noprogress/regressingdescribeseconomiesthathavemadenoprogresssince1990orhaveactually
slippedbackward.
The statistics in the tables for each indicator in part III are usually presented for two data points between 1990 and 2015. These are often referred to as the earliest year (usually a year between 1990 and 2000) and latest year (usually any year closest to 2015) depending on available data. This is because the years for which data are available vary widely across countries. The actual years which the data relate to are indicated in the tables that are used as sources for the charts. However, lack of data shows the difficulty in collecting and disseminating the data.
In monitoring progress, cutoffs were introduced for several targets (Table 1), which are the cutoffs adapted from ESCAP, ADB, and UNDP (2015) report. For example, a cutoff of 2% is used for the target “halving extreme poverty between 1990 and 2015.” This means that, when the share of people living on less than $1.25 a day is reduced to 2%, the target is considered to have been reached, even if 2% is not half of the percentage in 1990. Minimum data points must be three and have at least one data point after 2005 for inclusion in progress tracking.
112 Key Indicators for Asia and the Pacific 2015112
For indicators whose target is to reverse a trend, such as in HIV prevalence, tuberculosis incidence, tuberculosis prevalence, forest cover, carbon dioxide emissions, protected area, and consumption of ozone-depleting substances, only two categories were used—economies trending in the “right” direction since 1990, or that showed no change during the period are categorized as “achievers,” and economies that trended in the “wrong” direction or that started with high levels but trended down in recent years are categorized as “no progress/regressing.”
Table 2 illustrates the MDG progress classification, which reflects the progress of developing economies of the Asia and Pacific region since 1990. Four progress categories are made for indicators where sufficient data were available from the United Nations Millennium Development Goals Indicators database (UN 2015), following the July 2015 update and more recent data releases from the UN’s official MDG data source agencies. Differences in performance classification between Table 2 and the ESCAP, ADB, and UNDP report arise due to differences in data used rather than in methodological processes as this report uses updated data for MDG indicators. Further, the data are annually updated, resulting in revisions of specific data points in some cases. Thus, progress classifications presented in this report are not always comparable with those in previous editions of the Key Indicators for Asia and the Pacific. The progress tracking methodology has its limitations given the nature of targets and is affected by the initial conditions in an economy with respect to the indicator.
In 2015, the target year for the MDGs, good progress is evident in many MDGs, notably in reducing extreme poverty globally, especially in Asia and the Pacific. But while there is much cause for celebration, there remains an unfinished agenda due to uneven progress across the goals, the uneven progress across regions and nations in each goal, and the uneven opportunities for people to share in the benefits of development and progress.
The target to halve extreme poverty (MDG 1) has been achieved years ahead of schedule in Asia and the Pacific, where data show that the proportion of people living on less than $1.25 a day has reduced to 15.3% in 2011 (from 55.3% in 1990). However, there has been slower progress in reducing hunger, particularly child malnutrition. Significant advancement in Asia and the Pacific has also been made toward universal primary education (MDG 2), but more efforts are required to ensure that primary school-aged children not only go to school but also complete primary schooling with good quality education. Gender disparities in schooling
Table 1: Cutoff Values for Selected MDG IndicatorsNo. Indicator MDG Target Cutoff1.11.82.12.23.14.14.25.15.25.56.16.9a6.9b7.1 7.27.67.87.9
Proportion of population below $1.25 (PPP) a dayPrevalence of underweight children under 5 years of ageTotal net enrollment ratio in primary education (both sexes)Proportion of pupils starting grade 1 who reach the last grade of primary (both sexes)Ratios of girls to boys in primary, secondary, and tertiary educationUnder-five mortality rate per 1,000 live birthsInfant mortality rate per 1,000 live birthsMaternal mortality ratioProportion of births attended by skilled health personnelAntenatal care coverage (at least one visit)HIV prevalenceTB incidenceTB prevalenceForest coverCO2 emissions per $1 GDP (PPP)Protected areaPopulation using improved water sources (urban and rural combined)Population having access to improved sanitation facilities (urban and rural combined)
Half the 1990 percentageHalf the 1990 percentage100%100%1One-third the 1990 percentageOne-third the 1990 percentageReduce by ¾ (without)Reduce by ¾ (without)100%Reverse the trendReverse the trendReverse the trendReverse the trendReverse the trendReverse the trendHalf the 1990 percentage (without)Half the 1990 percentage (without)
2%None
95%95%
0.95NoneNoneNoneNone
95%NoneNoneNoneNoneNoneNoneNoneNone
CO2 = carbon dioxide, GDP = gross domestic product, HIV = human immunodeficiency virus, MDG = Millennium Development Goal, PPP = purchasing power parity, TB = tuberculosis. Sources: UNESCAP, ADB, and UNDP. 2015. Making It Happen: Technology, Finance and Statistics for Sustainable Development in Asia and the Pacific.

113Introduction to the Millennium Development GoalsM
illennium D
evelopment G
oals113
Table 2: Millennium Development Goals Progress Tracking 2015
Goal 1 2 3 4 5 6 7
Developing Member Economy
$1.2
5 per
day
pov
erty
Unde
rwei
ght c
hild
ren
Prim
ary e
nrol
lmen
t
Reac
hing
last
grad
e
Gend
er p
rimar
y
Gend
er se
cond
ary
Gend
er te
rtia
ry
Unde
r-5 m
orta
lity
Infa
nt m
orta
lity
Mat
erna
l mor
talit
y
Skill
ed b
irth
atte
ndan
ce
Ante
nata
l car
e (> _1
visit
)
HIV
pre
vale
nce
TB in
ciden
ce
TB p
reva
lenc
e
Fore
st co
ver
CO2 e
miss
ions
per
$1 G
DP
Prot
ecte
d ar
ea
Safe
drin
king
wat
er
Basic
sani
tatio
n
Central and West AsiaAfghanistan ArmeniaAzerbaijan GeorgiaKazakhstan Kyrgyz Republic PakistanTajikistan Turkmenistan Uzbekistan
East AsiaChina, People’s Rep. ofHong Kong, China Korea, Rep. ofMongoliaTaipei,China
South AsiaBangladeshBhutanIndiaMaldives NepalSri Lanka
Southeast AsiaBrunei DarussalamCambodia IndonesiaLao PDR MalaysiaMyanmarPhilippinesSingaporeThailandViet Nam
The PacificCook Islands FijiKiribatiMarshall Islands Micronesia, Fed. States of NauruPalauPapua New Guinea Samoa Solomon Islands Timor-LesteTonga Tuvalu Vanuatu
Achiever On track Off track - slow No progress/regressing Insufficient/no data
CO2 = carbon dioxide, GDP = gross domestic product, HIV = human immunodeficiency virus, Lao PDR = Lao People’s Democractic Republic, TB = tuberculosis.Note: Asian Development Bank estimates based on UNESCAP, ADB, and UNDP MDG progress methodolody (Making It Happen: Technology, Finance and Statistics for
Sustainable Development in Asia and the Pacific, Asia-Pacific Regional MDGs Report 2014/15).Sources: AIDSinfo online database (http://aidsinfoonline.org/, accessed 6 October 205); Food and Agriculture Organization of the United Nations, Global Forest Resources
Assessment 2015 (accessed 13 September 2015); United Nations. Millennium Development Goals Indicators Database (http://millenniumindicators.un.org/unsd/mdg/Data.aspx, accessed 14 July 2015); United Nations Educational, Scientific and Cultural Organization, Institute for Statistics (http://www.uis.unesco.org/, accessed 3 August 2015); World Health Organization. Joint Child Malnutrition Estimates - Levels and Trends (2015 edition) (http://www.who.int/nutgrowthdb/estimates2014/en/, accessed 28 September 2015); World Health Organization-United Nations International Children’s Emergency Fund, Joint Monitoring Programme for Water Supply and Sanitation (http://www.wssinfo.org/, accessed 16 June 2015); and for Taipei,China, various economy sources.

114 Key Indicators for Asia and the Pacific 2015114
(MDG 3) that have been largely in favor of boys have also been addressed in many countries, especially at the primary and secondary levels, but gender inequalities still persist in some developing economies in Asia and the Pacific, including disparities that are in favor of girls in some economies. Across Asia and the Pacific, child mortality and maternal mortality ratios (MDGs 4 and 5) have been reduced by more than half the 1990 baselines, but the targets for reductions in these mortality ratios by 2015 are not going to be met in most of the developing economies. In the area of health, the fight against HIV/AIDS, malaria, tuberculosis, and other diseases has been generally successful in the Asia and Pacific region (MDG 6), but some developing economies in the region have been regressing in the battle against HIV/AIDS. Carbon dioxide emissions have continued to increase rapidly in the region, but most economies in Asia and the Pacific have increased the land and sea areas under protection (MDG 7). Rapid steps have been made in Asia and the Pacific toward improving access of the population to safe drinking water, but the performance to improve the provision of sanitation across economies in Asia and the Pacific has been less satisfactory. The use of mobile phones has increased phenomenally in the region though access to internet still exhibits digital divide. Finally, global partnerships, particularly official flows from all sources to developing member economies, have improved in the MDG period, but only a few donors contributed more than 0.7% in terms of share of net overseas development assistance to gross national income (MDG 8).
Sustainable Development Goals – the Post-2015 Development Agenda
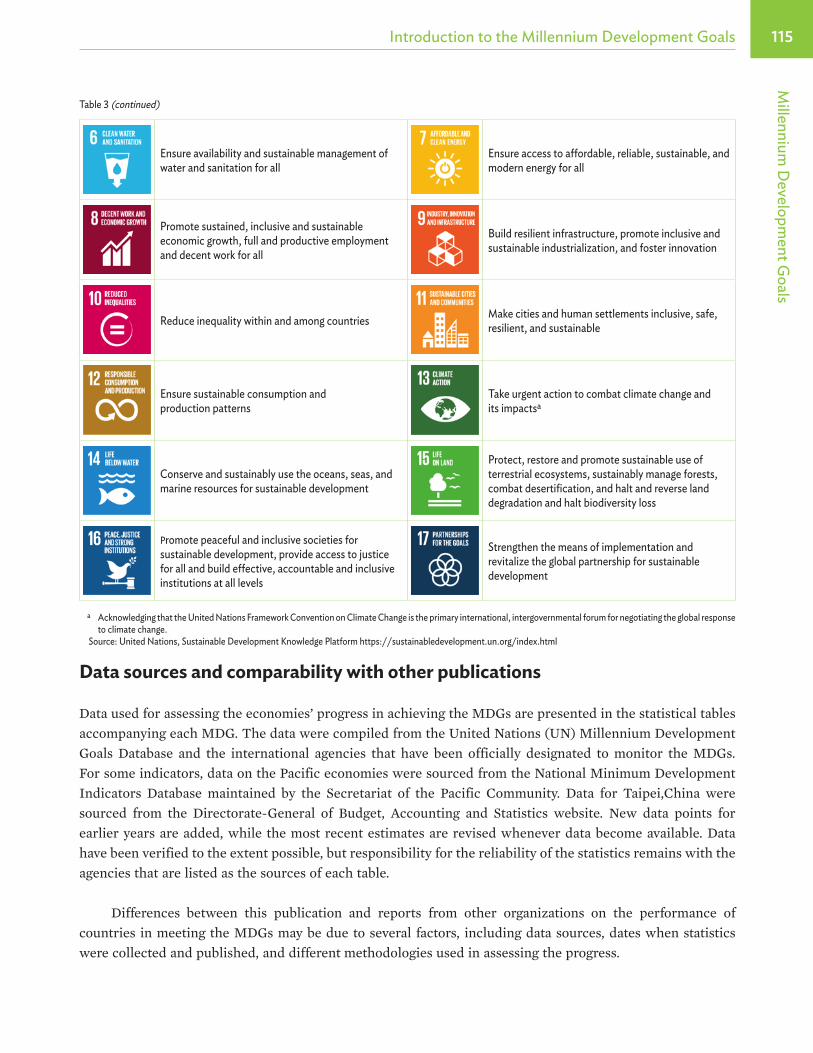
The tasks ahead are to build on the progress as well as the unfinished work in the MDGs; to integrate the economic, social, and environmental dimensions of sustainable development; and to aspire for everyone to have full opportunities to participate in growth processes in the post-2015. To pursue these aspirations, a new agenda “Transforming our world: the 2030 Agenda for Sustainable Development” was adopted by the world leaders at the United Nations Sustainable Development Summit held on 25–27 September 2015 in New York. This agenda recognizes that the greatest challenge and the undisputable requirement for sustainable development is to eradicate poverty in all its forms and dimensions, including extreme poverty. The world leaders pledged for an inclusive agenda that promises to leave no one behind and announced 17 Sustainable Development Goals (Table 3) and 169 targets reflecting an ambitious new universal agenda, which builds on the MDGs and integrates and balances the economic, social, and environmental dimensions of sustainable development. The associated indicators for measuring and monitoring progress for the targets are currently being developed. The new Sustainable Development Goals agenda will guide the development agenda between now and 2030.
Table 3: Sustainable Development Goals
Transforming our world: the 2030 Agenda for Sustainable Development End poverty in all its forms everywhere
End hunger, achieve food security and improved nutrition, and promote sustainable agriculture
Ensure healthy lives and promote well-being for all at all ages
Ensure inclusive and equitable quality education and promote lifelong learning opportunities for all
Achieve gender equality and empower all women and girls
continued.
115Introduction to the Millennium Development GoalsM
illennium D
evelopment G
oals115
Ensure availability and sustainable management of water and sanitation for all
Ensure access to affordable, reliable, sustainable, and modern energy for all
Promote sustained, inclusive and sustainable economic growth, full and productive employment and decent work for all
Build resilient infrastructure, promote inclusive and sustainable industrialization, and foster innovation
Reduce inequality within and among countries Make cities and human settlements inclusive, safe, resilient, and sustainable
Ensure sustainable consumption and production patterns
Take urgent action to combat climate change and its impactsa
Conserve and sustainably use the oceans, seas, and marine resources for sustainable development
Protect, restore and promote sustainable use of terrestrial ecosystems, sustainably manage forests, combat desertification, and halt and reverse land degradation and halt biodiversity loss
Promote peaceful and inclusive societies for sustainable development, provide access to justice for all and build effective, accountable and inclusive institutions at all levels
Strengthen the means of implementation and revitalize the global partnership for sustainable development
a Acknowledging that the United Nations Framework Convention on Climate Change is the primary international, intergovernmental forum for negotiating the global response to climate change.
Source: United Nations, Sustainable Development Knowledge Platform https://sustainabledevelopment.un.org/index.html
Data sources and comparability with other publications
Data used for assessing the economies’ progress in achieving the MDGs are presented in the statistical tables accompanying each MDG. The data were compiled from the United Nations (UN) Millennium Development Goals Database and the international agencies that have been officially designated to monitor the MDGs. For some indicators, data on the Pacific economies were sourced from the National Minimum Development Indicators Database maintained by the Secretariat of the Pacific Community. Data for Taipei,China were sourced from the Directorate-General of Budget, Accounting and Statistics website. New data points for earlier years are added, while the most recent estimates are revised whenever data become available. Data have been verified to the extent possible, but responsibility for the reliability of the statistics remains with the agencies that are listed as the sources of each table.
Differences between this publication and reports from other organizations on the performance of countries in meeting the MDGs may be due to several factors, including data sources, dates when statistics were collected and published, and different methodologies used in assessing the progress.
Table 3 (continued)


![[Millennium Development Goals 1 and 3] By [Author Name ... · MILLENNIUM DEVELOPMENT GOALS 1 & 3 4 were termedas “Millennium Development Goals” and United Nations Millennium Declaration](https://img.dokumen.tips/doc/110x75/5edb6813ad6a402d66659cfd/millennium-development-goals-1-and-3-by-author-name-millennium-development.jpg)