Embed Size (px)
Citation preview

PART II
Measuring Comprehensive Wealth: New Work on Natural Capital and Human Capital


103
Land Assets, Climate Change, and Degradation Impacts
Glenn-Marie Lange and Diego Herrera
5
Main Messages
• Global wealth in land assets (cropland, pastureland, protected areas, forest timber, and ecosystem services) increased by 43 percent, from US$24 trillion to US$35 trillion, between 1995 and 2018. The increase was driven mainly by growth in cropland wealth, from US$11 trillion to US$15 trillion, and forest ecosystem ser-vices wealth (water services, recreation services, and nonwood forest products), from US$5 trillion to US$7.5 trillion.
• Low-income countries as a group show a decline in wealth per capita in all land assets. Countries in Sub-Saharan Africa as a group also show a decline in wealth per capita in all land assets.
• Global wealth in agricultural lands (cropland and pastureland) increased between 1995 and 2018. Scenarios show that this trend could be reversed in the future because of changes in temperature, precipitation, and land degradation, which combined have a negative impact on predicted crop yields.
• Forest ecosystem services wealth increased globally between 1995 and 2018 in absolute and per capita terms. An analysis of recreation services shows that some countries in South and Central America, Sub-Saharan Africa, and Southeast Asia have experienced losses because of forest degradation, but others, especially in Europe and Asia outside Southeast Asia, have increased recreation services as a product of forest cover gains.

THE CHANGING WEALTH OF NATIONS 2021104
Introduction
This chapter presents the main trends in land assets, including agricultural land (cropland and pastureland), forests (timber and ecosystem services), and protected areas. This asset class is critical because land comprehen-sively is the only asset that, if managed sustainably, is renewable. Although land’s share of total wealth has been declining, its assorted assets are still a critical component of total wealth in low- and middle-income countries. The chapter begins with a discussion of the growth in land assets between 1995 and 2018, across regions and income groups, followed by a section on trade-offs between land assets in low- and middle-income countries. The next two sections discuss how the largest land assets could be affected by climate change and degradation. The chapter presents an assessment of cropland wealth under climate change scenarios and discusses the impacts of forest degradation on forest ecosystem services. Mangrove ecosystems, located at the sea-land interface, are discussed in detail in chapter 6 as part of blue natural capital.1
Land Assets: Global and Regional Trends, 1995–2018
At the global level, total wealth in the land assets increased by 43 percent, from US$24 trillion to US$35 trillion, between 1995 and 2018. This was driven mainly by growth in cropland wealth, from US$11 trillion to US$15 trillion, and forest ecosystem services wealth, from US$5 trillion to US$7.5 trillion (figure 5.1). Wealth per capita for land assets also increased globally, except forest timber wealth, which declined roughly 20 percent (table 5.1).
Across regions, there were significant differences in the growth of per capita wealth during 1995–2018 (figure 5.2). In Sub-Saharan Africa, all
Source: World Bank staff calculations.
0
2
4
6
8
10
12
14
16
1995
1996
1997
1998
1999
2000
2001
2002
2003
2004
2005
2006
2007
2008
2009
2010
2011
2012
2013
2014
2015
2016
2017
2018
US$
(trilli
ons)
CroplandForest timber Protected areasForest ecosystem services
Pastureland
FIGURE 5.1 Total Global Wealth in the Land Sector, 1995–2018

CHAPTER 5 : LAnd ASSETS, CL imATE CHAnGE, And dEGRAdATion imPACTS 105
land assets show a decrease. In this region most land assets grew in total wealth (except cropland) but not fast enough to compensate for the very high population growth. Cropland and pastureland per capita wealth increased in East Asia and Pacific, Latin America and the Caribbean, North America, and South Asia, but they declined in Europe and Central Asia and the Middle East and North Africa. Protected area wealth per capita increased in all regions other than Sub-Saharan Africa, with the largest increase in Latin America and the Caribbean. Forest ecosystem services wealth per capita increased in all regions other than Sub-Saharan Africa, while forest timber wealth per capita declined in all regions but Latin America and the Caribbean and South Asia.
For The Changing Wealth of Nations (CWON) 2021, Gerber et al. (2021) generated new country-specific crop yield growth rates estimated
TABLE 5.1 Land Sector Wealth per Capita, by Asset, 1995–2018 constant 2018 US$
Asset 1995 2000 2005 2010 2015 2018
Forest timber 469 398 339 362 367 379
Forest ecosystem services 899 1,012 1,008 983 1,027 1,037
Protected areas 355 393 422 495 538 521
Cropland 1,958 1,860 1,763 1,987 2,169 2,042
Pastureland 803 770 789 821 878 864
Source: World Bank staff calculations.
Source: World Bank staff calculations.
–60
–40
% c
hang
e
–20
0
20
40
60
80
100
120
East Asiaand Pacific
Europeand
Central Asia
LatinAmericaand the
Caribbean
Middle Eastand
North Africa
NorthAmerica
SouthAsia
Sub-SaharanAfrica
Protected areasForest timber CroplandForest ecosystem services Pastureland
FIGURE 5.2 Change in Wealth per Capita, by Land Asset and Region, 1995–2018
THE CHANGING WEALTH OF NATIONS 2021106
at the grid-cell level, accounting for the impacts of climate change as well as degradation, which translates into lower but more realistic crop yield growth rates. This is an improvement over previous editions of CWON, which assumed fixed crop production growth rates. Cropland wealth val-ues presented in this section already include the effect of climate change on crop yields based on the Intergovernmental Panel on Climate Change’s Representative Concentration Pathway (RCP) 4.5, assumed as the base-line or business-as-usual (BAU) climate scenario.
Trade-Offs across Land Assets in Low- and Middle-Income Countries
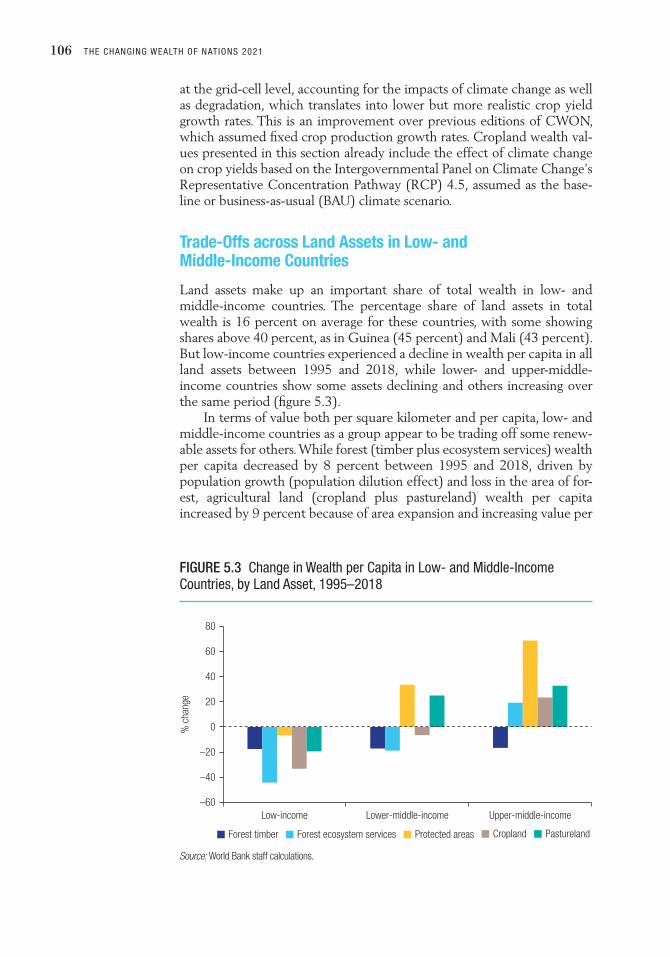
Land assets make up an important share of total wealth in low- and middle-income countries. The percentage share of land assets in total wealth is 16 percent on average for these countries, with some showing shares above 40 percent, as in Guinea (45 percent) and Mali (43 percent). But low-income countries experienced a decline in wealth per capita in all land assets between 1995 and 2018, while lower- and upper-middle-income countries show some assets declining and others increasing over the same period (figure 5.3).
In terms of value both per square kilometer and per capita, low- and middle-income countries as a group appear to be trading off some renew-able assets for others. While forest (timber plus ecosystem services) wealth per capita decreased by 8 percent between 1995 and 2018, driven by population growth (population dilution effect) and loss in the area of for-est, agricultural land (cropland plus pastureland) wealth per capita increased by 9 percent because of area expansion and increasing value per
Source: World Bank staff calculations.
–60
% c
hang
e
–40
–20
0
20
40
60
80
Low-income Lower-middle-income Upper-middle-income
Protected areasForest timber CroplandForest ecosystem services Pastureland
FIGURE 5.3 Change in Wealth per Capita in Low- and middle-income Countries, by Land Asset, 1995–2018

CHAPTER 5 : LAnd ASSETS, CL imATE CHAnGE, And dEGRAdATion imPACTS 107
square kilometer (figure 5.4). The area in agriculture increased by 4 percent between 1995 and 2018 in low- and middle-income countries. Forest land area declined by 4 percent overall, because of conversion to agriculture and other land uses, notably in Sub-Saharan Africa (−13 percent) and Latin America (−10 percent) (table 5.2). Protected areas show a rapid increase in area and wealth per square kilometer (using the opportunity cost of land as a lower-bound approach to valuation).
Source: World Bank staff calculations.
–40
–20
0
20
40
60
% c
hang
e
Forest(timber and ecosystem services)
Agricultural land Protected areas
Land area Wealth per square kilometer (US$) Population dilution
Overall wealth per capita (US$)
FIGURE 5.4 Forests, Agricultural Land, and Protected Areas: Change in Land Area, Wealth per Square Kilometer, Population dilution Effect, and overall Wealth per Capita in Low- and middle-income Countries, 1995–2018
TABLE 5.2 Change in Forest, Agricultural, and Protected Land Areas in Low- and middle-income Countries, by Region, 1995–2018
Region
Forest area (1,000 sq. km.)
% change
Agricultural land area (1,000 sq. km.)
% change
Protected areas (1,000 sq. km. )
% change1995 2018 1995 2018 1995 2018
East Asia and Pacific 4,082 4,409 7 7,378 7,676 4 1,944 2,273 14
Europe and Central Asia 8,631 8,734 1 6,117 6,059 −1 1,463 1,909 23
Latin America and the Caribbean
9,768 8,908 −10 6,646 7,221 8 2,171 4,514 52
middle East and north Africa
166 191 13 1,440 1,266 −14 124 434 71
South Asia 751 797 6 2,329 2,326 0 259 331 22
Sub-Saharan Africa 5,758 5,112 −13 7,571 8,210 8 2,363 3,542 33
All low- and middle-income countries
29,156 28,151 −4 31,481 32,759 4 8,324 13,003 36
Sources: World Bank staff calculations based on data from the Food and Agriculture Organization for forest land and agricultural land and on data from the World Development Indicators for protected areas.Note: sq. km. = square kilometers.

THE CHANGING WEALTH OF NATIONS 2021108
For low-income countries that rely significantly on land assets for wealth creation, a decline in wealth per capita in all categories of land assets, as well as a trade-off between forests and agricultural wealth if the latter declines under climate change, are cases of special concern, given the increased vulnerability and challenges for sustainable management of assets. Take the example of Niger, a country that experienced a decline in forest timber, ecosystem services, and pastureland wealth per capita (−61, −66, and −23 percent, respectively) and an increase in cropland (71 percent); the latter has been declining since 2015, and climate change impacts could have a negative impact on future crop yields, as described in the next section.
Cropland Wealth and Climate Change Scenarios
The literature on the impact of climate change on crop yields consistently shows negative impacts of temperature increase on crop yields at the global scale. One finds similar impacts at the country and site scales but with significant uncertainty and variation across crops (Mbow et al. 2019). Iizumi et al. (2017) show that the projected global mean yields of maize and soybean at the end of this century decrease monotonically with warming, whereas those of rice and wheat increase with warming but level off at about 3 degrees Celsius. Impacts on crops grown in the tropics are projected to be more negative than those in middle to high latitudes (Levis et al. 2018). For the Middle East and North Africa, Reyer et al. (2017) found a significant correlation between crop-yield decrease and temperature increase. A review of recent literature found that projected yield loss for West Africa depends on the degree of wetter or drier condi-tions and elevated carbon dioxide concentrations (Sultan and Gaetani 2016).
Gerber et al. (2021) base future crop production on projections of the yields of 10 major crops: barley, cassava, maize, oil palm, rapeseed, rice, sorghum, soybeans, sugarcane, and wheat. Together these make up 83 percent of the calories produced on cropland, assuming the produc-tion area is held constant. Gerber et al. determine future yields by extrapolating current yield growth and allowing them to be affected by climate change. Extrapolated yields are not allowed to exceed a yield ceiling, nor to undergo unbounded growth. The yield ceiling is deter-mined with a “frontier” approach using a quantile regression model. Land degradation (driven by salinization, unsustainable irrigation, and erosion) is treated as a local phenomenon and hence reflected in national-level yield trends. The calculated yield ceiling is locally discounted to account for land degradation. Climate change impacts on the extrapolated yield ceiling are estimated consistent with accounting for climate change impacts on observed yields.
Yield and harvested area data for major crops come from a data set recently developed by Ray et al. (2019). The data set was constructed using crop statistics from 1974 to 2012 across 20,000 political units globally. Value-of-production data come from the Food and Agriculture

CHAPTER 5 : LAnd ASSETS, CL imATE CHAnGE, And dEGRAdATion imPACTS 109
Organization (FAO), and biophysical data come from various sources. Future yield scenarios incorporate the effect of future climate predicted by RCPs, using RCP 4.5 as the BAU scenario and comparing it to RCP 7.0 as a high-emissions scenario and RCP 2.6 as a low-emissions sce-nario. The full methodology and data sources are described in Gerber et al. (2021).
While climate change can have either a negative or positive effect on crop yields, depending on the type of crop and region, at the global level one observes a negative impact on yields and cropland wealth in the high emissions scenario relative to the BAU and a positive impact in the low emissions scenario relative to the BAU. Global losses in cropland wealth under a high emissions scenario relative to BAU occur mainly in low- and middle-income countries, particularly in middle-income countries. Notably, the share of global wealth losses is similar between low-income and high-income countries but slightly higher for low-income countries (figure 5.5).
Figure 5.6 shows climate impacts on 2018 cropland wealth for the 10 most affected countries, specifically, the loss in total wealth between the high-emissions and BAU scenarios. Asian countries are the most affected, with China, India, Indonesia, and Malaysia at the top of the list.
Source: World Bank staff calculations.Note: Middle East and North Africa results are based on global average crop-yield growth rates because of outliers in country-level data. RCP = Representative Concentration Pathway.
11%
38%40%
1%
10%
Low-incomeLower-middle-incomeUpper-middle-incomeHigh-income: non-OECDHigh-income: OECD
FIGURE 5.5 Climate Change impact on Cropland Wealth, by income Group, 2018: High-Emissions Scenario (RCP 7.0) Relative to Business-as-Usual Scenario (RCP 4.5) share of global losses

THE CHANGING WEALTH OF NATIONS 2021110
The United States is the only high-income country among the 10 most affected countries, followed by middle-income and low-income coun-tries in Africa (Nigeria, Niger, Tanzania, and Cameroon) and South America (Brazil). Figure 5.7 shows the impacts of the low-emissions sce-nario relative to the BAU scenario. In this case, the differences between scenarios show the gains in cropland wealth for the most affected coun-tries. India would benefit the most from a low-emissions scenario com-pared with BAU. The rest of the list is similar to the list in figure 5.6, but Thailand and Ethiopia replace Tanzania and Cameroon.
It is important to note that these results are expected to be conserva-tive, because the model does not include a variety of mechanisms for the impacts of climate change. One example is the future change in daily pre-cipitation maxima, which could lead to greater impacts on crop yields. Increased atmospheric carbon dioxide and estimates of future crop mix and harvested area also affect the results. There are other sources of uncer-tainty in the model stemming from crop-yield modeling. As previous stud-ies have shown, climate change impacts on agriculture combining climate, crop, and economic models have shown substantial variation resulting from differences in models, scenarios, and data (Nelson et al. 2014).
Forest Ecosystem Services Trends and the Impacts of Degradation
Forests contribute to natural capital through timber and ecosystem ser-vices. In this edition of the CWON, forest ecosystem services include
Source: World Bank staff calculations.Note: RCP = Representative Concentration Pathway.
–16
–14
–12
–10
–8
–6
–4
–2
0
China
India
Indon
esia
Malaysi
a
Unite
d Stat
es
Nigeria
Brazil
Niger
Tanza
nia
Camero
on
Loss
in c
ropl
and
wea
lth (U
S$, b
illion
s)
FIGURE 5.6 Climate Change impact on Cropland Wealth: High-Emissions Scenario (RCP 7.0) Relative to Business-as-Usual Scenario (RCP 4.5) in the 10 most Affected Countries

CHAPTER 5 : LAnd ASSETS, CL imATE CHAnGE, And dEGRAdATion imPACTS 111
three categories. The first encompasses recreation, hunting, and fishing (referred to as “recreation services”). The second covers the more far-ranging watershed protection, including the benefits of forests for water quality and quantity, often in the context of controlling water flow and pollution from erosion and other sources, enabling hydropower, avoiding disasters, or the impact on crop yields by controlling weather (“water services”). Third are nonwood forest products.
Per hectare estimates of forest ecosystem services wealth for CWON 2021 were developed by Siikamäki et al. (2021), extending the analysis of Siikamäki, Santiago-Ávila, and Vail (2015), which was used in CWON 2018. The new work updates and augments the studies in the valuation database by incorporating newly available studies, complementing the previous metaregression analyses with machine-learning approaches to predict the economic value of forest ecosystem services, and formulating an operational method for identifying forest degradation based on remotely sensed data that can be applied globally at the grid cell level. These data are used to estimate how the economic value of different forest ecosystem services is affected by forest degradation. Using the results of this analysis, forest degradation is included as a determinant of the economic value of forest ecosystem services.
The metaregression estimation data set in Siikamäki et al. (2021) includes values from 53 countries on five continents. The most represented regions are Europe, North America, South America, and Southeast Asia. All the continents with forests and all the different forest biomes—humid tropics, dry tropics, temperate, and boreal—are represented. Socioeconomic,
Source: World Bank staff calculations.Note: RCP = Representative Concentration Pathway.
0
2
4
6
8
10
12
14
India
China
Indon
esia
Malaysi
a
Unite
d Stat
es
Nigeria
Niger
Brazil
Thaila
nd
Ethiop
ia
Gain
in c
ropl
and
wea
lth (U
S$, b
illion
s)FIGURE 5.7 Climate Change impact on Cropland Wealth: Low-Emissions Scenario (RCP 2.6) Relative to Business-as-Usual Scenario (RCP 4.5) in the 10 most Affected Countries

THE CHANGING WEALTH OF NATIONS 2021112
biophysical, climate, ecological extent, and ecological condition variables were constructed to estimate the global spatially explicit predictions of the different forest ecosystem services. The total value of forest ecosystem services per country is computed by multiplying the combined per hect-are value of recreation, nonwood forest products, and water services by the total forest area per country, measured using official international forest statistics from FAO. Total forest ecosystem services wealth by country is shown in map 5.1. The greatest concentration of ecosystem services wealth is in Europe, East Asia and Pacific, North America, and South America. The Middle East and North Africa and Sub-Saharan Africa have the low-est total forest ecosystem services wealth.
Between 1995 and 2018, the percentage change in forest ecosystem services wealth varied across types of ecosystem services and regions (figure 5.8). Water services increased in all regions, but the largest increases were in South Asia (240 percent) and East Asia and Pacific (140 percent). Recreation services also increased in all regions, with the largest percent-age changes in South Asia (432 percent), Latin America and the Caribbean (380 percent), and the Middle East and North Africa (381 percent). In contrast, nonwood forest products decreased in most regions (with only a very small increase in South Asia), with the largest percentage declines in East Asia and Pacific (−28 percent) and the Middle East and North Africa (–13 percent).
Global forest ecosystem services wealth estimates are conservative given that they include only three categories of ecosystem services: non-wood forest products, water services, and recreation services. Critical services such as habitat and species protection, cultural and/or existence
Source: World Bank.
IBRD 45864 | APRIL 2021
150,000–199,999100,000–149,99950,000–99,9990–49,999
No data
Constant US$ (millions)
200,000–499,999500,000–999,9991,000,000–1,499,999>1,500,000
MAP 5.1 Global Forest Ecosystem Services Wealth, 2018

CHAPTER 5 : LAnd ASSETS, CL imATE CHAnGE, And dEGRAdATion imPACTS 113
values, or landscape aesthetics (also analyzed by Siikamäki et al. 2021) are not included in the CWON accounts given the lack of proper market equivalent values consistent with the wealth accounting methodologies. A different approach is needed to account for the impacts of biodiversity loss on development outcomes, given that these services are largely unpriced by markets (World Bank 2021). Carbon retention is another key ecosystem service not considered here. As the System of Environmental-Economic Accounting wealth accounting methodologies expand to include carbon retention (see annex 1A, in chapter 1, for more details), this service is likely to become an important component of land and forest wealth, in particular for low- and middle-income countries. This has been captured in localized in-depth assessments, for example, in an analysis of sediment retention services in Nepal presented in box 5.1.
Forest degradation—the reduction of the capacity of a forest to pro-vide goods and services (FAO 2012)—may influence the flow of benefits that forests generate in the form of ecosystem services. Yet studies of for-est ecosystem services seldom estimate the effect of forest degradation on the value of these services. Valuation that does not consider forest condition is likely to overestimate the value of (1) forests on the edges of forest patches (because of their susceptibility to fire); (2) forests frag-mented by roads and other infrastructure (because of their impact on soil
Source: World Bank staff calculations.
–100
East
Asia
and P
acific
Europ
e and
Centra
l Asia
Latin
Ameri
ca an
d
the Cari
bbea
n
Middle
East
and
North A
frica
North A
merica
South
Asia
Sub-S
ahara
n Afric
a
0
100
200
300
400
500
% c
hang
e
Water services Recreation services Nonwood forest products
FIGURE 5.8 Change in Forest Ecosystem Services Wealth, by Type of Services and Region, 1995–2018

THE CHANGING WEALTH OF NATIONS 2021114
BOX 5.1 Case Study: Valuing Sediment Retention Services in nepal
Minimizing the loss of soil and downstream sedimentation is one of the most visible and immediate benefits
of watershed management. The positive impact can be felt across many sectors of the economy, including
agriculture, hydropower, and water. These practices also help to regulate water flows, help stabilize soils, maintain
soil fertility, improve soil water-holding capacity, regulate water quality in downstream rivers, mitigate shallow to
medium-depth landslides, and sequester carbon. They generate other on-site benefits to landholders such as
fuelwood and fodder for livestock.
Using the Kali Gandaki watershed in Nepal as the study site, the World Bank (2019) applies a systematic
approach to assess where, in what quantity, and through what processes sediment is being generated in the
Kali Gandaki watershed; identify plausible interventions through investing in green infrastructure approaches for
watershed management; and evaluate their impacts.
The results for watershed management portfolios ranging from US$500,000 to US$50 million show that such
programs can have a significant, positive impact across many sectors. The benefits are driven largely by local
benefits and the value of avoided lives lost in landslides, with the next highest beneficiary being downstream
hydropower (figure B5.1.1). At the US$500,000 budget level, each US$1 invested yields US$4.38 in benefits, but
this ratio drops as budgets are increased. However, even with an investment of US$50 million, the program’s
benefit-cost ratio is still greater than one, even without considering the carbon sequestration benefit.
Source: World Bank 2019.
Carbon
Lives
Roads
Structures
Hydropower
Landholder benefits
0
10
20
30
40
50
60
70
Bene
fit v
alue
(US$
, milli
ons)
Watershed management budget (US$, millions)
0.5 1.0 2.0 3.0 5.0 7.0 10.0 20.0 50.0
FIGURE B5.1.1 Values of the Sediment Retention Ecosystem Service of Watersheds, Total and by Sector

CHAPTER 5 : LAnd ASSETS, CL imATE CHAnGE, And dEGRAdATion imPACTS 115
erosion, water quality, and landscape connectivity); (3) monoculture tree plantations (particularly in water-scarce regions, because of their impact on water balance and loss of nonwood forest products and recreation); (4) heavily logged forests (because of their impact on water yield and water quality); and (5) degraded riparian forests that buffer streams (because of their impact on water quality and possibly fishing). Conversely, valuation that does not consider forest condition is likely to underestimate the value of forests in intact forests (which likely overlap with species-rich forest and forest with low human impact), forests that provide landscape connectivity to maintain the value of charismatic spe-cies for recreation and wildlife tourism, and forested indigenous and community lands that provide nonwood forest products to support livelihoods.
DeFries, Osuri, and Malhi (2021) propose a typology of forest deg-radation that includes three major types: (1) loss of biomass and struc-ture, (2) impoverishment of species composition, and (3) fragmentation of forests. Two main approaches exist to measure these three types of forest degradation. The first approach involves measuring degradation directly by examining data on productivity, biomass, or biodiversity over time. Any negative trends during the period of interest indicate degrada-tion. The second approach involves observing the drivers of degradation, such as human pressures on forests, including the development of roads or changes in population density, and using them to proxy forest degradation.
Siikamäki et al. (2021) explore a series of metrics for the two approaches and examine the role of forest degradation using a spatially explicit predictive model to forecast the values of four nonwood forest ecosystem services. The authors identify variables that are applicable for global predictions and assessment of the marginal effect of forest degrada-tion. The variables include the normalized difference vegetation index, forest cover change, number of threatened species, and percentage of threatened species. Data on the impoverishment of species composition and forest fragmentation are statistically significant predictors of the value of recreation ecosystem services, per hectare of forest. Species impoverish-ment is measured as the percentage of threatened species of all species at the site, subject to valuation. Forest fragmentation is measured as the change in the percentage of forest cover between 1992 and 2018. Keeping everything else constant, both variables drive down the value of the recre-ation services supported by a hectare of forest. Siikamäki et al. (2021) used the model to back-cast how the change in forest cover that took place between 1992 and 2018 affected the value of recreation ecosystem services (box 5.2).

THE CHANGING WEALTH OF NATIONS 2021116
Conclusion
Although total global wealth per capita in land assets (the sum of crop-land, pastureland, protected areas, forest timber, and ecosystem services) has increased, there are significant differences across regions and income groups, and there are trade-offs in assets in low- and middle-income coun-tries. Low-income countries as a group have experienced a decline in all land assets. Sub-Saharan Africa shows a similar trend.
Land assets continue to be a critical component of wealth in low- and middle-income countries. While this chapter considered only a subset of forest ecosystem services, recognition of their importance for global
BOX 5.2 Forest degradation and the Value of Recreation Services
Siikamäki et al. (2021) find that the global value of forest recreation ecosystem services in 2018 was on
average US$116.8 per hectare. As a combined result of forest losses and gains, the net change in the value of
recreation services from forests would be 1.75 percent lower than in the absence of any change in forest cover
between 1992 and 2018. But considerable heterogeneity exists between different countries in the effect of
forest degradation on the value of recreation ecosystem services. Eighty-seven countries, especially in South and
Central America, Sub-Saharan Africa, and Southeast Asia, experienced losses in the value of recreation services
(map B5.2.1). Other regions have gained as a product of forest cover gains, especially Europe and much of Asia
outside Southeast Asia.
Source: World Bank, based on data from Siikamäki et al. 2021.
IBRD 45899 | APRIL 2021
124.8
–60.4
Average % changeper hectare of forest
MAP B5.2.1 net Change in the Value of Forest Recreation Ecosystem Services Because of Change in Forest Cover between 1992 and 2018

CHAPTER 5 : LAnd ASSETS, CL imATE CHAnGE, And dEGRAdATion imPACTS 117
services like carbon retention and biodiversity protection highlights the need to develop robust policy mechanisms that generate income for coun-tries that provide these services and accounting methodologies to add these monetary values or complementary physical metrics to the wealth accounts.
This edition of the CWON incorporates several methodological improvements into the measurement of wealth in the land sector and pro-vides for the first time an assessment of climate change and degradation impacts on cropland and forest ecosystem services wealth, the two largest land assets. Inclusion of these factors (even with conservative impact esti-mates) shows the importance of sustainable management of land assets for low- and middle-income nations as degradation impacts have already occurred and future climate change and degradation could be obstacles to future development.
Besides including additional ecosystem services, future editions of the CWON could take a closer look at the interactions between forest accounts and other assets, in particular, agricultural assets and human capital. Novel analysis demonstrated the importance of studying the dynamic relationship between economic systems and forest ecosystem services, assessing how economic growth affects ecosystem services deliv-ery and feedbacks into growth, with important implications for the agri-culture sector (Johnson et al. 2021). The COVID-19 crisis highlighted the importance of better understanding the connections among forest condition, biodiversity, and human health. It is estimated that 60 percent of all infectious diseases in humans and 75 percent of all emerging infec-tious diseases are zoonotic, that is, they originate from the transfer of pathogens from animals to humans (UNEP 2016). Forest clearing for the expansion of the agricultural frontier and human settlement plays a key role in the emergence of zoonoses. Large-scale deforestation, along with land degradation, illegal trade in wildlife, and climate change, could lead to an increase in the occurrence of diseases like COVID-19 and its devas-tating economic consequences (Bloomfield, McIntosh, and Lambin 2020; Gibb et al. 2020).
Note
1. The “blue” economy is the sustainable use of ocean resources for economic growth, improved livelihoods, and jobs while preserving the health of ocean ecosystems. It encompasses economic sectors such as fisheries, maritime trans-port, tourism, and others dependent on ocean ecosystems (World Bank and UN 2017). In this report “blue natural capital” refers only to mangroves and fisheries.
References
Bloomfield, L. S. P., T. L. McIntosh, and E. F. Lambin. 2020. “Habitat Fragmentation, Livelihood Behaviors, and Contact between People and Nonhuman Primates in Africa.” Landscape Ecology 35: 985–1000.
THE CHANGING WEALTH OF NATIONS 2021118
DeFries, R., A. M. Osuri, and Y. Malhi. 2021. The Effects of Forest Degradation on Ecosystem Services. CWON 2021 background technical report, World Bank, Washington, DC.
FAO (Food and Agriculture Organization). 2012. The Forest Resources Assessment Programme: Terms and Definitions. Rome: FAO. http://www.fao.org/docrep/017 /ap862e/ap862e00.pdf.
Gerber, J., P. West, E. Butler, D. Ray, and J. Johnson. 2021. “Changing Wealth of Nations: Calculating Agricultural Value.” CWON 2021 background paper, World Bank, Washington, DC.
Gibb, R., D. W. Redding, K. Q. Chin, C. A. Donnelly, T. M. Blackburn, T. Newbold, and K. E. Jones. 2020. “Zoonotic Host Diversity Increases in Human-Dominated Ecosystems.” Nature 584: 398–402. https://doi.org/10.1038/s41586-020-2562-8.
Iizumi, T., J. Furuya, Z. Shen, W. Kim, M. Okada, S. Fujimori, T. Hasegawa, and M. Nishimori. 2017. “Responses of Crop Yield Growth to Global Temperature and Socioeconomic Changes.” Scientific Reports 7 (1): 7800. doi:10.1038 / s41598 -017-08214-4.
Johnson, J. A., G. Ruta, U. Baldos, R. Cervigni, S. Chonabayashi, E. Corong, O. Gavryliuk, et al. 2021. The Economic Case for Nature: A Global Earth-Economy Model to Assess Development Policy Pathways. Washington, DC: World Bank.
Levis, S., A. Badger, B. Drewniak, C. Nevison, and X. Ren. 2018. “CLMcrop Yields and Water Requirements: Avoided Impacts by Choosing RCP 4.5 over 8.5.” Climatic Change 146: 501–15. doi:10.1007/s10584-016-1654-9.
Mbow, C., C. Rosenzweig, et al. 2019. “Food Security.” In Climate Change and Land: An IPCC Special Report on Climate Change, Desertification, Land Degradation, Sustainable Land Management, Food Security, and Greenhouse Gas Fluxes in Terrestrial Ecosystems, edited by P. R. Shukla, J. Skea, E. Calvo Buendia, V. Masson-Delmotte, H.-O. Pörtner, D. C. Roberts, P. Zhai, et al., 437–550. Geneva: Intergovernmental Panel on Climate Change.
Nelson, G. C., H. Valin, R. D. Sands, P. Havlik, H. Ahammad, D. Deryng, J. Elliott, et al. 2014. “Climate Change Effects on Agriculture: Economic Responses to Biophysical Shocks.” In Proceedings of the National Academy of Sciences 111 (9): 3274–79. doi:10.1073/pnas.1222465110.
Ray, D. K., P. C. West, M. Clark, J. S. Gerber, A. V. Prishchepov, and S. Chatterjee. 2019. “Climate Change Has Likely Already Affected Global Food Production.” PLOS ONE 14 (5): e0217148. doi:10.1371/journal.pone.0217148.
Reyer, C. P. O., K. K. Rigaud, E. Fernandes, W. Hare, O. Serdeczny, and H. J. Schellnhuber. 2017. “Turn Down the Heat: Regional Climate Change Impacts on Development.” Regional Environmental Change 17: 1563–68. doi:10.1007 /s10113-017-1187-4.
Siikamäki, J., M. Piaggio, N. da Silva, I. Álvarez, and Z. Chu. 2021. “Global Assessment of Non-Wood Forest Ecosystem Services: A Revision of a Spatially Explicit Meta-Analysis and Benefit Transfer.” World Bank, Washington, DC.
Siikamäki, J., F. J. Santiago-Ávila, and P. Vail. 2015. “Global Assessment of Non-Wood Forest Ecosystem Services: Spatially Explicit Meta-Analysis and Benefit Transfer to Improve the World Bank’s Forest Wealth Database.” World Bank, Washington, DC (accessed June 14, 2019). https://www.wavespartnership.org /en/knowledge-center/global-assessment-non-wood-forest-ecosystem -services-spatially-explicit-meta.
Sultan, B., and M. Gaetani. 2016. “Agriculture in West Africa in the 21st Century: Climate Change and Impacts Scenarios, and Potential for Adaptation.” Frontiers in Plant Science 7: 1–20. doi:10.3389/fpls.2016.01262.
UNEP (United Nations Environment Programme). 2016. “UNEP Frontiers 2016 Report: Emerging Issues of Environmental Concern.” UNEP, Nairobi, Kenya.

CHAPTER 5 : LAnd ASSETS, CL imATE CHAnGE, And dEGRAdATion imPACTS 119
World Bank. 2019. “Valuing Green Infrastructure: Case Study of Kali Gandaki Watershed, Nepal.” World Bank, Washington, DC.
World Bank. 2021. “Unlocking Nature-Smart Development: An Approach Paper on Biodiversity and Ecosystem Services.” World Bank, Washington, DC. https://openknowledge.worldbank.org/handle/10986/36047.
World Bank and UN (United Nations Department of Economic and Social Affairs). 2017. The Potential of the Blue Economy: Increasing Long-Term Benefits of the Sustainable Use of Marine Resources for Small Island Developing States and Coastal Least Developed Countries. Washington, DC: World Bank. https:// openknowledge. worldbank.org/handle/10986/26843.