Embed Size (px)
Citation preview

Part I: FROM JOB COSTING to END-TO-END COST SHEETWebinar
By: David BirnbaumDate: 30 November 2020

The problem with the Basic cost sheet
The basic cost sheet serves little purposeYour customer does not care about your costsHe cares only about his costs, your FOB priceHe will not pay you more just because you costs are higherThe basic cost sheet does not help you, the factoryBecause it was prepared at the outset of the process and is based entirely on estimatesYou will not know the true costs until the completed and shippedAnd you have prepared the JOB COSTING
2
Basic CostsheetPCT of FOB Cost
Material Fabric 60.0% $6.00Material Trim 10.0% $1.00CM Labour 6.4% $0.64CM Overhead 18.6% $1.86CM Total Cost 25.0% $2.50Total Cost 95.0% $9.50Factory Profit 5.0% $0.50Total FOB Cost $10.00

Job Costing: Fabric
In real life, there are difficulties with each cost item. Let’s look first at the fabric where there are two interrelated problems. How does a factory account for leftover fabric? For example, 50,000 meters were delivered and after cutting all orders for that fabric, there are 600 meters left. The factory initially has two choices:a. Add the leftover fabric to the fabric costs of the various styles on a pro rata
basis;b. Add the additional fabric to inventory thus listing the fabric as an asset.
To make a rational decision, you have to look at the fabric type. a. If the fabric is 125g white jersey and the factory’s business is T-shirts, of course
the leftover fabric can be added to your inventory because it has value.b. If the fabric is chartreuse rayon shirting with puce polka dots which no future
customer is likely to want, the factory has no choice but to add a pro rata cost to each unit produced.
3

Fabric: Joint Cost ProblemThe second issue is how to prorate the added cost of fabric among the styles because it has value.
This is the basic JOINT COST PROBLEM. There are again two choices:A. Apportion the cost of the fabric on the basis of consumption;
Total order 200 pieces each style100 meters left over
2 styles.a. coat that consumed 3mb. Trousers that consumed 1.5
You would allocate as followsCoat 67m
67/200 = 3.33mTrousers 33m
33/200 =1.665
4
Fabric: Joint Cost Problem (Cont)
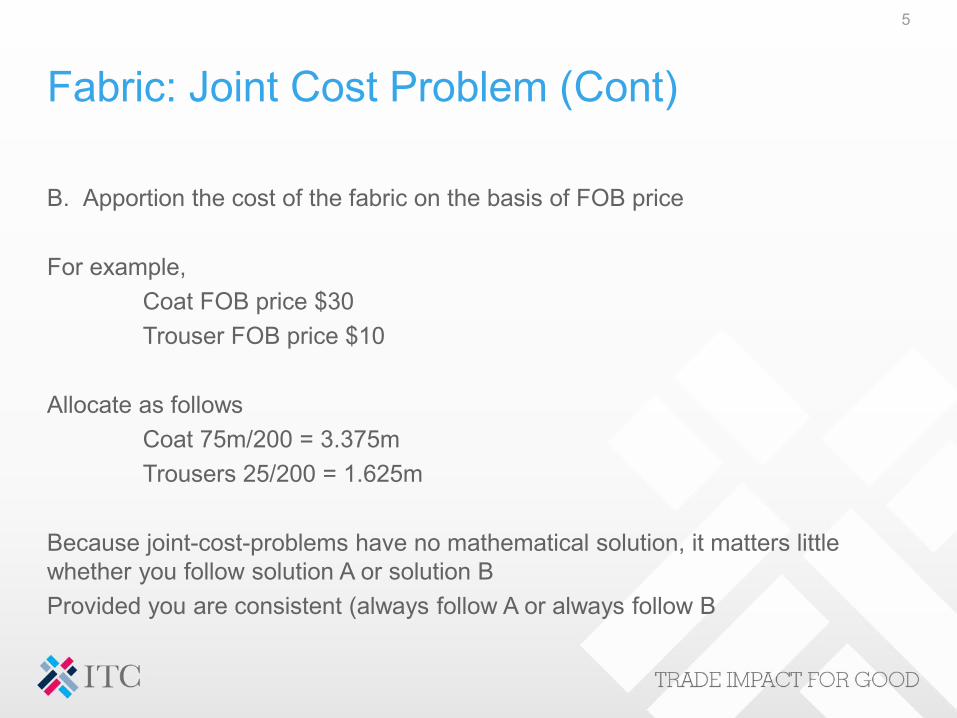
B. Apportion the cost of the fabric on the basis of FOB price
For example,Coat FOB price $30Trouser FOB price $10
Allocate as followsCoat 75m/200 = 3.375mTrousers 25/200 = 1.625m
Because joint-cost-problems have no mathematical solution, it matters little whether you follow solution A or solution BProvided you are consistent (always follow A or always follow B
5

Job Costing : Trim
Trim costing is more straightforward. While joint cost problems involving fabric are relatively unusual, those involving trim are extremely common and complicated.With the possible exception of customer’s labels, the cost of all purchased trim should be applied to the order. The leftover trim should not be included in inventory for accounting purposes because if it included for accounting purposes, old trim becomes an asset and adds to profit. The more old trim you have, the greater your profit?However it does exist and might be usable for future orders. NB: Before ordering trim for any order, we should first check existing inventory and subtract the in-house quantities from any new trim orders
6

Job Costing: Calculating Labor
For costing purposes, we define labor as wages and benefits paid to workers who are directly involved in the production processCuttersBundlersSewersInspectorsPressers Packers
NB: This does not include supervisors who are classified as staff and are therefore included in overhead.
7
Labor CalculationSewing labor cost for each style is calculated by the number of minutes required to produce one garment of that style times the worker’s wage per minute
Calculating minutes per piece is relatively easy. We require only the following informationa. Number of machines in the line.b. Number of working days factoring in overtimec. Number of pieces in the order
Style XYZ requires 38.4 sewing minutes per piece. This is an important piece of information
From the factory side:Necessary to determine garment cost: Necessary to determine changes in productivityNecessary to determine factory schedule and capacity
8

Labor Calculating Minutes Per Unit
To produce 10,000 pieces of Style XYZ, a 40-machine line requires 20 days
at an average of 8 working hours per-day = 38.4 minutes
9
Days Hours Minutes Line Units20 8 60 40 10,000
160 9,600 384,000 38.4
Labor: Calculating Sewing Cost per unit
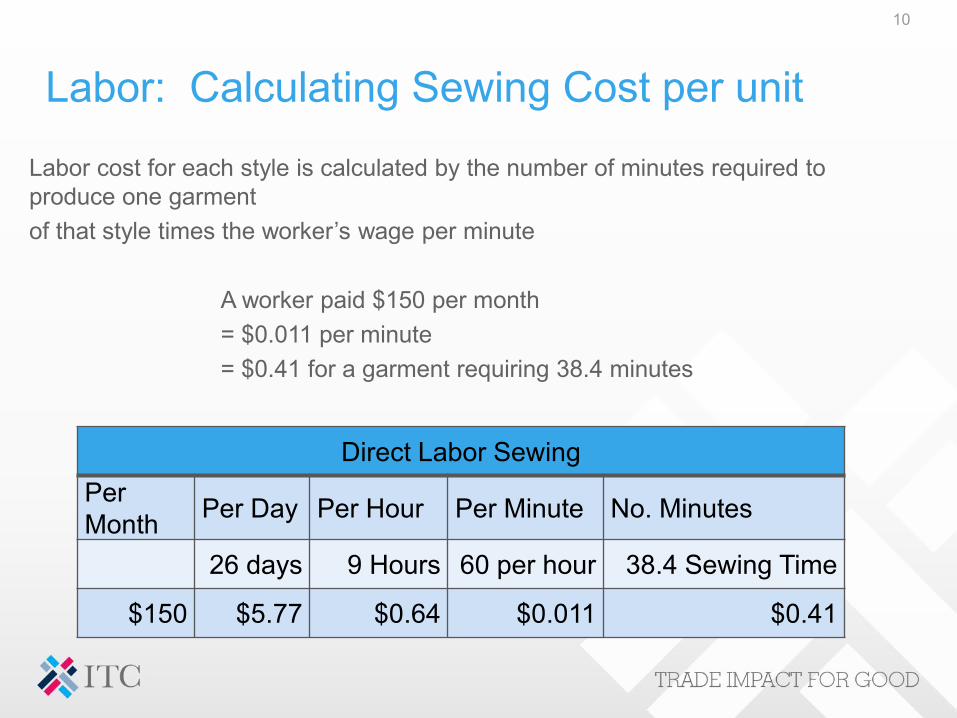
Labor cost for each style is calculated by the number of minutes required to produce one garment of that style times the worker’s wage per minute
A worker paid $150 per month = $0.011 per minute= $0.41 for a garment requiring 38.4 minutes
10
Direct Labor SewingPer Month Per Day Per Hour Per Minute No. Minutes
26 days 9 Hours 60 per hour 38.4 Sewing Time
$150 $5.77 $0.64 $0.011 $0.41
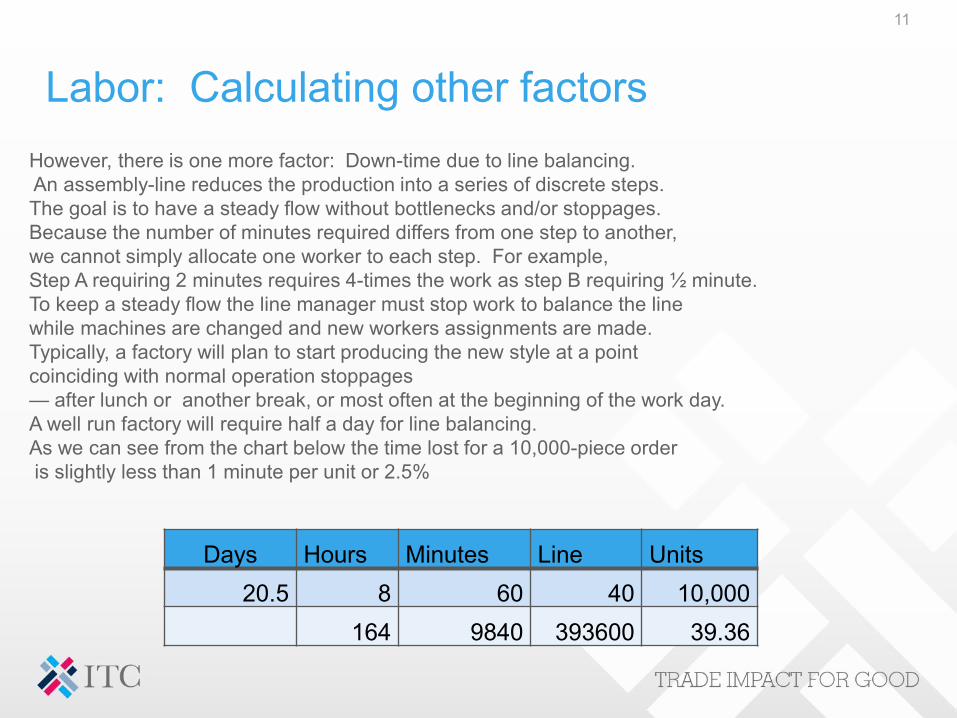
Labor: Calculating other factorsHowever, there is one more factor: Down-time due to line balancing. An assembly-line reduces the production into a series of discrete steps. The goal is to have a steady flow without bottlenecks and/or stoppages. Because the number of minutes required differs from one step to another, we cannot simply allocate one worker to each step. For example,Step A requiring 2 minutes requires 4-times the work as step B requiring ½ minute. To keep a steady flow the line manager must stop work to balance the line while machines are changed and new workers assignments are made. Typically, a factory will plan to start producing the new style at a point coinciding with normal operation stoppages— after lunch or another break, or most often at the beginning of the work day. A well run factory will require half a day for line balancing. As we can see from the chart below the time lost for a 10,000-piece orderis slightly less than 1 minute per unit or 2.5%
11
Days Hours Minutes Line Units20.5 8 60 40 10,000
164 9840 393600 39.36
Labor: Down Time
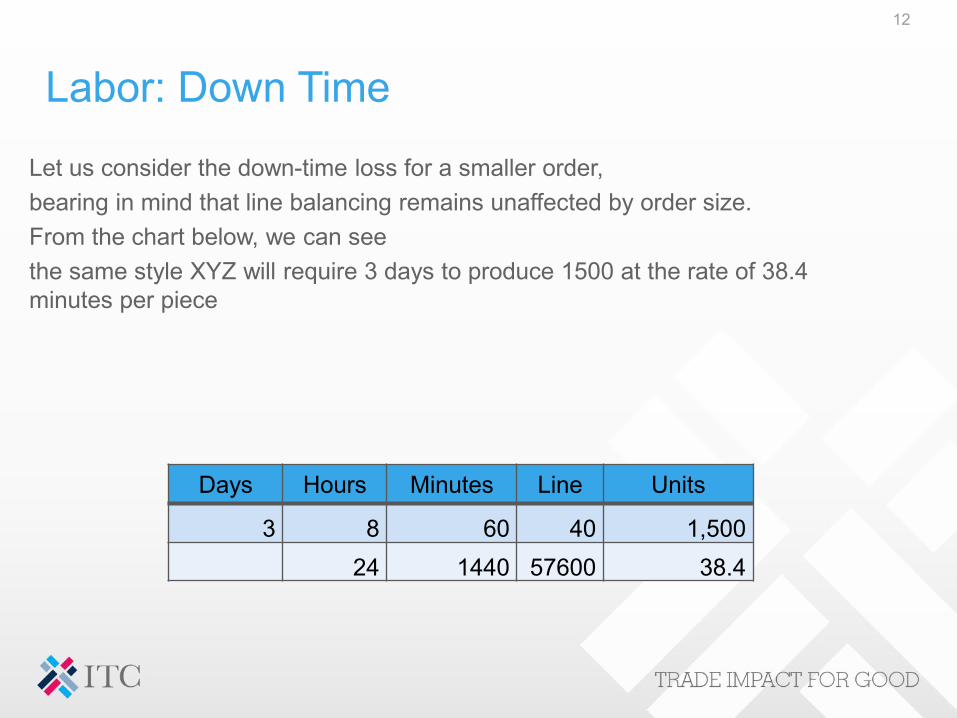
Let us consider the down-time loss for a smaller order, bearing in mind that line balancing remains unaffected by order size. From the chart below, we can see the same style XYZ will require 3 days to produce 1500 at the rate of 38.4 minutes per piece
12
Days Hours Minutes Line Units
3 8 60 40 1,50024 1440 57600 38.4
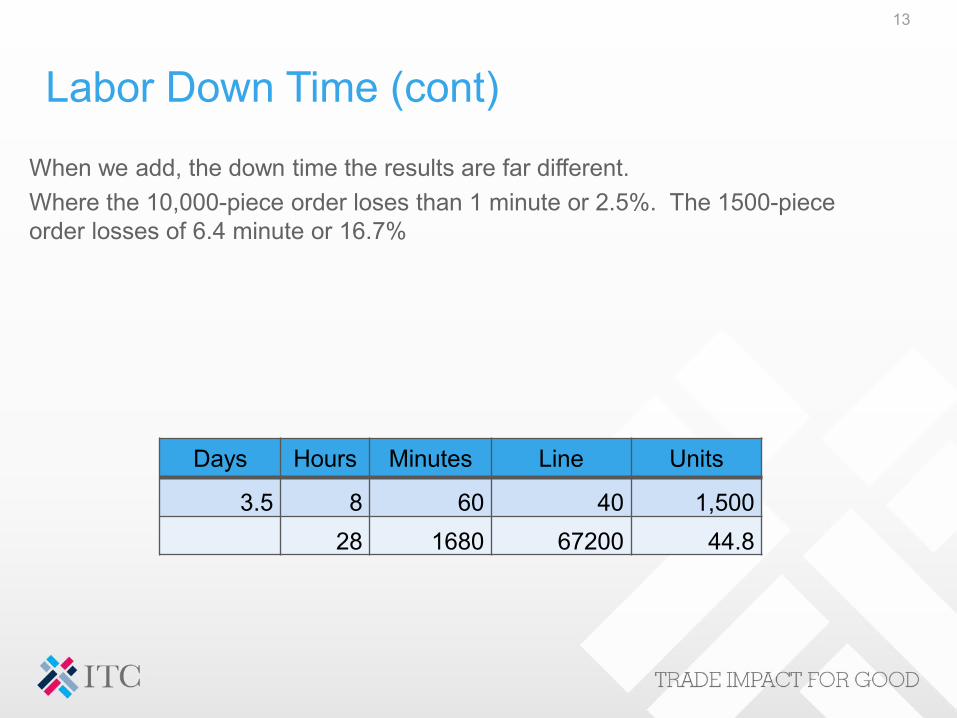
Labor Down Time (cont)
When we add, the down time the results are far different. Where the 10,000-piece order loses than 1 minute or 2.5%. The 1500-piece order losses of 6.4 minute or 16.7%
13
Days Hours Minutes Line Units
3.5 8 60 40 1,50028 1680 67200 44.8

Labor Other Hidden Factors
There are other hidden factors:
a. Introducing a new style in a line does not mean that 40 machines start work at once. Work begins at step 1 and over a period of time moves through the line to the point where all forty machines are operating.
b. The learning curve: Sewers need time to adapt to the new style during which productivity is reduced.
Once again, the actual time lost is unrelated to the size of the order.
One point is clear, we cannot effectively produce 1500 garments in a 40-machine line. Not only are the cost prohibitive, but as we will see below line balancing my no longer be possible.
14

Labor: Line BalancingHow do we balance the line?
100 years ago, line balancing simply meant adding a greater number of sewers to the more difficult operations. In the example above, Step A would require 4 sewers while step B would require but a single sewer. This line-balancing method required the ability to determine the number of minutes necessary for each step. Not only was this inefficient but failed to take into consideration the hidden factors listed above.
Today, successful factories no longer think of their sewers as automatons but rather as people. Line supervisors categorize their sewers into A-B-C classifications. Rather then throwing 4 bodies at step A, the supervisor would allocate 2 class A sewers. Furthermore, the best line supervisors will provide on-the-job training to raise the standards of his line.
Management will bring in qualified engineers to introduce new production techniques not only to train workers but also supervisors for the entire factory Almost all contemporary production techniques are based on worker empowerment.
15
Labor: Line Balancing (cont)
All of this brings us to the point where line balancing eventually becomes impossible. As a factory trades up from commodities to fashion goods and lower value-added to higher value-added products, the size of the order diminishes and with it the size of the line. At some point, usually at about 20 machines the line can no longer be balanced because we cannot assign 1½ sewers to an operation. Or can we?
The short answer is we can assign a half worker. This is called multi-tasking, where each sewer carries out several steps. At this point the single tasked line is replaced by a multi-tasked team, where 25+ operations are carried out by 8-12 sewers. The team can operate effectively only when they are totally empowered. In successful operations the team itself decides which steps to carried out by each worker. They recognize that people are individuals with different skill sets and the team wants to assign each worker the operations they are most qualified to carry out. In a sense, the team becomes an independent contractor that makes use of the factory space and equipment. No more line supervisors because there are no more lines. The factory management cares only about quality.
16
From Sewing Cost Per Unit to Total Labor Cost Per UnitAs shown above, we also have other direct laborCuttersBundlersSewersInspectorsPressers Packers The factory’s account department has records of total wages for the designated period. To find the cost per unit for ancillary labor, we need only determine what percent of total wages is sewing. If, for example, wages for the period totaled $1000 of which sewers received $667, then we know that sewing equals 2/3 of total wages. Therefore if the sewing cost per unit for a particular order equals $1.00 then cost per unit for ancillary labor would equal $0.50 and total wages per piece for that order would equal $1.50
17

Job Costing : Overhead
There are two problems here:1. Breaking down overhead: As we have seen above, the factory’s account department can
provide data for total overhead for the period. The problem is how to break down total overhead to overhead-per-piece. The simplest and most practical solution is to relate overhead cost to labor. We know that the more difficult styles take longer than the easy styles and therefore the overhead should be greater. Labor cost per unit also reflects the degree of difficulty. Therefore we can calculate overhead as a proportion of labor.
2. Seasonality: This is a more complex problem. A factory is a closed-room operation where there is a maximum level of production. At some point the production reaches 100% of capacity. At the same time, because our industry operates on a seasonal basis, there are months when production falls below capacity. Therefore, the annual average must be less than 100% of capacity soi we cannot base overhead on 100% capacity.
a. Working with the account department, the factory can come up with a reasonable estimate for overall annual capacity. A reasonable overall annual figure might be 70%. section
b. Keeping the job costing as is. This will still show the profit (or loss) for each style, but will not show the total profit (or loss) for the company. Therefore, when carrying out profit and loss statements, we have to calculate the ratio of total overhead for each month against total overhead for all job costings for the month and increase overhead accordingly
18

Job Costing: Case Study Job Costing:This is one of most important tools in our cost to value tool-box. Because it is created at the beginning of the process, the cost sheet is at best an inaccurate estimate of the style’s per unit cost.We can only know the real cost after the order has been produced.
19
Case Study: Basic Costsheet vs Job CostingThe factory has an order for 10,000 pieces.
Basic Costing: 10,000 pieceMaterial 60% $60,000Trim 10% $10,000CM 30% $30,000 CM BreakdownFOB 100% $100,000 Labor $6,410.26
Overhead $18,589.74 2.9 Total Cost $95,000Total Revenue $100,000
Net Profit 5.00% $5,000

Job Costing vs Basic Cost Sheet
20
Case Study: Basic Costsheet vs Job CostingThe factory has an order for 10,000 pieces.
Basic Costing: 10,000 pieceFabric 60% $60,000Trim 10% $10,000CM 30% $30,000 CM BreakdownFOB 100% $100,000 Labor $6,410.26
Overhead $18,589.74 2.9 Total Cost $95,000Total Revenue $100,000
Net Profit 5.00% $5,000However, the job costing tells a different story
JOB Costing: 10,000 piecesMaterial 60% $61,000Trim 10% $9,300
Labor $6,169.88Overhead $22,307.69
Total Cost $98,778Total Revenue $99,300
Net Profit 0.53% $522

Job Costing 8: Sample Job Costing: Notes
21
Fabric: The factory ordered 30,000 meters of our well-known chartreuse shirting with puce polka dots, but received 30,500 meters. Since the additional 500 meters is well within the accepted range deviation, the factory accepted the goods Rather than cutting the additional fabric (which they under the normal contract allowing for 3% over-shipment they were entitled to do), the outstanding 500 meters was written off.Trim: The factory enjoyed a 7% savings because the cost of the trim taken from stock from stock was greater than the cost of the trim overage, which was written off.Labour: Here again the factory did well. The costing listed production time at 40 SAM, but the actual production time was 38.5 SAMOverhead. This was the big loss. The costing was based $1.86 per unit (2.9 times labor) but due to the fact that the order was produced during a slow period when total orders were less than capacity, the overhead increased from $1.86 per unit to $2.23 per unit. This is a common problem in any seasonal industry. The total overhead does not relate to the number of units produced (you pay the same rent even if you produce 0 garments). As a result the overhead per unit rises as he number of units produced falls. The factory can overcome this by making a provision in its overhead calculation.Total Revenue: 10000 pieces cut but only 9930 shipped with the result that total revenue was reduced from $100,000 to $99,300

Job Costing : Benefit Which Customer Provides the Greatest Profit
22
Net Profit by Customer by Period Customer Name Total Sales Gross Profit Net ProfitAble $1,000 12.5% 4.0%Baker $800 30.0% 12.0%Charley $700 20.0% 6.0%Delta $550 5.0% -3.0%Echo $400 16.0% 1.0%Frank $320 16.0% 2.0%
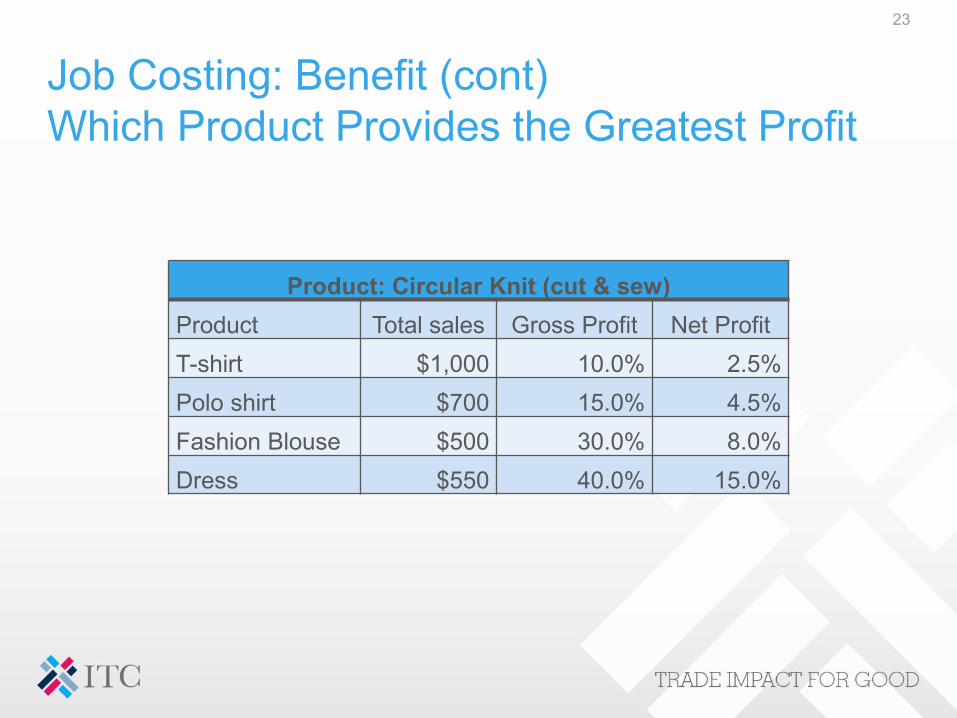
Job Costing: Benefit (cont)Which Product Provides the Greatest Profit
23
Product: Circular Knit (cut & sew)Product Total sales Gross Profit Net ProfitT-shirt $1,000 10.0% 2.5%Polo shirt $700 15.0% 4.5%Fashion Blouse $500 30.0% 8.0%Dress $550 40.0% 15.0%

Job Costing: Benefit (cont) High Season vs Low Season
24
In a world without seasons, the volume of business would remain constant each month at 8.33%, because 8.33% times 12 months equals 99.99%. In the chart below, exports in March were less than half of exports in August, meaning overheads per unit in March were more than double that in August.
Percentage Garment Exports by Month
Month 01 02 03 04 05 06 07 08 09 10 11 12
% of Annual 8.6% 7.3% 5.2% 5.8% 6.6% 8.4% 10.8% 11.8% 11.1% 10.2% 7.3% 6.9%
Value ($.000) 859 735 522 582 656 836 1081 1179 1113 1021 729 687 10000

High Season Low Season Graph
25
5%
6%
7%
8%
9%
10%
11%
12%
01 02 03 04 05 06 07 08 09 10 11 12
PCT Total Exports by Month

High Season vs Low SeasonMinimizing Low Season Loss
26
In Low season you are going to lose money. The goal is to reduce the losses, by increasing sales. One method is to increase sales from your current customers by reducing your FOB price. The question is, how much can you give away and still come out ahead.
It is all about overhead
You will recall ffrom our basic costing we calculated overhead to be $3.00. If gave the customer a reduction of 10%, this would amount to only $0.30 and given that overhead also includes profit, we might even come out ahead.Even a reduction of 20% ($0.60) would still be to our advantage
Job Costing PCT Labor
Overhead $2.23 362%
PCT Annual Exports Vs AVG 8.33% Overhead Added OH
March 5.2% 62.4% 576% $3.57 -$1.34
April 5.8% 69.6% 517% $3.20 -$0.97
May 6.6% 79.5% 452% $2.80 -$0.57
Other Cost Factors:Branch Factories
Factory groups with multiple branch operations should treat each branch as an independent unit. In this way management can compare the performance of one branch over another. There are important factors to consider:
1. The branch factory should not be subsidized for work performed by the head factory. For example, if the head factory provides product development, the added cost of product development should be added to the branch factory cost sheet.
2. The branch factory that performs special services should benefit from those services. For example, if the branch offers fast turn, both the added cost and profit should be included in the branch factory cost sheet.
3. If the branch factory offers value to the customer completely apart from anything it does, such as close proximity or duty-free access, those benefits should also be included in the cost sheet.
27

Other Cost Factors:Subcontract FactoriesFor the purpose of costings, the relationship between the factory and the subcontractor should be the same as an agent with the factory, with the subcontractor playing the role of a separate factory. As with any agent-factory relationship, gross profit should be calculated as a commission.
Once again, the factory does not want to subsidize the work of the subcontractor. It is therefore important that all work provided by the parent company be part of the overhead to be deducted from the subcontractor’s gross profit.
As the industry progresses, and the role of the supplier becomes increasingly more important, qualified factories no longer have to accept any order, from any customer, at any price. In this new model industry, the factory will have the choice of which customer it wants to work with.
The data obtained from the job costing is an indispensable tool allowing the factory to make the right choices, whether they are choosing one customer over another or one product over another. Customers and products for orders during low season will also be highly valued.
28

The Limits of the Basic Cost Sheet
29
The basic cost sheet is limited to FOB. In today’s world FOB is of little importance to total costs because total cost is based on retail Price1. A garment with an FOB price of $10.00 will retail for $60-$80, with the result that FOB is only 16.7%-12.5% of
the retail price2. In today’s world where garments are sourced, where the customer has prices for all materials, CM is the only
area of negotiation between the customer and the factory. A CM of $3.00 is only 5.0%-3.8% of retail3. Most of the CM is not open to negotiation. The factory cannot ask workers to acceptages nor can they ask the
electric company to reduce is bill claiming the customer is paying less. Indeed the only area open to negotiation is profit. A profit of $0.50 is only 0.8%-0.6% of retail.
Why do customers and their suppliers concentrate their efforts over the 1% and ignore the other 99%
Factory Cost as a PCT of Retail Price
FOB $10.00 PCT of RetailRetail Price $60-$80 16.7%-12.5%CM $3.00 5.0%-3.8%Profit $0.50 0.8%-0.6%

Beyond the limits of the Basic Cost Sheet (cont):Determining the costs of items not on the cost sheet
30
Increased fabric Cost ≠ increased garment costBack to our Basic Cost Sheet
Imagine your factory is located in Mexico, a country with a free-trade agreement with the U.S. However, to enjoy duty-free-access, all materials have to be of US origin or imported from a country member of the same FTA.
Assume that local fabric is available but at a higher price that would increase fabric cost from $6.00 to $7.00. The basic cost sheet shows only that local fabric increases FOB cost from $10.00 to $11.00 which renders the use of local fabric unacceptable because import duty has not included in the Basic Cost sheet
Basic CostsheetFabric 60% $6.00Trim 10% $1.00CM 30% $3.00FOB 100% $10.00

Beyond the limits of the Basic Cost Sheet (cont):Determining the costs of items not on the cost sheet
31
Chinese Fabric vs Local FabricChinese Fabric Local Fabric
factors Cost Cost FactorsFabric 60.0% $6.00 $7.00 63.6%Trim 10.0% $1.00 $1.00 9.1%CM 30.0% $3.00 $3.00 27.3%FOB 100.0% $10.00 $11.00 100.0%Duty 16.2% $1.62 $0.00LDP $11.62 $11.00
Beyond the limits of the Basic Cost Sheet 1:Determining the costs of items not on the cost sheet 3The End-to-End Cost sheet
32
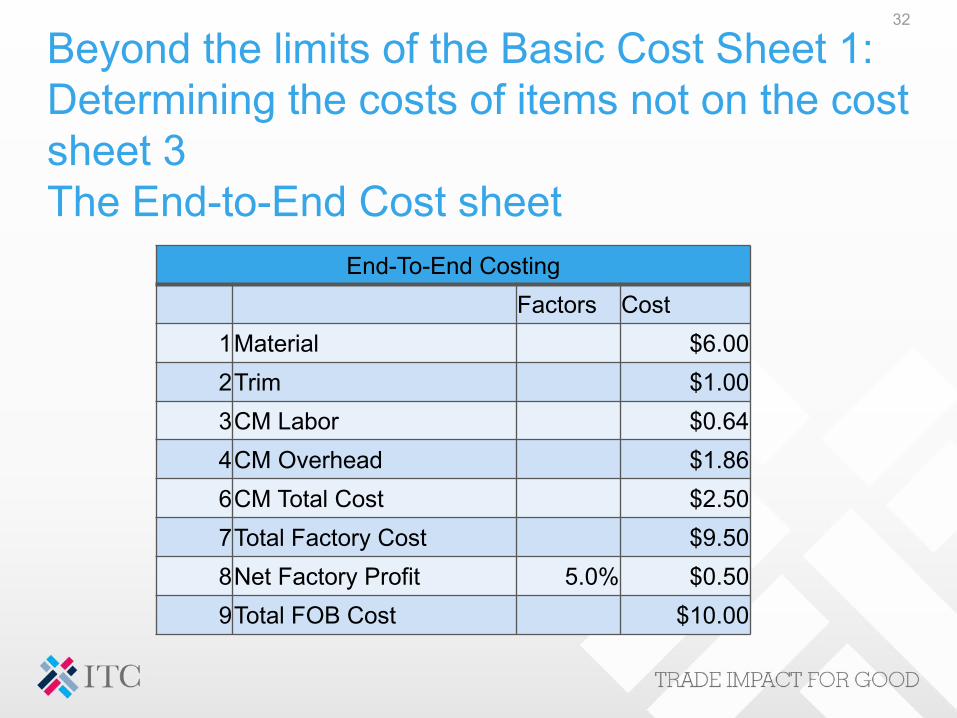
End-To-End CostingFactors Cost
1Material $6.002Trim $1.003CM Labor $0.644CM Overhead $1.866CM Total Cost $2.507Total Factory Cost $9.508Net Factory Profit 5.0% $0.509Total FOB Cost $10.00

The End-to-End Cost sheet
33
Factors Cost1Material $6.002Trim $1.003CM Labor $0.644CM Overhead $1.866CM Total Cost $2.507Total Factory Cost $9.508Net Factory Profit 5.0% $0.50
9Total FOB Cost $10.0010Agent Commission 5.0% $0.5011Freight $0.2512Duty 16.2% $1.6213Clearance $0.1014Transport $0.1515Total DDP $12.6216Product Development Loading 20.0% $2.5217Distribution Center Loading 5.0% $0.6318 In-Store $15.7819Markup 75.0% $47.3320Retail $63.1021Markdown 33.0% $20.8222Net Retail $42.2823Net Customer Profit $26.50

The End-to-End Cost sheet: 2
34
10Agent Commission 5.0% $0.5011Freight $0.2512Duty 16.2% $1.6213Clearance $0.1014Transport $0.1515Total DDP $12.6216Product Development Loading 20.0% $2.5217Distribution Center Loading 5.0% $0.6318In-Store $15.78

The End-to-End Cost sheet: 3
35
19Markup 75.0% $47.3320Retail $63.1021Markdown 33.0% $20.8222Net Retail $42.2823Net Customer Profit $26.50
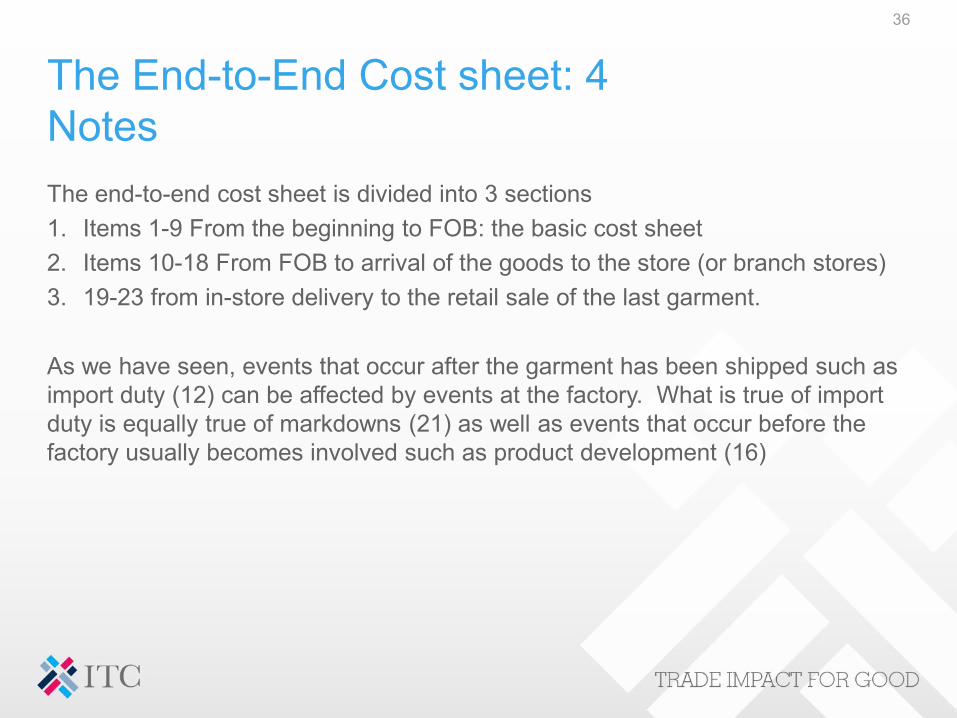
The End-to-End Cost sheet: 4NotesThe end-to-end cost sheet is divided into 3 sections1. Items 1-9 From the beginning to FOB: the basic cost sheet2. Items 10-18 From FOB to arrival of the goods to the store (or branch stores)3. 19-23 from in-store delivery to the retail sale of the last garment.
As we have seen, events that occur after the garment has been shipped such as import duty (12) can be affected by events at the factory. What is true of import duty is equally true of markdowns (21) as well as events that occur before the factory usually becomes involved such as product development (16)
36

The Greatest CostCase Study: The $0.09 LossThis is the problemIt is all about patternmaking The cost for patternmaking when carried out in the customer’s home country = $0.10
per sold unit The cost for patternmaking when carried by the factory = $0.01 per sold unit Which costs less?If you said patternmaking by the factory is less --- The customer saves $0.09 --- would be wrongLook back to the end-to-end cost sheet. Look for patternmaking. Patternmaking is in the cost sheet. It is a part of product development (16). The problem is that the cost of patternmaking is locked into product development, which means that the cost of every garment imported by the customer is charged $0.10 for patternmaking
REGARDLESS OF WHO OR WHERE THE PATTERN WAS CUT.To this we have to add the cost of patternmaking by the factory --- $0.01.Therefore the correct answer is the cost of patternmaking by the customer = $0.10The cost of patternmaking by the factory = $0.11According to the end-to-end cost sheet, the $0.09 savings never existed
37

Understanding Costs and Cost sheets
The story of the lost $0.09 is not some party trick.It is the single most serious and most important cost factor
Indeed it explains why management decisions often fail achieve the expected goals
The lost $0.09 is the subject of the advanced presentation
38