Embed Size (px)
Citation preview

Part III Quiz
I. Use the following information to make a December 31,1999, classified balance sheet for Slow Clean Laundry.Income was $100,000 and dividends of $40,000 were paid to owners of common stock.
34
Notes provided bywww.businessbookmall.comare available at Amazon.comby seat;chingWalter Antoniotti.
Accounts Receivable $21,000 Common Stock $145,000
Inventory 9,000 Salaries Payable 2,100
Taxes Payable 11,000 Equipment 190,000
Prepaid Expenses 2,000 Accounts Payable 19,900
Cash in Checking Account 22,000 Land 100,000
Contributed Capital in Excess of Par-CS 35,000 Allowance for Bad Debts 1,000
Accumulated Depreciation 10,000 Bonds Payable 60,000

II. Complete a December 31,1998,statement of cash flows forNetcon Corporation.A. Net income for 1998 was $490,000.B. Dividends of $100,000 were paid.C. Depreciation expense for 1998 was
$100,000
Analysis Notes provided bywww.businessbookmall.comare available at Amazon.com
by searching Walter Antoniotti.
35
NetconCorporationBalanceSheets
December31,1998Assets 1998 1997 ChangeCash $ 1,200,000 $ 1,100,000 $ 100,000Accounts Receivable (Net) 1,400,000 1,000,000 400,000Prepaid Expenses 105,000 100,000 5,000Inventory 1,200,000 800,000 400,000Land 9,000,000 9,000,000 0Fixed Assets (Net) 6.270.000 5.700.000 570.000TotalAssets $19,175,000 $17,700,000 $1,475,000
LiabilitiesandEquity
Accounts Payable $ 1,307,000 $ 890,000 $ 417,000Salaries Payable 15,000 10,000 5,000Notes Payable 8,500,000 8,500,000 0Stockholders' Equity 9.353.000 8.300.000 1.053.000TotalLiabilities $19,175,000 $17,700,000 $1,475,000
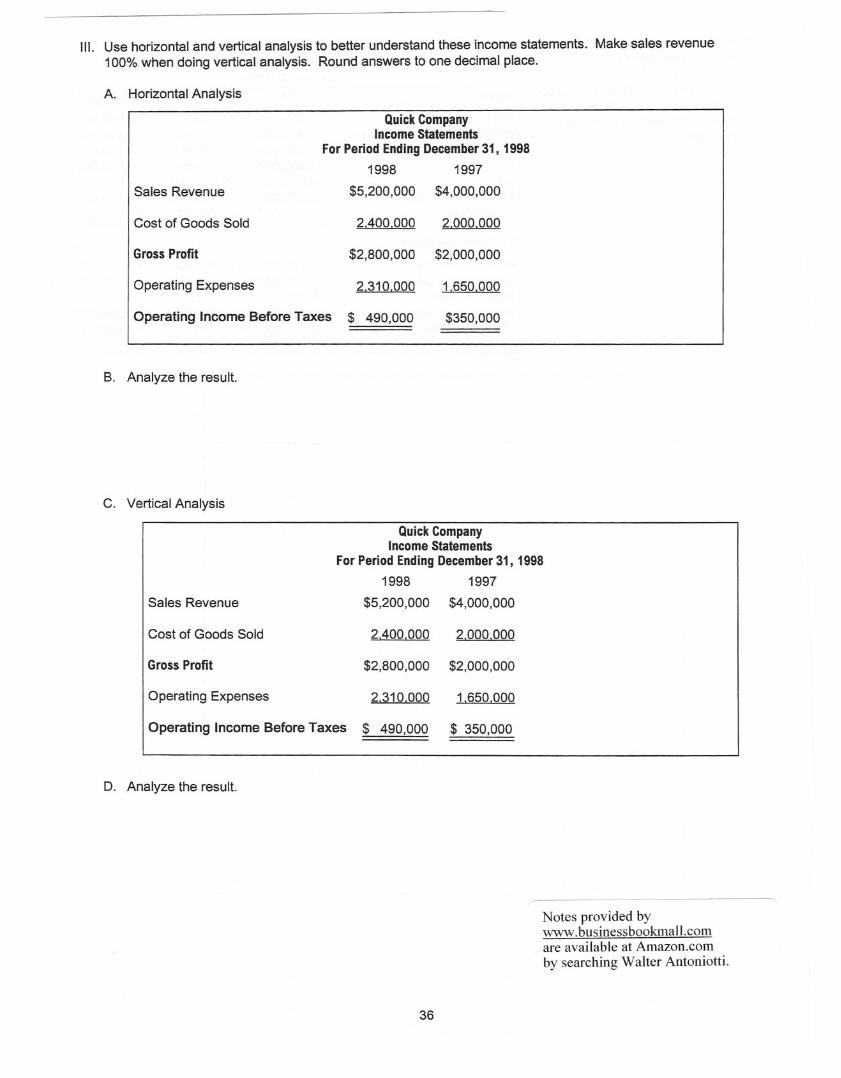
III. Use horizontal and vertical analysis to better understand these income statements. Make sales revenue100% when doing vertical analysis. Round answers to one decimal place.
A. Horizontal Analysis
Sales Revenue
QuickCompanyIncome Statements
For Period Ending December 31, 1998
1998 1997
$5,200,000 $4,000,000
Cost of Goods Sold 2.400.000 2.000.00_0
Gross Profit $2,800,000 $2,000,000
Operating Expenses 2.310.000 j .650.001)
Operating Income Before Taxes $ 490,000 $350,000
B. Analyze the result.
C. Vertical Analysis
Sales Revenue
QuickCompanyIncome Statements
For Period Ending December 31, 19981998 1997
$5,200,000 $4,000,000
Cost of Goods Sold 2.400.QOQ 2.000.000
Gross Profit $2,800,000 $2,000,000
Operating Expenses 2.310.0_0_0 1.650.0_00
Operating Income Before Taxes $ 490,000 $ 350,000
D. Analyze the result.
Notes provided bywww.businessbookmall.comare available at Amazon.comby searching Walter Antoniotti.
36

IV. This problem continues the trend analysis problem started in Unit 15 on Financial Statement Analysis.Complete the trend analysis and analyze the result. Round answers to nearest percent.
Sales Revenue (Net)Cost of Goods SoldGrossProfitOperating ExpensesOperating Income Before Taxes
QuickCompanyIncomeStatements
ForPeriodEndingDecember31, 20011997 1998 1999
$4,000,000 $5,200,000 $6,500,0002.000.000 2.400.000 2.760.000
$2,000,000 $2,800,000 $3,740,0001.650.000 2.310.000 2.541.000
$ 350,000 $ 490,000 $1,199,000
2000
$7,475,0003.036.000
$4,439,0002.668.050
$1,770,950
2001
$8,222,5003.339.600
$4,882,9002.134.440
$2,748,460
Analysis
37
QuickCompanyNet IncomeTrendAnalysis
ForPeriodEndingDecember31, 20011997 1998 1999 2000 2001
SalesRevenue $4,000,000 $5,200,000 $6,500,000 $7,475,000 $8,222,500Change $1,200,000 $1,300,000 $975,000 $747,500% Change 30% 25% 15% 10%
Costof GoodsSold $2,000,000 $2,400,000 $2,760,000 $3,036,000 $3,339,600Change $400,000 $360,000 $276,000 $303,600% Change 20% 15% 10% 10%GrossProfit $2,000,000 $2,800,000 $3,740,000 $4,439,000 $4,882,900Change $800,000 $940,000 $669,000 $443,900% Change 40% 34% 18% 10%

V. Do a ratio analysis for December 31,1999. See problem IV on page 37 for 1999 income statement data.Income taxes were $199,000 in 1999. Round answers to one decimal place.
A. LiquidityRatios
1. CurrentRatio CurrentAssets -CurrentLiabilities-
2. QuickRatioQuick Assets
Current Liabilities -
B. ActivityRatios
1. Accounts Receivable Turnover Net Receivable Sales -Average NetAccounts Receivable -
2. AverageCollectionPeriodAverage Net Accounts Receivable
Net ReceivableSales365
3. InventoryTurnoverCost of Goods Sold
Average Inventory -
4. Long-TermAsset Turnover NetSales -Average Long-Term Assets -
C. Profitability Ratios
1. Returnon Sales Operating Income -Net Sales -
2. Returnon Equity OperatingIncome -Average CommonStock Equity -
D. LeverageRatio
1. Debt-to-EquityRatio Total Liabilities -Stockholders' Equity-
38
QuickCompanyBalance Sheet$
December31,1999Assets 1999 1998 Liabilities 1999 1998
Cash $ 1,300,000 $ 1,200,000 Accounts Payable $ 1,607,000 $ 1,307,000Accounts Receivable (Net) 1,900,000 1,400,000 Salaries Payable 55.000 15.000
Prepaid Expenses 110,000 105,000 TotalCurrentLiabilities $ 1,662,000 $ 1,322,000Inventory 1.700.000 1.200.000 Notes Payable 8.500.000 8.500.000Total Current Assets $ 5,010,000 $ 3,905,000 Total Liabilities $10,162,000 $ 9,822,000
Land 9,000,000 9,000,000 Stockholders'EquityFixed Assets (Net) 5.970.000 6.270.000 Stockholders'Equity 9.818.000 9.353.000
Total Assets $19,980,000 $19,175,000 TotalLiabilitiesand Equity $19,980,000 $19,175,000


![TOEFL Vocabulary Quiz Book[1]](https://img.dokumen.tips/doc/110x75/5695cfc41a28ab9b028f724f/toefl-vocabulary-quiz-book1.jpg)