Embed Size (px)
Citation preview

PART 2
COUNTRY CASE STUDY
205

Lao PDR and its Development Partners in East Asia
(China and Japan)
Syviengxay Oraboune
INTRODUCTION
The Lao People’s Democratic Republic (Lao PDR) is a landlocked country
situated in the center of the Indochina Peninsula where it shares borders with China,
Vietnam, Cambodia, Thailand, and Myanmar. The country covers an area of 236,800
km2, much of which is mountainous, forested, and covered by rivers. It has a population
of 5.7 million people and a population density of 22 persons-/km2. An estimated 49
ethnic groups live in Lao PDR. Its economy is basically agricultural; about 80% of the
population is engaged in farming.
In 1986, the Lao government adopted a relatively comprehensive reform
program called the New Economic Mechanism to shift from a centrally planned
economy to a market- oriented one. Despite its political regime, the government of
Lao PDR has developed a good relationship with all countries in the world, with the
ultimate goal of attaining development through cooperation and collaboration with
international communities. In 1992, Lao PDR joined a sub-regional economic
cooperation program known as the Greater Mekong Sub-region (GMS). In 1997, it
became a full member of the Association of Southeast Asian Nations (ASEAN).
Cognizant of the importance of international cooperation, Lao PDR has forged
diplomatic relations with 128 countries worldwide to date (Ministry of Foreign Affairs,
2008). Foreign direct investment (FDI), foreign trade, and official development
assistance (ODA) have all been addressed as important factors for the development of
the Lao economy, especially in the implementation of the country’s annual plan and
five-year plan. The government recognizes economic growth as the primary means by
206
which income can be raised and poverty reduced, both of which must happen if the
country is to achieve its vision of graduating from the list of Least Developed Countries
(LDCs). Although the government considers investments as the most important source
of growth, the country looks to foreign investments to help it attain its macro
development goals because of limited domestic investments.
The foreign sector, through FDI, international trade development, and ODA, has
played a significant role in the socioeconomic development of Lao PDR. Two countries
from the East Asian region, namely China and Japan, have been particularly dominant
in those three areas. Japanese ODA has contributed to approximately one-fourth of the
total aid that Lao PDR receives yearly. Japan has also made significant investments in
the country’s public infrastructure and contributed to the development of its private
sector.
On the other hand, China has been the second largest source of total FDI value
in Lao PDR since the early 2000s. The value of the investments China has made in Lao
PDR’s industrial development has contributed to the country’s growth. The current
dynamism of China’s economy is also seen as an important opportunity for the
development of Lao production through the expansion of trade and economic ties
between these two countries.
This paper aims to review the significance of China’s and Japan’s contributions
to the socioeconomic development of Lao PDR as part of analyzing the role of these
two countries in GMS. The paper focuses on the economic aspect, especially FDI, trade
relations, and ODA, in order to analyze the characteristics of these two countries in the
development in Lao PDR. The paper starts with an overview of the country’s FDI,
foreign trade, and ODA. An analysis of the relationship between Lao PDR and China is
in Section Two and between Lao PDR and Japan, in Section Three. Section Four
presents a comparison of the characteristics of the relationships, followed by the
conclusion and some policy recommendations in Section Five.
207
1. OVERVIEW OF EXTERNAL SECTOR OF THE LAO PDR
This section gives an overview of the external sector of Lao PDR comprising
FDI, international trade development, and ODA.
1.1. Foreign direct investment (FDI) in Lao PDR
Lao PDR’s Law on Foreign Investment Promotion and Management was passed
in 1988, revised in 1994, and revised a third time in 2004. The passage of this law and
other pertinent regulations attracted increasing amounts of foreign capital into the
country. The Department of Investment of the Ministry of Planning and Investment
recently developed related regulation, including a one-stop service, in order to facilitate
the investment process. FDI started to flow into Lao PDR in 1988, gradually increasing
during the early and middle 1990s, particularly when Lao PDR joined the Association
of Southeast Asian Nations (ASEAN) on July 23, 1997. FDI inflow, however, declined
during the financial crisis that started in late 1997.
From 1989 up to 2008, approximately US$17 billion worth of FDI representing
some 1,600 projects (see Table 1) flowed into Lao PDR. Almost 60% of total FDI
(about 47 projects) went to the electricity-generation sector, clear acknowledgment of
the country’s potential in hydropower generation. By 2008, total FDI in the power
sector amounted to US$9.8 billion. The handicraft and agriculture sectors received
about 11% (US$1.8 billion) and 9% (US$1.6 billion) in FDI, respectively, while FDI in
the mining sector has gradually increased since 2003, reaching US$1.2 billion in 2008.
This figure represents about 7% of total FDI (Department of Investment, MPI, 2009).
208

Table 1: Foreign Direct Investment in Lao PDR (1989-2008)
No
1989-2008(Dec)
Sectors Projects
Total Value of FDI
(US$) (%)
1 Electricity Generation 47 9,845,791,585 58.99
2 Agriculture 260 1,571,455,899 9.41
3 Mining 177 1,165,674,715 6.98
4 Industry & Handicraft 308 1,805,706,193 10.82
5 Services 278 643,492,893 3.86
6 Trading 178 317,509,429 1.90
7 Construction 62 424,807,707 2.54
8 Hotel & Restaurant 103 275,195,254 1.65
9 Wood Industry 65 159,769,822 0.96
10 Banking 22 171,235,535 1.03
11 Telecom 10 227,770,980 1.36
12 Garment 74 67,778,289 0.41
13 Consultancies 57 2,893,622 0.02
TOTAL 1,649 16,691,931,511 100
Source: Department of Investment, MPI, 2009
The value of FDI inflow into Lao PDR sharply increased in 1994, over 90% of
which went to the hydropower sector. Within the period 1989-2008, the highest value of
FDI inflow occurred in 2006, with the hydropower sector again garnering the bulk of
the investments. Mining has significantly developed since 2003 and posted remarkable
gains in 2004, which accounted for more than 80% of total FDI that year. From 2004
onward, the mining, handicraft, and agriculture sectors have been the most attractive
sectors for FDI, aside from the hydropower sector (see Figure 1).
209
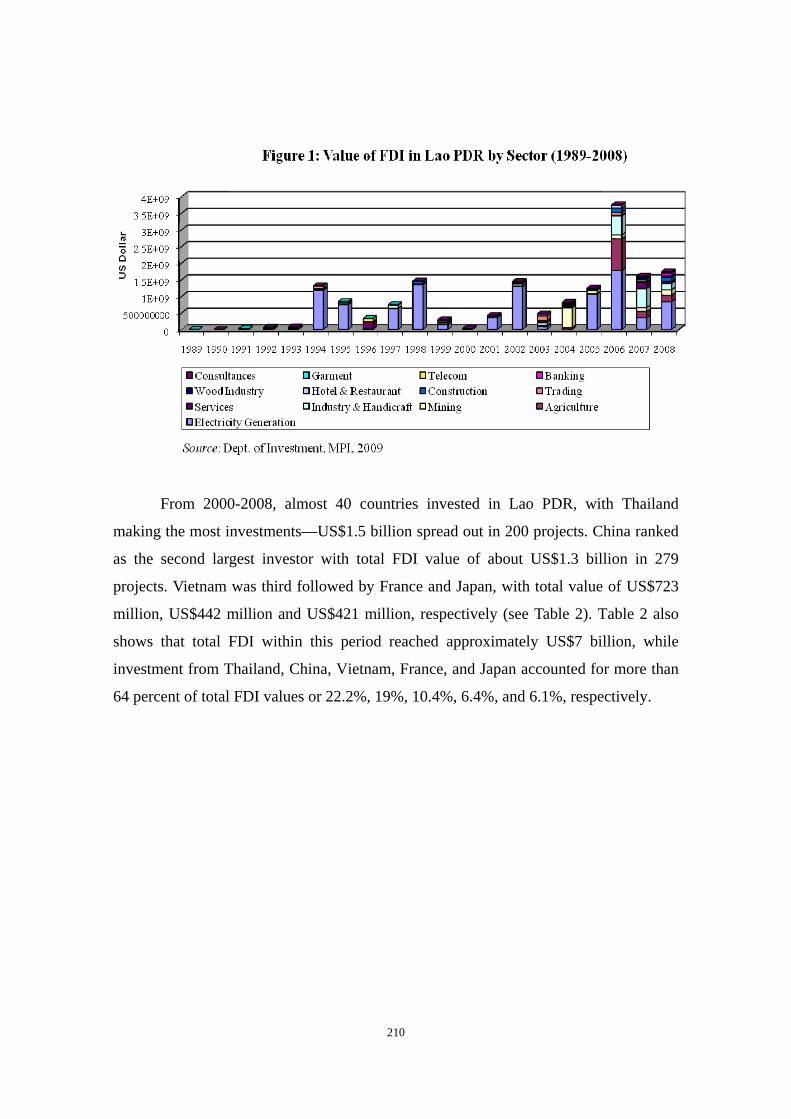
From 2000-2008, almost 40 countries invested in Lao PDR, with Thailand
making the most investments—US$1.5 billion spread out in 200 projects. China ranked
as the second largest investor with total FDI value of about US$1.3 billion in 279
projects. Vietnam was third followed by France and Japan, with total value of US$723
million, US$442 million and US$421 million, respectively (see Table 2). Table 2 also
shows that total FDI within this period reached approximately US$7 billion, while
investment from Thailand, China, Vietnam, France, and Japan accounted for more than
64 percent of total FDI values or 22.2%, 19%, 10.4%, 6.4%, and 6.1%, respectively.
210

Table 2: Approved Foreign Investment by Country 2000-2008.(Sep)2007 2008
No Country Pro
ject
s
V alue of Investment P
roje
cts
V alue of Investment P
roje
cts
V alue of Investment P
roje
cts
V alue of Investment P
roje
cts
V alue of Investment P
roje
cts
V alue of Investment P
roje
cts
V alue of Investment P
roje
cts
V alue of Investment P
roje
cts
V alue of Investment
1 Thailand 8 3,291,000 12 6,345,594 30 96,337,177 33 57,220,054 25 450,905,419 30 655,229,967 31 92,720,384 31 172,997,133 200 1,535,046,728 2 China 9 13,415,000 13 62,568,467 35 119,858,229 45 28,197,753 33 58,123,360 55 423,231,606 47 496,055,204 42 111,606,034 279 1,313,055,653 3 V ietnam 6 3,412,570 5 6,872,000 9 8,660,363 19 63,277,801 23 43,266,879 23 261,176,139 35 155,913,820 35 180,895,729 155 723,475,301 4 France 6 12,608,000 8 13,363,500 11 17,613,000 6 2,520,000 6 370,250,000 11 12,143,611 10 13,143,068 2 500,000 60 442,141,179 5 Japan 1 500,000 3 381,000 9 3,340,583 6 4,525,000 5 4,400,000 2 401,500,000 7 6,110,970 3 846,850 36 421,604,403 6 Korea 15 10,374,750 16 12,790,000 10 13,745,000 15 14,200,700 10 10,219,855 15 163,741,000 24 82,154,400 13 53,632,810 118 360,858,515 7 India 0 - 1 130,000 1 200,000 - - - 1 350,000,000 - - - - 3 350,330,000 8 Australia 2 400,332 2 490,332 1 1,500,000 4 292,700,000 8 21,286,864 5 1,390,000 5 13,620,000 3 2,400,000 30 333,787,528 9 Malaysia 1 1,500,000 5 4,853,000 8 70,776,037 5 3,250,000 6 3,374,200 5 3,150,155 3 53,210,000 2 130,000 35 140,243,392 10 Singapore 1 250,000 3 700,000 5 36,150,000 1 3,170,000 3 1,200,000 5 43,465,000 4 15,909,000 5 2,415,000 27 103,259,000 11 Canada 0 - - - 3 40,100,000 1 1,000,000 1 2,930,000 1 80,000 3 4,481,750 2 6,042,000 11 54,633,750 12 Russia 1 300,000 1 950,000 2 3,000,000 2 1,100,000 - 3 1,275,310 1 10,700,000 1 33,000,000 11 50,325,310 13 Switzerland 1 750,000 - - 2 300,000 2 30,000,000 - - - - - 1 10,000,000 6 41,050,000 14 USA 3 3,211,560 1 8,000,000 4 1,223,000 7 2,820,000 1 300,000 1 56,000 6 4,526,666 3 2,813,000 26 22,950,226 15 England 0 - 2 433,200 4 376,500 1 100,000 2 500,000 4 5,120,000 1 11,300,000 - - 14 17,829,700 16 Taiwan 1 300,000 1 620,000 - - 1 4,000,000 1 1,000,000 2 6,500,000 2 800,000 2 3,500,000 10 16,720,000 17 Sweden 0 - 1 12,940,000 2 150,000 - - - - - - 1 845,135 - - 4 13,935,135 18 Norway 0 - - - 1 12,800,000 - - - - - - - - 1 120,000 2 12,920,000 19 Poland 0 - - - - - - - - - - - 1 5,000,000 - - 1 5,000,000 20 Germany 4 1,350,000 4 500,000 1 100,000 1 100,000 - - 1 150,000 3 2,481,508 - - 14 4,681,508 21 Italy 0 - - - - - - - 1 100,000 2 3,500,000 - - - - 3 3,600,000 22 Peru 0 - - - - - - - - - 1 3,000,000 - - - - 1 3,000,000 23 Cambodia 2 1,949,500 - - 1 20,000 - - 1 100,000 - - - - - - 4 2,069,500 24 Panama 0 - - - - - - - - - 1 1,750,000 - - - - 1 1,750,000 25 Holland 0 - - - - - 1 1,000,000 - - - - 1 300,000 - - 2 1,300,000 26 Myanmar 1 200,000 - - - - - - - - 2 680,000 1 300,000 - - 4 1,180,000 27 Island 0 - 2 1,100,000 - - - - - - - - - - - - 2 1,100,000 28 Israel 0 - - - - - - - - - 1 1,020,000 - - - - 1 1,020,000 29 Indonesia - 1 1,000,000 - - 1 1,000,000 30 Belgium 1 100,000 - - - - - - 1 100,000 - - 2 700,000 - - 4 900,000 31 Sri Lanka 0 - - - - - 1 200,000 - - - - - - - - 1 200,000 32 Cuba 1 185,000 - - - - - - - - - - - - - - 1 185,000 33 Portugal 0 - - - - - - - 1 100,000 - - - - - - 1 100,000 34 Turkey 0 - - - - - - - - - 1 100,000 - - - - 1 100,000 35 Nepal - 1 100,000 - - 1 100,000 36 Philipine - 1 100,000 - - 1 100,000 37 Spain 0 - - - 1 28,125 - - - - - - - - - - 1 28,125
Total 64 54,097,712 80 133,037,093 178 465,959,014 161 533,148,782 143 1,245,307,116 171 2,699,690,943 191 1,136,905,973 146 659,192,300 1,134 6,927,367,058 Source: Department of Investment, MPI, 2009
2006 2000-2008 (Sep)2005Year 2001 2002 2003 2004

Although FDI from Thailand accounts for the highest value of investment in Lao
PDR, FDI from China and Vietnam significantly increased starting 2001. From 2001-08,
the average value of FDI from China rose about 35% to 40% and from Vietnam, about
15% to 20% of total FDI (Figure 2). Data also clearly show that in the fifth five-year
plan (2001-05), FDI from France, which accounted for about 20% of total FDI inflow
into the country, contributed significantly to the development of the hydropower sector,
especially with the Nam Teun 2 (NT2) project.
0%10%20%30%40%50%60%70%80%90%
100%
2001 2002 2003 2004 2005 2006 2007 2008
Source: Dept. of Investment, MPI, 2009
Figure 2: Top 5 Countries FDI in Lao PDR
Japan
France
Vietnam
China
Thailand
The overall picture indicates that the main source of FDI in Lao PDR is the
Asian region, particularly East and Southeast Asia. While the top five investor-countries
in Lao PDR account for more than 50% of total FDI value, four of these countries are
from Asia, and they represent more than 45% of total FDI value. This statistic shows
that Lao PDR is highly dependent on its neighboring countries. Although the country
has attracted FDI from other regions in the world, the value and number of these
212

non-Asian investment projects indicate that Lao PDR’s Asian neighbors are more active
investors in the country.
Since FDI has played a significant role in the socioeconomic development of the
country, especially in the growth of its gross domestic product (GDP), this could also be
interpreted to mean that Lao PDR has recognized its East Asian and Southeast Asian
neighbors as important contributors to its development. On the other hand, it could also
indicate a low level of FDI diversification and make the country seem like an
unattractive destination for FDI from countries in other regions. One important
observation is that most FDI in Lao PDR is concentrated in the natural, low-technology,
low-skilled, and labor-intensive sectors, including hydropower, mining, garments
(C-M-T), agriculture, etc., all of which account for more than 75% of total FDI.
1.2. Foreign trade of Lao PDR
Since 1986, Lao economy has been gradually integrated into regional and global
economies. The economic integration of Lao PDR derived from the growth of FDI,
foreign trade including border trade, regional cooperation, etc. All of these made
valuable contributions to the development of the country, especially in the form of job
creation and income generation.
The government of Lao PDR is seeking ways to diversify the economy and
reduce the economic vulnerability of the country. Policies and platforms include an
integrated framework for cooperative trade practices. Currently, nearly 70 percent of
213
official Lao exports remain concentrated in natural-base products, including wood
products, garments, mining products, and electricity. Lao PDR has access to several
preferential treatments in many countries, including the original members of the
ASEAN and other industrialized countries. It also has Generalized System of
Preferences (GSP) access to the European Union (EU) under the Everything but Arms
(EBA) arrangement and a special textile agreement that exempts its exports from EU
quotas. Since July 2003, all Lao exports to Australia and New Zealand are admitted
free of duties and quotas. The country also signed a bilateral trade agreement with the
US in 2003 and was granted Normal Trade Relations (NTR) status in November 2004,
opening the door for extensive import/export relations with the US market. Lao PDR
applied for accession to the World Trade Organization (WTO) in 1997 and is now in the
negotiation process.
As recognition of the importance of the foreign-trade sector to the country’s
economic growth, the government has actively promoted the country’s export sector
and encouraged all other sectors to develop export products. Figure 3 shows the
progress of export development from 1995 up to 2008. Exports were stable from
1995-2005 after which they posted a sharp increase in 2006 that continued up to 2008.
This rise was due to the inflow of FDI, especially in the mining sector and the increase
in mining export products. Exports grew an average of about 35% from 1995-2008.
After the sharp increase in 2006, they stabilized with almost double that value in 2007
and then rose more than 40% in 2008 (see Figure 3).
214

Although there was a deficit in the trade balance from the 1990s up to mid 2000s,
the trade structure has improved in the period covered by the sixth five-year
development plan (2006-10). The trade balance was positively accounted for in 2006,
equally balanced in 2007, and positively improved in 2008 (see Figure 4). The
improvement in export sector was relatively affected by the growth in FDI. However,
the global financial crisis poses momentous challenges for the sector in the second half
of the plan.
Figure 3: Value and growth rate of Laos' export (1995-2008)
0
200,000,000
400,000,000
600,000,000
800,000,000
1,000,000,000
1,200,000,000
1,400,000,000
1995
1996
1997
1998
1999
2000
2001
2002
2003
2004
2005
2006
2007
2008
Source: Ministry of Industry and Commerce, 2008
-0.2
0
0.2
0.4
0.6
0.8
1
Exportv alue
Growthrate (%)
215
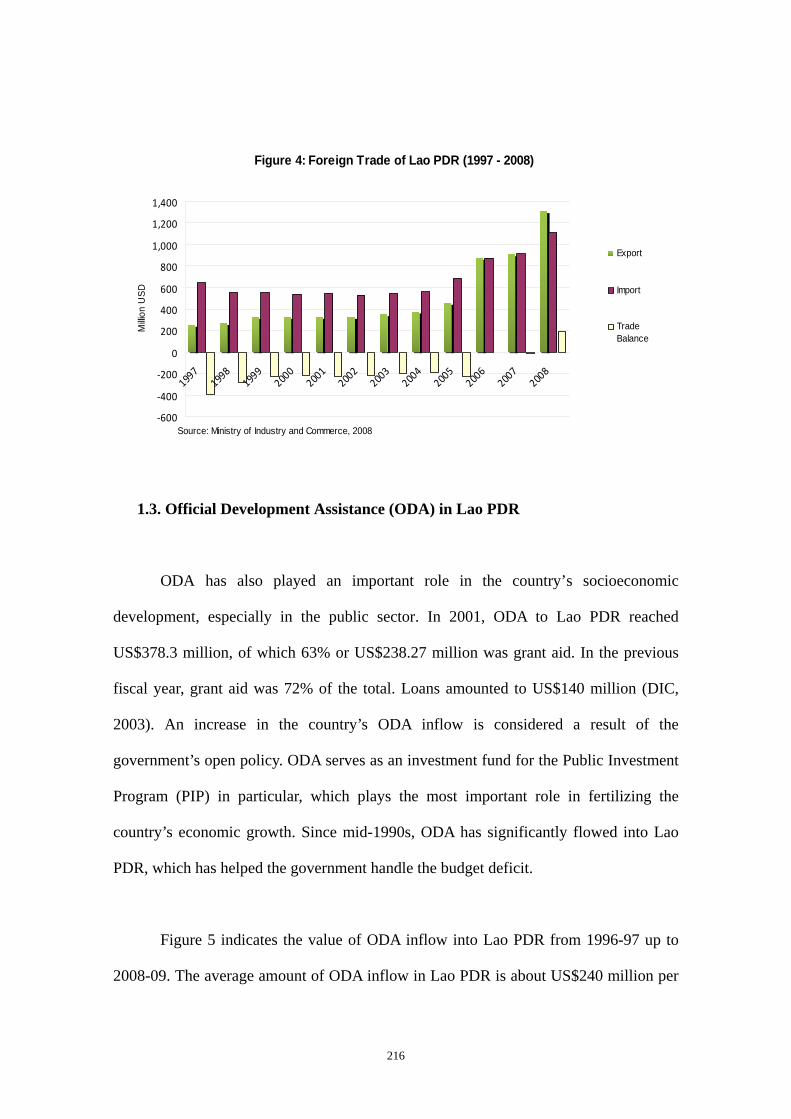
Figure 4: Foreign Trade of Lao PDR (1997 - 2008)
‐600
‐400
‐200
0
200
400
600
800
1,000
1,200
1,400
1997
1998
1999
2000
2001
2002
2003
2004
2005
2006
2007
2008
Source: Ministry of Industry and Commerce, 2008
Milli
on U
SD
Export
Import
TradeBalance
1.3. Official Development Assistance (ODA) in Lao PDR
ODA has also played an important role in the country’s socioeconomic
development, especially in the public sector. In 2001, ODA to Lao PDR reached
US$378.3 million, of which 63% or US$238.27 million was grant aid. In the previous
fiscal year, grant aid was 72% of the total. Loans amounted to US$140 million (DIC,
2003). An increase in the country’s ODA inflow is considered a result of the
government’s open policy. ODA serves as an investment fund for the Public Investment
Program (PIP) in particular, which plays the most important role in fertilizing the
country’s economic growth. Since mid-1990s, ODA has significantly flowed into Lao
PDR, which has helped the government handle the budget deficit.
Figure 5 indicates the value of ODA inflow into Lao PDR from 1996-97 up to
2008-09. The average amount of ODA inflow in Lao PDR is about US$240 million per
216

year, of which bilateral sources account for more than 70%. Large amounts of ODA
went to infrastructure, human resource development, health, and other social sectors.
ODA is a significant factor for poverty alleviation especially since it is a means to
provide the poor with roads, education, health services, and livelihood opportunities.
0.00
50.00
100.00
150.00
200.00
250.00
300.00
350.00
Mill
ion
USD
1996
/97
1997
/98
1998
/99
1999
/00
2000
/01
2001
/02
2002
/03
2003
/04
2004
/05
2005
/06
2006
/07
2007
/08
2008
/09
Source: Department of International Cooperation, 2008
Figure 5: Value of Official Development Assistance (ODA) (1997-2008)
Total v alue
Multilateral
Bilateral
InternationalMonetary Funds
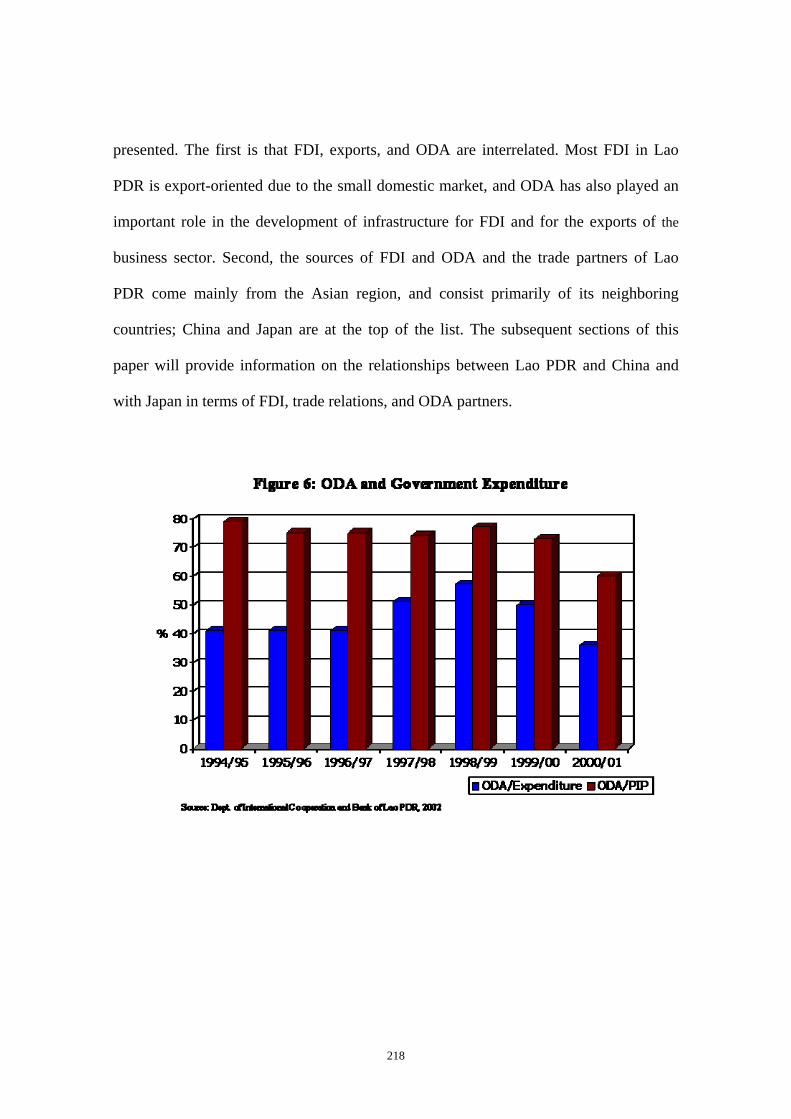
Lao PDR uses ODA to underwrite a significant portion of public expenditures.
Figure 6 shows that from 1994 to 2001, ODA has financed almost half of public
expenditures and about 80% of public investment projects. This shows that ODA is
necessary for the improvement of Lao PDR’s economic and social infrastructure.
This section discusses how FDI, foreign trade, and ODA have all played
significant roles in the socioeconomic development of Lao PDR, especially in the
implementation of the public plan. We derive two significant observations from the data
217
presented. The first is that FDI, exports, and ODA are interrelated. Most FDI in Lao
PDR is export-oriented due to the small domestic market, and ODA has also played an
important role in the development of infrastructure for FDI and for the exports of the
business sector. Second, the sources of FDI and ODA and the trade partners of Lao
PDR come mainly from the Asian region, and consist primarily of its neighboring
countries; China and Japan are at the top of the list. The subsequent sections of this
paper will provide information on the relationships between Lao PDR and China and
with Japan in terms of FDI, trade relations, and ODA partners.
218
2. SOCIAL AND ECONOMIC RELATIONS BETWEEN LAO PDR AND CHINA
eighbors that share a 500-kilometer border with each other. Lao PDR and China
official
o PDR ranks second in terms of total value
fter Thailand. Tables 3 and 4 indicate that FDI from China accounts for almost 80% of
the tota
This section describes the bilateral relation between Lao PDR and China as
n
ly established diplomatic relations on April 25, 1961 and have long historical ties,
especially the three northern provinces of Lao PDR (Phongsaly, Loungnamtha, and
Oudonxay) that share a border with China’s southern province of Yunnan. However, it
is not only these three provinces of Lao, but all of its other northern provinces that have
established business relationships with Chinese traders. This section will also present
official figures of Chinese investment, trade relation, and ODA.
2.1 Chinese Investment in Lao PDR
Currently, Chinese investment in La
a
l investment value in the industry sector or more than 50% of the total number of
projects. Chinese investment in Lao PDR increased gradually in the 1990s and then
grew dramatically beginning in the 2000s. In the period 1991-2000, total FDI from
China was only about US$127 million spread out over 71 projects. From 2001-08, the
total value of Chinese investment grew to about US$1.4 billion covering a total of 244
projects. The figure shows more than a tenfold increase in the past eight years compared
to the previous decade. The total value of FDI from China in the past eight years
accounted for over 91% of total Chinese investment value in Lao PDR from 1991-2008
(see Table 4).
219
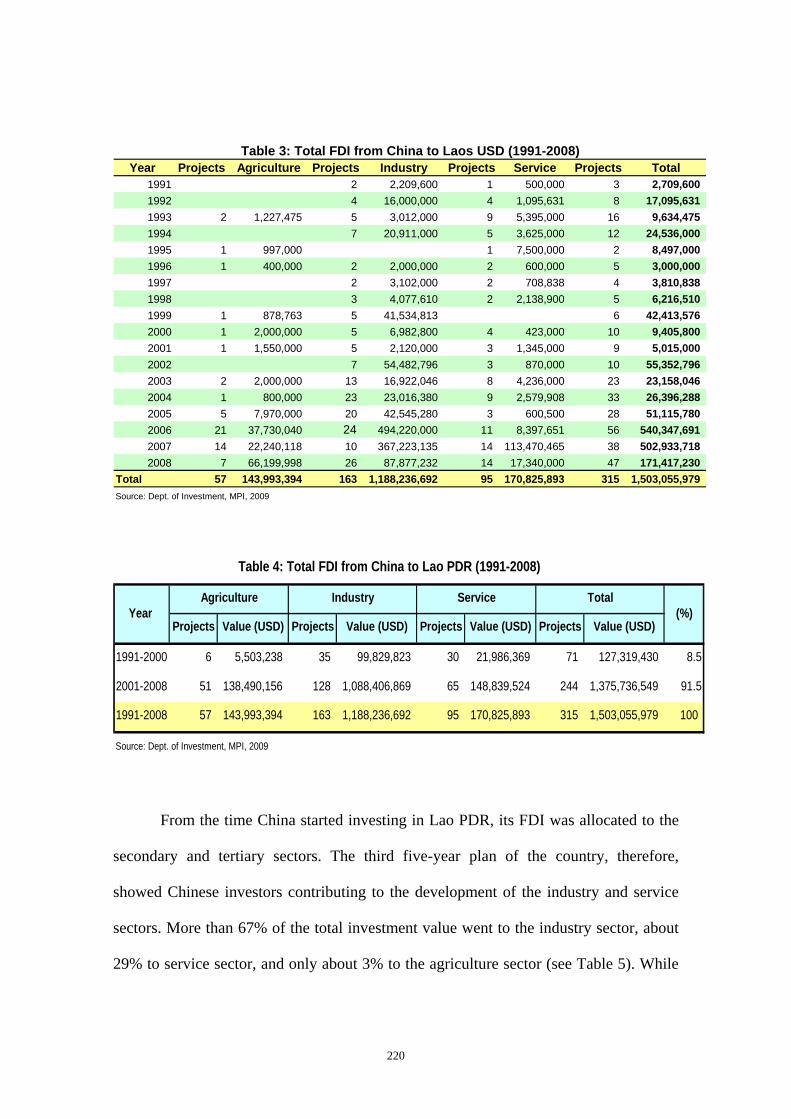
Year Projects Agriculture Projects Industry Projects Service Projects Total1991
Table 3: Total FDI from China to Laos USD (1991-2008)
2 2,209,600 1 500,000 3 2,709,600 1992 4 16,000,000 4 1,095,631 8 17,095,631 1993 2 1,227,475 5 3,012,000 9 5,395,000 16 9,634,475 1994 7 20,911,000 5 3,625,000 12 24,536,000 1995 1 997,000 1 7,500,000 2 8,497,000 1996 1 400,000 2 2,000,000 2 600,000 5 3,000,000 1997 2 3,102,000 2 708,838 4 3,810,838 1998 3 4,077,610 2 2,138,900 5 6,216,510 1999 1 878,763 5 41,534,813 6 42,413,576 2000 1 2,000,000 5 6,982,800 4 423,000 10 9,405,800 2001 1 1,550,000 5 2,120,000 3 1,345,000 9 5,015,000 2002 7 54,482,796 3 870,000 10 55,352,796 2003 2 2,000,000 13 16,922,046 8 4,236,000 23 23,158,046 2004 1 800,000 23 23,016,380 9 2,579,908 33 26,396,288 2005 5 7,970,000 20 42,545,280 3 600,500 28 51,115,780 2006 21 37,730,040 24 494,220,000 11 8,397,651 56 540,347,691 2007 14 22,240,118 10 367,223,135 14 113,470,465 38 502,933,718 2008 7 66,199,998 26 87,877,232 14 17,340,000 47 171,417,230
Total 57 143,993,394 163 1,188,236,692 95 170,825,893 315 1,503,055,979 Source: Dept. of Investment, MPI, 2009
Projects Value (USD) Projects Value (USD) Projects Value (USD) Projects Value (USD)
1991-2000 6 5,503,238 35 99,829,823 30 21,986,369 71 127,319,430 8.5
2001-2008 51 138,490,156 128 1,088,406,869 65 148,839,524 244 1,375,736,549 91.5
1991-2008 57 143,993,394 163 1,188,236,692 95 170,825,893 315 1,503,055,979 100
Source: Dept. of Investment, MPI, 2009
(%)
Table 4: Total FDI from China to Lao PDR (1991-2008)
Agriculture Industry Service TotalYear
From the time China started investing in Lao PDR, its FDI was allocated to the
condary and tertiary sectors. The third five-year plan of the country, therefore,
showed
se
Chinese investors contributing to the development of the industry and service
sectors. More than 67% of the total investment value went to the industry sector, about
29% to service sector, and only about 3% to the agriculture sector (see Table 5). While
220
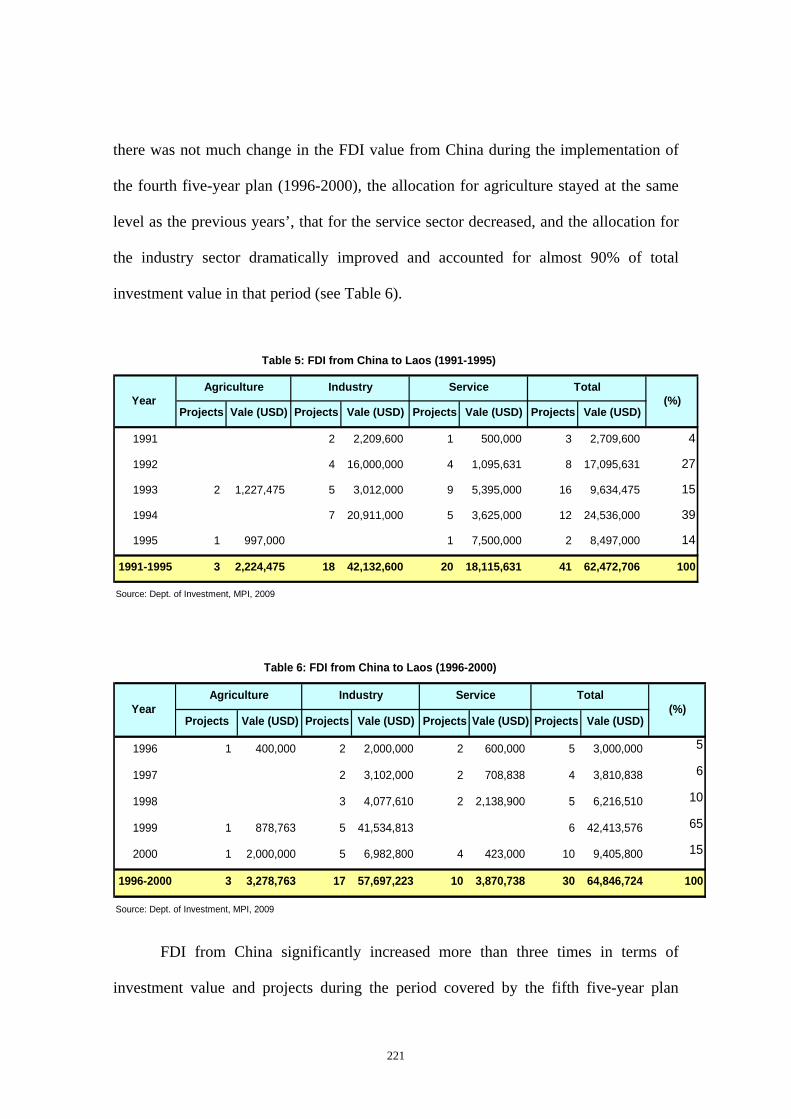
there was not much change in the FDI value from China during the implementation of
the fourth five-year plan (1996-2000), the allocation for agriculture stayed at the same
level as the previous years’, that for the service sector decreased, and the allocation for
the industry sector dramatically improved and accounted for almost 90% of total
investment value in that period (see Table 6).
Table 5: FDI from China to L
Projects Vale (USD) Projects Vale (USD) Projects Vale (USD) Projects Vale (USD)
1991 2 2,209,600 1 500,000 3 2,709,600 4
1992 4 16,000,000 4 1,095,631 8 17,095,631 27
1993 2 1,227,475 5 3,012,000 9 5,395,000 16 9,634,475 15
1994 7 20,911,000 5 3,625,000 12 24,536,000 39
1995 1 997,000 1 7,500,000 2 8,497,000 14
1991-1995 3 2,224,475 18 42,132,600 20 18,115,631 41 62,472,706 100
Source: Dept. of Investment, MPI, 2009
(%)Year
aos (1991-1995)
Agriculture Industry Service Total
Projects Vale (USD) Projects Vale (USD) Projects Vale (USD) Projects Vale (USD)
1996 1 400,000 2 2,000,000 2 600,000 5 3,000,000 5
1997 2 3,102,000 2 708,838 4 3,810,838 6
1998 3 4,077,610 2 2,138,900 5 6,216,510 10
1999 1 878,763 5 41,534,813 6 42,413,576 65
2000 1 2,000,000 5 6,982,800 4 423,000 10 9,405,800 15
1996-2000 3 3,278,763 17 57,697,223 10 3,870,738 30 64,846,724 100
Source: Dept. of Investment, MPI, 2009
(%)
Table 6: FDI from China to Laos (1996-2000)
Year Agriculture Industry Service Total
FDI from China significantly increased more than three times in terms of
investment value and projects during the period covered by the fifth five-year plan
221

(2001-05). The industry sector accounted for more than 85%, while service and
agriculture sectors accounted for about 8% and 6% of total investment value
respectively. The growth rate of FDI from China during this period was about 148%
compared to the past period. Agriculture grew by 276%, while industry and service was
141% and 149%, respectively.
Projects Vale (USD) Projects Vale (USD) Projects Vale (USD) Projects Vale (USD)
2001 1 1,550,000 5 2,120,000 3 1,345,000 9 5,015,000 3
2002 7 54,482,796 3 870,000 10 55,352,796 34
2003 2 2,000,000 13 16,922,046 8 4,236,000 23 23,158,046 14
2004 1 800,000 23 23,016,380 9 2,579,908 33 26,396,288 16
2005 5 7,970,000 20 42,545,280 3 600,500 28 51,115,780 32
2001-2005 9 12,320,000 68 139,086,502 26 9,631,408 103 161,037,910 100
Source: Dept. of Investment, MPI, 2009
FDI from China to Laos (2001-2005)
Year Agriculture Industry Service Total
Table 7:
(%)
The figure for the first half of the sixth five-year plan (2006-10) shows a
ramatically increased amount of FDI from China to Lao PDR. In 2006 alone, total FDI
increas
d
ed by almost five times compared to the entire period covered by the previous
five-year plan (2001-05). It was even approximately double the total FDI value in the
past 15 years (1991-2005). The average growth rate of investment during the past three
years is almost 300% per year, in which agriculture, industry, and service grew at about
177%, 320%, and 822% per year, respectively. Table 8 shows that the total FDI value
from China in the first half of the sixth five-year plan (2006-10) was about US$1.2
billion covering 141 projects. The industry sector accounted for about 78%, service
222

about 11.5%, and agriculture, 10% of total investment value.
Table 8: FDI from China to Laos (2006-200
Projects Vale (USD) Projects Vale (USD) Projects Vale (USD) Projects Vale (USD)
2006 21 37,730,040 24 494,220,000 11 8,397,651 56 540,347,691 44
2007 14 22,240,118 10 367,223,135 14 113,470,465 38 502,933,718 41
2008 7 66,199,998 26 87,877,232 14 17,340,000 47 171,417,230 14
2006-2008 42 126,170,156 60 949,320,367 39 139,208,116 141 1,214,698,639 100
Source: Dept. of Investment, MPI, 2009
8)
Year Agriculture Industry Service Total
(%)
Table 9 presents FDI from China broken down per five-year plan and the first
three years of the sixth five-year plan (2006-10). Clearly, Chinese investment in Lao
PDR has significantly increased in recent years across all sectors (industrial, service,
and agriculture) and accounts for more than 80% of total investment value in the period
1991-2008. FDI from China has invested not only in the central and southern regions
but also the northern region, which has very poor infrastructure compared to other
regions in the country. Due to situation of infrastructure, northern region does not very
attractive for FDI from other regions of the world, but as a geographical advantage
northern region could benefit from Chinese investment and vice versa.
223
Year Projects Agriculture Projects Industry Projects Service Projects Total (%)
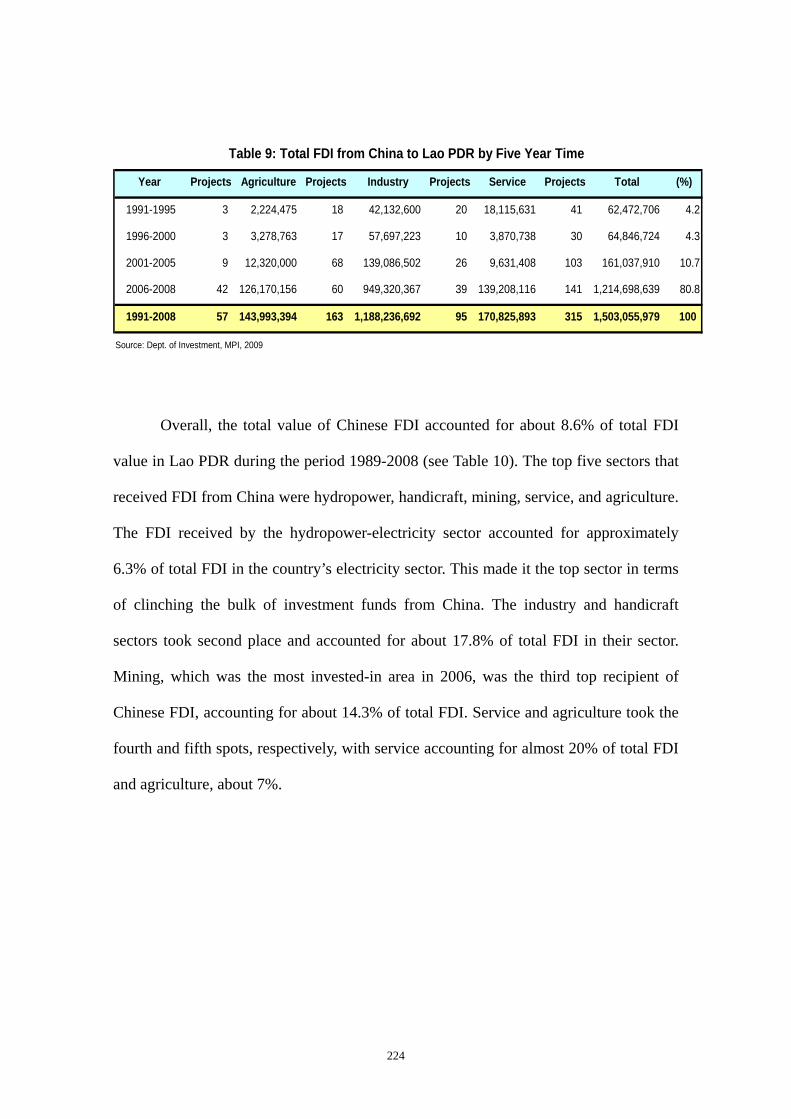
1991-1995 3 2,224,475 18 42,132,600 20 18,115,631 41 62,472,706 4.2
1996-2000 3 3,278,763 17 57,697,223 10 3,870,738 30 64,846,724 4.3
2001-2005 9 12,320,000 68 139,086,502 26 9,631,408 103 161,037,910 10.7
2006-2008 42 126,170,156 60 949,320,367 39 139,208,116 141 1,214,698,639 80.8
1991-2008 57 143,993,394 163 1,188,236,692 95 170,825,893 315 1,503,055,979 100
Source: Dept. of Investment, MPI, 2009
Table 9: Total FDI from China to Lao PDR by Five Year Time
Overall, the total value of Chinese FDI accounted for about 8.6% of total FDI
value in Lao PDR during the period 1989-2008 (see Table 10). The top five sectors that
received FDI from China were hydropower, handicraft, mining, service, and agriculture.
The FDI received by the hydropower-electricity sector accounted for approximately
6.3% of total FDI in the country’s electricity sector. This made it the top sector in terms
of clinching the bulk of investment funds from China. The industry and handicraft
sectors took second place and accounted for about 17.8% of total FDI in their sector.
Mining, which was the most invested-in area in 2006, was the third top recipient of
Chinese FDI, accounting for about 14.3% of total FDI. Service and agriculture took the
fourth and fifth spots, respectively, with service accounting for almost 20% of total FDI
and agriculture, about 7%.
224

Total Of Chinese Total Of Chinese
1 Electricity Generation 47 9 9,845,791,585 623,204,400 6.33
2 Agriculture 260 51 1,571,455,899 108,296,394 6.89
3 Mining 177 55 1,165,674,715 166,578,335 14.29
4 Industry & Handicraft 308 78 1,805,706,193 320,799,160 17.77
5 Services 278 36 643,492,893 126,690,376 19.69
6 Trading 178 22 317,509,429 17,416,303 5.49
7 Construction 62 12 424,807,707 16,970,300 3.99
8 Hotel & Restaurant 103 18 275,195,254 7,263,714 2.64
9 Wood Industry 65 11 159,769,822 36,819,600 23.05
10 Banking 22 0 171,235,535 0 0.00
11 Telecom 10 2 227,770,980 800,000 0.35
12 Garment 74 10 67,778,289 11,957,000 17.64
13 Consultances 57 7 2,893,622 1,450,000 50.11
1,649 311 16,691,931,511 1,438,245,582 8.62
Source: Department of Investment, MPI, 2009
Table 10: Total FDI and Chinese Investment in Lao PDR (1989-2008)
No
TOTAL
SectorsProjects Value of FDI (USD)
(%)
The general observation is that amount of FDI from China has dramatically
increased in recent years. These investments are mostly in the natural sector, which
includes electricity, agriculture, and mining. Collectively, these investments account for
almost 60% of total investment in terms of value. While there are also many projects for
the handicraft, services, trading, hotel and restaurant, and wood industries, there are
none for the banking sector presumably because inflow of Chinese FDI started only in
the past few years. Another aspect worth noting is that FDI from China has contributed
to the development of the country’s northern region due to that region’s proximity to
China. This is regarded as an important source of income and a means for poverty
reduction for the people living in that region.
225
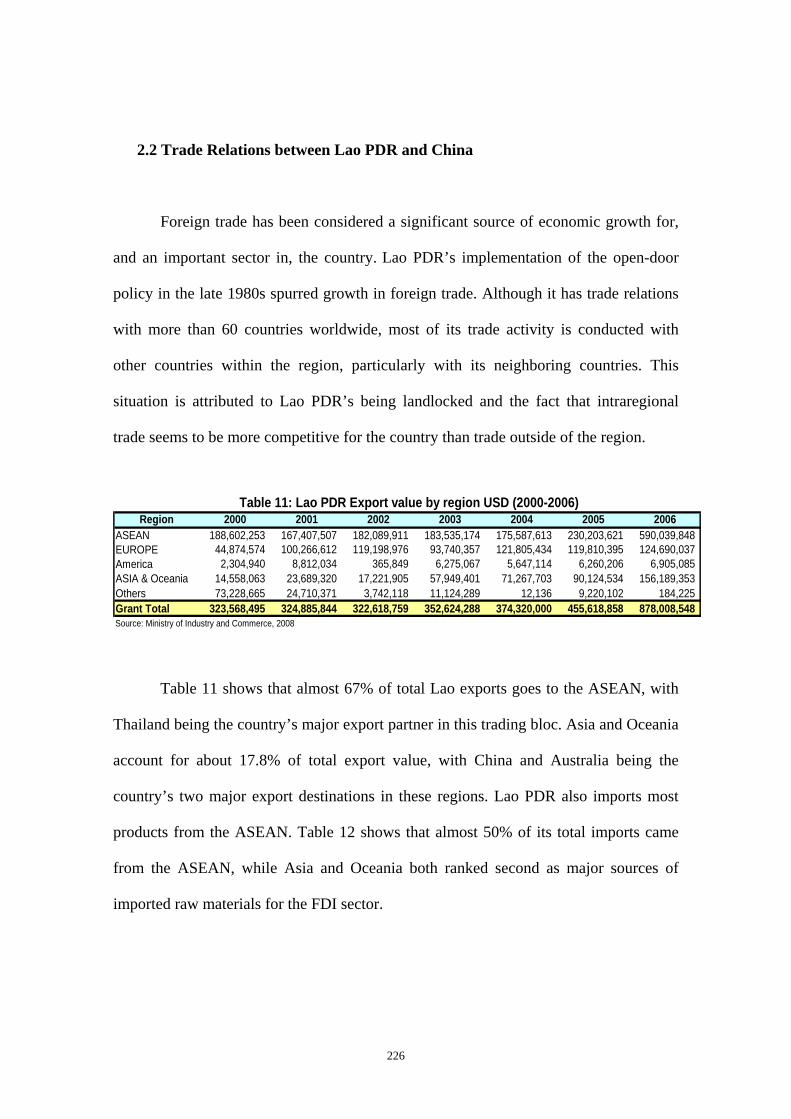
2.2 Trade Relations between Lao PDR and China
Foreign trade has been considered a significant source of economic growth for,
and an important sector in, the country. Lao PDR’s implementation of the open-door
policy in the late 1980s spurred growth in foreign trade. Although it has trade relations
with more than 60 countries worldwide, most of its trade activity is conducted with
other countries within the region, particularly with its neighboring countries. This
situation is attributed to Lao PDR’s being landlocked and the fact that intraregional
trade seems to be more competitive for the country than trade outside of the region.
Region 2000 2001 2002 2003 2004 2005 2006ASEAN 188,602,253 167,407,507 182,089,911 183,535,174 175,587,613 230,203,621 590,039,848 EUROPE 44,874,574 100,266,612 119,198,976 93,740,357 121,805,434 119,810,395 124,690,037 America 2,304,940 8,812,034 365,849 6,275,067 5,647,114 6,260,206 6,905,085 ASIA & Oceania 14,558,063 23,689,320 17,221,905 57,949,401 71,267,703 90,124,534 156,189,353 Others 73,228,665 24,710,371 3,742,118 11,124,289 12,136 9,220,102 184,225 Grant Total 323,568,495 324,885,844 322,618,759 352,624,288 374,320,000 455,618,858 878,008,548 Source: Ministry of Industry and Commerce, 2008
Table 11: Lao PDR Export value by region USD (2000-2006)
Table 11 shows that almost 67% of total Lao exports goes to the ASEAN, with
Thailand being the country’s major export partner in this trading bloc. Asia and Oceania
account for about 17.8% of total export value, with China and Australia being the
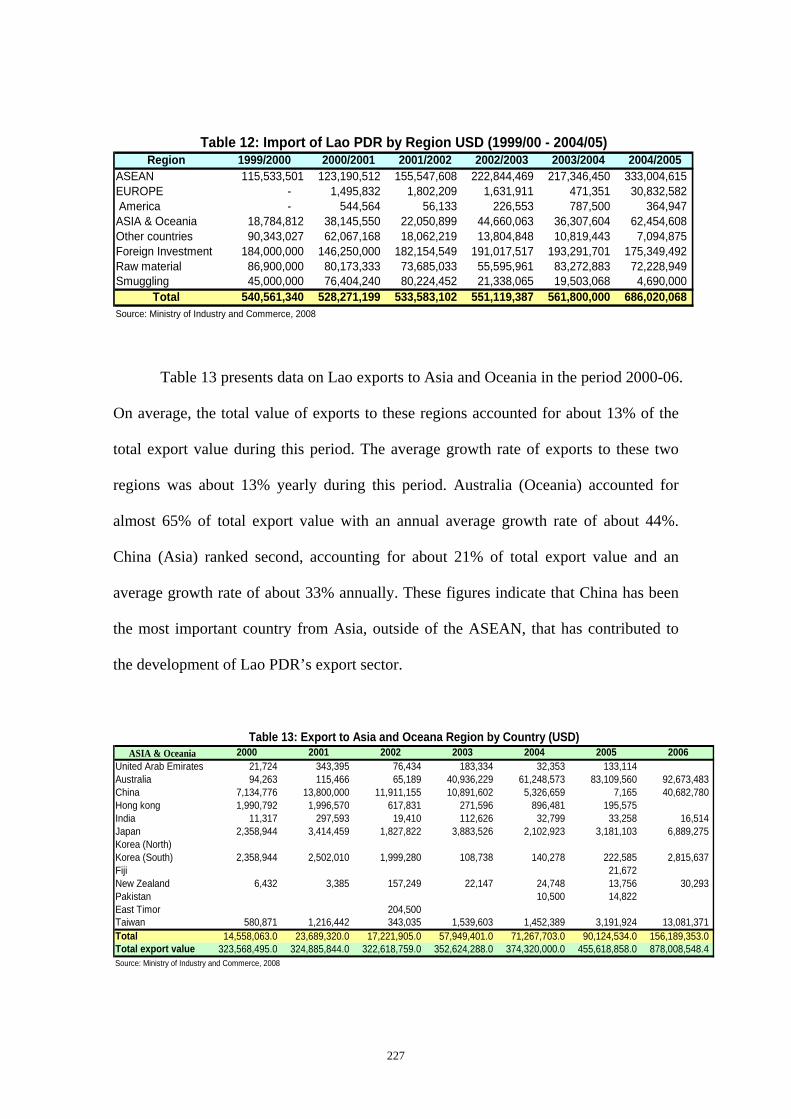
country’s two major export destinations in these regions. Lao PDR also imports most
products from the ASEAN. Table 12 shows that almost 50% of its total imports came
from the ASEAN, while Asia and Oceania both ranked second as major sources of
imported raw materials for the FDI sector.
226
Region 1999/2000 2000/2001 2001/2002 2002/2003 2003/2004 2004/2005ASEAN 115,533,501 123,190,512 155,547,608 222,844,469 217,346,450 333,004,615 EUROPE - 1,495,832 1,802,209 1,631,911 471,351 30,832,582 America - 544,564 56,133 226,553 787,500 364,947 ASIA & Oceania 18,784,812 38,145,550 22,050,899 44,660,063 36,307,604 62,454,608 Other countries 90,343,027 62,067,168 18,062,219 13,804,848 10,819,443 7,094,875 Foreign Investment 184,000,000 146,250,000 182,154,549 191,017,517 193,291,701 175,349,492 Raw material 86,900,000 80,173,333 73,685,033 55,595,961 83,272,883 72,228,949 Smuggling 45,000,000 76,404,240 80,224,452 21,338,065 19,503,068 4,690,000
Total 540,561,340 528,271,199 533,583,102 551,119,387 561,800,000 686,020,068 Source: Ministry of Industry and Commerce, 2008
Table 12: Import of Lao PDR by Region USD (1999/00 - 2004/05)
Table 13 presents data on Lao exports to Asia and Oceania in the period 2000-06.
On average, the total value of exports to these regions accounted for about 13% of the
total export value during this period. The average growth rate of exports to these two
regions was about 13% yearly during this period. Australia (Oceania) accounted for
almost 65% of total export value with an annual average growth rate of about 44%.
China (Asia) ranked second, accounting for about 21% of total export value and an
average growth rate of about 33% annually. These figures indicate that China has been
the most important country from Asia, outside of the ASEAN, that has contributed to
the development of Lao PDR’s export sector.
ASIA & Oceania 2000 2001 2002 2003 2004 2005 2006United Arab Emirates 21,724 343,395 76,434 183,334 32,353 133,114 Australia 94,263 115,466 65,189 40,936,229 61,248,573 83,109,560 92,673,483 China 7,134,776 13,800,000 11,911,155 10,891,602 5,326,659 7,165 40,682,780 Hong kong 1,990,792 1,996,570 617,831 271,596 896,481 195,575 India 11,317 297,593 19,410 112,626 32,799 33,258 16,514 Japan 2,358,944 3,414,459 1,827,822 3,883,526 2,102,923 3,181,103 6,889,275 Korea (North)Korea (South) 2,358,944 2,502,010 1,999,280 108,738 140,278 222,585 2,815,637 Fiji 21,672 New Zealand 6,432 3,385 157,249 22,147 24,748 13,756 30,293 Pakistan 10,500 14,822 East Timor 204,500 Taiwan 580,871 1,216,442 343,035 1,539,603 1,452,389 3,191,924 13,081,371 Total 14,558,063.0 23,689,320.0 17,221,905.0 57,949,401.0 71,267,703.0 90,124,534.0 156,189,353.0 Total export value 323,568,495.0 324,885,844.0 322,618,759.0 352,624,288.0 374,320,000.0 455,618,858.0 878,008,548.4 Source: Ministry of Industry and Commerce, 2008
Table 13: Export to Asia and Oceana Region by Country (USD)
227

On the import side, importations from Asia and Oceania regions accounted for
only about 6.4% of Lao PDR’s total import value. The average annual growth rate of
imports from China is about 43%. The most significant observation here is that the
products imported from China are daily-use items that, compared to products from other
regions, are of lower quality but, at the same time, are also lower priced. Considering
the current purchasing power of the Lao people, low-priced items imported from China
come in useful, especially for those living in the country’s remote regions.
ASIA & Oceania 1999/2000 2000/2001 2001/2002 2002/2003 2003/2004 2004/2005Australia 148,577.0 1,895.0 3,447.0 United Arab Emirates 30,230.0 China 18,705,687.0 35,471,694.0 17,687,444.0 32,996,566.0 26,176,582.0 54,732,691.0 Hong kong 9,249.8 75,801.0 15,254.0 302,800.0 India 34,719.0 42,218.6 68,321.0 29,829.0 14,518.0 Japan 79,125.0 423,110.0 1,669,727.0 5,080,986.0 1,813,516.0 1,279,518.0 Korea (South) 1,902,479.0 2,554,795.0 6,053,249.0 8,262,840.0 6,025,386.0 New Zealand 1,400.0 2,260.0 22,799.0 Taiwan 164,971.0 84,170.0 382,880.0 6,136.0 24,805.0 Pakistan 21,861.0 Total 18,784,812.0 38,145,550.0 22,050,899.4 44,660,063.0 36,307,604.0 62,454,608.0 Grand Total 540,561,340.0 528,271,199.0 533,583,102.2 551,119,387.0 561,800,000.0 686,020,068.0 Source: Ministry of Industry and Commerce, 2008
Table 14: Import from Asia and Oceana Region by Country (USD)
The overall trend of trade relations between the two countries (Lao PDR and
China) has increased although it fluctuated during early 2000s. From 2004 onward, it
improved dramatically in the growth of both imports and exports. However, data show
that imports have grown faster than exports, which constitutes a deficit in the trade
balance with China. Although the overall trade balance gradually improved during late
2000s, the trade deficit has nevertheless continued these past few years (see Figure 7).
228
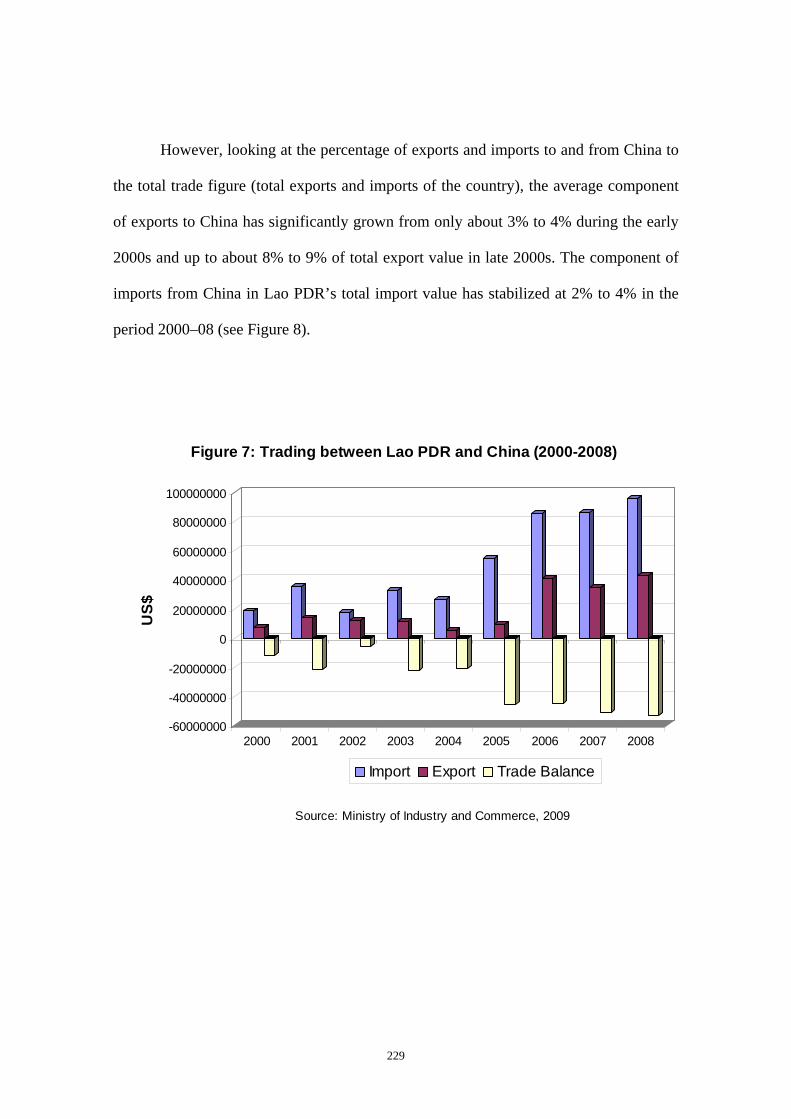
However, looking at the percentage of exports and imports to and from China to
the total trade figure (total exports and imports of the country), the average component
of exports to China has significantly grown from only about 3% to 4% during the early
2000s and up to about 8% to 9% of total export value in late 2000s. The component of
imports from China in Lao PDR’s total import value has stabilized at 2% to 4% in the
period 2000–08 (see Figure 8).
-60000000
-40000000
-20000000
0
20000000
40000000
60000000
80000000
100000000
US$
2000 2001 2002 2003 2004 2005 2006 2007 2008
Source: Ministry of Industry and Commerce, 2009
Figure 7: Trading between Lao PDR and China (2000-2008)
Import Export Trade Balance
229

Figure 8: Percentage of Export and Import to and from China to Total Export and Import of Lao PDR
0.000.501.001.502.002.503.003.504.004.505.00
2000 2001 2002 2003 2004 2005 2006 2007 2008
Source: Ministry of Industry and Commerce, 2009
0.001.002.003.004.005.006.007.008.009.0010.00
Percent of Import (left) Percent of Export (right)
Another interesting issue related to trade between Lao PDR and China involves
cross-border trade, especially in the border areas like Loungnamtha and Oudomxay
provinces in Northern Laos. Cross-border trade has both positive and negative effects
on the social and economic activities of the people in these areas. The positive aspects
include changes in the livelihood system, opportunities for employment, improvement
in incomes and trade as well as other social benefits like education and healthcare.
However, there are also other social issues related to cross-border trade, which will be
discussed in the last part of this section using information from previous surveys
conducted in the border areas of the northern provinces.
2.3 Chinese ODA in Lao PDR
ODA has played a crucial role in the socioeconomic development of Lao PDR.
Sources of ODA for the country include multilateral communities and international
230
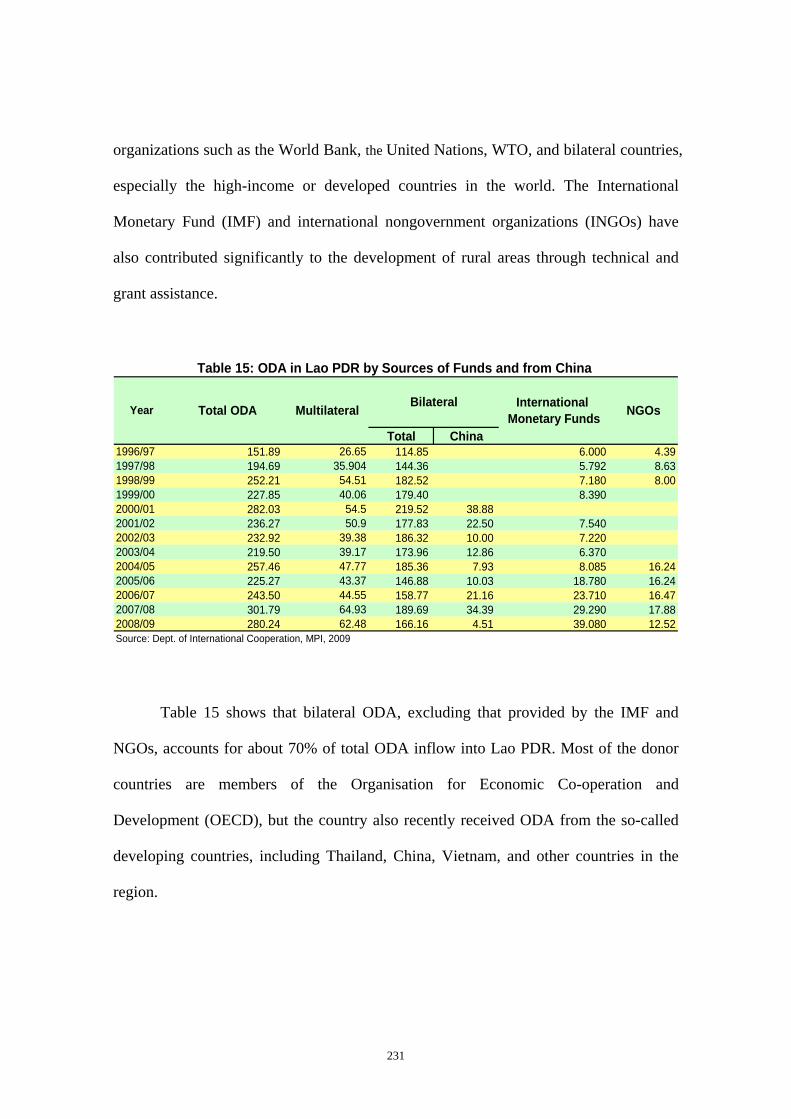
organizations such as the World Bank, the United Nations, WTO, and bilateral countries,
especially the high-income or developed countries in the world. The International
Monetary Fund (IMF) and international nongovernment organizations (INGOs) have
also contributed significantly to the development of rural areas through technical and
grant assistance.
Total China1996/97 151.89 26.65 114.85 6.000 4.391997/98 194.69 35.904 144.36 5.792 8.631998/99 252.21 54.51 182.52 7.180 8.001999/00 227.85 40.06 179.40 8.3902000/01 282.03 54.5 219.52 38.882001/02 236.27 50.9 177.83 22.50 7.5402002/03 232.92 39.38 186.32 10.00 7.2202003/04 219.50 39.17 173.96 12.86 6.3702004/05 257.46 47.77 185.36 7.93 8.085 16.242005/06 225.27 43.37 146.88 10.03 18.780 16.242006/07 243.50 44.55 158.77 21.16 23.710 16.472007/08 301.79 64.93 189.69 34.39 29.290 17.882008/09 280.24 62.48 166.16 4.51 39.080 12.52Source: Dept. of International Cooperation, MPI, 2009
NGOsYear
Table 15: ODA in Lao PDR by Sources of Funds and from China
Total ODA Multilateral Bilateral International Monetary Funds
Table 15 shows that bilateral ODA, excluding that provided by the IMF and
NGOs, accounts for about 70% of total ODA inflow into Lao PDR. Most of the donor
countries are members of the Organisation for Economic Co-operation and
Development (OECD), but the country also recently received ODA from the so-called
developing countries, including Thailand, China, Vietnam, and other countries in the
region.
231
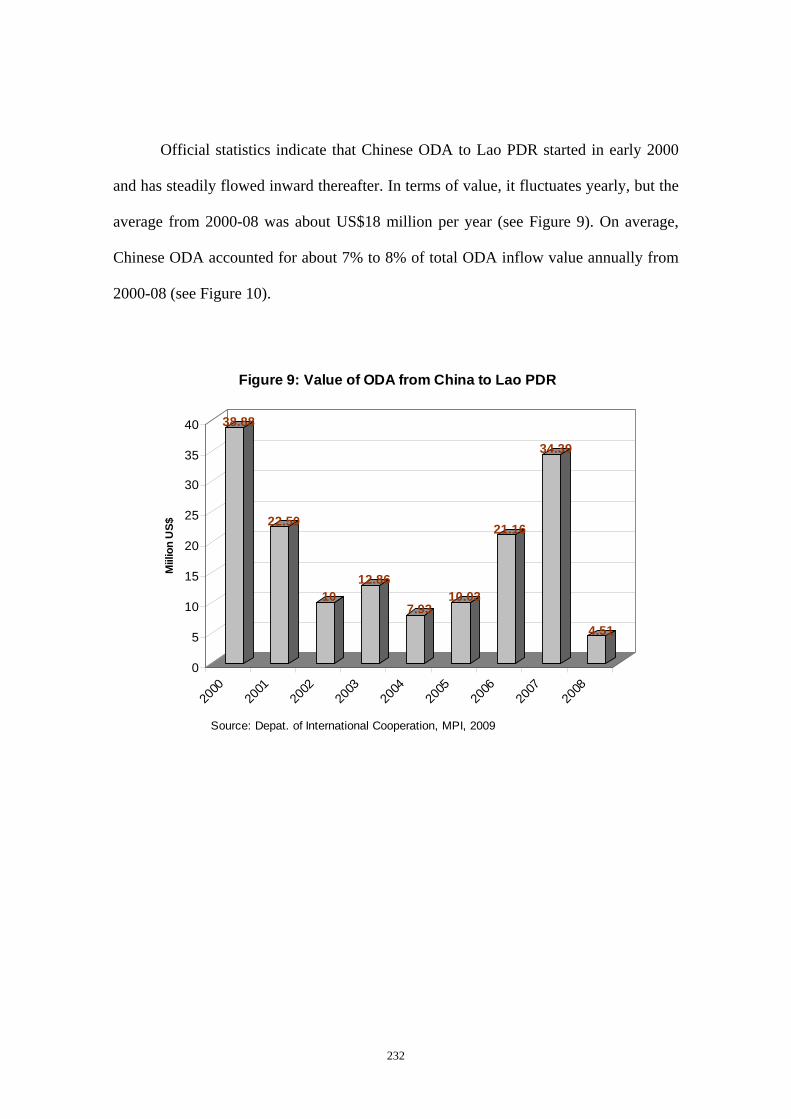
Official statistics indicate that Chinese ODA to Lao PDR started in early 2000
and has steadily flowed inward thereafter. In terms of value, it fluctuates yearly, but the
average from 2000-08 was about US$18 million per year (see Figure 9). On average,
Chinese ODA accounted for about 7% to 8% of total ODA inflow value annually from
2000-08 (see Figure 10).
38.88
22.50
1012.86
7.9310.03
21.16
34.39
4.51
0
5
10
15
20
25
30
35
40
Miil
ion
US$
2000
2001
2002
2003
2004
2005
2006
2007
2008
Source: Depat. of International Cooperation, MPI, 2009
Figure 9: Value of ODA from China to Lao PDR
232

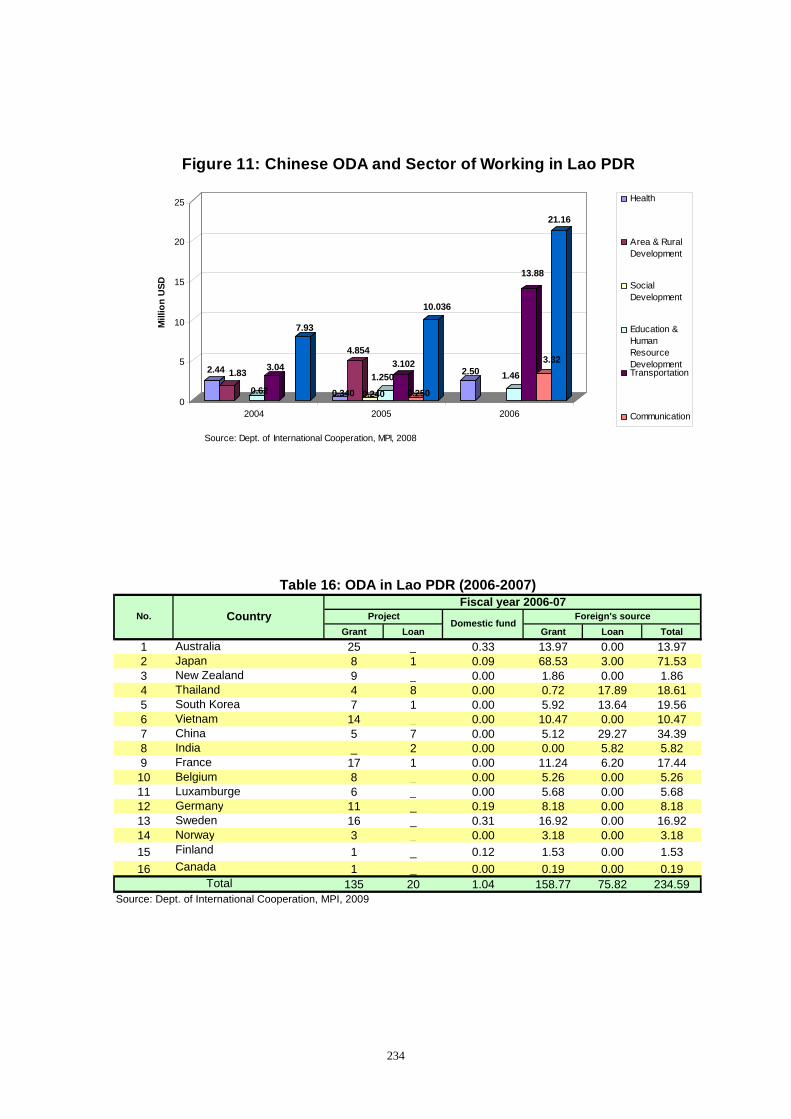
In general, Chinese ODA has been concentrated in a few areas, such health, rural
development, social development, education/human resource development, and
transportation. Chinese ODA for transportation has been used to improve links from
Lao PDR to some Chinese provinces, such as Yunnan and Nanning, and develop
transportation infrastructure in urban areas as well as some of the country’s rural
northern provinces. Figure 11 shows that in 2004-06, the bulk of Chinese ODA was
concentrated in the transportation sector followed by education/human resource
development. The latter took the form of the Chinese government providing
approximately 200 scholarships annually to Lao students to help them study in China.
233
2.44 1.83
0.62
3.04
7.93
0.340
4.854
0.240
1.2503.102
0.250
10.036
2.50 1.46
13.88
3.32
21.16
0
5
10
15
20
25
Mill
ion
USD
2004 2005 2006
Source: Dept. of International Cooperation, MPI, 2008
Figure 11: Chinese ODA and Sector of Working in Lao PDR
Health
Area & RuralDevelopment
SocialDevelopment
Education &HumanResourceDevelopmentTransportation
Communication
Grant Loan Grant Loan Total1 Australia 25 _ 0.33 13.97 0.00 13.972 Japan 8 1 0.09 68.53 3.00 71.533 New Zealand 9 _ 0.00 1.86 0.00 1.864 Thailand 4 8 0.00 0.72 17.89 18.615 South Korea 7 1 0.00 5.92 13.64 19.566 Vietnam 14 _ 0.00 10.47 0.00 10.477 China 5 7 0.00 5.12 29.27 34.398 India _ 2 0.00 0.00 5.82 5.829 France 17 1 0.00 11.24 6.20 17.4410 Belgium 8 _ 0.00 5.26 0.00 5.2611 Luxamburge 6 _ 0.00 5.68 0.00 5.6812 Germany 11 _ 0.19 8.18 0.00 8.1813 Sweden 16 _ 0.31 16.92 0.00 16.9214 Norway 3 _ 0.00 3.18 0.00 3.1815 Finland 1 _ 0.12 1.53 0.00 1.5316 Canada 1 _ 0.00 0.19 0.00 0.19
135 20 1.04 158.77 75.82 234.59Source: Dept. of International Cooperation, MPI, 2009
Total
Table 16: ODA in Lao PDR (2006-2007)
No. CountryFiscal year 2006-07
ProjectDomestic fund
Foreign's source
234

Grant Loan Grant Loan Total1 Australia 24 _ 0.33 12.73 0.00 12.732 Japan 10 _ 0.07 78.01 0.00 78.013 New Zealand 10 _ 0.00 2.27 0.00 2.274 Thailand 4 8 0.00 0.72 17.49 18.215 South Korea 11 _ 0.00 11.45 0.00 11.456 Vietnam 19 _ 0.00 18.93 0.00 18.937 China 5 6 0.00 4.51 0.00 4.518 France 12 1 0.00 10.02 6.20 16.229 Belgium 7 _ 0.00 5.07 0.00 5.0710 Luxamburge 10 _ 0.00 12.27 0.00 12.2711 Germany 11 _ 0.22 9.35 0.00 9.3512 Sweden 16 _ 0.31 16.89 0.00 16.8913 Norway 3 _ 0.00 3.18 0.00 3.1814 Finland 1 _ 0.12 1.53 0.00 1.5315 Canada 1 _ 0.00 0.19 0.00 0.19
144 15 1.05 187.12 23.69 210.81Source: Dept. of International Cooperation, MPI, 2009
Foreign's source
Total
Table 17: ODA in Lao PDR (2007-2008)
No. CountryFiscal year 2007-08
ProjectDomestic fund
2.4 Cross-Border Trade (CBT) between Lao PDR and China1
The discussion in this section is based on a study conducted as a research project
to support the 3rd National Human Development Report, sponsored by United Nations
Development Plan (UNDP). The study tried to answer two questions, namely: (1) to
what extent do local people benefit from CBT and (2) how are their lives affected by
CBT? The research aimed to expand the study of CBT in the Lao PDR and explore its
economic and social impact on human development, particularly on educational
attainment, health issues, access to information, and time savings as a result of
infrastructure improvement and so on. It was conducted in Louang Namtha and
Oudomxay provinces in Northern Laos, which shares a border with China’s Yunnan
province. The results of this study indicated some contributions at the micro level of
relations between Lao PDR and China, but some negative issues were also raised.
235

The results of the study indicated that border trade in Oudomxay has a more
positive impact on people in the agriculturally productive districts of Hun and Beng
than on people in Namor district which is closest to the border. In the Sing district of
Luang Namtha, there is no difference in the impact on households in villages close to
the border and those away from the border. There is only a difference in
border-crossing frequency. On other aspects like income, consumption, and wealth,
the situation is sometimes even better for those living away from the border. This
implies that every community could benefit from border trade as long as that
community can produce something for which there is a demand on the other side of the
border2.
The most direct benefit of CBT is the economic impact. Loung Namtha and
Oudomxay provinces, which share a border with China, gain access to the vast Chinese
market, especially in the southern part of China. The production of crops mostly for the
Chinese market is the main source of income and employment for local people. This
income is not a quick-cash matter but has room to develop further as the Chinese
agricultural consumer market is so large and the current level of production in the
provinces is still far below such demand. With proper and careful strategy of local
agricultural production, producing cash crops for a giant market like China could be a
permanent source of income for local people. Other benefits from CBT include3:
- Improvement in living conditions and increased wealth
- Increased variety of goods
- Promotion of entrepreneurship
236
- Reduction of opium production and slash-and-burn cultivation
- Increased opportunities for education with rising income
The above benefits from CBT with China as well as some negative issues
relating to CBT with Chinese traders and Chinese migrant laborers who work in Lao
PDR can be summarized as follows:
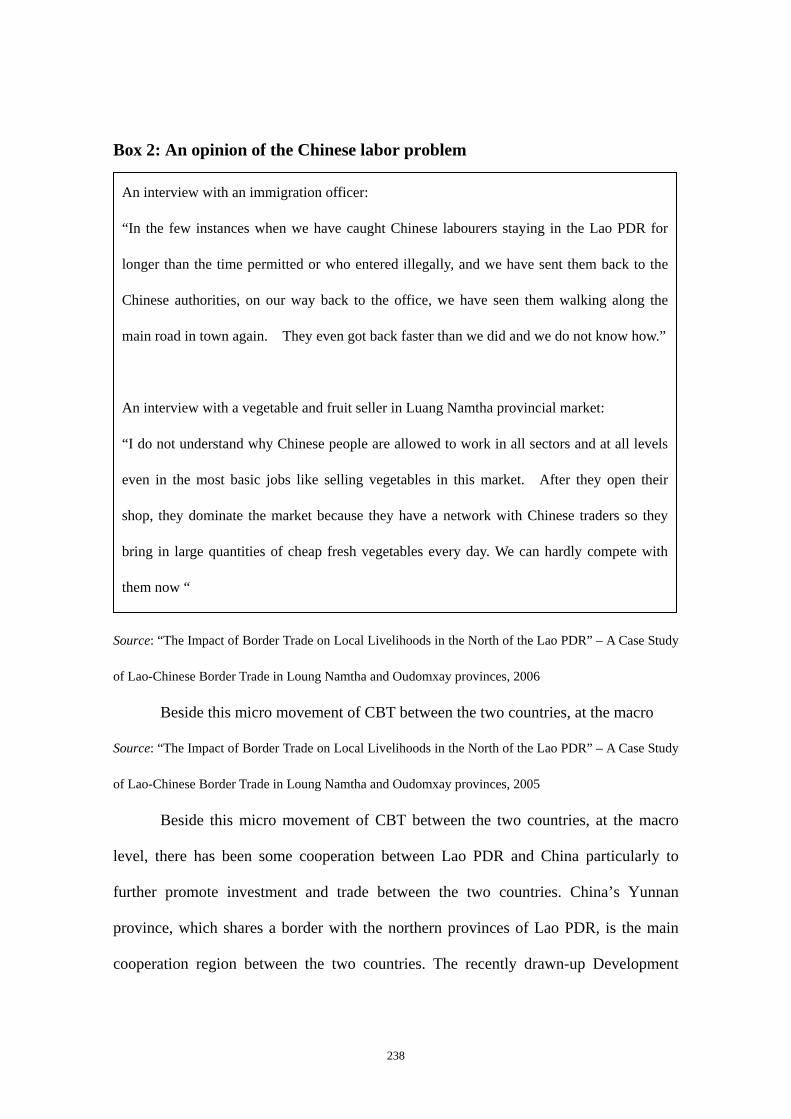
Box 1: Supplementary survey on education and Chinese trade
In the quest to establish a relationship between education and the boom in Chinese trade a
supplementary survey of 100 high school graduates chosen at random in Luang Namtha
province was carried out. This revealed that 51% interviewees gave Chinese trade and
business opportunities as their major reasons for entering higher education. The second
reason was the boom in tourism and working in Chinese firms (25% and 20% respectively).
In addition, the students were very interested in learning Chinese language. The underlying
reasons were the possibility of employment in a firm (42%) and doing business with Chinese
people (45%). However, as yet there are no Chinese courses in the province. These
findings show that the boom in Chinese trade does indeed inspire local people to enter higher
education
Source: “The Impact of Border Trade on Local Livelihoods in the North of the Lao PDR” – A Case Study
of Lao-Chinese Border Trade in Loung Namtha and Oudomxay provinces, 2006
Source: “The Impact of Border Trade on Local Livelihoods in the North of the Lao PDR” – A Case Study
of Lao-Chinese Border Trade in Loung Namtha and Oudomxay provinces, 2005
237
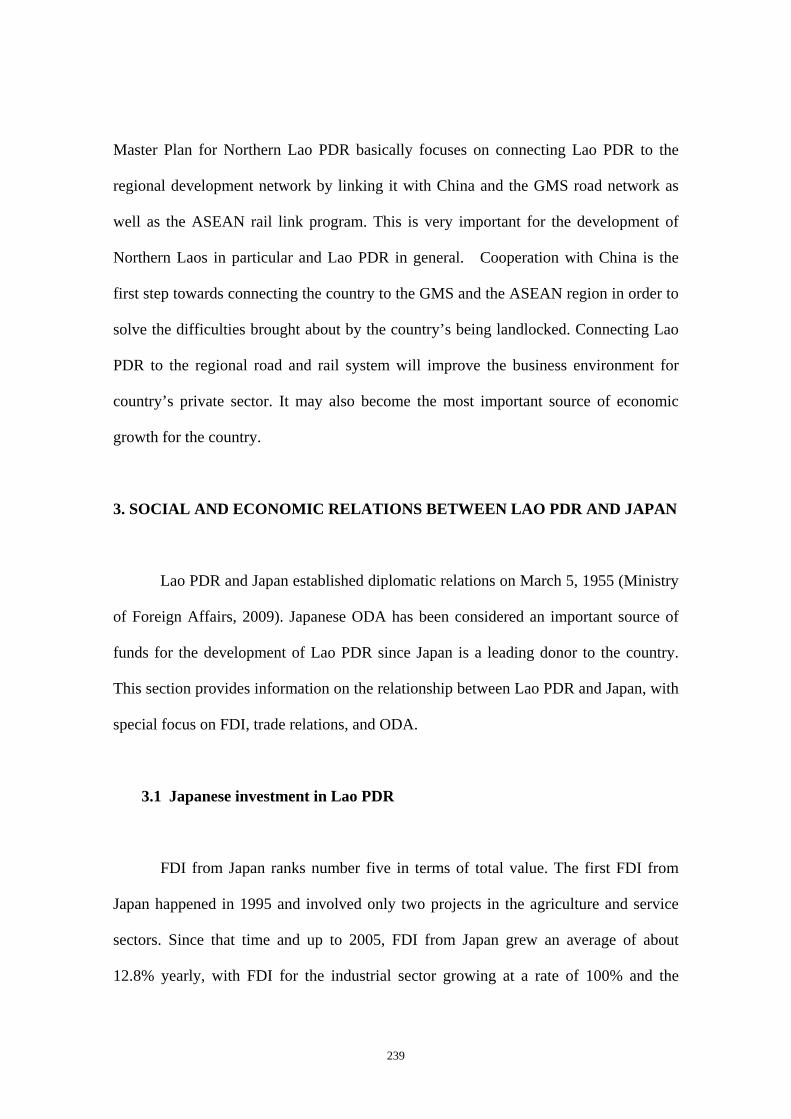
Box 2: An opinion of the Chinese labor problem
An interview with an immigration officer:
“In the few instances when we have caught Chinese labourers staying in the Lao PDR for
longer than the time permitted or who entered illegally, and we have sent them back to the
Chinese authorities, on our way back to the office, we have seen them walking along the
main road in town again. They even got back faster than we did and we do not know how.”
An interview with a vegetable and fruit seller in Luang Namtha provincial market:
“I do not understand why Chinese people are allowed to work in all sectors and at all levels
even in the most basic jobs like selling vegetables in this market. After they open their
shop, they dominate the market because they have a network with Chinese traders so they
bring in large quantities of cheap fresh vegetables every day. We can hardly compete with
them now “
Source: “The Impact of Border Trade on Local Livelihoods in the North of the Lao PDR” – A Case Study
of Lao-Chinese Border Trade in Loung Namtha and Oudomxay provinces, 2006
Beside this micro movement of CBT between the two countries, at the macro
Source: “The Impact of Border Trade on Local Livelihoods in the North of the Lao PDR” – A Case Study
of Lao-Chinese Border Trade in Loung Namtha and Oudomxay provinces, 2005
Beside this micro movement of CBT between the two countries, at the macro
level, there has been some cooperation between Lao PDR and China particularly to
further promote investment and trade between the two countries. China’s Yunnan
province, which shares a border with the northern provinces of Lao PDR, is the main
cooperation region between the two countries. The recently drawn-up Development
238
Master Plan for Northern Lao PDR basically focuses on connecting Lao PDR to the
regional development network by linking it with China and the GMS road network as
well as the ASEAN rail link program. This is very important for the development of
Northern Laos in particular and Lao PDR in general. Cooperation with China is the
first step towards connecting the country to the GMS and the ASEAN region in order to
solve the difficulties brought about by the country’s being landlocked. Connecting Lao
PDR to the regional road and rail system will improve the business environment for
country’s private sector. It may also become the most important source of economic
growth for the country.
3. SOCIAL AND ECONOMIC RELATIONS BETWEEN LAO PDR AND JAPAN
Lao PDR and Japan established diplomatic relations on March 5, 1955 (Ministry
of Foreign Affairs, 2009). Japanese ODA has been considered an important source of
funds for the development of Lao PDR since Japan is a leading donor to the country.
This section provides information on the relationship between Lao PDR and Japan, with
special focus on FDI, trade relations, and ODA.
3.1 Japanese investment in Lao PDR
FDI from Japan ranks number five in terms of total value. The first FDI from
Japan happened in 1995 and involved only two projects in the agriculture and service
sectors. Since that time and up to 2005, FDI from Japan grew an average of about
12.8% yearly, with FDI for the industrial sector growing at a rate of 100% and the
239
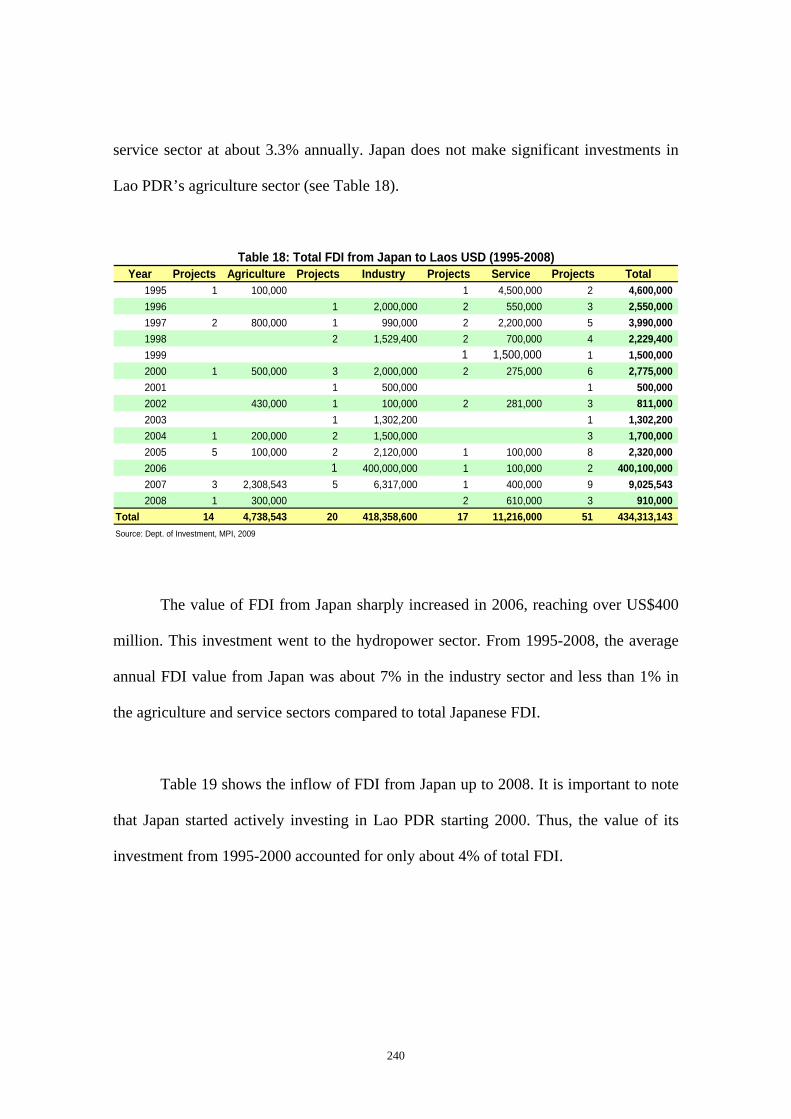
service sector at about 3.3% annually. Japan does not make significant investments in
Lao PDR’s agriculture sector (see Table 18).
Year Projects Agriculture Projects Industry Projects Service Projects Total1995 1 100,000 1 4,500,000 2 4,600,000 1996 1 2,000,000 2 550,000 3 2,550,000 1997 2 800,000 1 990,000 2 2,200,000 5 3,990,000 1998 2 1,529,400 2 700,000 4 2,229,400 1999 1 1,500,000 1 1,500,000 2000 1 500,000 3 2,000,000 2 275,000 6 2,775,000 2001 1 500,000 1 500,000 2002 430,000 1 100,000 2 281,000 3 811,000 2003 1 1,302,200 1 1,302,200 2004 1 200,000 2 1,500,000 3 1,700,000 2005 5 100,000 2 2,120,000 1 100,000 8 2,320,000 2006 1 400,000,000 1 100,000 2 400,100,000 2007 3 2,308,543 5 6,317,000 1 400,000 9 9,025,543 2008 1 300,000 2 610,000 3 910,000
Total 14 4,738,543 20 418,358,600 17 11,216,000 51 434,313,143 Source: Dept. of Investment, MPI, 2009
Table 18: Total FDI from Japan to Laos USD (1995-2008)
The value of FDI from Japan sharply increased in 2006, reaching over US$400
million. This investment went to the hydropower sector. From 1995-2008, the average
annual FDI value from Japan was about 7% in the industry sector and less than 1% in
the agriculture and service sectors compared to total Japanese FDI.
Table 19 shows the inflow of FDI from Japan up to 2008. It is important to note
that Japan started actively investing in Lao PDR starting 2000. Thus, the value of its
investment from 1995-2000 accounted for only about 4% of total FDI.
240
Projects Value (USD) Projects Value (USD) Projects Value (USD) Projects Value (USD)
1995-2000 4 1,400,000 7 6,519,400 10 9,725,000 21 17,644,400 4.1
2001-2008 10 3,338,543 13 411,839,200 7 1,491,000 30 416,668,743 95.9
1991-2008 14 4,738,543 20 418,358,600 17 11,216,000 51 434,313,143 100
Source: Dept. of Investment, MPI, 2009
(%)Agriculture Industry Service Total
Year
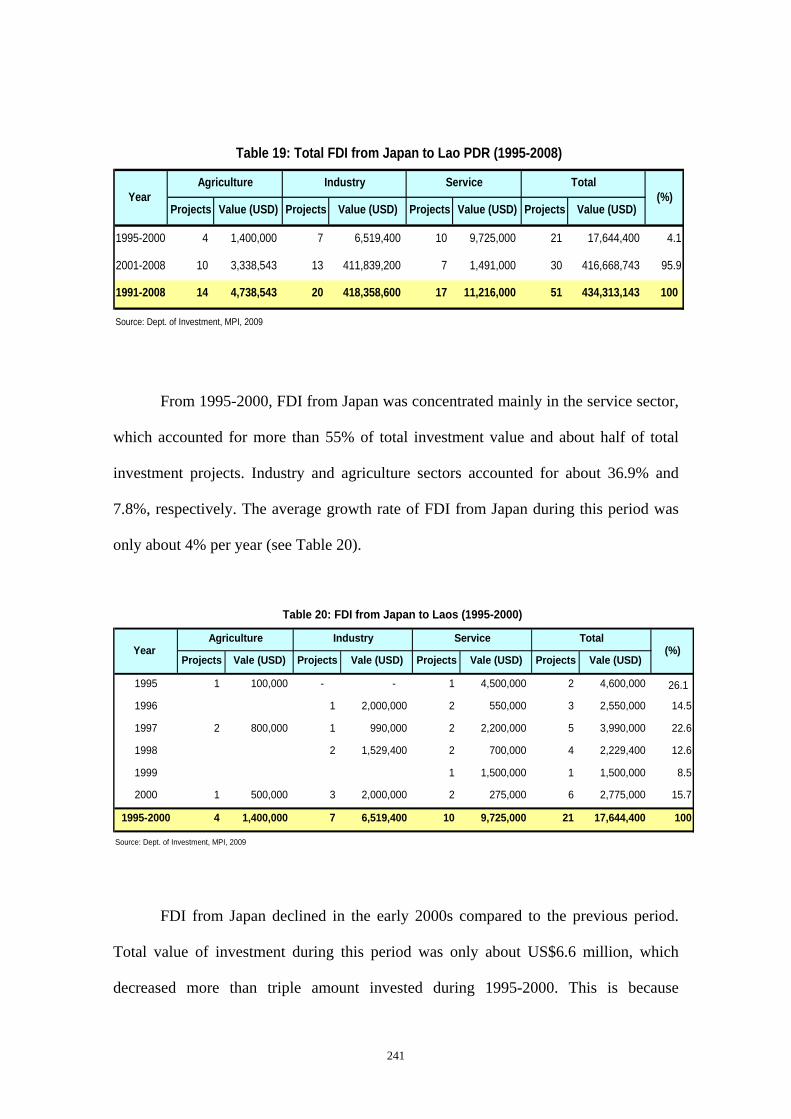
Table 19: Total FDI from Japan to Lao PDR (1995-2008)
From 1995-2000, FDI from Japan was concentrated mainly in the service sector,
which accounted for more than 55% of total investment value and about half of total
investment projects. Industry and agriculture sectors accounted for about 36.9% and
7.8%, respectively. The average growth rate of FDI from Japan during this period was
only about 4% per year (see Table 20).
Projects Vale (USD) Projects Vale (USD) Projects Vale (USD) Projects Vale (USD)
1995 1 100,000 - - 1 4,500,000 2 4,600,000 26.1
1996 1 2,000,000 2 550,000 3 2,550,000 14.5
1997 2 800,000 1 990,000 2 2,200,000 5 3,990,000 22.6
1998 2 1,529,400 2 700,000 4 2,229,400 12.6
1999 1 1,500,000 1 1,500,000 8.5
2000 1 500,000 3 2,000,000 2 275,000 6 2,775,000 15.7
1995-2000 4 1,400,000 7 6,519,400 10 9,725,000 21 17,644,400 100
Source: Dept. of Investment, MPI, 2009
Table 20: FDI from Japan to Laos (1995-2000)
(%)Year Agriculture Industry Service Total
FDI from Japan declined in the early 2000s compared to the previous period.
Total value of investment during this period was only about US$6.6 million, which
decreased more than triple amount invested during 1995-2000. This is because
241
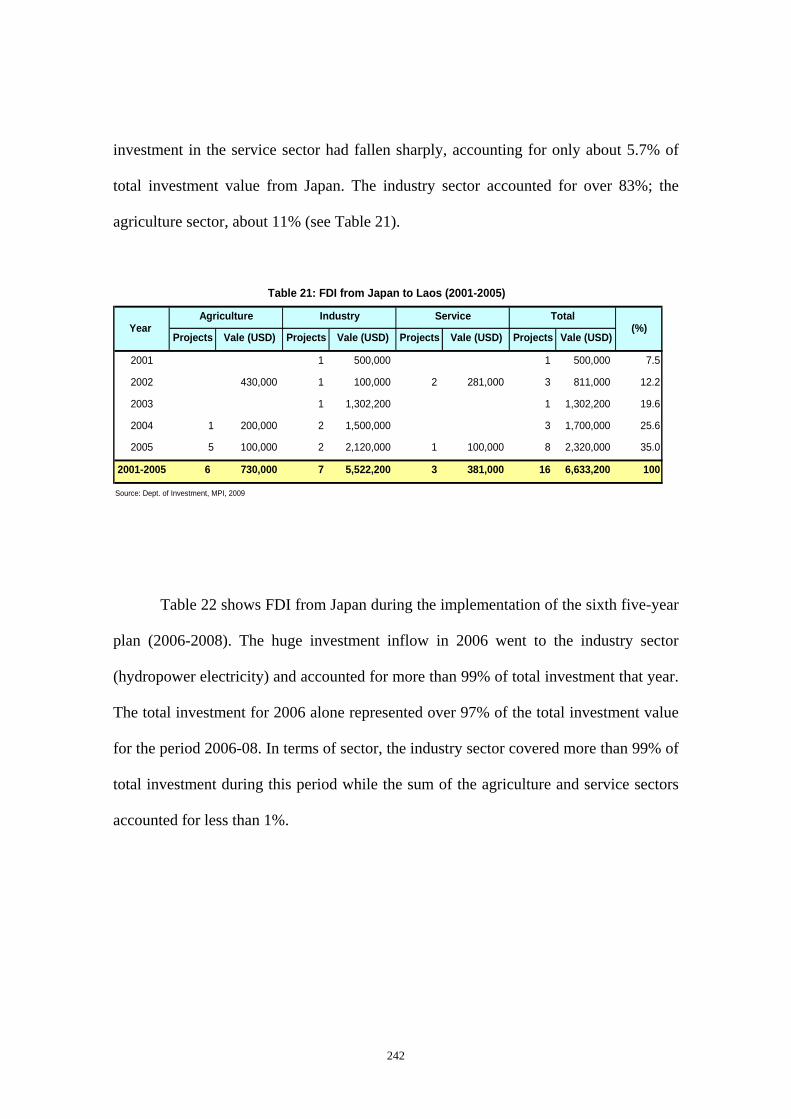
investment in the service sector had fallen sharply, accounting for only about 5.7% of
total investment value from Japan. The industry sector accounted for over 83%; the
agriculture sector, about 11% (see Table 21).
Projects Vale (USD) Projects Vale (USD) Projects Vale (USD) Projects Vale (USD)
Table 21: FDI from Japan to Laos (2001-2005)
(%)Year Agriculture Industry Service Total
2001 1 500,000 1 500,000 7.5
2002 430,000 1 100,000 2 281,000 3 811,000 12.2
2003 1 1,302,200 1 1,302,200 19.6
2004 1 200,000 2 1,500,000 3 1,700,000 25.6
2005 5 100,000 2 2,120,000 1 100,000 8 2,320,000 35.0
2001-2005 6 730,000 7 5,522,200 3 381,000 16 6,633,200 100
Source: Dept. of Investment, MPI, 2009
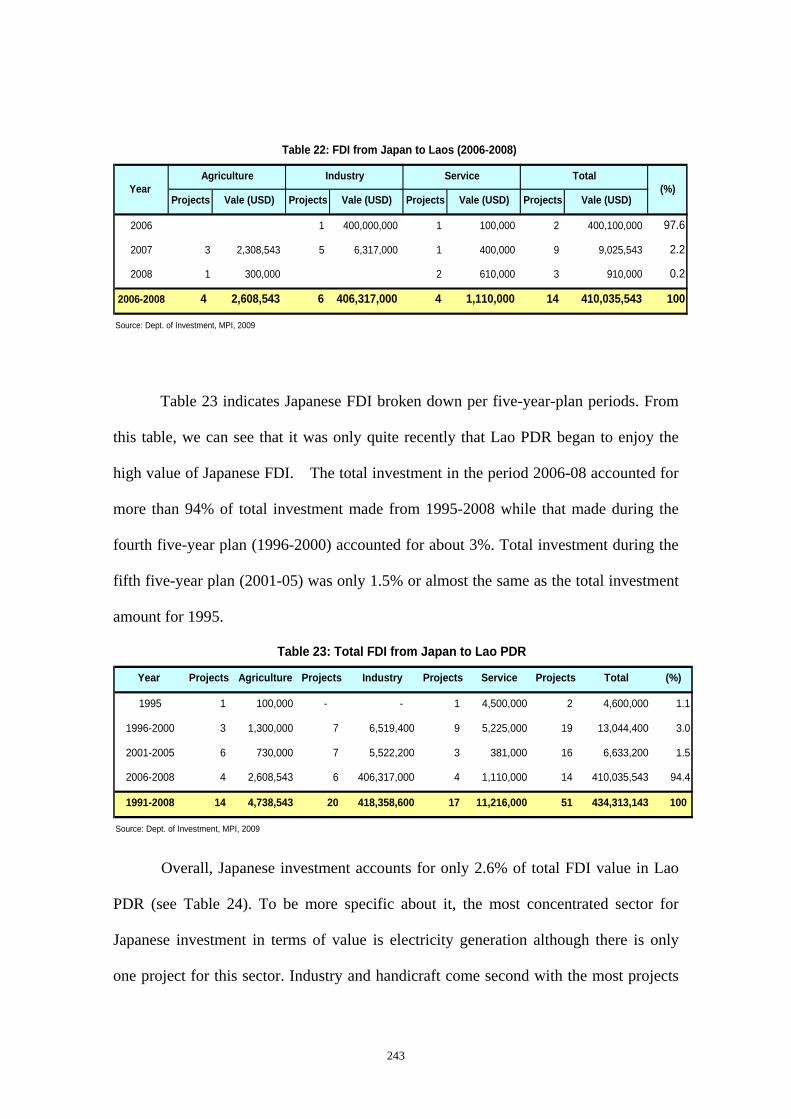
Table 22 shows FDI from Japan during the implementation of the sixth five-year
plan (2006-2008). The huge investment inflow in 2006 went to the industry sector
(hydropower electricity) and accounted for more than 99% of total investment that year.
The total investment for 2006 alone represented over 97% of the total investment value
for the period 2006-08. In terms of sector, the industry sector covered more than 99% of
total investment during this period while the sum of the agriculture and service sectors
accounted for less than 1%.
242
Projects Vale (USD) Projects Vale (USD) Projects Vale (USD) Projects Vale (USD)
2006 1 400,000,000 1 100,000 2 400,100,000 97.6
2007 3 2,308,543 5 6,317,000 1 400,000 9 9,025,543 2.2
2008 1 300,000 2 610,000 3 910,000 0.2
2006-2008 4 2,608,543 6 406,317,000 4 1,110,000 14 410,035,543 100
Source: Dept. of Investment, MPI, 2009
Table 22: FDI from Japan to Laos (2006-2008)
Year Agriculture Industry Service Total
(%)
Table 23 indicates Japanese FDI broken down per five-year-plan periods. From
this table, we can see that it was only quite recently that Lao PDR began to enjoy the
high value of Japanese FDI. The total investment in the period 2006-08 accounted for
more than 94% of total investment made from 1995-2008 while that made during the
fourth five-year plan (1996-2000) accounted for about 3%. Total investment during the
fifth five-year plan (2001-05) was only 1.5% or almost the same as the total investment
amount for 1995.
Year Projects Agriculture Projects Industry Projects Service Projects Total (%)
1995 1 100,000 - - 1 4,500,000 2 4,600,000 1.1
1996-2000 3 1,300,000 7 6,519,400 9 5,225,000 19 13,044,400 3.0
2001-2005 6 730,000 7 5,522,200 3 381,000 16 6,633,200 1.5
2006-2008 4 2,608,543 6 406,317,000 4 1,110,000 14 410,035,543 94.4
1991-2008 14 4,738,543 20 418,358,600 17 11,216,000 51 434,313,143 100
Source: Dept. of Investment, MPI, 2009
Table 23: Total FDI from Japan to Lao PDR
Overall, Japanese investment accounts for only 2.6% of total FDI value in Lao
PDR (see Table 24). To be more specific about it, the most concentrated sector for
Japanese investment in terms of value is electricity generation although there is only
one project for this sector. Industry and handicraft come second with the most projects
243
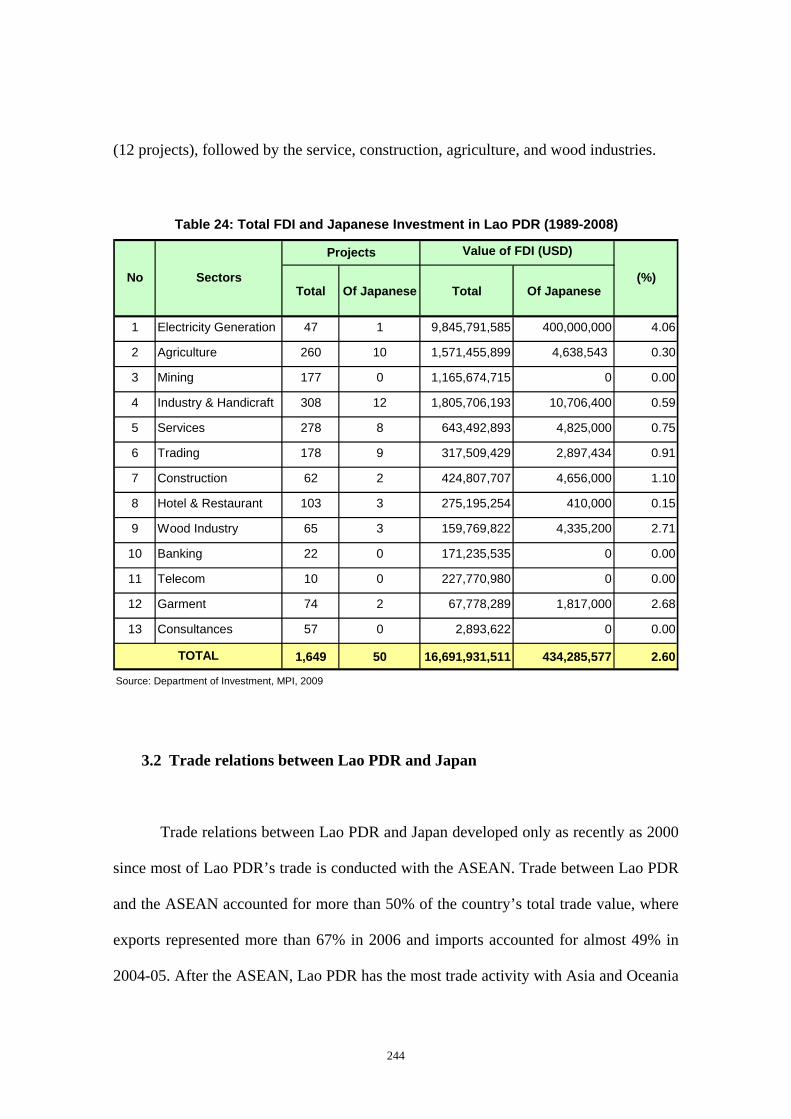
(12 projects), followed by the service, construction, agriculture, and wood industries.
Total Of Japanese Total Of Japanese
1 Electricity Generation 47 1 9,845,791,585 400,000,000 4.06
2 Agriculture 260 10 1,571,455,899 4,638,543 0.30
3 Mining 177 0 1,165,674,715 0 0.00
4 Industry & Handicraft 308 12 1,805,706,193 10,706,400 0.59
5 Services 278 8 643,492,893 4,825,000 0.75
6 Trading 178 9 317,509,429 2,897,434 0.91
7 Construction 62 2 424,807,707 4,656,000 1.10
8 Hotel & Restaurant 103 3 275,195,254 410,000 0.15
9 Wood Industry 65 3 159,769,822 4,335,200 2.71
10 Banking 22 0 171,235,535 0 0.00
11 Telecom 10 0 227,770,980 0 0.00
12 Garment 74 2 67,778,289 1,817,000 2.68
Table 24: Total FDI and Japanese Investment in Lao PDR (1989-2008)
No Sectors
Projects Value of FDI (USD)
(%)
13 Consultances 57 0 2,893,622 0 0.00
1,649 50 16,691,931,511 434,285,577 2.60
Source: Department of Investment, MPI, 2009
TOTAL
3.2 Trade relations between Lao PDR and Japan
Trade relations between Lao PDR and Japan developed only as recently as 2000
since most of Lao PDR’s trade is conducted with the ASEAN. Trade between Lao PDR
and the ASEAN accounted for more than 50% of the country’s total trade value, where
exports represented more than 67% in 2006 and imports accounted for almost 49% in
2004-05. After the ASEAN, Lao PDR has the most trade activity with Asia and Oceania
244

while East Asian countries account for more than half of the total trade with Asia and
Oceania.
Table 25 shows that Japan ranks second to China in terms of total export value
from Lao PDR. The value of Lao exports to Japan in 2006 increased by double the
amount but was still less than Lao’s exports to China and Taiwan. The average growth
rate of export value to Japan from 2000-06 was about 39% annually, a recent and
significant improvement.
After the ASEAN, Lao PDR imports most from the East Asian region, with
Japan placing third after China and South Korea in terms of import value. In 2004-05,
China accounted for more than 87% of Lao PDR’s total import value from East Asia.
South Korea accounted for about 10%; Japan, only about 2% (see Table 26). The
average growth rate of imports from Japan from the period 1999-2000 and up to the
period 2004-05 was only about 1.7% annually.
245

2000 2001 2002 2003 2004 2005 2006Brunei 7,165 13,052 Cambodia 17,623 55,909 118,752 406,586 19,500 33,225 Indonesia 1,015,830 43,858 123,746 441 172,800 Malaysia 90,710 112,412 68,823 170,688 54,069 24,938,542 39,794,768 Myanmar 258,377 24,740 241,740 13,467 - Philippine 15,120 62,589 158,235 441 7,285 Singapore 932,922 1,034,033 167,345 132,264 411,667 219,117 16,404 Thailand 162,995,387 146,733,757 156,727,723 161,472,747 146,900,611 164,552,592 456,040,790 Vietnam 23,291,404 19,483,447 25,030,252 21,212,648 27,656,445 40,452,356 93,961,524
ASEAN 188,602,253 167,407,507 182,089,911 183,535,174 175,587,613 230,203,621 590,039,848 China 7,134,776 13,800,000 11,911,155 10,891,602 5,326,659 7,165 40,682,780 Hong kong 1,990,792 1,996,570 617,831 271,596 896,481 195,575 Japan 2,358,944 3,414,459 1,827,822 3,883,526 2,102,923 3,181,103 6,889,275 Korea (South) 2,358,944 2,502,010 1,999,280 108,738 140,278 222,585 2,815,637 East Timor 204,500 Taiwan 580,871 1,216,442 343,035 1,539,603 1,452,389 3,191,924 13,081,371
East Asia 14,424,327 22,929,481 16,903,623 16,695,065 9,918,730 6,798,352 63,469,063 Total of Export Value 323,568,495 324,885,844 322,618,759 352,624,288 374,320,000 455,618,858 878,008,548
Source: Ministry of Industry and Commerce, 2008
Table: 25: Lao PDR Export to ASEAN and East Asia Region USD
1999/2000 2000/2001 2001/2002 2002/2003 2003/2004 2004/2005Cambodia 73,730 228,750 52,602 99,687 2,820 67,235 Indonesia 4,887,501 187,921 166,127 74,979 151,474 Malaysia 14,089 293,745 74,867 26,993 94,946 Myanmar 1,892 Philippine 14,296 10,000 Singapore 1,972,897 102,263 1,885,328 6,342,076 4,268,068 Thailand 91,515,357 82,335,786 142,037,545 202,754,064 193,197,993 274,176,913 Vietnam 23,944,414 33,751,489 12,873,532 17,850,100 17,699,698 54,235,979 Total ASEAN 559,346,152 566,233,453 555,588,488 595,708,869 598,074,328 748,385,268 China 18,705,687.0 35,471,694.0 17,687,444.0 32,996,566.0 26,176,582.0 54,732,691.0 Hong kong 9,249.8 75,801.0 15,254.0 302,800.0 Japan 79,125.0 423,110.0 1,669,727.0 5,080,986.0 1,813,516.0 1,279,518.0 Korea (South) 1,902,479.0 2,554,795.0 6,053,249.0 8,262,840.0 6,025,386.0 Taiwan 164,971.0 84,170.0 382,880.0 6,136.0 24,805.0 Total East Asia 18,784,812.0 37,962,254.0 22,005,385.8 44,589,482.0 36,274,328.0 62,365,200.0 Total import value 540,561,340.0 528,271,199.0 533,583,102.2 551,119,387.0 561,800,000.0 686,020,068.0 Source: Ministry of Industry and Commerce, 2008
Table 26: Import from ASEAN and East Asia Regions by Country (USD)
However, the value of trade between Lao PDR and Japan significantly increased
from 2006-08. Trade relation between these two was stable from 2000-05. From 2006
onward, its trade with Japan improved dramatically, posting a total value of almost
US$45 million from less than US$5 million in 2005 (see Figure 12).
246
-40000000
-30000000
-20000000
-10000000
0
10000000
20000000
30000000
40000000
US$
2000 2001 2002 2003 2004 2005 2006 2007 2008
Source: Ministry of Industry and Commerce, 2009
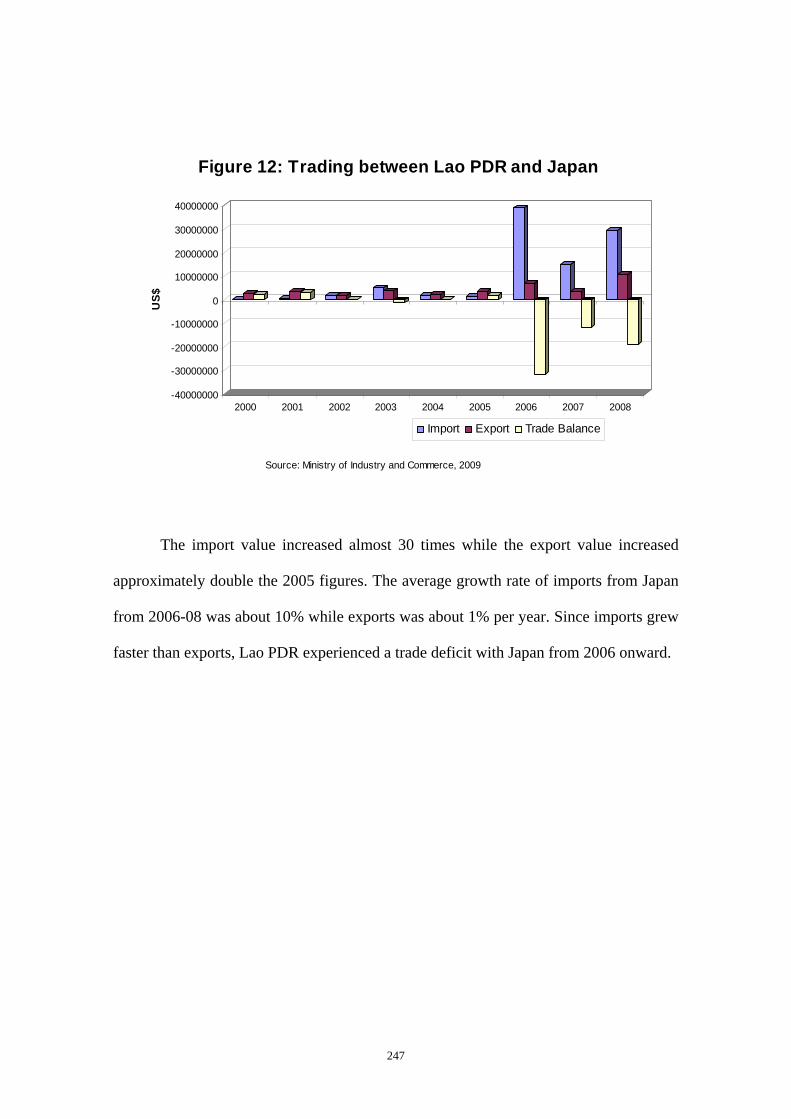
Figure 12: Trading between Lao PDR and Japan
Import Export Trade Balance
The import value increased almost 30 times while the export value increased
approximately double the 2005 figures. The average growth rate of imports from Japan
from 2006-08 was about 10% while exports was about 1% per year. Since imports grew
faster than exports, Lao PDR experienced a trade deficit with Japan from 2006 onward.
247
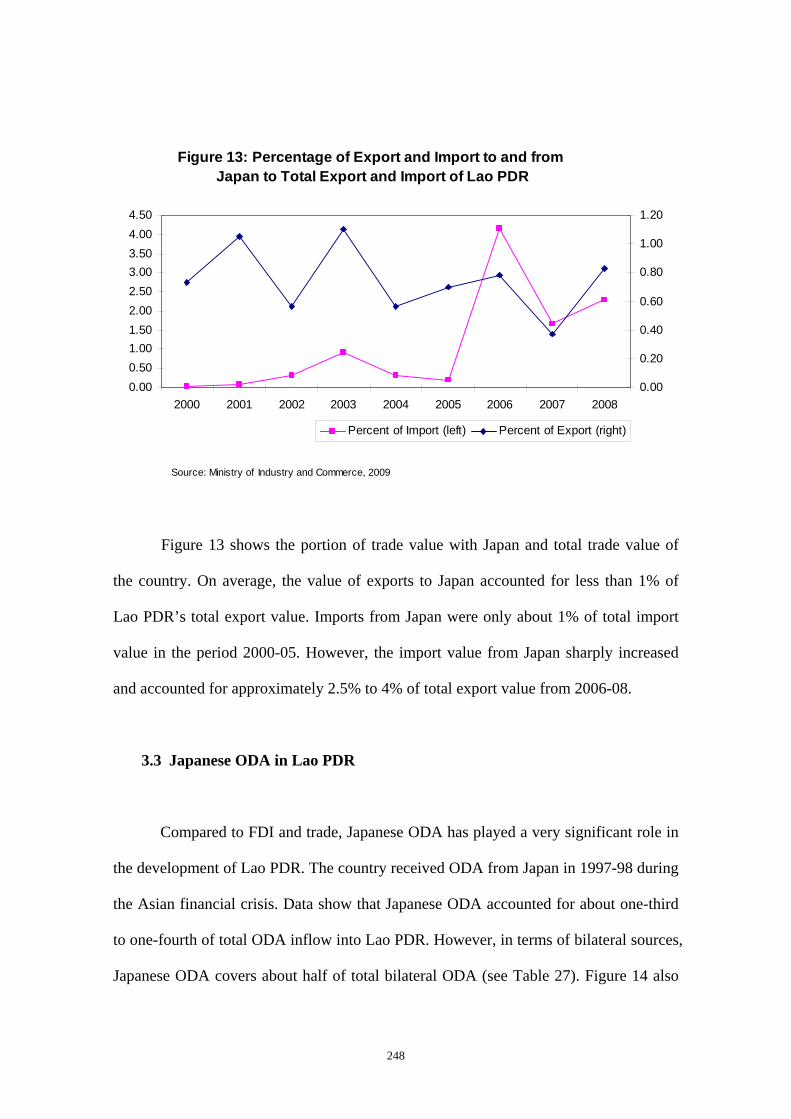
Figure 13: Percentage of Export and Import to and from Japan to Total Export and Import of Lao PDR
0.000.501.001.502.002.503.003.504.004.50
2000 2001 2002 2003 2004 2005 2006 2007 2008
Source: Ministry of Industry and Commerce, 2009
0.00
0.20
0.40
0.60
0.80
1.00
1.20
Percent of Import (left) Percent of Export (right)
Figure 13 shows the portion of trade value with Japan and total trade value of
the country. On average, the value of exports to Japan accounted for less than 1% of
Lao PDR’s total export value. Imports from Japan were only about 1% of total import
value in the period 2000-05. However, the import value from Japan sharply increased
and accounted for approximately 2.5% to 4% of total export value from 2006-08.
3.3 Japanese ODA in Lao PDR
Compared to FDI and trade, Japanese ODA has played a very significant role in
the development of Lao PDR. The country received ODA from Japan in 1997-98 during
the Asian financial crisis. Data show that Japanese ODA accounted for about one-third
to one-fourth of total ODA inflow into Lao PDR. However, in terms of bilateral sources,
Japanese ODA covers about half of total bilateral ODA (see Table 27). Figure 14 also
248

pegs the value of Japanese ODA to Lao PDR at about US$80 million to US$90 million
per year.
Total Japan1996/97 151.89 26.65 114.85 6.000 4.391997/98 194.69 35.904 144.36 73.50 5.792 8.631998/99 252.21 54.51 182.52 52.00 7.180 8.001999/00 227.85 40.06 179.40 161.40 8.3902000/01 282.03 54.5 219.52 92.602001/02 236.27 50.9 177.83 63.20 7.5402002/03 232.92 39.38 186.32 87.96 7.2202003/04 219.50 39.17 173.96 60.86 6.3702004/05 257.46 47.77 185.36 84.99 8.085 16.242005/06 225.27 43.37 146.88 85.36 18.780 16.242006/07 243.50 44.55 158.77 62.18 23.710 16.472007/08 301.79 64.93 189.69 71.53 29.290 17.882008/09 280.24 62.48 166.16 78.01 39.080 12.52Source: Dept. of International Cooperation, MPI, 2009
NGOsYear
Table 27: ODA in Lao PDR by Sources of Funds and from Japan
Total ODA Multilateral Bilateral International Monetary Funds
249

Figure 15 presents the concentration sectors for Japanese ODA in Lao PDR.
More than 43% of total Japanese ODA financed projects in the public administration
sector from 2004-06. The transport sector ranked second with road- and
bridge-construction projects. Education and human resource development is another
area of focus as Japan has been providing scholarships since the late 1990s to enable
Lao students to study in Japan. Currently, more than 50 students study in Japan annually,
while about 100 government officials go to Japan to attend capacity-building programs
yearly.
250

Table 28 and Table 29 show figures on ODA from East Asian countries
including Japan, South Korea, and China in the fiscal years 2006-07 and 2007-08,
respectively. Clearly, more than 90% of Japanese ODA is in the form of grants rather
than loans.
Grant Loan Grant Loan Total1 Japan 8 1 0.09 68.53 3.00 71.532 South Korea 7 1 0.00 5.92 13.64 19.563 China 5 7 0.00 5.12 29.27 34.39
20 9 0.09 79.57 45.91 125.48Source: Dept. of International Cooperation, MPI, 2009
Total
Table 28: ODA in Lao PDR from East Asian Countries (2006-2007)
No. CountryFiscal year 2006-07
ProjectDomestic fund
Foreign's source
Grant Loan Grant Loan Total1 Japan 10 _ 0.07 78.01 0.00 78.012 South Korea 11 _ 0.00 11.45 0.00 11.453 China 5 6 0.00 4.51 0.00 4.51
26 6 0.07 93.97 0.00 93.97Source: Dept. of International Cooperation, MPI, 2009
Table 29: ODA in Lao PDR from East Asian Countries (2007-2008)Fiscal year 2007-08
No. Country
Total
ProjectDomestic fund
Foreign's source
3.4 Other Relations Between Lao PDR and Japan
This can be considered as a form of ODA since Japanese ODA has significantly
contributed to socioeconomic development in Lao PDR especially in private-sector
development, including the Chai Lao project and the recent establishment of the One
District One Product (ODOP) project.
The Chai Lao project aims to promote the development of native handicraft
251
products, especially the quality of textile products, to facilitate their export to the
Japanese market.
The One District One Product (ODOP) project is the outcome of the joint
research project between Lao PDR and Japan; namely, the Macroeconomic Study
Support for Socio-economic Development of Lao PDR (MAPS). After the project, the
Japanese government agreed to continue support for the development of ODOP in Lao
PDR. The project is currently being implemented by the Ministry of Industry and
Commerce in cooperation with the Japan International Cooperation Agency (JICA). The
southern provinces of Lao PDR will serve as the pilot areas. The project is also
expected to stimulate the development of local products, which may, in turn, help
further develop the country’s private sector.
4. COMPARISON OF THE ROLES OF CHINA AND JAPAN IN THE
SOCIOECONOMIC DEVELOPMENT OF LAO PDR
Overall, Lao PDR’s East Asian neighbors, especially China and Japan, have
played significant roles in its socioeconomic development, particularly through FDI,
trade relations, and ODA. However, there are differences in the way China and Japan
undertake these three activities together with Lao PDR, and these differences in their
approach affect the value and percentage to the total. While Japan prefers to focus on
ODA, China is more active in the FDI and trade sectors. The level of development
partnership of these two countries in terms of the three areas can be summarized as
follows:
252

• Foreign Direct Investment Sector:
Statistics show that both China and Japan are in the top five list of countries with
high-value investments in Lao PDR. After Thailand, China has more investments in Lao
PDR compared to other investing countries. China ranks second in terms of the value of
total FDI while Japan ranks fifth and has about one-fourth of the value of Chinese
investments in Lao PDR.
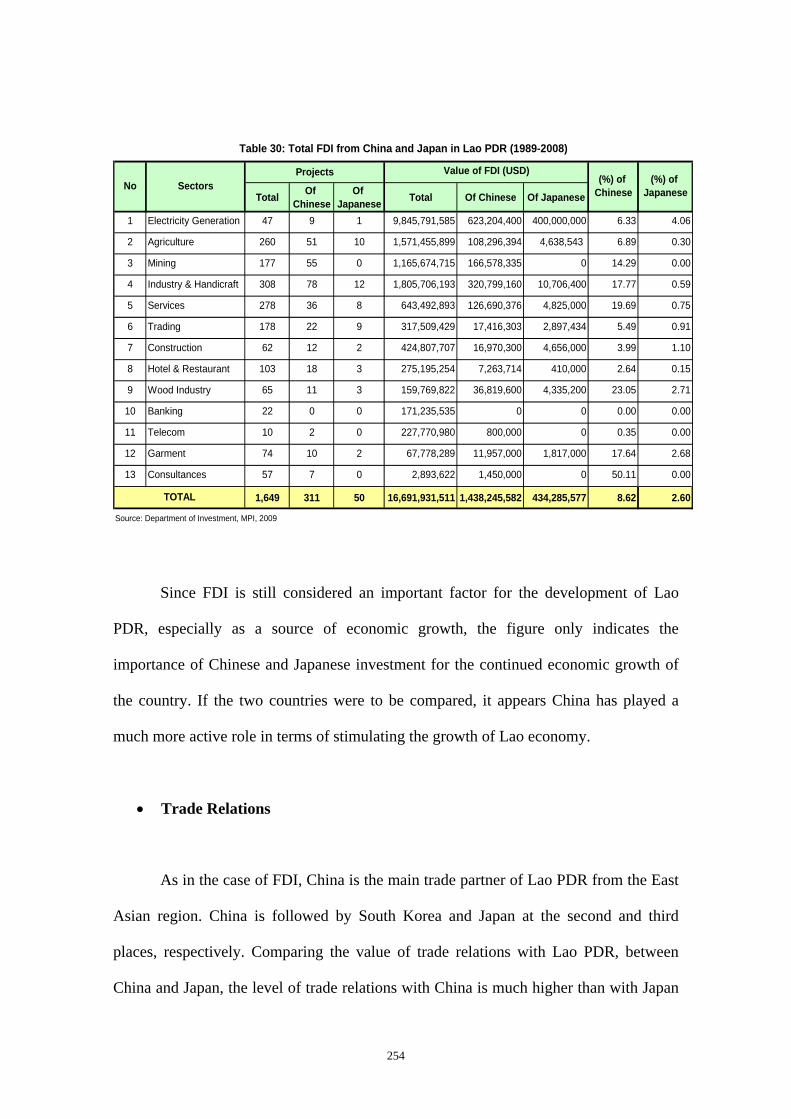
Table 30 shows that China leads in several sectors, including consultancy, as
China accounts for more than half of the total investment value in this sector. Other
sectors include the service and wood industries, which accounts for about 23% and
19.7% of total investment value in the sector, respectively. Industry-handicraft and
garments account for almost 18% of total investment value in each sector, and mining
accounts for about 14.3% of the value in total FDI in the mining sector. Total
investment value from Japan is about one-fourth of the investment from China.
However, FDI from Japan just increased very recently (in 2006) by virtue of a huge
investment Japan made in a hydropower project. The statistics show that there is
currently no concentration in investment sector by Japanese FDI. Compared to the total
value of each sector, the Japanese FDI in each sector accounts for less than 1% on
average with the highest going to electricity (4%), wood industry (2.7%), and garments
(2.7%).
253
Total Of Chinese
Of Japanese Total Of Chinese Of Japanese
1 Electricity Generation 47 9 1 9,845,791,585 623,204,400 400,000,000 6.33 4.06
2 Agriculture 260 51 10 1,571,455,899 108,296,394 4,638,543 6.89 0.30
3 Mining 177 55 0 1,165,674,715 166,578,335 0 14.29 0.00
4 Industry & Handicraft 308 78 12 1,805,706,193 320,799,160 10,706,400 17.77 0.59
5 Services 278 36 8 643,492,893 126,690,376 4,825,000 19.69 0.75
6 Trading 178 22 9 317,509,429 17,416,303 2,897,434 5.49 0.91
7 Construction 62 12 2 424,807,707 16,970,300 4,656,000 3.99 1.10
8 Hotel & Restaurant 103 18 3 275,195,254 7,263,714 410,000 2.64 0.15
9 Wood Industry 65 11 3 159,769,822 36,819,600 4,335,200 23.05 2.71
10 Banking 22 0 0 171,235,535 0 0 0.00 0.00
11 Telecom 10 2 0 227,770,980 800,000 0 0.35 0.00
12 Garment 74 10 2 67,778,289 11,957,000 1,817,000 17.64 2.68
13 Consultances 57 7 0 2,893,622 1,450,000 0 50.11 0.00
1,649 311 50 16,691,931,511 1,438,245,582 434,285,577 8.62 2.60
Source: Department of Investment, MPI, 2009
(%) of Japanese
Value of FDI (USD)No
Table 30: Total FDI from China and Japan in Lao PDR (1989-2008)
TOTAL
Sectors (%) of Chinese
Projects
Since FDI is still considered an important factor for the development of Lao
PDR, especially as a source of economic growth, the figure only indicates the
importance of Chinese and Japanese investment for the continued economic growth of
the country. If the two countries were to be compared, it appears China has played a
much more active role in terms of stimulating the growth of Lao economy.
• Trade Relations
As in the case of FDI, China is the main trade partner of Lao PDR from the East
Asian region. China is followed by South Korea and Japan at the second and third
places, respectively. Comparing the value of trade relations with Lao PDR, between
China and Japan, the level of trade relations with China is much higher than with Japan
254

(see Figure 16). This might be because of geographical advantage as China shares a
border with Lao PDR.
255

Figure 17: Percentage of Import-Export
2
44
3
12
54
33
7
3
6
5
89 9
8
0 0 01
0 0
4
22
1 11
11 1 0 11
0
1
2
3
4
5
6
7
8
9
10
2000 2001 2002 2003 2004 2005 2006 2007 2008
Source: Ministry of Industry and Commerce, 2009
%
Percent of Import from China Percent of Export to China Percent of Import from Japan Percent of Export to Japan
Figure 17 also indicates that the percentage of exports to China vis-à-vis the total
value of exports is much higher than that to Japan. The average percentage of export
value to China to total export value is about 7% for the period 2000-08, during which
exports to Japan accounted for only less than 1% on average. Also for imports, imports
from China to Lao PDR accounted for about 3.5% on average from 2000-08, while
imports from Japan accounted for less than 1% from 2000-05 and about 3% of total
import value from 2006-08.
• Official Development Assistance
Statistics show that Japanese ODA has played a significant role in the
socioeconomic development of Lao PDR. Japan is the leading donor in terms of
bilateral ODA scheme. Figure 18 indicates that Japan accounted for about one-third of
total ODA inflow into Lao PDR, while in the bilateral scheme, Japanese ODA
represented about half of the total.
256
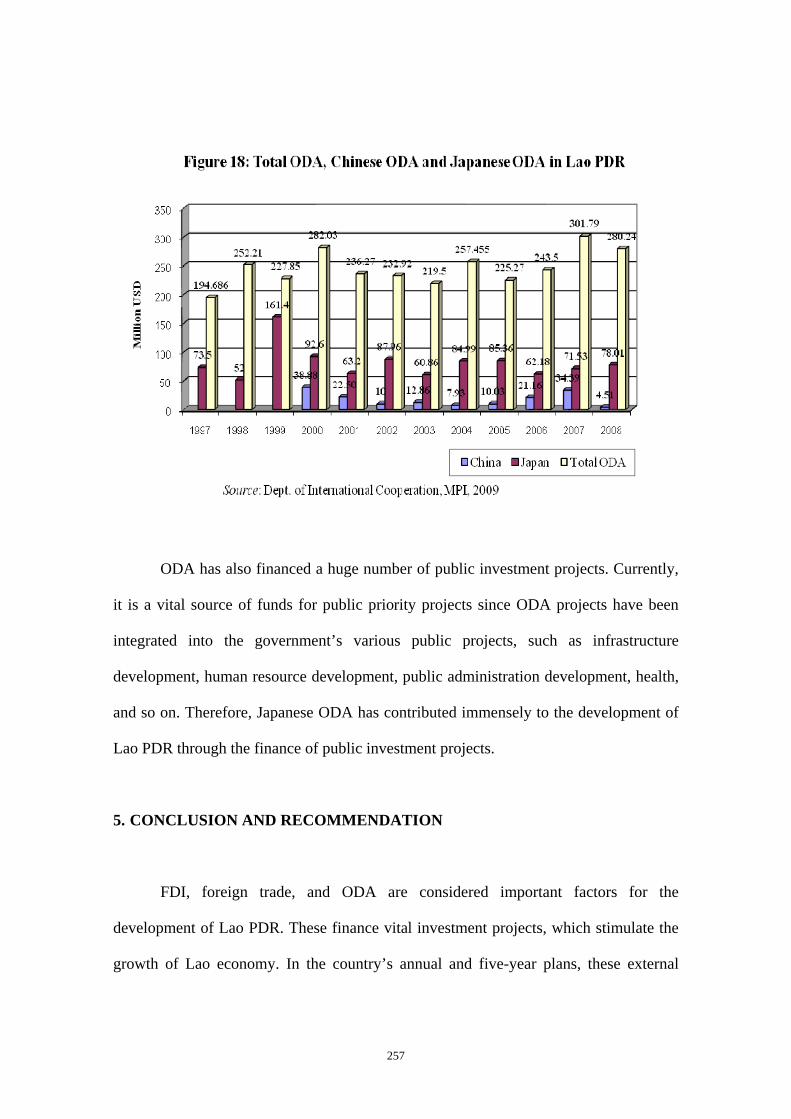
ODA has also financed a huge number of public investment projects. Currently,
it is a vital source of funds for public priority projects since ODA projects have been
integrated into the government’s various public projects, such as infrastructure
development, human resource development, public administration development, health,
and so on. Therefore, Japanese ODA has contributed immensely to the development of
Lao PDR through the finance of public investment projects.
5. CONCLUSION AND RECOMMENDATION
FDI, foreign trade, and ODA are considered important factors for the
development of Lao PDR. These finance vital investment projects, which stimulate the
growth of Lao economy. In the country’s annual and five-year plans, these external
257
sectors have been directly identified as significant factors for ensuring the achievement
of Lao PDR’s strategic goals for socioeconomic development.
Besides the ASEAN, the East Asian region is acknowledged to be an important
source of financial and technical assistance for the social and economic development of
Lao PDR. China and Japan are the country’s most important partners in this region,
providing substantial funding for many priority projects in the private business sector as
well as for public investment. Japan has continuously provided ODA for many
important infrastructure development projects as well as human resource development
projects for Lao PDR, namely: the Mekong bridges in Pakse and Savannakhet, Road No.
9 along the East-West Economic Corridor, and the various connecting bridges along
Road No. 13.
Compared to Japan, China has focused more on FDI and trade relations with Lao
PDR. It ranks second in terms of the value of FDI, and it has engaged in many huge
private investment projects, especially in the northern provinces of Lao PDR, including
the Boten-Dankham project in Loung Namtha province and the Ton Pheung project in
Bokeo province, among others. China has also been a significant trade partner, being a
source of many of the consumer products the Lao people use in their daily life and the
products used as a means of production in factories and farms, especially in the remote
northern rural areas.
Border trade in the northern provinces has also been identified as a significant
contributor to the development of the local people, especially in terms of employment
258
opportunities, income generation, technology transfer, and knowledge transfer. Many
social benefits have likewise been identified as an outcome of CBT, including education
opportunities and access to health care.
Although some of the local people in the northern provinces have expressed
negative experiences and effects from CBT with China, these reports are regarded as the
personal perspective of these people about the issues. Looking at the macro picture and
the micro situation, the northern provinces of Lao PDR, which have traditionally been
considered as the poorest region in the country, have gained a great deal of benefits in
terms of the development of infrastructure in their areas and the improvement in the
livelihoods of the local populace.
Therefore, the overall conclusion is that cooperation and good relations with
countries in the East Asian region, especially China and Japan, are important for the
development of Lao PDR. The investment, trade relation, and aid that Lao PDR
receives from these two countries are crucial for its continued social and economic
development.
6. RECOMMENDATIONS
FDI, foreign trade, and ODA are important factors for country development,
especially since they are considered as the primary means by which to achieve the
macroeconomic goals of growth, poverty reduction, and graduation from the status of
LDC by 2020. There is a need to address appropriate policy recommendations regarding
259
future cooperation with China and Japan since these two countries have been identified
as significant development partners of Lao PDR. The following are some thoughts
regarding the further development of cooperation with these two countries.
- Cooperation with China
It is important to take advantage of Lao PDR’s geographic proximity to China;
therefore, geographical collaboration, including trade relation and investment, must be
developed. The joint development of the northern provinces of Lao PDR that share a
border with China’s Yunnan province should be a good strategy for developing
Northern Lao PDR as is the plan to connect Lao PDR with the large China market. The
latter could also be seen as another approach for regional development in GMS and the
ASEAN. There is a need to develop a specific strategy for economic cooperation with
China.
- Cooperation with Japan
Japan has been identified as an important factor in Lao PDR’s development,
being a source of ODA for many priority public investment projects. Continuing
cooperation with Japan to develop and further improve Lao PDR’s social and economic
infrastructure is essential for achieving the country’s goal of reducing poverty. Aside
from infrastructure, Japanese ODA projects also develop an environment that will
encourage the private sector and Japanese investors to further invest in Lao PDR. Thus,
a specific strategy is needed to ensure (1) continued cooperation with Japan in the ODA
260

sector and (2) that the ODA sector would further support FDI and trade relations with
Japan in the future.
261
ENDNOTES 1 This section is based on the previous study of the National Economic Research Institute (NERI) on “The
Impact of Border Trade on Local Livelihoods in the North of the Lao PDR” – A Case Study of
Lao-Chinese Border Trade in Loung Namtha and Oudomxay provinces, 2006
2 Khonthapane, Insisienmay and Norintha, 2006 3 “The Impact of Border Trade on Local Livelihoods in the North of the Lao PDR” – A Case Study of
Lao-Chinese Border Trade in Loung Namtha and Oudomxay provinces.
262
REFERENCES
Arshad Imran, (2003): Economic Theory, Transition & Alternatives: Application to Lao
PDR, Vientiane: National Economic Research Bank of The Lao PDR, 2006,
Annual Report 2007, Vientiane: Government of Lao (GOL).
Bank of the Lao PDR, (2007): Annual Report 2007, Vientiane: Government of Lao
(GOL).
CPC, (2002): Foreign Aid Report 2000-2001, Vientiane: GOL, May 2002.
CPC, (2002): All Foreign Direct Investment in the Lao PDR (1994-2002), Vientiane:
GOL, 2002
GOL, CPI (2004): National Growth and Poverty Eradication Strategy - NGPES:
Vientiane, 2004
GOL and UNDP (2001): National Human Development Report Lao PDR – Advancing
Rural Development, UNDP, 2001
GOL and UNDP (2006): National Human Development Report Lao PDR –
International Trade and Human Development, UNDP, 2006
GOL, National Statistical Centre (2004): Lao Expenditure and Consumption Surveys
(LECS III), NSC, Vientiane: March 2004
GOL, Department of Statistic, (2008): Statistic 2007, DOS, MPI, 2008
Khonthapane Sirivanh, Insisienmay Sthabandith, Noritha Vanthana (2006): The Impact
of Border Trade on Local Livelihoods in the North of the Lao PDR” – A Case
Study of Lao-Chinese Border Trade in Loung Namtha and Oudomxay provinces,
2006
Leebouapao Leeber, Darachanthra Souphit, Oraboune Syviengxay, Chaleunsinh
Chansathith (2002): Regional Economic Integration of Lao PDR, NERI,
September 2002
Motoyoshi Suzuki Prof., (2003): Cost & Benefit Analysis for Joining ASEAN, Suzuka
International University, June 3, 2003.
Malaysian Institute Economic Research (MIER), (2000): ASEAN Economic Integration,
Sazakawa Peace Foundation, 2000.
Oraboune Syviengxay, (2005): One District One Product “Sample Survey – Rattan
263
Works in Phone Village”, MAPS II Project, NERI/JICA, 2003-2005
______Statistics of Export and Import of Lao PDR, Ministry of Industry and Commerce,
2009
______Statistics of FDI in Lao PDR, Dept. of Investment, MPI, 2009
______Statistics of ODA in Lao PDR, Dept. of International Cooperation, MPI, 2009
264


![Foreign Direct Investment Lao[1]](https://img.dokumen.tips/doc/110x75/577d27321a28ab4e1ea346e6/foreign-direct-investment-lao1.jpg)