Embed Size (px)
Citation preview

Part 1. COVID-19: Impact and Response
1
10158-EAP Economic Update_73177_newB.indd 110158-EAP Economic Update_73177_newB.indd 1 4/1/20 2:23 PM4/1/20 2:23 PM

1. Chapter I. Synthesis
1. The disease
The COVID-19 respiratory virus has become a global pandemic. A new strain of the virus that affects respiratory organs, COVID-19, was reported in Wuhan, China in late-December 2019. As of March 27, 2020, more than 600 thousand cases of infection were reported worldwide resulting in more than 30 thousand deaths, with the majority outside China. It has affected not only countries in the East Asia and Pacific region but has spread quickly in 199 countries and territories around the World (Figure I.1.1). On March 11, 2020, the World Health Organization characterized COVID-19 as a pandemic.
Figure I.1.1. COVID-19 has spread rapidly across the world
Sources: World Bank staff using data from Johns Hopkins University; World Health Organization; United States Centers for Disease Control and Prevention; European Centre for Disease Prevention and Control; United States National Health Council; DXY; 1point3acres; Worldometers.info; BNO; state and national government health departments; and local media reports. Note: As of March 27, 2020.
COVID-19 is inflicting a high human cost and putting immense pressure on public health systems. Given high transmissibility, zero herd immunity and, until recently, high population mobility, COVID-19 has spread rapidly in many parts of the world (Figure I.1.2). Some disease modelers estimate that eventually, up to 60-80 percent of the world population could be infected (Box I.B.1). The number of fatalities is increasing rapidly. As the world struggles to prevent the spread of the disease, public health systems in many countries are finding it difficult to cope with the growing need for treatment. While some countries are better prepared, others lack essential facilities and have seen delays in testing for the disease.
2
EAST ASIA AND PACIFIC ECONOMIC UPDATE APRIL 2020
PART I. COVID-19: IMPACT AND RESPONSE
10158-EAP Economic Update_73177_newB.indd 210158-EAP Economic Update_73177_newB.indd 2 4/1/20 2:23 PM4/1/20 2:23 PM

Box I.B.1. The potential scale of the disease and containment strategies
The last time the world faced a global emerging disease epidemic on the scale of the current COVID-19 pandemic with no access to vaccines was the 1918–19 H1N1 influenza pandemic. That pandemic is estimated to have killed 50 million people worldwide. In lethality, the COVID-19 virus resembles H1N1 influenza.
The Imperial College COVID-19 Response Team in London used a microsimulation model to predict different scenarios depending on the type of response in the United Kingdom and the United States. In the case of an unmitigated epidemic, they predict approximately 510,000 deaths in the United Kingdom and 2.2 million in the US, not accounting for the potential negative effects of health systems being overwhelmed on mortality.
Next, they consider two strategies to reduce mortality and demand for health care.
a. Suppression. Here the aim is to reduce the reproduction number (the average number of secondary cases each case generates), R, to below 1 and hence to reduce case numbers to low levels. The main challenge of this approach is that non-pharmaceutical interventions (NPIs) (and drugs, if available) need to be maintained—at least intermittently—for as long as the virus is circulating in the human population, or until a vaccine becomes available. In the case of COVID-19, it will be at least an estimated 12–18 months before a vaccine is available. Furthermore, there is no guarantee that initial vaccines will have high efficacy.
(continued)
Figure I.1.2. Cases of this highly transmissible disease are declining in China but growing in the rest of the world
a. COVID-19 in perspective b. Active cases
0 4 8 12 16
Number of people infected by each sick person
Fata
lity
rate
(lo
g sc
ale)
Modern BubonicPlague
Cholera
Influenza
Spanish Influenza
Meningococcal disease
Ebola
MeaslesYellow fever
MERS
SARS
Avian Influenza H5N1
COVID-19
Spreads faster
More deadly
100
50
10
5
0.1
China Rest of the worldRest of EAP Ca
ses,
tho
usan
d
0
50
100
150
200
250
300
22-J
an
29-J
an
5-Fe
b
12-F
eb
19-F
eb
26-F
eb
4-M
ar
11-M
ar
18-M
ar
25-M
ar
Sources: Panel A. EM-DAT Database; CEIC database; WHO; CDC; ECDC; NHC; DXY; University of Minnesota; The American Thoracic Society; World Bank staff calculations. Panel B. Haver Analytics. World Health Organization and the National Health Commission of the People’s Republic of China. Note: Panel A. Estimates of fatality rate and the total number affected can vary, and COVID-19 rates are preliminary estimates. Panel B. shows a 7-day total.
3
EAST ASIA AND PACIFIC IN THE TIME OF COVID-19
1. CHAPTER I. SYNTHESIS
10158-EAP Economic Update_73177_newB.indd 310158-EAP Economic Update_73177_newB.indd 3 4/2/20 3:26 PM4/2/20 3:26 PM

The optimal suppression policy would combine social distancing of the entire population, home isolation of cases and household quarantine of their family members, probably supplemented by the school and university closures.
b. Mitigation. Here the aim is to use NPIs (and vaccines or drugs, if available) not to interrupt transmission completely, but to reduce the health impact of an epidemic, akin to the strategy adopted by some U.S. cities in 1918, and by the world more generally in the 1957, 1968 and 2009 influenza pandemics. In the 2009 pandemic, for instance, early supplies of vaccine were targeted at individuals with pre-existing medical conditions which put them at risk of more severe disease. In this scenario, population immunity builds up through the epidemic, leading to an eventual rapid decline in case numbers and transmission dropping to low levels.
The optimal mitigation policy would combine home isolation of suspect cases, home quarantine of those living in the same household as suspect cases, and social distancing of the elderly and others at the most risk of severe disease.
The most significant conclusion of the simulations is that with mitigation alone the emergency surge capacity limits of the United Kingdom and United States healthcare systems will be exceeded many times over. In the most effective mitigation strategy examined, which leads to a single, relatively short epidemic (case isolation, household quarantine and social distancing of the elderly), the surge limits for both general ward and intensive care unit (ICU) beds would be exceeded by at least eight-fold under the more optimistic scenario for critical care requirements examined. In addition, even if all patients were able to be treated, the authors predict there would still be in the order of 250,000 deaths in the United Kingdom, and 1.1–1.2 million in the United States.
The authors, therefore, conclude that epidemic suppression is the only viable strategy at the current time. The social and economic effects of the measures which are needed to achieve this policy goal will be profound. The major challenge of suppression is that this type of intensive intervention package—or something equivalently effective at reducing transmission—will need to be maintained until a vaccine becomes available (potentially 18 months or more), given that the model predicts that transmission will quickly rebound if interventions are relaxed. The authors show that intermittent social distancing—triggered by trends in disease surveillance—may allow interventions to be relaxed temporarily in relatively short time windows, but measures will need to be reintroduced if or when case numbers rebound.
The estimates from Imperial College have been criticized, for example by Shen, Taleb, and Bar-Yam (2020). Some of their criticisms, such as that the modeling fails to account for the impact of contact tracing and testing, seem fair. But alternative estimates have not been presented. While there remains significant uncertainty around these projections, there is more agreement on the huge mortality risk in the absence of action. For example, the Imperial College estimates have reportedly informed government policy in the United Kingdom and the United States.
The Imperial College COVID-19 response team also worked on projecting the global impact of the COVID-19 pandemic under different strategies for mitigation and suppression. They considered the likely scale of five
(Box I.1. continued)
(continued)
4
EAST ASIA AND PACIFIC ECONOMIC UPDATE APRIL 2020
PART I. COVID-19: IMPACT AND RESPONSE
10158-EAP Economic Update_73177_newB.indd 410158-EAP Economic Update_73177_newB.indd 4 4/1/20 2:23 PM4/1/20 2:23 PM
potential scenarios, but we focus here on three: (1) An unmitigated epidemic—a scenario in which no action is taken. (2) Suppression, i.e., the implementation of wide-scale intensive social distancing (modelled as a 75 percent reduction in interpersonal contact rates) with the aim to rapidly suppress transmission and minimize near-term cases and deaths. They explore different epidemiological triggers (deaths per 100,000 population) for the suppression strategy:
• Scenario 2a: Suppression triggered at 1.6 deaths per 100,000 population per week
• Scenario 2b: Suppression triggered at 0.2 deaths per 100,000 population per week
Figure I.B.1.1 shows the estimated number of deaths under the unmitigated scenario and the two suppression scenarios for each of the world regions. In lower income settings where capacity is lowest, intermediate mitigation scenarios (not shown) lead to peak demand for critical care beds in a typical low-income setting outstripping supply by a factor of 25.Their analysis suggests that healthcare demand can only be kept within manageable levels through the rapid adoption of public health measures (including testing and isolation of cases and wider social distancing measures) to suppress transmission, similar to those being adopted in many countries at the current time.
Figure I.B.1.1. Suppression measures can help lower the death rate of COVID-19
Unmitigated epidemic Suppression trigger 1.6 deaths/100,000/week Suppression trigger 0.2 deaths/100,000/week
0
2
4
6
8
10
12
14
16
East Asia andPacific
Europe andCentral Asia
Latin Americaand Caribbean
Middle East andNorth Africa
North America South Asia Sub-SaharanAfrica
Esti
mat
ed d
eath
s (i
n m
illio
ns)
Source: Imperial College COVID-19 Response team.
The estimates from the Imperial College COVID-19 Response Team account for the age structure of the population and rates of contact across older age groups. Even though these rates of contact across generations are higher in lower-income countries, the authors predict a lower incidence of severe disease, hospitalization, and deaths in those settings, driven by the younger average age distribution of these populations. It is important to note, however, that these estimates assume no substantive difference in general health/co-morbidity prevalence between Chinese and other populations. This assumption is unlikely to hold in practice. Furthermore, the standard of medical care
(Box I.B.1. continued)
(continued)
5
EAST ASIA AND PACIFIC IN THE TIME OF COVID-19
1. CHAPTER I. SYNTHESIS
10158-EAP Economic Update_73177_newB.indd 510158-EAP Economic Update_73177_newB.indd 5 4/1/20 2:23 PM4/1/20 2:23 PM

Box I.B.2. Understanding the shock, its economic implications, and the policy challenge
Why is the shock unusual?
This is both a supply and demand shock, due to the preventive behavior of individuals and the transmission control policies of governments.
Social distancing prevents people from working and consuming in proximity to each other. Three types of activities are immediately affected: collective high-density production, which is an aspect of many manufacturing factories where workers need to work closely together; collective high-density consumption, which is an aspect of many services activities, like entertainment (sports, music, and cinemas), restaurants, and travel, where consumers need to get together; and proximate production and consumption, which involves suppliers meeting consumers, which is an aspect of personal care, health care, restaurants, and some types of retail.
The nature of the product determines whether it is possible to make up for any reduction in production and consumption by an increase in the future and therefore whether the shock is temporary or permanent. The key attributes are the durability of the product and demand. For example, if cars are not produced or demanded today, to some extent production can be scaled up in the future and there is likely to be pent-up consumer demand. But if a person does not go to the restaurant or hair salon today, there are limits to which demand and supply can be shifted to a future date.
(continued)
available varies significantly across the world settings and tends to be substantially lower in lower-income countries. The impact of a lack of adequate care for more severe cases of COVID-19 is difficult to quantify, but is likely to significantly increase overall mortality, and could be compounded if the number of cases requiring care leads to health systems failure. These two factors are not currently captured in the proposed projections of total deaths.
The health care challenge is formidable. A vaccine is only likely to be available in an estimated 18 months, and it might be another 6 months before the vaccine is widely administered in developing countries. Unless capacity increases dramatically, health systems could be placed under tremendous strain for a period of two years. People who need hospitalization for any other conditions will be competing with COVID-19 patients and as a result, many will not be able to get the care they need, therefore, there will also be elevated mortality among non-COVID-19 patients, especially those who need ICU care.
Countries will struggle to offer some form of care in the absence of ventilators, protective personal equipment (PPEs), and other equipment they will need, which are all in short supply already. The experience from Wuhan offers some lessons, but Wuhan was also able to draw on support from the rest of China. That will not be possible when the situation is the same everywhere. There will, therefore, be an urgent need to initiate mitigation and even suppression strategies as well as to expand and coordinate the capacity for care at an international scale now that the virus has spread to many countries.
(Box I.B.1. continued)
6
EAST ASIA AND PACIFIC ECONOMIC UPDATE APRIL 2020
PART I. COVID-19: IMPACT AND RESPONSE
10158-EAP Economic Update_73177_newB.indd 610158-EAP Economic Update_73177_newB.indd 6 4/1/20 2:23 PM4/1/20 2:23 PM

Finally, substitution possibilities can dampen the shock. Consumers may shift from going to the cinema to streaming movies; from meeting people to using more data and voice. Where factories are fungible, and social distancing is not a binding constraint, firms can shift from supplying what is not needed (cars) to what is (machines to produce masks). Where skills are fungible, and again social distancing is not a constraint, individuals can shift from occupations hit by demand or social distancing constraints, like face-to-face retail, to those that are not, like electronic retail. In most cases, forced substitution in consumption will be associated with a loss in utility and forced substitution in production with a loss in productivity.
Why will its impact be larger than that of previous shocks?
The Great Recession began as a financial crisis in the United States which triggered a recession and was transmitted to the rest of the world through trade and financial channels. Some affected countries which were fiscally and financially robust, e.g. in East Asia, were able to insulate themselves from the financial shock and mitigate the consequences of the trade shock through expansionary macroeconomic policies. The converse was true in the case of the East Asian financial crisis.
This time is different. The virus and society’s responses to it are hitting economies across the world almost simultaneously, and all countries are suffering both a demand and a supply shock described above. In other words, the Great Recession was one shock, albeit to a large country (the US); in contrast, the COVID-19 is a demand-cum-supply shock to all the countries gripped by the virus: China, East Asia, the United States, Western Europe, and the Middle East. And the world is much more integrated today than it ever was through globalized consumption and international production networks. That is reflected in the increased correlation between national incomes, especially in high-income countries. Therefore, the scope for mutual amplification through the trade and financial channels is much greater than when shocks hit just one country or region. Even if the containment measures are restricted to say two quarters, it is likely that annual global GDP growth will be negative for perhaps the first time in a decade.
Why must the policy response be different?
This would be no ordinary recession. In previous cases, such as the Great Recession or the Great Depression, balance sheets were impaired and as a result, demand shrank while factories and people were idle. The solution was repairing the financial system combined with expansionary fiscal and monetary policies that boosted demand and drew idle resources and people back into work. Economists haggled over the size of the fiscal multiplier, but there was no question that the marginal propensity to consume and the elasticity of supply were both reasonably high, especially with interest rates at or close to the lower bound (Blanchard and Leigh, 2013).
In the current situation, there are two differences. The aim of the immediate policy response is not so much to restore demand because reduced supply and overall activity are a necessary consequence of efforts to contain the spread of the epidemic. Instead, the aim is to cushion households, especially poorer ones, against income shocks; and to tide firms over so that large-scale bankruptcies and employment losses are minimized. Monetary and fiscal policies must be recast in a COVID-19 mold. Fiscal measures like subsidies for sick pay and expenditure on health care could encourage some types of consumption and production that are still feasible while helping
(continued)
(Box I.B.2. continued)
7
EAST ASIA AND PACIFIC IN THE TIME OF COVID-19
1. ChAPTER I. SynThESIS
10158-EAP Economic Update_73177_newB.indd 710158-EAP Economic Update_73177_newB.indd 7 4/21/20 8:20 AM4/21/20 8:20 AM

2. The immediate impact on China
China has seen a precipitous decline in economic activity, but there are now some signs of recovery (Figure I.1.3). In February, the purchasing managers’ index fell below the 50-point mark that separates monthly growth from contraction. The fall was sharper and wider than during the Great Recession, to 36 in manufacturing and 30 in non-manufacturing sectors; the latter had been relatively resilient during the great recession. Industrial production also registered negative growth for the first time in more than 30 years. Estimates based on high-frequency data indicate that China’s growth has declined sharply in the first quarter of 2020 (Box I.B.3). But coal consumption, which is a widely followed indicator of electricity generation and hence economic activity, is gradually increasing. It remains to be seen whether the government can switch on economic activity as abruptly as it was switched off. Most large industrial enterprises outside Hubei have resumed production, however, only 74 percent of their workers have reportedly returned to work, suggesting still less than full capacity utilization. It is conceivable that there is a coordination failure between interdependent firms that is impeding the resumption of production. Indirect estimates, such as pollution indicators, show that activity is increasing gradually in China (Figure I.1.4).
to support containment. Other fiscal transfers could help credit-constrained households to smooth consumption where incomes have shrunk. Liquidity injections can help firms stay in business and maintain GVC links.
The second difference relates to the impact of such policy responses. During the period of social isolation, the propensity to consume is much lower and supply is much less elastic, for the reasons discussed above. The supply response within a country is also limited by supply disruptions in other input-supplying countries. These factors reduce the potency of monetary and especially fiscal policies with multipliers likely to be much smaller in the short term. The optimal economic policy response will, of course, change over time and depend on the precise nature and evolution of the shock—to labor supply, aggregate demand or finance.
(Box I.B.2. continued)
8
EAST ASIA AND PACIFIC ECONOMIC UPDATE APRIL 2020
PART I. COVID-19: IMPACT AND RESPONSE
10158-EAP Economic Update_73177_newB.indd 810158-EAP Economic Update_73177_newB.indd 8 4/1/20 2:23 PM4/1/20 2:23 PM

Figure I.1.3. Economic activity has declined in China, and the first quarter is likely to see a contraction
a. Manufacturing and services PMI b. Trade (year-to-year growth)
25
30
35
40
45
50
55
60
65
Feb-
07Au
g-07
Feb-
08Au
g-08
Feb-
09Au
g-09
Feb-
10Au
g-10
Feb-
11Au
g-11
Feb-
12Au
g-12
Feb-
13Au
g-13
Feb-
14Au
g-14
Feb-
15Au
g-15
Feb-
16Au
g-16
Feb-
17Au
g-17
Feb-
18Au
g-18
Feb-
19Au
g-19
Feb-
20NBS: Manufacturing PMINBS: Nonmanufacturing PMI+50: Expansion
Global financial crisis
–40–30–20–10
01020304050
02-2
005
02-2
006
02-2
007
02-2
008
02-2
009
02-2
010
02-2
011
02-2
012
02-2
013
02-2
014
02-2
015
02-2
016
02-2
017
02-2
018
02-2
019
02-2
020
Total United States Asia
Perc
ent
Global financial crisis
c. Industrial production (year-to-year) d. Coal consumption (10,000 tons)
–15
–10
–5
0
5
10
Mar-
18
Apr-
18
May-
18
Jun
-18
Jul-
18
Aug-1
8Sep
-18
Oct
-18
Nov-
18
Dec
-18
Jan
-19
Feb-1
9M
ar-
19
Apr-
19
May-
19
Jun
-19
Jul-
19
Aug-1
9Sep
-19
Oct
-19
Nov-
19
Dec
-19
Jan
-20
Feb-2
0
Per
cent
Range for 2011–2017 2019 2020
0
10
20
30
40
50
60
70
80
90–6
0–5
5–5
0–4
5–4
0–3
5–3
0–2
5–2
0–1
5–1
0 –5 LNY 5 10 15 20 25 30 35 40 45 50 55 60
10,0
00 t
ons
Source: CEIC; General Administration of Customs, People’s Republic of China; Haver Analytics; www.cqcoal.com Note: Panel D. LNY stands for Lunar New Year. The horizontal axis denotes days. Daily coal consumption for six major electricity producers is a proxy for electricity production in China.
9
EAST ASIA AND PACIFIC IN THE TIME OF COVID-19
1. CHAPTER I. SYNTHESIS
10158-EAP Economic Update_73177_newB.indd 910158-EAP Economic Update_73177_newB.indd 9 4/1/20 2:23 PM4/1/20 2:23 PM

Box I.B.3. Predicting China’s growth
High-frequency data suggest a sharp decline in China’s GDP growth in Q1. Industrial production data in February showed a sharp contraction, as suggested by several other activity-related high-frequency indicators. High-frequency data-based analysis suggests that unless there is a dramatic revival of economic activity in March, China’s growth in the first quarter will come to a halt (Figure I.B.3.1). Information was extracted from the annual growth of coal consumption, railway traffic freight, number of air passengers, industrial production, fixed-asset investment, retail sales of consumer goods, manufacturing PMI, and services PMI. For each one of these high-frequency series, data were available until February 2020. For March 2020 the values were forecasted independently using Auto-Regressive Integrated Moving Average (ARIMA) models. This class of models explains a given time series based on its past values and the lagged forecast errors. For each series, the models take into account the contraction in January and February and assume a gradual recovery for March.
Figure I.1.4. Indirect evidence suggests that economic activity in China is resuming at a slow pace
China’s air pollution: noxious nitrogen dioxide (NO2 density)
Dec 25, 2019 Jan 6, 2020 Feb 2, 2020 March 11, 2020
Sources: World Bank staff using Sentinel-5P Pre-Operations Data Hub and NASA Panoply. Notes: Blue shows less pollution.
(continued)
10
EAST ASIA AND PACIFIC ECONOMIC UPDATE APRIL 2020
PART I. COVID-19: IMPACT AND RESPONSE
10158-EAP Economic Update_73177_newB.indd 1010158-EAP Economic Update_73177_newB.indd 10 4/1/20 2:23 PM4/1/20 2:23 PM

Model estimates confirm a precipitous drop in growth in Q1. Once data for all high-frequency indicators are generated for the full first quarter, GDP growth is estimated using a Newey-West estimator with heteroskedasticity and autocorrelation consistent (HAC) standard errors.1 The estimation includes lags of quarterly GDP growth as well as information from the high-frequency indicators, specifically the principal component of all the 8 indicators listed above. The estimates show that year-to-year GDP growth for the first quarter of 2020 is likely to be negative, ranging between –7.5 and –0.6 percent, with the mean unbiased estimate at –4.0 percent. These estimates are meant as probable scenarios to illustrate the sharp impact of the COVID-19 pandemic and may underestimate the actual first quarter impact because of the rapid globalization of the shock in recent weeks.
Box Figure I.B.3.1. High-frequency data suggest that output will decline in China in the first quarter of 2020
a. High-frequency indicators and growth b. Growth forecast
–25
–15
–5
5
15
25
35
0
3
6
9
12
15
2005
q120
05q4
2006
q320
07q2
2008
q120
08q4
2009
q320
10q2
2011
q120
11q4
2012
q320
13q2
2014
q120
14q4
2015
q320
16q2
2017
q120
17q4
2018
q320
19q2
2020
q1
GDP growth High-frequency indicators (RHS)
Perc
ent
–25
–15
–5
5
15
25
35
0
3
6
9
12
15
2005
q120
05q4
2006
q320
07q2
2008
q120
08q4
2009
q320
10q2
2011
q120
11q4
2012
q320
13q2
2014
q120
14q4
2015
q320
16q2
2017
q120
17q4
2018
q320
19q2
2020
q1
GDP growth High-frequency indicators (RHS)
Perc
ent
–10
–8
–6
–4
–2
0
2
4
6
8
2019q1 2019q2 2019q3 2019q4 2020q1
Perc
ent
Source: CEIC; Haver Analytics.Note: Panel A. Blue bar represents year-to-year quarterly GDP growth. Average HF refers to the unweighted average of the annual growth of coal consumption, railway traffic freight, number of air passengers, industrial production, fixed-asset investment, retail sales of consumer goods, manufacturing PMI, and services PMI. Panel B. GDP growth regressed on its lags and the first and second principal components of the variables in Panel A. Estimated using OLS with Newey-West standard errors that control for heteroskedasticity and correlation.
1 This estimate provides robust estimates when using high-frequency data by controlling for lagged autocorrelation and arbitrary heteroskedasticity.
3. The global shock
Initially, developments within China had a profound effect on the region, but now what happens outside China will matter more. While the number of new cases is decreasing in China, it is increasing at an exponential rate in other parts of the world where the number of actives cases is twice the number in China. The disease seems to have spread at a relatively slower pace in the rest of the developing EAP region, though Malaysia, the Philippines, Thailand, and Indonesia have reported an increasing number of infections in the last few days. The reason for the low number of confirmed cases is not clear, but observers have pointed to the delays in testing, the preventive actions that were taken by countries, and the relatively warm weather compared to countries like Iran, Republic of Korea, Italy, and the United States.
Global economic activity is declining sharply as the virus spreads around the world. Events in the region have been overtaken by global developments as confidence declines sharply (Figure I.1.5). Global manufacturing and services
(Box I.B.3. continued)
11
EAST ASIA AND PACIFIC IN THE TIME OF COVID-19
1. CHAPTER I. SYNTHESIS
10158-EAP Economic Update_73177_newB.indd 1110158-EAP Economic Update_73177_newB.indd 11 4/1/20 2:23 PM4/1/20 2:23 PM

PMI are falling, and the Chicago Board Options Exchange (CBOE) volatility index (VIX)—a measure of market risk and investors’ sentiments—has increased sharply. Capital flows to emerging markets retreated sharply, with 4-week average emerging markets non-resident equity and debt flows dropping lower than during the Global Financial Crisis of 2008–09. The prices of most commodities have plunged. The initial drop was related to the outbreak and expectations of falling demand for commodities in China. Oil prices fell even more precipitously following the announcement that both Saudi Arabia and Russia will boost oil production, with Saudi Arabia planning to increase output to a record level of 12.3 million barrels per day, 2.5 million more than it is currently producing.2
2 The Brent crude price had its worst one day decline since 1991, falling below $35 per barrel where it remains as of March 20. Most industrial metals have also declined, with significant declines in copper (–7 percent) and zinc (-8 percent). Gold prices, meanwhile, have risen 7 percent over the same period on heightened uncertainty and safe-haven flows by investors.
Figure I.1.5. Global confidence is declining sharply and that could affect the region
a. Global manufacturing and services PMI b. CBOE volatility index (VIX)
Manufacturing PMIServices PMI+50: Expansion
30
35
40
45
50
55
60
65
70
Feb-
07Au
g-07
Feb-
08Au
g-08
Feb-
09Au
g-09
Feb-
10Au
g-10
Feb-
11Au
g-11
Feb-
12Au
g-12
Feb-
13Au
g-13
Feb-
14Au
g-14
Feb-
15Au
g-15
Feb-
16Au
g-16
Feb-
17Au
g-17
Feb-
18Au
g-18
Feb-
19Au
g-19
Feb-
20
0
10
20
30
40
50
60
70
80
90
Feb-0
7A
ug-0
7Feb-0
8A
ug-0
8Feb-0
9A
ug-0
9Feb-1
0A
ug-1
0Feb-1
1A
ug-1
1Feb-1
2A
ug-1
2Feb-1
3A
ug-1
3Feb-1
4A
ug-1
4Feb-1
5A
ug-1
5Feb-1
6A
ug-1
6Feb-1
7A
ug-1
7Feb-1
8A
ug-1
8Feb-1
9A
ug-1
9Feb-2
0
c. Emerging markets capital flows d. Commodity prices declined sharply
–2.5
–2.0
–1.5
–1.0
–0.5
0.0
0.5
1.0
1.5
13-M
ar-2
005
13-M
ar-2
006
13-M
ar-2
007
13-M
ar-2
008
13-M
ar-2
009
13-M
ar-2
010
13-M
ar-2
011
13-M
ar-2
012
13-M
ar-2
013
13-M
ar-2
014
13-M
ar-2
015
13-M
ar-2
016
13-M
ar-2
017
13-M
ar-2
018
13-M
ar-2
019
13-M
ar-2
020
Emerging markets net nonresident equity and bondpurchases—4-week moving average
USD
, bill
ion
Global financial crisis
Brent crude oil Copper (RHS)
USD
/bar
rel
USD
/met
ric
ton
4,000
4,500
5,000
5,500
6,000
6,500
20
30
40
50
60
70
80
21-D
ec24-D
ec27-D
ec30-D
ec2-J
an5-J
an8-J
an11-J
an14-J
an17-J
an20-J
an23-J
an26-J
an29-J
an1-F
eb4-F
eb7-F
eb10-F
eb13-F
eb16-F
eb19-F
eb22-F
eb25-F
eb28-F
eb2-M
ar5-M
ar8-M
ar11-M
ar14-M
ar17-M
ar20-M
ar
Sources: Panel A. IIF, Haver Analytics; World Bank.Note: Panel B. Maximum value in each month. Panel C. Emerging markets net nonresident equity purchases, 28-days moving average. Panel D. The last date is March 20.
12
EAST ASIA AND PACIFIC ECONOMIC UPDATE APRIL 2020
PART I. COVID-19: IMPACT AND RESPONSE
10158-EAP Economic Update_73177_newB.indd 1210158-EAP Economic Update_73177_newB.indd 12 4/1/20 2:23 PM4/1/20 2:23 PM
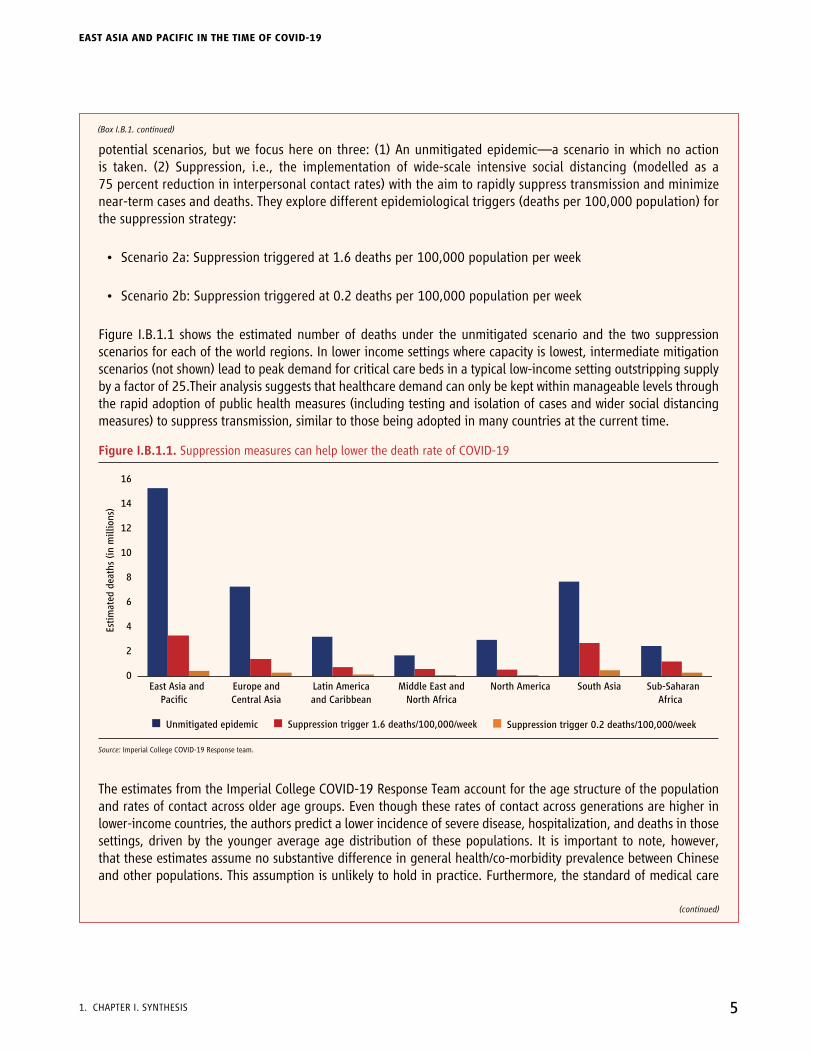
4. The “real” channels of impact
Apart from the effects of domestic social distancing restrictions, countries in the region are particularly exposed to events in the rest of the world through trade and tourism (Figure I.1.6). The largest immediate impact on economic activity has come from the measures countries have taken to prevent the spread of infection. But, the plunging global trade and travel is hurting countries. Many of the countries, like Vietnam and Cambodia, rely on imported inputs for exports though others, like Indonesia, are less integrated with GVCs (Figure I.1.7). Countries like Mongolia and Lao PDR rely heavily on commodity exports. Other countries in the region, especially those in the Pacific as well as Cambodia and Thailand, are dependent on tourism for export earnings.
Figure I.1.6. The virus has hit critical GVC nodes and countries’ fortunes have become increasingly intertwined
A. Seventeen countries with the highest COVID-19 cases b. Countries’ economic activity has become more synchronized are critical nodes in the global trade network since the mid-1990s
1981
0.6
0.5
0.4
0.3
0.2
0.1
0
1982
1983
1984
1985
1986
1987
1988
1989
1990
1991
1992
1993
1994
1995
1996
1997
1998
2012
1999
2000
2001
2002
2003
2004
2005
2006
2007
2008
2009
2010
2011
High income Low income Middle income
Source: WDR 2020; Comtrade database.
Figure I.1.7. Trade and tourism transmit external shocks to economies in the region
a. Manufacturing imports b. Commodity exports c. Tourism
Total manufacturing importsManufacturing imports from China
Perc
ent
of G
DP
0
25
50
75
Viet
nam
Sing
apor
eCa
mbo
dia
Mal
aysi
aTh
aila
nd Fiji
Phili
ppin
esM
ongo
liaKo
rea,
Rep
.La
o PD
RIn
done
sia
Japa
n
Commodity exports to ChinaTotal commodity exports
Perc
ent o
f GD
P
0
20
40
Mon
golia
Sing
apor
eM
alay
sia
Viet
nam
Lao
PDR
Thai
land Fiji
Indo
nesi
aH
ong
Kong
SAR
, Chi
naCa
mbo
dia
Kore
a, R
ep.
Phili
ppin
esJa
pan
0102030405060
Pal
au V
anuat
u F
iji
Sam
oa K
irib
ati
Ton
ga
Mic
rone
sia
Tuva
lu S
olom
on Is
land
s M
arsh
all
Isla
nds
Tim
or-L
este
Papu
a N
ew G
uine
a
Cam
bod
ia T
hai
land
Philip
pines
Mal
aysi
a L
ao P
DR
Mon
gol
ia C
hin
a V
ietn
am I
ndo
nes
ia M
yanm
ar
Estimated income from Chinese touristsEstimated income from non-Chinese tourists
Perc
ent
of G
DP
Sources: CEIC; World Development Indicators; World Travel and Tourism Council Data; World Integrated Trade Solutions.
13
EAST ASIA AND PACIFIC IN THE TIME OF COVID-19
1. CHAPTER I. SYNTHESIS
10158-EAP Economic Update_73177_newB.indd 1310158-EAP Economic Update_73177_newB.indd 13 4/1/20 2:23 PM4/1/20 2:23 PM

EAP countries are integrated into global value chains (Figure I.1.8). Some, like Cambodia and Vietnam, have high backward linkages, i.e., depend on imported inputs for their exports, which makes them highly susceptible to supply shocks, in addition to demand shocks. Others, like Myanmar and Mongolia, have high forward linkages, i.e., their exports enter the production for export of other countries, which makes them susceptible to demand shocks.
Figure I.1.8. Some EAP countries have stronger backward and others stronger forward links in GVCs
Perc
ent
0
10
20
30
40
50
60
70
80
HKG SGP
MYS KOR
PHL
NCL VNM
TWN
THA
IDN
BRN
JPN
CHN
MMRMNG
WSM VUT
AUS
LAO
PYF
MAC NZL PNG
KHM
FJI PRK
GVC backward linkages GVC forward linkages
Source: EORA.Note: Data are in millions of current US dollars. Backward linkages measure the direct and indirect foreign value added in a country’s export. Forward linkages measure how much of a country’s value added is embodied in other country’s exports, expressed as a share of the country’s exports. All the measures of GVC participation are computed using icio, a new Stata command for value-added trade and global value chain analysis (Belotti et al., 2020).
5. The financial channels of impact
The global spread of the virus has rattled financial markets around the world and is reverberating in the developing EAP economies. A first-order implication is an abrupt tightening of the region’s financing conditions, with capital flying to safe heavens and interest rate spreads increasing (Figure I.1.19). Uncertainty has triggered a dash for cash, causing a shortage of US dollars on international financial markets, putting pressure on domestic currencies and corporate refinancing. The tight interlinkages between sovereigns, banks, and the corporate sector in some developing EAP countries is giving rise to adverse feedback loops. These developments have negative effects on countries in the region, especially for those countries with high levels of debt, especially external debt, large financing needs, or heavy reliance on short-term funding.
14
EAST ASIA AND PACIFIC ECONOMIC UPDATE APRIL 2020
PART I. COVID-19: IMPACT AND RESPONSE
10158-EAP Economic Update_73177_newB.indd 1410158-EAP Economic Update_73177_newB.indd 14 4/1/20 2:23 PM4/1/20 2:23 PM

Figure I.1.9. Global developments are tightening financial conditions
a. Non-resident net purchases of equity and bonds b. Regions spreads (percent change Jan 2, 2020 versus March 27, 2020)
–1.5
–1.0
–0.5
0
0.5
1.0
3/14
/05
12/1
4/05
9/14
/06
6/14
/07
3/14
/08
12/1
4/08
9/14
/09
6/14
/10
3/14
/11
12/1
4/11
9/14
/12
6/14
/13
3/14
/14
12/1
4/14
9/14
/15
6/14
/16
3/14
/17
12/1
4/17
9/14
/18
6/14
/19
3/14
/20
USD
, bill
ion
Global financial crisis
Taper tantrum
China stock marketvolatility
Trade tensions
38.1
117.5
156.1
208.5
354.3
113.7
0
50
100
150
200
250
300
350
400
China Indonesia Malaysia Philippines Vietnam EM globaldiversified
Source: Bloomberg; Institute for International Finance; BIS; Haver Analytics.Note. Panel A. 28-days moving average. Includes China, Indonesia, Malaysia, the Philippines, Thailand, Vietnam. Global Financial Crisis: September 2008; Taper tantrum: May 2013; China stock market volatility: August 2015; Trade tensions: May 2019.
Some EAP countries have stronger financial conditions than others. In many EAP countries, initial conditions are better than at the beginning of past crises. Today most countries have greater exchange rate flexibility and more robust monetary, prudential, and fiscal policy frameworks (Table I.1.1). Past reforms and macro policies have also increased the buffers in the financial sector to absorb losses, although there are differences within and across countries (Table I.1.1). In large developing EAP economies, financial institutions are better capitalized than before previous periods of volatility, but liquidity is now lower (Figure I.1.10). Banking sectors in less financially developed countries such as Cambodia, Myanmar, and Mongolia, have higher levels of non-performing loans (NPLs).
Table I.1.1. Most countries in the EAP region have pursued sound macroeconomic policies
Period
Fiscal space Monetary space Reserves buffer
2019 2019 2018 March 2020 March 2020 2019 March 2020
Select indicators
General government gross debt, % of GDP
Fiscal balance, % of GDP
Domestic credit to private
sector, % of GDP
Key policy rate, in %
Headline inflation rate,
in %Inflation target,
in %
Reserves, months of imports
Cambodia 30.0 0.5 100.2 1.46 1.7 — 8.0
China 39.2 –5.8 207.5 4.05 5.2 3.0 16.7
Indonesia 28.0 –2.2 40.5 4.75 3.0 2.5–4.5 9.2
Lao PDR 59.9 –4.9 49.5 4.00 6.9 — 1.9
Malaysia 52.5 –3.4 136.4 2.50 1.6 — 6.0
Mongolia 68.3 1.4 56.3 10.0 6.4 8.0 7.8
Myanmar 41.2 –3.9 27.7 10.0 9.5 — 3.1
Philippines 35.7 –3.5 49.9 3.75 2.6 2.0–4.0 9.6
Thailand 42.4 –0.9 116.9 1.00 0.7 1.0–4.0 11.3
Vietnam 54.1 –4.0 133.3 4.00 5.4 4.0 3.1
Sources: Fiscal data come from country teams. Domestic credit data come from Kose A., et al., “Cross-Country Data of Fiscal Space,” World Bank, November 2019, IMF Article IV (Myanmar and Vietnam), Bank of Lao PDR (Lao PDR), and the National Bank of Cambodia (Cambodia). Monetary data come from World Bank country reports and various central banks’ websites. Foreign reserves data come from World Bank country reports, IMF Data mapper, IMF Article IV (Myanmar), and various central bank websites.
15
EAST ASIA AND PACIFIC IN THE TIME OF COVID-19
1. CHAPTER I. SyNTHESIS
10158-EAP Economic Update_73177_newB.indd 1510158-EAP Economic Update_73177_newB.indd 15 4/7/20 10:16 AM4/7/20 10:16 AM

Figure I.1.10. Financial institutions are better capitalized today than at the onset of previous crises, but liquidity may be a concern
a. Capital adequacy: Regulatory capital to risk-weighted assets (%) b. Liquidity: Liquid assets to total deposits
–15
–10
-5
0
5
10
15
20
25
CHN IDN MYS PHL THA
East Asian Financial Crisis end-1998 SARS Crisis end-2002
Global Financial crisis end-2007 COVID-19 Crisis 2020-latest available
0
10
20
30
40
50
60
70
CHN IDN MYS PHL THA VNM
East Asian Financial Crisis end-1997 SARS Crisis end-2002
Global Financial crisis end-2007 COVID-19 Crisis 2020-latest available
Source: World Bank FinStats 2020 Database. CHN stands for China; IDN for Indonesia; KOR for Republic of Korea; MyS for Malaysia; PHL for Philippines; SGP for Singapore; THA for Thailand; VNM for Vietnam. Where available, data is sourced one year previous the occurrence of a financial crisis episode. For capital adequacy (Panel A), data is available for year 1998 but not for year 1997.
However, the unprecedented nature and size of external shock raises serious concerns. Increased financial volatility can affect the region’s economies through capital (both equity and bond markets), credit, and foreign-exchange channels. In some countries, the resultant financial instability is likely to be amplified because of the rapid growth in private sector debt, dependence on domestic debt held by foreign investors, substantial debt denominated in foreign currencies, and sudden liquidity dry-ups. Developing EAP economies are vulnerable in different ways (Figure I.1.11), for example, through elevated domestic debt (China, Vietnam, Malaysia), private sector debt (China, Malaysia, Thailand), external debt (Lao PDR, Mongolia, Malaysia, Papua New Guinea, Cambodia); or heavy reliance on short-term debt (Malaysia and Thailand).
High uncertainty, devaluation of the domestic currency and low market liquidity could also represent a source of vulnerability. Capital outflows raise the cost of funding in domestic debt and equity markets, in addition of creating currency depreciation pressures. In government bond markets, higher interest costs on debt refinancing and new issuance, as well as costs of servicing foreign denominated debt (for countries experiencing significant currency depreciation), threaten to increase fiscal pressures on sovereigns. In corporate debt and equity markets, rising interest rates and declines in share prices could similarly increase debt refinancing pressures and create difficulties for firms in raising new capital. Finally, in credit markets, lending institutions relying more heavily on foreign deposits or foreign wholesale funding markets could face increasing funding pressures as a result of capital outflows from the region. Amidst the deterioration in domestic economic activity and corporate profitability, borrower’s debt repayment capacity could be impaired and NPLs on banks’ portfolios are also likely to creep higher.
16
EAST ASIA AND PACIFIC ECONOMIC UPDATE APRIL 2020
PART I. COVID-19: IMPACT AND RESPONSE
10158-EAP Economic Update_73177_newB.indd 1610158-EAP Economic Update_73177_newB.indd 16 4/7/20 10:16 AM4/7/20 10:16 AM

Figure I.1.11. High indebtedness, foreign holdings and foreign denomination of the debt could be sources of concern for some countries in the region
a. Total debt b. Sectoral debt, selected economies
–50
0
50
100
150
200
250
300
MN
G
CHN
MYS
VNM
THA
KHM
PHL
IDN
MM
R
PNG
WSM VU
T
FJI
TON
SLB
TLS
East Asia Pacific Islands
Domestic debt 2018 External debt 2018Total debt 2007 Total debt 1997
Perc
ent
of G
DP
0
50
100
150
200
250
300
350
2007
2019
2007
2019
2007
2019
2007
2019
2007
2019
China Malaysia Thailand Philippines Indonesia
Nonfinancial corporate debt Financial corporate debtPublic debt Household debt
Perc
ent
fo G
DP
c. Financial sector FX denominated debt, selected economies d. Public, financial and nonfinancial corporates loan maturity profile
0
10
20
30
40
50
60
70
China Indonesia Malaysia Thailand
Perc
ent
FX debt EM average (percent of GDP)FX debt EM average (percent of total debt)
FX debt as percent of GDPFX debt as percent of total debt
0
10
20
30
40
50
60
70
China Indonesia Malaysia Philippines Thailand
Perc
ent
of t
otal
EM total <1-year maturityEM total <2-year maturity
<1-year maturity<2-year maturity
Source: Institute for International Finance, IMF; World Bank. Notes: Panel C. FX refers to foreign currency. Panel D. EM refers to emerging markets.
6. Growth projections
The pandemic is profoundly affecting the EAP economies, but the depth and duration of the shock are unusually uncertain. Many countries have stepped up their fiscal and monetary policy measures and several economies have already approached their development partners for assistance to mitigate the impact of the pandemic. The net impact of the shock on growth outcomes remain highly uncertain and will depend on the impact of the pandemic on national economies, cross-border effects, and the effectiveness of policy response.
17
EAST ASIA AND PACIFIC IN THE TIME OF COVID-19
1. CHAPTER I. SYNTHESIS
10158-EAP Economic Update_73177_newB.indd 1710158-EAP Economic Update_73177_newB.indd 17 4/1/20 2:23 PM4/1/20 2:23 PM

As noted above, each economy is struggling with the disease, as well as the demand and supply effects of containment efforts. Most economies are exceptionally exposed to the potential contraction in demand in the rest of the world, as well as to disruptions in the global and regional value chains into which they are integrated. Governments face a formidable challenge: to contain the disease; to treat its victims; to provide immediate economic relief to vulnerable firms and households; and then to initiate and sustain recovery. If the response is too little or too late, there is a risk of durable damage. Risks are tilted to the downside and country-specific vulnerabilities could amplify the adverse impact of the pandemic. Reflecting the considerable uncertainty along all these dimensions, we present two scenarios.
The baseline scenario is a severe slowdown followed by a strong recovery. A sharp contraction is followed by a sustained recovery, lowering 2020 growth to 2.1 percent, from 5.8 percent in 2019. In this scenario, regional growth stabilizes around its trend level by late 2021. This scenario assumes that the containment of the pandemic allows a sustained recovery of activity, initially in China—the epicenter of the outbreak—followed by the rest of the world. This scenario also assumes that: the sizable fiscal and monetary policy support measures implemented by major economies, including China, will prevent any lasting impact of the pandemic on global activity; and, as global financial conditions gradually stabilize, capital flows to the region will resume lowering pressure on regional asset prices.
The lower case scenario is a deeper contraction followed by a sluggish recovery. Under this scenario, we assume that the pandemic lasts longer and has more severe effects than assumed under the base case scenario. It’s economic impact on global economy is also more durable and severe than expected under the baseline scenario. Global trade remains in recession for an extended period; value chain disruptions persist, as businesses reevaluate the costs of sudden interruptions, disruptions, and the benefits of lower production costs; the erosion of confidence and the reversal of capital flows is longer-lasting; and the policy response is less effective. All of these factors could push 2020 growth to well below the baseline scenario.
Continued financial difficulties and negative feedback loops are embedded in the lower case scenario. Prolonged financial market stress could exacerbate existing balance sheet weaknesses in the highly leveraged banking, corporate, and household sectors, hindering investment and consumption growth. These problems could be bigger in countries where corporate debt levels are high or have risen rapidly. The slowdown in activity across the region will reduce the ability of some highly leveraged governments and large clusters of businesses to service their debt, shrinking fiscal space and making it more difficult to finance public investment projects in the medium-term. The number of bankruptcies in the region could increase rapidly due to the broad-based and sharp global economic slowdown, with small and medium-sized enterprises (SMEs) particularly vulnerable. In the extreme case, a significant deterioration in the quality of loan portfolios and assets of the major commercial banks and other financial institutions, could trigger a full-blown financial crisis unless mitigated by effective and internationally coordinated policy measures.
In both scenarios, the growth outlook for 2020 is expected to sharply deteriorated for all the economies in the region (Table I.1.2; Part III for more detailed discussion of country specific projections). In the baseline scenario, growth in the developing EAP region is projected to slow from an estimated 5.8 percent in 2019 to 2.1 percent in 2020. In the lower case scenario, output will contract by –0.5 percent. Growth in China—the epicenter of the outbreak—is projected to decline to 2.3 percent in 2020 in the baseline scenario from 6.1 percent in 2019, whereas in the lower case scenario it could be as low as 0.1 percent. Growth in EAP excluding China is projected to slow from 4.8 percent in 2019 to 1.3 percent in 2020 in the baseline scenario and plummet to –2.8 percent in the lower case scenario (Figure I.1.12).
18
EAST ASIA AND PACIFIC ECONOMIC UPDATE APRIL 2020
PART I. COVID-19: IMPACT AND RESPONSE
10158-EAP Economic Update_73177_newB.indd 1810158-EAP Economic Update_73177_newB.indd 18 4/1/20 2:23 PM4/1/20 2:23 PM

Figure I.1.12.Growth is forecast to decline sharply in the region
Perc
ent
2019 2020f baseline* 2020f lower case*
5.87.1 7.0 6.3 6.1 5.9 5.6 5.0 4.8 4.8 4.3 3.4
2.42.1 2.5
4.93.0 2.3
3.0
0.22.1
3.62.4
–0.1
–2.8 –3.0
–0.5
1.0 1.5 2.00.1
–0.5 –0.9
–3.5
2.21.0
–4.6 –4.0–5.0
–12
–8
4
0
4
8
Deve
lopi
ng E
AP
Cam
bodi
a
Viet
nam
Myan
mar
*
Chin
a
Philip
pine
s
PNG
Indo
nesia
Lao
PDR
Mong
olia
Malay
sia
Tim
or-L
este
Thail
and
Source: World Bank. World Bank staff calculations.Notes: EAP: East Asia and Pacific. Bars show actual or estimated growth for 2019 and forecasted growth for 2020 under two scenarios. *Myanmar growth rates refer to the pre- and post-pandemic period for fiscal year from October to September. Baseline refers to a scenario of severe growth slowdown followed by a strong recovery. Lower case refers to a scenario of a deeper contraction followed by a sluggish recovery. Weighted averages are calculated for developing EAP.
Growth in the region is projected to decline significantly in all scenarios. Malaysia, Thailand, and Timor-Leste, as well as some of the Pacific Islands, are likely to see varying degrees of contraction in all scenarios. The economies of Indonesia, Papua New Guinea, and the Philippines are expected to shrink in the lower case scenario, but to see some positive growth in the baseline, albeit at a much lower rate than in 2019. Vietnam, Cambodia, Lao PDR, Mongolia, and Myanmar, are among the few countries which are projected to grow in all scenarios, but at significantly lower levels than in 2019.
Contractions in both domestic and external demand are expected to lower growth prospects. Private consumption which had sustained growth in many of these countries in 2019, even as investment was sluggish, will now be hurt by both the preventive measures and declining incomes. Government expenditure, which had hitherto been restrained, is expected to expand and public investment may partially offset the likely further contraction in private investment. For many countries, the biggest shock will be the drop in external demand which will translate into lower exports, decline in tourism revenues, and low commodity revenues.
Shrinking external demand will affect countries through multiple channels. Vietnam, Cambodia, Malaysia, and Thailand are likely to be affected by the fall in external demand for their manufacturing exports and the disruption in the supply chains into which they are integrated. In these countries, manufacturing exports and imports each constitute between 30 and 70 percent of GDP. Decline in tourism revenues will affect most Cambodia, Lao PDR, Malaysia, Pacific Islands, the Philippines, and Thailand, in each of which tourism revenues constitute more than 10 percent of GDP. The plunge in commodity prices will affect most Mongolia, in which commodity exports account for more than a third of GDP, but also Indonesia, Lao PDR, Malaysia, Myanmar, Papua New Guinea, Thailand, Timor-Leste, and Vietnam. Countries like the Philippines and many Pacific Islands will also be affected by a decline in remittances.
The Pacific Island countries have not seen many COVID-19 cases so far but will nevertheless suffer economic consequences. Many Pacific Islands countries are highly reliant on donor financing and rents from a few key sources,
19
EAST ASIA AND PACIFIC IN THE TIME OF COVID-19
1. ChAPTER I. SyNThESIS
10158-EAP Economic Update_73177_newB.indd 1910158-EAP Economic Update_73177_newB.indd 19 4/2/20 2:34 PM4/2/20 2:34 PM

like tourism, fishing rights, and natural resources. Solomon Islands are highly dependent on commodity exports. Fiji, Kiribati, Palau, Samoa, and Vanuatu, are the most exposed to tourism. COVID-19 will hurt commodity and tourism revenues, but also disrupt imports of raw materials and inflows of workers for infrastructure projects in many small island economies. Output contraction is expected to be particularly severe in Samoa and Vanuatu, which have been affected by natural disasters. Countries like Samoa and Tonga are also vulnerable to declines in remittances.
For many countries, the likely financial shocks will significantly exacerbate the economic pain. The most significant effects on both the current and future performance of these countries are likely to originate in financial markets, given the likely magnitude of the financial shock and their existing vulnerabilities. As noted above, developing EAP economies are vulnerable in different ways. In China, Vietnam, Malaysia, and Thailand, for example, through elevated domestic debt; in Cambodia, Lao PDR, Malaysia, Mongolia, and Papua New Guinea through external debt; and in Malaysia and Thailand through heavy reliance on short-term debt.
The projections beyond 2020 are influenced by several considerations. One is how far country growth in 2020 has declined relative to the trend in its potential growth rate. Barring new unexpected shocks and durable financial market stress, the deeper the slowdown, the more rapid the recovery can be expected. When recovery is likely to begin, will depend on how soon the pandemic can be contained within countries and in their major trading partners. In so far as the current contraction is only because people are not able to work and spend, early containment would be conducive to a rapid resumption in domestic economic activity and a revival of external demand, though resumption of tourism may take longer. One reason for current pain to become a future handicap is the likelihood of the worsening of balance sheets of households, banks and firms, which could affect the potential trend growth. Much therefore depends on how far policy measures are able to prevent a temporary shock from becoming a permanent drag on economic performance.
Table I.1.2. Developing East Asia and Pacific: GDP growth projections
2017 2018 2019a
Forecast
BaselinedLower cased Baselined
Lower cased
2020 2020 2021 2021
Developing EAPa 6.5 6.3 5.8 2.1 –0.5 7.3 5.3China 6.8 6.6 6.1 2.3 0.1 7.7 5.5
Developing EAP excl. Chinaa 5.4 5.2 4.7 1.3 –2.8 5.7 4.4Developing ASEANa 5.4 5.3 4.7 1.3 –2.8 5.7 4.4
Indonesia 5.1 5.2 5.0 2.1 –3.5 5.6 5.2Malaysia 5.7 4.7 4.3 –0.1 –4.6 6.4 4.1Philippines 6.7 6.2 5.9 3.0 –0.5 6.2 4.1Thailand 4.0 4.1 2.4 –3.0 –5.0 4.0 3.0Vietnam 6.8 7.1 7.0 4.9 1.5 7.5 4.0Cambodia 7.0 7.5 7.1 2.5 1.0 5.9 3.9Lao PDR 6.9 6.3 4.8 3.6 2.2 5.8 3.7Myanmarc 6.2 6.8 6.3 3.0 2.0 6.0 4.0Mongolia 5.4 6.9 4.8 2.4 1.0 5.1 2.9Fiji 5.4 3.5 1.0 –4.3 –10.0 1.9 1.5Papua New Guinea 3.5 –0.8 5.6 0.2 –0.9 3.3 2.2Solomon Islands 3.7 3.9 2.7 –6.7 –12.3 –0.3 –6.3Timor-Lesteb –3.8 –0.8 3.4 –2.8 –4.0 3.9 3.5
Source: World Bank staff estimates.Notes: a. Estimate. b. Nonoil GDP. c. Myanmar growth rates refer to the pre- and post-pandemic period for fiscal year from October to September. d. Baseline refers to a scenario of severe growth slowdown followed by a strong recovery. Lower case refers to a scenario of a deeper contraction followed by a sluggish recovery.
20
EAST ASIA AND PACIFIC ECONOMIC UPDATE APRIL 2020
PART I. COVID-19: IMPACT AND RESPONSE
10158-EAP Economic Update_73177_newB.indd 2010158-EAP Economic Update_73177_newB.indd 20 4/1/20 2:23 PM4/1/20 2:23 PM

7. Poverty impact
The COVID-19 shock will also have a serious impact on poverty. People will suffer both directly through illness and indirectly through lost incomes. Under the baseline growth scenarios and using a poverty line of US$5.50/day, it is estimated that nearly 24 million fewer people will escape poverty across developing EAP in 2020 than would have in the absence of the outbreak (Figure I.1.13). Under the lower case scenario, poverty is estimated to increase by about 11 million people. The magnitudes are significant; prior to the onset of the outbreak, nearly 35 million people were projected to escape poverty in the region in 2020, including over 25 million in China alone.
Figure I.1.13. COVID-19 will severely affect East Asian and Pacific countries’ ability to reduce poverty
Number of poor expected to be lifted out of poverty in 2020 under alternative scenarios
a. China b. Developing EAP excluding China
–25.1
Pre-COVID-19scenario
–11.0
–2.1
–40
–30
–20
–10
0
Chan
ge in
the
num
ber
of p
oor
in m
illio
n (U
S$5.
50/d
ay)
Baseline Lower case
2020 forecast
–9.7
Pre-COVID-19scenario
0.1
13.4
–20
–10
0
10
20
Chan
ge in
the
num
ber
of p
oor
in m
illio
n (U
S$5.
50/d
ay)
Baseline Lower case
2020 forecast
Source: World Bank East Asia and Pacific Team for Statistical Development.Notes: Poverty rate measured using a poverty threshold of US$5.50 per person per day (2011 PPP).
Households linked to economic sectors affected by COVID-19 will face a substantially elevated risk of falling into poverty, at least in the short-run. In China and other countries, the risk of falling into poverty is particularly high among informal sector and self-employed workers who lack paid sick leave or other forms of social protection, as well as migrant workers who may have more precarious employment status and may have been unable to return to their place of work due to lockdown measures. Across the region, those linked to sectors experiencing strong demand shocks, such as tourism, or value chain disruptions, as in manufacturing, will also face an increased risk of falling into poverty (Figure I.1.14). Simulations suggest, for example, that if households in the tourist and retail sectors in China experience a 50 percent income loss for 2 quarters, their poverty rate would increase by 12 percentage points. In Tonga, where one-third of households rely on earnings from tourism, poverty could reach two-thirds of the population living in households linked to that sector, if faced with an income loss of 50 percent over a 6-month period—up from 49 percent prior to the outbreak. A similar income loss scenario among those linked to the garment industry in Vietnam would double poverty in the households linked to that sector from 14 percent to 28 percent.
21
EAST ASIA AND PACIFIC IN THE TIME OF COVID-19
1. CHAPTER I. SYNTHESIS
10158-EAP Economic Update_73177_newB.indd 2110158-EAP Economic Update_73177_newB.indd 21 4/1/20 2:23 PM4/1/20 2:23 PM

Figure I.1.14. Households linked to sectors most affected by the COVID-19 shock face an elevated high risk of falling into poverty
Estimated poverty impacts of income shocks in selected sectors in Vietnam, China, and Tonga
0
10
20
50
40
30
80
70
60Po
vert
y ra
te (
%)
Vietnam
Tour
ism
, foo
d, a
ccom
mod
atio
n, t
rans
port
Tour
ism
, foo
d, a
nd a
ccom
mod
atio
n
Tran
spor
t
Rest
of e
cono
my
Man
ufac
turi
ng
Food
and
acc
omm
odat
ion,
tour
ism
, and
tran
spor
t
Who
lesa
le a
nd r
etai
l
Who
lesa
le a
nd r
etai
l
Man
ufac
turi
ng (e
xclu
ding
text
iles)
Text
ile, c
ostu
me,
leat
her
Baseline poverty rate 50% income loss—1 quarter 50% income loss—2 quarters
TongaChina
Source: Projections based on Vietnam Living Standard Survey, China Household Income Project, and 2015/16 Tonga Household Income and Expenditure Survey data. For China, total household incomes and consumption levels are extrapolated to 2018, based on the reported growth rates of per capital household disposable income and per capita household expenditure between 2013 and 2018, as reported in 2019 China Statistical Yearbook (National Bureau of Statistics). Note: Estimated poverty impacts of income shocks in selected sectors in Tonga, Vietnam and China poverty rates measured using a poverty threshold of US$5.50 per person per day (2011 PPP).
8. Policy actions
Given the unprecedented nature of the economic shock to each country, and the fact that it is also affecting all other countries in the region and beyond, an exceptional policy response is needed. The need is for bold action at the national level, coordination across the region and globally, as well as high levels of external assistance. For its part, the World Bank Group has already rolled out a $14 billion fast-track package to strengthen the COVID-19 response in developing countries and shorten the time to recovery. The immediate response includes financing, policy advice, and technical assistance to help countries cope with the health and economic impacts of the pandemic. As countries need broader support, the World Bank Group is prepared to deploy up to $160 billion over 15 months to protect the poor and vulnerable, support businesses, and bolster economic recovery.
At the national level, policymakers rightly see the flattening of the pandemic curve as the first objective. This objective is to be attained by containment policies and up to a specific extent determined by, say, hospital capacity (Figure I.1.15). The goal is to slow the acceleration of the number of cases to save lives by placing less of a strain on the health system and possibly reduce the number of overall cases. It is recognized that flattening the pandemic curve will
22
EAST ASIA AND PACIFIC ECONOMIC UPDATE APRIL 2020
PART I. COVID-19: IMPACT AND RESPONSE
10158-EAP Economic Update_73177_newB.indd 2210158-EAP Economic Update_73177_newB.indd 22 4/1/20 2:23 PM4/1/20 2:23 PM

have a significant economic cost and could lead to a recession. Therefore, policymakers are in parallel using fiscal and monetary policy to meet the second objective of flattening the macroeconomic recession curve (Figure I.1.16).
There are several issues with this compartmentalized approach. First, there is no clearly defined limit to the flattening: even hospital capacity is endogenous, as China has demonstrated by building new hospitals in a couple of weeks. Therefore, in any case, other (economic) considerations are limiting how far containment goes. Second, there are multiple instruments of containment, which vary in effectiveness and economic cost. Some like lockdowns and travel bans create costs by affecting economic activity; others e.g. health intervention such as testing, and fiscal interventions such as sick-pay to encourage people to stay home, involve direct costs. Third, a dichotomous approach does not exploit the benefits of using combinations of both preventive and macroeconomic policies to achieve even health goals. For example, it is conceivable that any desired level of containment may more efficiently be achieved by combining social distancing policies with fiscal instruments like subsidies for testing and contact tracing.
In other words, since the infection curve and the recession curve are linked, the flattening of the first steepens the second. And the policy instruments are not separate, most measures have both health and economic implications. Therefore, governments should frame the issue as a broader, integrated, and intertemporal challenge: to maximize social welfare, which depends on health and income; and using a combination of containment policies (restrictions, healthcare/testing) and macroeconomic policies (fiscal, monetary, financial).
Ì Public health considerations
Available evidence shows that the preventive response of most countries in the region has been driven largely by public health considerations. The countries more exposed to Chinese tourists have tended to take more stringent measures, such as the prohibition of visa restrictions on citizens from Hubei or China. Two exceptions to the relative unimportance of economic considerations are Cambodia and Thailand. Both these countries are highly dependent on Chinese tourists, the former is also politically close to China while the latter has a relatively strong health system. The more targeted and less restrictive measures like screening and quarantines of visitors have been used primarily by countries less exposed to Chinese tourists (Figure I.1.17).
Figure I.1.15. Flattening the pandemic curve through containment policies is the first objective
With public health measures
Health care system capacity
Without public health measures
Num
ber
of c
ases
Time since first case
Source: Gourinchas (2020).
Figure I.1.16. Flattening the recession curve through macroeconomic policies is the second objective
With accompanying macro measures
Without accompanying macro measures
Seve
rity
of
the
rece
ssio
n
Time since first case
Source: Gourinchas (2020).
23
EAST ASIA AND PACIFIC IN THE TIME OF COVID-19
1. CHAPTER I. SYNTHESIS
10158-EAP Economic Update_73177_newB.indd 2310158-EAP Economic Update_73177_newB.indd 23 4/1/20 2:23 PM4/1/20 2:23 PM

Figure I.1.17. Public health considerations
a. Flight and visa restrictions b. Screening restrictions
Rest
rict
ion
resp
onse
(flig
ht a
nd v
isa
rest
rict
ions
)
Brunei
Cambodia
Indonesia
Japan
Kiribati
Laos
Malaysia
Marshall Islands
Micronesia
Mongolia
MyanmarPapua New Guinea
Philippines
Singapore
Solomon IslandsKorea, Rep.
Thailand
Timor-Leste
TongaTuvalu
VanuatuVietnam
–0.1
0.1
0.3
0.5
0.7
0.9
Share of chinese visitors per country as of 2017, %
–1 9 19 29 39 49
Scre
enin
g re
spon
se (
quar
anti
ne a
ndai
rpor
t sc
reen
ings
res
tric
tion
s)
Share of Chinese visitors per country as of 2017, %
Brunei
CambodiaFiji
Indonesia
JapanKiribati
Laos
MalaysiaMarshall Islands
Micronesia
Mongolia
Myanmar
Palau
Papua New Guinea
Philippines
Singapore
Solomon Islands Korea, Rep.Thailand
Timor-LesteTongaTuvalu
Vanuatu
Vietnam
–0.1
0.1
0.3
0.5
0.7
0.9
1.1
–1 9 19 29 39 49
Source: Restriction responses collected by World Bank staff from national government statements. Visitor data from Lopez-Cordova (2020).
In the beginning stages of an outbreak of an emergent illness, there is little guidance as to the course of transmission with (and without) efforts to control spread. When faced with such trade-offs between unknown risk and the uncertain impact of policy, a national government’s tolerance for risk and uncertainty as well as the state of health-preparedness are the factors that determine a course of action. However, when within-country transmission becomes the driver of infection, the emphasis can shift from international to domestic containment, whereupon countries could consider non-pharmaceutical interventions (NPIs) such as hygienic practice promotion, school and event closures, and domestic travel restrictions. Such restrictions imposed on Wuhan and other cities in Hubei province by the Chinese government may have reduced the virus attack rate—i.e., the number of people infected by each infected person—from 3.86 to 0.32 over a 37-day period (Box I.B.4).
Box I.B.4. Response to COVID-19 in China
An initial cluster of patients first emerged in Wuhan in mid-December 2019. Over the following month, infections spread rapidly and by late-January 2020 the number of confirmed cases had increased to 571 with 17 reported deaths. Faced with a rapidly escalating outbreak, the Chinese authorities began to put in place severe containment measures including lockdowns of Wuhan city, Hubei province, and several other provinces and counties (Figure I.B.4.1). Interprovincial travel restrictions and cancellation of air and rail traffic limited passenger transportation during traditionally busy Chinese New Year holidays. This was followed by school and factory closures across all provinces as well as social distancing and quarantine requirements. The authorities also stepped up public health support, including the provision of free treatment and testing across China.
(continued)
24
EAST ASIA AND PACIFIC ECONOMIC UPDATE APRIL 2020
PART I. COVID-19: IMPACT AND RESPONSE
10158-EAP Economic Update_73177_newB.indd 2410158-EAP Economic Update_73177_newB.indd 24 4/1/20 2:23 PM4/1/20 2:23 PM

Box Figure I.B.4.1. Infection curve and policy measures
60,000
Active confirmed COVID-19 cases
China reportscases to WHO
Lockdown ofWuhan city
Lockdown ofHubei province
Extension of ChineseNew Year and closure
of nonessentialfactories and schools
Travel restrictions oncross-provincial publictransport
Removal ofmandatory factoryclosures outside ofHubei
Provinces outside Hubei assignrisk level to each country. Lowrisk regions are permitted tofully resume production andremove traffic restriction.
Additional RMB 500 bnrefinancing for creditsupport for agriculture andSMEs
All 31 mainlandprovinces launchedhighest emergencyresponse
PBOC RMB 300 bnrefinancing facility PBOC cut reserve requirements
by 50 to 100 bps for banks, injecting 550 bn yuan long-term liquidity
CDB issued first epidemic bond of 13.5 billion yuan
Increase in local governmentbond quota by RMB 858 bn
Additional 500 billionRMB (0.5% of GDP)refinancing for creditsupport to SME
25 out of 31provinces loweremergency level
50,000
40,000
30,000
20,000
10,000
12/1 12/8 12/15 12/22 12/29 1/5 1/12 1/19 1/26 2/2 2/9 2/16 2/23 3/1 3/8 3/150
Mainland China Hubei province
Despite these measures, the outbreak intensified in Wuhan and Hubei province where ultimately thousands were infected, and the number of active cases peaked at over 50,000 on February 19, 2020. The steeper epidemic curve and the larger number of cases in Hubei were associated with a reported case mortality rate that was almost four times higher than in the rest of China, despite efforts to rapidly increase hospital capacity. Outside of Hubei measures were more effective in slowing the epidemic and active cases peaked much earlier on February 2, 2020 and at a substantially lower level of 9,141 cases. Starting in mid-February as the number of cases subsided the authorities gradually rolled back restrictions allowing economic activity to resume.
The containment efforts resulted in severe disruptions to economic activity, and authorities adopted policies to mitigate the economic impact of the outbreak. The initial policy response aimed to bolster market confidence, relieve near-term cash flow problems and mitigate more permanent economic damage in the form of bankruptcy, unemployment, and rising NPLs. As the epidemic subsides, and economic activity resumes policy focus is expected to shift toward recovery efforts and will likely entail additional stimulus measures.
• Liquidity support. PBOC provided net liquidity of 1,289 billion RMB (1.3 of GDP) in the first two months of 2020, 692 billion RMB (0.7 percent of GDP) higher than during the same period last year.
• Refinancing facility. In addition, an 800 billion RMB (0.8 percent of GDP) refinancing facility was established to support key manufacturers of medical supplies and daily necessities and bank credit to SMEs.
(Box I.B.4. continued)
(continued)
25
EAST ASIA AND PACIFIC IN THE TIME OF COVID-19
1. CHAPTER I. SYNTHESIS
10158-EAP Economic Update_73177_newB.indd 2510158-EAP Economic Update_73177_newB.indd 25 4/1/20 2:23 PM4/1/20 2:23 PM

• Regulatory forbearance. The banking sector regulator adopted regulatory forbearance to encourage banks to increase lending to most affected enterprises and make flexible repayment arrangements and increase its tolerance for non-performing loans (NPLs) during the COVID-19 outbreak.
• Fiscal support for epidemic control. Ministry of Finance (MOF) has allocated a cumulative 99.9 billion RMB (or 0.1 percent of GDP) for epidemic prevention and control.
• Fiscal support to ease SME liquidity constraints. Targeted fiscal measures were rolled out to ease near-term cash flow problems in the enterprise sector including tax breaks and subsidies and deferrals in social and healthcare insurance payments to affected industries and enterprises that are estimated at about 1.2 percent of GDP.
Public investment stimulus. Indicating more traditional fiscal stimulus, the government also authorized an additional 1.3 trillion RMB (or 1.3 percent of GDP) for special local government bond issuance for the first quarter, 0.6 percent GDP higher than 2019Q1. Planned areas for public investment include medical equipment and 5G infrastructure
(Box I.B.4. continued)
Box I.B.5. Investing in health infrastructure for containment
Apart from rapidly enhancing the capacity to treat COVID-19 patients, governments also need to invest in the health infrastructure for containment. Some countries, like Singapore, the Republic of Korea, and Hong Kong, SAR, China had already learned from the 2003 SARS epidemic and the MERS epidemic in 2015, and created infectious disease surveillance and response capacity (see, e.g., Dawoon and Hoon, 2020).1 These countries were prepared to use testing, contact tracing, and isolating the confirmed or suspected cases. The Republic of Korea, for example, can conduct 18,000 tests in a day and is exporting testing kits to other countries. While it is too early to be sure, these countries were able to lower the transmission rate and contain the virus, without necessarily having to resort to the more restrictive social distancing measures. The Korean government has largely avoided restricting the movement of people, and international borders have remained relatively open to travelers from affected countries.
When confronted with a large outbreak, countries with limited capacity to implement such moderate containment measures at a large scale, have needed to take drastic containment measures to suppress the virus and to avoid overwhelming the health system (Figure I.B.5.1). It will be hard to sustain these economically costly measures for the likely duration and the possible recurrence of the pandemic. But countries should use the time they have bought with restrictive measures to invest in the capacity to contain through testing, contact tracing, and isolating the confirmed or suspected cases. These steps should, of course, complement efforts to increase the
1 https://blogs.worldbank.org/eastasiapacific/koreas-response-covid-19-early-lessons-tackling-pandemic
(continued)
26
EAST ASIA AND PACIFIC ECONOMIC UPDATE APRIL 2020
PART I. COVID-19: IMPACT AND RESPONSE
10158-EAP Economic Update_73177_newB.indd 2610158-EAP Economic Update_73177_newB.indd 26 4/1/20 2:23 PM4/1/20 2:23 PM

capacity to treat through enhancing hospital capacity (e.g., the number of ICU beds), training health personnel and increasing production of necessary medical supplies (e.g., ventilators, masks).
Preparing for measured containment through testing, tracking, etc. is especially important for countries confronted with their first reported cases, when the task is still manageable and can make the difference between a localized outbreak and a generalized epidemic. With this perspective in mind, countries should pass legislation assigning responsibilities throughout the government on prevention and containment, on-the-ground response, and treatment and quarantine, for example through the creation or upgrading of an institution such as a Center
(Box I.B.5. continued)
(continued)
Figure I.B.5.1. COVID-19 and containment preparedness
COVID-19
Country has strong health infrastructure for containment
Country has weak health infrastructure forcontainment and outbreak is already large
Immediate course of action
Apply mitigation measures
– Educate population on NPIs
– Intensive testing
– Complementary detection
– Contact tracing
– Isolation of suspect cases
– Disinfection (transport, streets)
– Isolating elderly and at-most-risk of severe disease
– Health screening at airports
– Quarantines for suspect visitors
– Targeted economic schemes, such as sick pay
Immediate course of action
Follow up steps (or precautionary steps if COVID-19 hasnot arrived)
In addition to enhancing the capacity to treat (health staff,hospital beds, ICU, ventilators), also invest in healthinfrastructure for containment.
Apply strong suppression measures
– Quarantine of high-risk neighborhoods
– Stopping non-essential travel
– Quarantine for returning travelers
– Closing borders
– Closing schools and universities
– Pass legislation assigning clear responsibilities
– Create or upgrade center for disease control and prevention
– Promote hospital infection control and prevention
– Create centralized alert and disaster response system down to local level
– Prepare for transparent and efficient public messaging
– Increase testing capacity
– Strengthen tracing and isolation capacity
– Banning all social gatherings
– Closure of non-essential businesses
– Reinforce surveillance system
Source: World Bank staff elaboration.
27
EAST ASIA AND PACIFIC IN THE TIME OF COVID-19
1. CHAPTER I. SYNTHESIS
10158-EAP Economic Update_73177_newB.indd 2710158-EAP Economic Update_73177_newB.indd 27 4/1/20 2:23 PM4/1/20 2:23 PM

Ì Investing in preparedness
Moving ahead, it would be desirable for governments to consider the design of longer-term preventive policies. At any point in time, preventive action is based on levels of preparedness of the health system and the vulnerability of the population. Some countries in the region such as Thailand are relatively well prepared whereas others such as the Pacific Islands have weak health systems. Similarly, some countries because of aging, urbanization, and density are relatively more susceptible to both the spread and consequences of the disease. The more that governments invest in preparedness today, the more they will be able to rely on targeted healthcare measures like testing and tracking than on drastic restrictions that disrupt economic activity (Figure I.1.18).
It is important that efforts to design and strengthen longer-term preventive policies take into account the critical linkages between animal health, food safety, and human health—an approach that is coming to be known as the “One Health” approach. Indeed, the COVID-19 has reinforced the salience of taking a cross-cutting approach to addressing the risks associated with emerging infectious diseases. Over the last twenty years, China has witnessed the emergence of SARS, HPAI (H5N1 and H7N9), and the current COVID-19 outbreak. Without concerted efforts to address the root causes, China, its neighbors, and the global community will face a continued risk of zoonotic and microbial disease outbreaks.
The One Health approach aims to minimize the local and global impact of epidemics and pandemics through a holistic food systems lens, integrating food and nutrition security dimensions. This approach requires collaborative and coordinated efforts between human health, animal health, wildlife health, and food safety regulators. The coordination is meant to
Figure I.1.18. The “optimal” preventive response would be based on preparedness and vulnerability
Pand
emic
pre
pare
dnes
s sc
ore
321
Vulnerability PCA index (smoking, urban, density, +65)
0–1–2
BruneiCambodia
China
Fiji
Indonesia
Japan
Kiribati
Laos
Malaysia
Marshall Islands
Micronesia
Mongolia
Myanmar
Nauru
Palau
Papua New Guinea
Philippines
Singapore
Solomon Islands
Korea, Rep.
Thailand
Timor-LesteTonga TuvaluVanuatu
Vietnam
0
10
20
30
40
50
60
70
80
Source: Pandemic preparedness score constructed from a subset of indicators from the Global Health Security Index, https://www.ghsindex.org/. Vulnerability index constructed by principal components analysis with data from World Development Indicators, United Nations Population Division, and WHO Global Health Observatory.
for Disease Control and Prevention. All countries should invest in strong surveillance systems at the local level focused on detecting any resurgence of the COVID-19 virus in the coming months or of other epidemic outbreaks in the future. Countries should prepare an alert and disaster response system that centrally coordinates with provincial and municipal governments and specialized hospitals. Transparency and communication are also key to allay fear and prevent panic. Governments should be prepared to implement a massive public information campaign on personal hygiene and social distancing, through regular press briefings, frequently updated online information, and targeted text messages. Hospitals should also strengthen their capacity for infection prevention and control. These countries should also invest in testing and tracking capacity, in understanding better the disease and its epidemiology in the country, and preparing to deploy potential treatments and vaccines as soon as they become available.
The sooner such investments are made, the sooner countries will be able to contain the disease through measured interventions and phase out the onerous social distancing measures.
(Box I.B.5. continued)
28
EAST ASIA AND PACIFIC ECONOMIC UPDATE APRIL 2020
PART I. COVID-19: IMPACT AND RESPONSE
10158-EAP Economic Update_73177_newB.indd 2810158-EAP Economic Update_73177_newB.indd 28 4/1/20 2:23 PM4/1/20 2:23 PM
ensure that national and local strategies for animal disease prevention, food safety, and public health are consistent and mutually reinforcing. Dedicating resources to detect zoonoses and microbial risks at their source—i.e., in their animal hosts—before they enter the human chain through food systems or health systems is also a key element of the approach.
Ì Fiscal policy
Fiscal measures can support public health policy and mitigate the adverse macroeconomic consequences. Immediate efforts should fund healthcare workers, medicines, equipment and facilities to cope with the suspected cases of COVID-19 patients. Resources should also be allotted for a public advisory to educate the public and allay fear, contact tracing to stem the spread of the virus and implement preventive measures. Fiscal policy cannot increase production where the source is firm closures or supply chain disruptions, but it can help bring the production back on track after the epidemic is over—for example, China funding travel for workers to get to work. If panic leads to a large decrease in demand, a fiscal expansion may be able, if not to get output back to its previous level, at least to maintain higher output.
Governments should protect people from the economic impact of this crisis. Policymakers should move swiftly to provide cash transfers, wage subsidies, and tax rebates to households and businesses hit by supply disruptions and a decline in demand, in order to help people to meet their needs and businesses to stay afloat. Italy has extended tax deadlines for companies in affected areas and broadened the wage supplementation fund to provide income support to laid-off workers, Republic of Korea has introduced wage subsidies for small merchants and increased allowances for homecare and job seekers, and China has temporarily waived social security contributions for businesses. Safety nets should be broadened in the form of enhanced unemployment insurance with extended duration, increased benefits, and relaxed eligibility. In addition, governments should design schemes to pay for sick and family leave to allow affected workers or their caregivers to stay home without fear of losing their jobs during the pandemic.
Ì Monetary policy
The sharp tightening in financial conditions, along with expectations of low inflation, provides the right conditions for monetary policy action. Central banks should help ease the tightening of financial conditions by injecting liquidity and cutting interest rates. They should provide ample liquidity to banks and nonbank financial institutions, particularly to those lending to small- and medium-sized enterprises. Easing credit and liquidity conditions can help firms in trouble, either because of low sales or supply disruptions. A monetary stimulus such as policy rate cuts or asset purchases can inject confidence into financial markets if there is deterioration in financial conditions. China’s government has initiated a range of financial policies focused on keeping companies afloat, especially small and medium enterprises, that face major liquidity problems. Republic of Korea has expanded lending for business operations and loan guarantees for affected small- and medium-sized enterprises.
Ì Financial stability policies
Regulators and supervisory authorities should work closely with banks and financial institutions to ensure that they adjust quickly to soften the negative effects of the shock. The goal must be to preserve the financial strength of the system and transparency across the financial sector. A further tightening of the available finance coupled with panic in financial markets could stress the system and lead to a banking crisis. Financial market regulators and supervisors
29
EAST ASIA AND PACIFIC IN THE TIME OF COVID-19
1. CHAPTER I. SYNTHESIS
10158-EAP Economic Update_73177_newB.indd 2910158-EAP Economic Update_73177_newB.indd 29 4/1/20 2:23 PM4/1/20 2:23 PM

could encourage, on a temporary and time-bound basis, extensions of loan maturities. That is, supervisory authorities could engage in regulatory forbearance, to ease as much pressure as possible from households and businesses struggling to repay their loans. Given the temporary nature of the pandemic, banks could consider temporarily restructuring of loans for affected borrowers.
The necessary policies currently enacted to mitigate the negative effects on the financial sectors could create distortions that have repercussions in the future. Massive injections of financial resources can exacerbate capital misallocation and debt overhang. There is, therefore, the need to gather information, monitor the recipients of funds, and track closely the risks associated to connected lending and crony capitalism.
Relaxation of regulation and availability of low-interest rate financing need to be complemented by safeguards against excessive risk-taking. Although there has been a sudden increase in systemic risk and deterioration in the credit portfolio of banks, government intervention through the financial sector does not necessarily guarantee that much-needed financial resources will reach the neediest firms and households. Therefore, intervention should be accompanied by measures that ensure that financial institutions retain all residual resources to shore up capital rather than distributing them as dividends and share buybacks or as bonuses to management.
Transparency and regulatory oversight are needed to track and inform the allocation of the financial resources injected in the financial system. Relaxation of regulation, supervision, or accounting standards increases the opacity of financial institutions’ balance sheets, undermining public trust. Therefore, some forms of temporary regulatory forbearance (e.g., changing loan loss provisioning methods), should be accompanied by greater transparency and publicly available information, to prevent “zombie” financial intermediaries from operating in the market through government support. It is also critical that at times of distress it is still possible to identify and report asset quality deterioration and the build-up of non-performing loans, ensuring the possibility of clearly and accurately evaluating risks in the financial sector through the duration of the pandemic and beyond.
Ì Trade policies
Trade policy must stay open. To retain the production of essential supplies for domestic consumers, several countries have imposed restrictions on exports of medical products. Economics and recent experience show that these measures ultimately hurt all countries, particularly the more fragile. WTO members—or at least the G20 countries—must agree not to restrict exports of COVID-19-related medical products. Consuming countries could do their part too by liberalizing imports.
Ì Policies to help poverty alleviation
Several countries already affected by COVID-19, have taken effective measures to protect or cushion the effect on the poorest populations (Table I.1.3). While specific policy actions will depend on the countries’ economic vulnerabilities and existing social protection and health systems, the following are general principles that apply more widely to lessen the immediate impact on families’ well-being. Measures can be distinguished between those that are targeted at handling the emergency and relieving the situation of families and firms at the time of the outbreak (very short-term) and those geared towards the recovery of the economy after the outbreak is substantially over, ensuring that the most vulnerable are able to quickly reengage in income-generating activities.
30
EAST ASIA AND PACIFIC ECONOMIC UPDATE APRIL 2020
PART I. COVID-19: IMPACT AND RESPONSE
10158-EAP Economic Update_73177_newB.indd 3010158-EAP Economic Update_73177_newB.indd 30 4/1/20 2:23 PM4/1/20 2:23 PM

Interventions toward containment and mitigation of health effects
• Provide and expand sick pay/leave to both alleviate the adverse economic effects of the health shock, but also to incentivize appropriate social distancing measures. For instance, Malaysia has announced financial assistance of RM 600 (around USD$150) per employee per month for up to six months for workers who are forced to take leave without pay, to be delivered through the existing Employment Insurance System, targeted to lower-paid workers.
• Provide free or subsidized testing and treatment of COVID-19, to limit financial harm of health-related expenditures and ensure that families are diagnosed and treated regardless of their financial situation. In China, the cost of treatment for everyone is being covered through the public budget since the end of January. In Thailand, instead, the social security agency will cover all medical costs of those infected with COVID-19.
Interventions to support the poor and newly unemployed affected by the economic shutdown
• Deploy existing safety nets and social insurance programs, such as cash and in-kind transfers, to provide temporary relief for families whose earnings have been adversely hit by the outbreak. In contexts of high labor informality, access to safety nets is particularly important, since informal workers are more exposed to the adverse economic effects of shocks, than the formally employed who have social insurance as well as sick leave. Where conditional cash transfer programs exist, waiving conditionality for a period could enable expansion of coverage, where needed, although the expansion of programs may take time if the information of non-beneficiaries is not readily available. China, Indonesia, and Malaysia have already expanded cash transfers as a response to the outbreak. Hong Kong, SAR, China is providing cash transfers to all adult permanent residents and lowering public housing rent (around 45 percent of the population live in public housing) to relieve people’s financial burden as well as to boost local consumption. While social insurance may benefit few (better-off) individuals in countries with high informality, where unemployment benefit programs exist, temporary adjustments to the benefit criteria, such as easing the conditions to receive benefits—can help expand the coverage of such programs to widen the net. Adjustments can also be made in the duration of benefits, as needed.
• Support firms’ efforts to retain workers, to lessen the employment impacts of the outbreak. In Republic of Korea, for example, the government is financing employment retention subsidies, to help firms finance continued employment of their workers in the face of sharp revenue declines. Elsewhere in the region, governments are temporarily exempting or deferring social insurance contributions to support firms and employees to weather difficult times. For instance, Cambodia has provided the tourism, garment, and footwear sectors with tax relief and exemption from contributing to social security funds and provided suspended-workers with income payment co-funded by firms and government.
Short-term measures to avoid long-term impacts of the crisis
• Provide school meals for families reliant on them, by delivering to families and making them available in the event of school closures or by providing students with the money to cover for the meal (as in Bihar, India). Short-term impacts on family incomes can potentially translate into long-term impacts on children’s human capital, not only via lost time in the classroom but through adverse impacts on child nutrition, if appropriate measures are not taken on a timely basis.
31
EAST ASIA AND PACIFIC IN THE TIME OF COVID-19
1. CHAPTER I. SYNTHESIS
10158-EAP Economic Update_73177_newB.indd 3110158-EAP Economic Update_73177_newB.indd 31 4/1/20 2:23 PM4/1/20 2:23 PM

Programs to support the reintegration of workers after the emergency crisis
• Enhance employment support services, helping job-seekers find employers, as well as by providing training or apprenticeship opportunities for workers to upgrade their skills. Already in China, as the outbreak is winding down local governments have started providing incentives in the form of temporary subsidies to local businesses to prioritize poor households when filling available job opportunities. In Malaysia, the authorities are encouraging the use of outbreak-induced downtime to encourage skills upgrading through deduction of training-related expenses, subsidizing short courses in digital skills and highly skilled courses, and increasing the claimable training cost for affected sectors. Cambodia is to provide retraining and upskilling programs as well as job search services
Travel subsidies for migrants. In China, the government has put in place measures to enhance coordination across line ministries and between migrant-sending and receiving regions to provide transportation and employment services to support their return to work.
Strengthen measures to support school retention, particularly among secondary school students. Across many countries, schools are being closed. The longer a child is out of school, the less likely she is to return. Measures to ensure that long-distance learning is reaching the most vulnerable, considering that access to technology might be limited to them, will be key to keeping students engaged. High stakes standardized tests may need to be offered online or postponed while remote learning mechanisms are developed and rolled out. In countries where cash transfers with conditions related to school enrolment are present, raising the benefit levels for those most-at-risk could further encourage students to return once classes resume. Additional flexibilization of re-entry requirements might also be needed.
Table I.1.3. Policy responses to address the COVID-19 challenge
Countries
Policy responses
Monetary Fiscal Health response Travel
China • Interest rate (–10 bp) • Liquidity support of 1.0% of GDP in the first two months of 2020 (0.4. percent of GDP higher than last year).
• Refinancing facility (0.8% of GDP)
• Regulatory forbearance Increase of lending funds by 0.2% of GDP.
• Reserve requirement ratio cut effective March 16 that would release 0.5% of GDP in base money liquidity
• Public investment stimulus (1.3% of GDP)
• Measures to ease SME liquidity constraints (1.2% of GDP)
• Epidemic prevention and control (0.1% of GDP)
• Small-scale taxpayers VAT exemption for Hubei province, and reduction from 3% to 1% for those in other provinces.
• Lowered/exempted employers’ contributions to social insurance.
• Exemption of tariffs on imported supplies for COVID-19 control
• All provinces declared public health emergencies
• Two major emergency hospitals set up in Wuhan
• Free medical services provided to COVID-19-related pneumonia
• Severe travel restrictions on domestic and international traffic
• Strict quarantine requirements
32
EAST ASIA AND PACIFIC ECONOMIC UPDATE APRIL 2020
PART I. COVID-19: IMPACT AND RESPONSE
10158-EAP Economic Update_73177_newB.indd 3210158-EAP Economic Update_73177_newB.indd 32 4/1/20 2:23 PM4/1/20 2:23 PM

Indonesia • Interest rate (–25 bp) • Lowered minimum reserve requirement
• Regulatory forbearance with banking sector stimuli
• Central Bank of Indonesia (BI) stabilization of the rupiah’s exchange rate, increase of foreign exchange liquidity and provision of alternative hedging instruments
• Initial fiscal stimulus package (USD$745 million in contingency funds)
• Granted tax deferment facilities
• Emergency fiscal stimulus that includes a raft of tax breaks worth IDR22.92 trillion
• Designated hospitals as referral units
• Created a contingency fund to cover incremental costs for patient care and treatment
• No entry if traveled to China last 14 days
• Visa restriction to Chinese nationals
• Enhanced screening measures at ports of entry
Malaysia • Interest rate (–50 bp) • RM 3.3 billion to assist SMEs in sustaining business operations, safeguard jobs and encourage domestic investments
• Special loan funds • Central Bank of Malaysia (BNM) reduced the statutory reserve requirement ratio
• RM 20 billion economic stimulus package was announced on February 27. Some measures aim to ease the cash flow of affected businesses and tourism and to provide financial aid to employees on unpaid leave.
• Relief measures (0.04% of GDP) announced on March 15
• Fourteen-day movement control order with general prohibition of mass gatherings, restriction of travel, closure of schools, universities and private and government premises
• No entry if traveled to China last 14 days
• All foreign visitors are prohibited from entering or transiting through Malaysia and Malaysians are prohibited from traveling abroad effective March 18 until the 31st
• Enhanced screening measures at ports of entry
• Self-quarantine for 14 days if traveled abroad
Philippines • Interest rate –25 bp in February
• Interest rate (–50 bp in March
• Signaled an additional 25 bp cut later in the year
• Expansionary budget, with a planned 12% year-to-year increase of spending
• Additional spending for the tourism sector (0.03% of GDP)
• PHP27.1 billion fiscal support package to provide economic relief to business and livelihood affected by COVID-19 announced on March 17
• Expanded testing and treatment capacity of hospitals
• Established a repatriation and quarantine facility
• Community quarantine until April 14
• No entry if traveled to China last 14 days
• Mandatory 14 days of quarantine for citizens if traveled to China
33
EAST ASIA AND PACIFIC IN THE TIME OF COVID-19
1. CHAPTER I. SYNTHESIS
10158-EAP Economic Update_73177_newB.indd 3310158-EAP Economic Update_73177_newB.indd 33 4/1/20 2:23 PM4/1/20 2:23 PM

Thailand • Interest rate (–25 bp) • Regulatory forbearance • Relaxed foreign exchange regulations
• THB400 billion stimuli package that includes THB150 billion for soft loans
• Reduction of withholding taxes for businesses from 3% to 1.5%
• Tax deduction for businesses of 1.5 times on interest rates and 3 times on wage expenses
• Reduction or postponement of utility bills
• Initiated pandemic preparedness plan
• Health certificate with negative COVID-19 test required for all passengers arriving in Thailand (national and foreigner) effective March 22
• Travelers who have been in the United States 14 days prior arrival should self-monitor and report starting March 13
Vietnam • Regulatory forbearance • SBV reduction of policy rates (refinancing rate from 6% to 5% and discount rate from 4% to 3.5%)
• USD$12.4 billion in preferential credit to affected businesses
• SBV lowered the cap on short-term deposit rates by 0.25% and by 0.5% on short-term lending rates
• SBV allowed commercial banks to restructure loans maturities to affected businesses
• Accelerated preventative measures using existing health insurance funds
• Introduced tax exemptions for essential medical equipment
• Delay in the tax payment deadline by five months for businesses impacted by COVID-19 (under consideration of Government as of March 17)
• Declared Public Health Emergency in the affected areas
• Established a nCoV National Steering Committee chaired by Deputy PM
• No entry if traveled to China last 14 days
• Enhanced screening measures at ports of entry
• Reduced flight and sea transportation from China
• No entry for travelers who transited Europe’s Schengen Area and Britain in the past 14 days effective March 15
Cambodia • Regulatory forbearance • Reduction of reserve requirement rates, benchmark rate and liquidity coverage ratio
• Fiscal stimulus (3% of GDP)
• Tax relief • Targeted capital injection to support smaller firms and microfinance institutions
• Additional capital injection for the Rural Development Bank
• Provided suspended workers with income payment co-funded by firms and government
• Prepared national hospital and all provincial hospitals for COVID-19 outbreak
• Allocated US$30 million for prevention
• Suspension of entry for travelers through waterways starting March 13
• 30-day restriction on visitors from Italy, Germany, Spain, France, and the United States effective March 17
Lao PDR • Specific measures are being considered
• Resources are being allocated to buy medical supplies
• Restricted cross-border travel; reduction of flights from China, Republic of Korea, Vietnam, Cambodia and Thailand
• Suspension of all visa on arrivals and visa exemptions until April
34
EAST ASIA AND PACIFIC ECONOMIC UPDATE APRIL 2020
PART I. COVID-19: IMPACT AND RESPONSE
10158-EAP Economic Update_73177_newB.indd 3410158-EAP Economic Update_73177_newB.indd 34 4/1/20 2:23 PM4/1/20 2:23 PM

Myanmar • None, so far • Established an inter-ministerial committee to fight the coronavirus
• Developed a US$4.8 m costed plan for donor support
• Restricted cross-border travel; flight ban from China
• Visa restriction to Chinese nationals
• Enhanced screening measures at ports of entry
• Myanmar nationals who traveled to Hubei Province (China) or Daegu and Gyeongbuk regions (Republic of Korea) will be quarantined in public hospitals for 14 days
Mongolia • Monetary Policy Committee (MPC) reduced the policy rate by 100 bp to 10%
• Reserve requirements on domestic currency reduction by 200bp to 8.5%
• Regulatory forbearance
• Tax exemptions (including customs and VAT on food items)
• Accelerate the process of tendering for public investment projects
• Suspension of educational activities and community activities until March 30
• Suspension of the Lunar new year celebration
• Temporary suspension of the Trans-Siberian railway (reducing coal and crude oil export)
• Closure of nonfood markets, stores, wholesale markets and nonessential services until March 16
• Suspension of all international flights and road/rail travel (except for rail freight) until March 28 and all forms of domestic inter-city passenger trips during March 10–16
• Visas restriction to Chinese nationals
• 14-day quarantine for those who traveled to China, Republic of Korea, Japan, Iran and Italy at local designated hospitals upon arrival
Papua New Guinea
• 45 million Kina funding of Emergency Preparedness and Response Plan
• Appointed new temporary quarantine stations
• No entry if traveled to China last 14 days
• Reduced entry for flight or sea transportation from China
Timor-Leste
• None, so far • Inter-ministerial Coordination Committee to “prevent and control” COVID-19
• Training for surveillance teams and rapid responders (national and municipality level)
• No entry if traveled to China last 4 weeks
• Entry restriction for nationals and travelers from China, Iran, Italy, and the Republic of Korea, effective March 11. Those who refuse to return to their port of origin will be subject to 14-day mandatory quarantine.
35
EAST ASIA AND PACIFIC IN THE TIME OF COVID-19
1. CHAPTER I. SYNTHESIS
10158-EAP Economic Update_73177_newB.indd 3510158-EAP Economic Update_73177_newB.indd 35 4/1/20 2:23 PM4/1/20 2:23 PM