Embed Size (px)
DESCRIPTION
Investor Presentation Randy Fields July 2009. Park City Group: Vision. Consumer Driven Sales Optimization™. Retail: A Burning Platform. Retailers’ Balance Sheets are highly leveraged Pressure to lean out inventory results in out-of-stocks, lost sales…and reduced consumer loyalty - PowerPoint PPT Presentation
Citation preview

Park City Group: VisionConsumer Driven Sales Optimization™
Investor Presentation
Randy Fields
July 2009
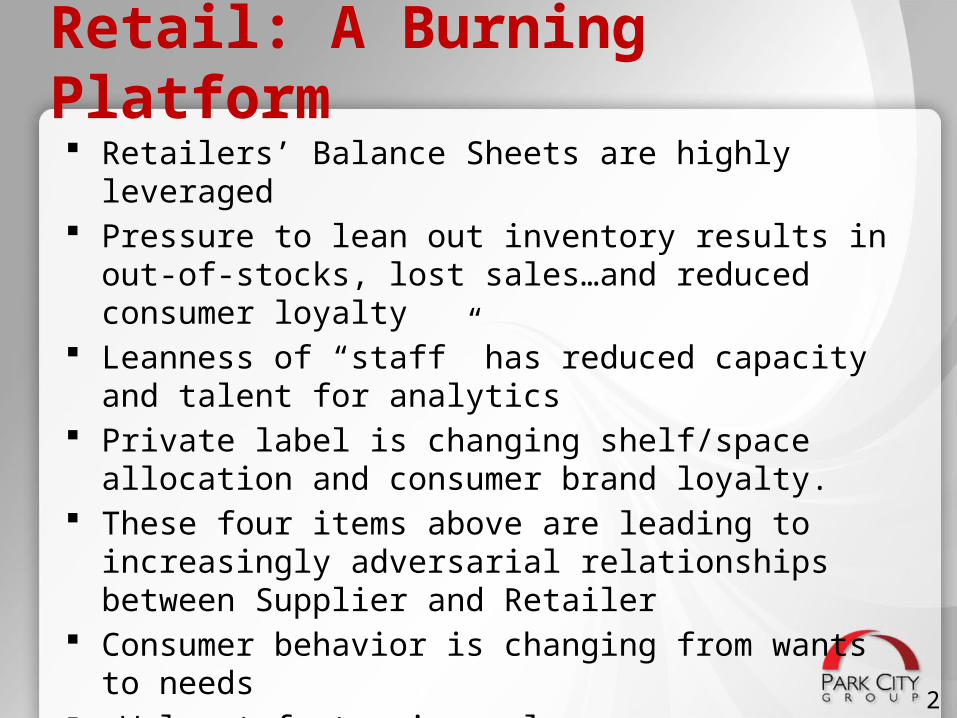
Retail: A Burning Platform Retailers’ Balance Sheets are highly leveraged Pressure to lean out inventory results in out-of-stocks, lost
sales…and reduced consumer loyalty Leanness of “staff” has reduced capacity and talent for
analytics Private label is changing shelf/space allocation and consumer
brand loyalty. These four items above are leading to increasingly adversarial
relationships between Supplier and Retailer Consumer behavior is changing from wants to needs Walmart factor is real
– Consumer– Supplier
2

Our Business: Consumer Driven Sales Optimization (CDSO) Improving the sales, profitability and cash flows of
Retailers and their Suppliers We offer a broad suite of technology and services that
help these trading partners align themselves to the consumer:– Shifting the inventory burden from the retailer to the
supplier (Scan Based Trading)– Giving the supplier information much like Wal-Mart “Retail
Link” to reduce out of stocks and increase sales– Act as an independent 3rd party to help settle the financial
transactions between them– Provide insights and action strategies to mutually improve
their sales and profits (SCPL) Simply put, we convert information into cash
4

Financial Performance GoalsExpand our business to deliver an EPS target of $1.00 per share in less than 3 years.
Fully diluted number of shares 3/31/08 = 13.0 mil5
(In $Millions) FY 2009 E FY 2010 E FY 2011 E FY 2012 E
Base Revenue $ 10.2 $ 10.4 $ 10.9 $ 11.8
SBT /CDSO (Hub) $ - $ 1.1 $ 5.5 $ 14.3
Total Revenue $ 10.2 $ 11.5 $ 16.4 $ 26.1
Fixed Costs $ (7.65) $ (6.9) $ (7.1) $ (7.3)
Variable Costs $ (2.55) $ (2.3) $ (3.4) $ (5.2)
Total Expense $ (10.2) $ (9.2) $ (10.5) $ (12.5)
EBITDA $ - $ 2.3 $ 5.9 $ 13.6
Other $ (6.7) $ (1.6) $ (1.2) $ (0.6)
Net Income $ (6.7) $ 0.7 $ 4.7 $ 13.0
Net Pre Tax Margin 6% 28% 50%
EPS (Fully Dil 13.0 mil shrs) $ (0.52) $ 0.05 $ 0.36 $ 1.00

The Inherent Supply Chain Problem
Suppliers sell to Retailers and are paid at the retailer’s discretion. Inventory burden resides with retailer.
The supply chain has little visibility and immense complexity. Suppliers only see what goes to the warehouse, not what is sold or is out of stock in the stores.
6

Park City Group’s CDSO Solution
Suppliers sell through Retailers to the consumer and are contractually paid upon sale. Inventory burden resides with supplier.
For the Hub, we provide an unobstructed view from the cash register to the factory floor.
7
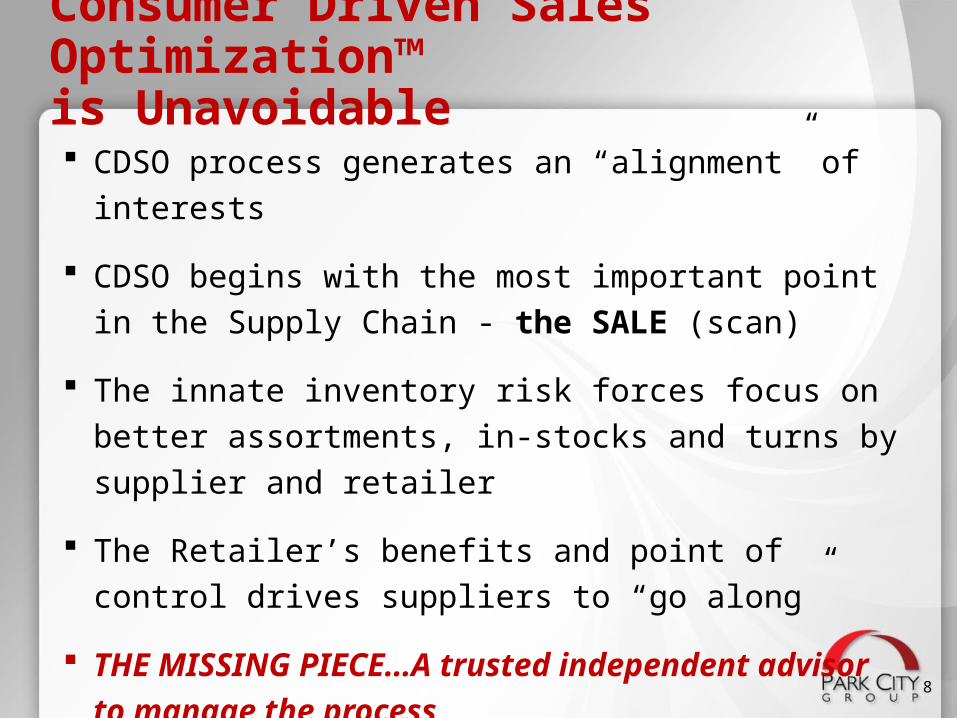
Consumer Driven Sales Optimization™ is Unavoidable CDSO process generates an “alignment” of interests
CDSO begins with the most important point in the Supply Chain - the SALE (scan)
The innate inventory risk forces focus on better assortments, in-stocks and turns by supplier and retailer
The Retailer’s benefits and point of control drives suppliers to “go along”
THE MISSING PIECE…A trusted independent advisor to manage the process
8

Hubs (Retailers) & Spokes (Wholesalers or Suppliers)Relationship can initiate from either retailer/wholesaler or supplier:
• Retailer/Wholesaler = Economic• Supplier = Strategic/Increase Distribution
PCG sells in more “services and products” over time
Hub & Spoke Business Model
9

Consumer Driven Sales Optimization™ Fully Integrated/Modular
Inventory Optimization
Scan Based Trading
• Suppliers invoice retailer for product after it is scanned at POS, or Point of “receipt” for gains in operational efficiencies
• Retailers recognize and pay for inventory only as it is sold.
• Vendor managed inventory (VMI) – manage inventory and service levels at distribution centers
• Store level replenishment (SLR) – optimize inventory at retail stores
Demand & Distribution
Planning
Analytics & Business
Performance• Analyze
shrink, in-stock positions, sales performance, overstocks
• Visibility to execution issues and exceptions SKU Mix, Promo Optimization, Distribution Voids
• Leverage demand signals (historical POS, shipments and order data) to forecast future demand
• Plan replenishment requirements to DCs
SupplierManufacturing Distributor Store
Data Flow
Product Flow
Consumer
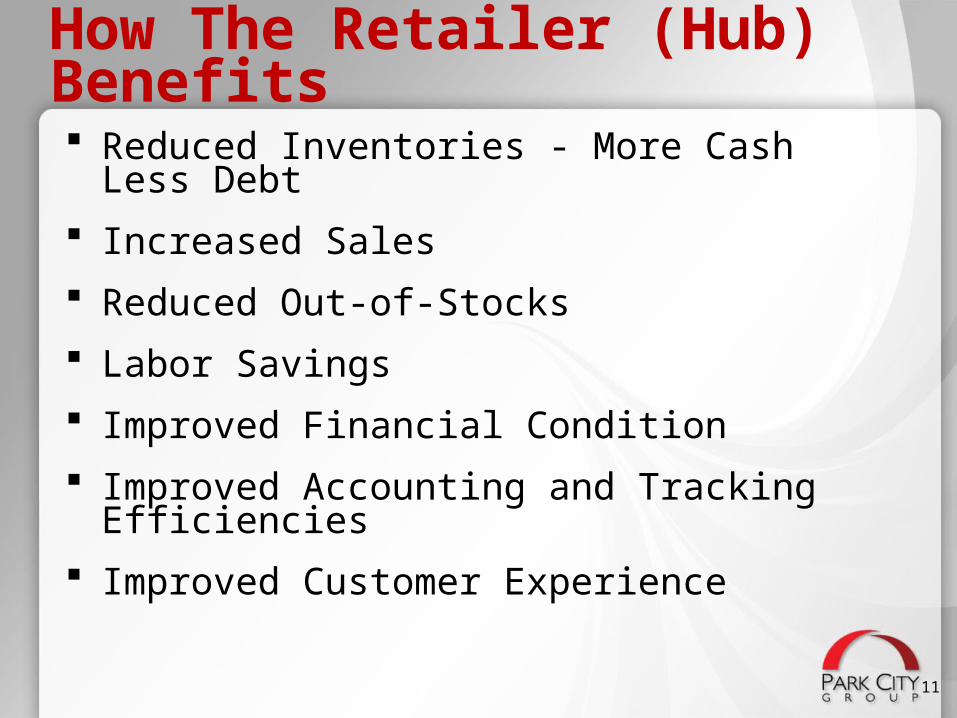
How The Retailer (Hub) Benefits Reduced Inventories - More Cash Less Debt Increased Sales Reduced Out-of-Stocks Labor Savings Improved Financial Condition Improved Accounting and Tracking Efficiencies Improved Customer Experience
11

How The Supplier (Spoke) Benefits Improved Sales Reduced Financial Risk from Retailer Failures Increase in Efficiency of Promotional Spending Consumer Response Visibility Reduced Slotting Fees Better Demand Planning Accounting and Tracking Efficiencies Increased Sales Visibility
12

Typical SBT Benefits
Area of Measure Impact*
Sales Increased 3% - 10%
Inventory Reduced 10% - 30%
Working Capital Decreased 10% - 15%
Shrink Reduced .2% - 2%
*Results from 15 years experience and hundreds of implementations

Our Target Market All major retail channels
Grocery, specialty, home improvement, office supply, arts & crafts, sporting goods, electronics, etc.
All suppliers who support these channels Clorox, Crayola, Warner Lambert, Johnson & Johnson, Titleist, Adidas, General Electric, Kraft Foods, 3M, etc.
All raw material, packaging, and source material providers to suppliers in these channels
14

Select Retail Customers
15
GROCERY
DRUG
C-STORE
MASS MERCHAN
T
SPECIALTY

Select Supplier CustomersBREAD/BAKERY
PRODUCE
JUICE
DAIRY
SNACKS
SPECIALTY/CENTER STORE
CONFECTION

Our Competitive Advantage Patented, One-of-a-Kind Technology Platform
– $100 mil invested infrastructure acquired from Prescient acquisition in January 2009
Superior Sales and Operational Management Team with Deep Consumer Packaged Goods and Retailer Experience
Board of Directors and Senior Management with C-level Access to Many Global Decision Makers
Market Credibility and Experience Through Our Founder, Randy Fields of Mrs. Fields Cookies
17

CDSO Product Pricing and Hub Value A retailer in a Hub is charged an average subscription of
$100,000 per year A supplier Spoke in a Hub is charged an average subscription of $12,000
per year The retailer receives a 20% incentive rebate for the total supplier Spoke
revenue A typical Hub has between 50 and 150 Supplier spokes It takes approximately 3 years for a Hub to mature As a Hub matures, we are able to sell our additional suite of products
and services to both the Retailer and Supplier spokes
18
Annual Recurring Value – Per Hub
Year 1 $ 100,000
Year 2 $ 400,000
Year 3 $ 750,000

How We Get to $1.00 EPS
19
Given the depth and breadth of our target market, we need a relatively small number of Hubs in order to achieve our goal
As a Hub matures, we anticipate increased penetration of our base suite of products and services adding to base revenue
We are a relatively fixed cost business, so net margin will grow Our transition towards a state of the art “cloud” environment insures that our
capital costs will remain low
$ 1.00 $ 0.36 $ 0.05 $ (0.52)EPS (Fully Dil 13.0 mil shrs)
50%28%6%Net Pre Tax Margin
$ 13.0 $ 4.7 $ 0.7 $ (6.7)Net Income
$ (0.6)$ (1.2)$ (1.6)$ (6.7)Other
$ 13.6 $ 5.9 $ 2.3 $ -EBITDA
$ (12.5)$ (10.5)$ (9.2)$ (10.2)Total Expense
$ (5.2)$ (3.4)$ (2.3)$ (2.55)Variable Costs
$ (7.3)$ (7.1)$ (6.9)$ (7.65)Fixed Costs
$ 26.1 $ 16.4 $ 11.5 $ 10.2 Total Revenue
$ 14.3 $ 5.5 $ 1.1 $ -SBT /CDSO (Hub)
$ 11.8 $ 10.9 $ 10.4 $ 10.2 Base Revenue
FY 2012 EFY 2011 EFY 2010 EFY 2009 E(In $Millions)

Valuation What valuation might PCYG reasonably expect
upon attainment of $1.00 EPS?– A recent sampling of four publicly traded peer
group SaaS providers shows an average P/E of 50x earnings
SYMBOL CO. NAME PPS EPS P/E
AZPN.PK Aspen Technology $ 9.20 $ 0.24 38.77 CRM Salesforce.com, Inc. $ 39.74 $ 0.42 105.54
EPIC Epicor Software Corp. $ 5.54 $ 0.13 44.32 DOX Amdocs Limited $ 21.43 $ 1.59 13.53
Average P/E 50.04

21
Existing HubsWith 10 or More Supplier Connections

Business Summary Supply Chain and inventory control issues are real,
increasing (and especially in the present economic and credit climate) are a critical priority
Park City Group is the trusted third party advisor with the proven solutions to accelerate the inevitable paradigm shift of responsibility of inventory and sales between the Retailer and Supplier
Park City Group creates economic value by optimizing the supply chain for Retailers and Suppliers
22
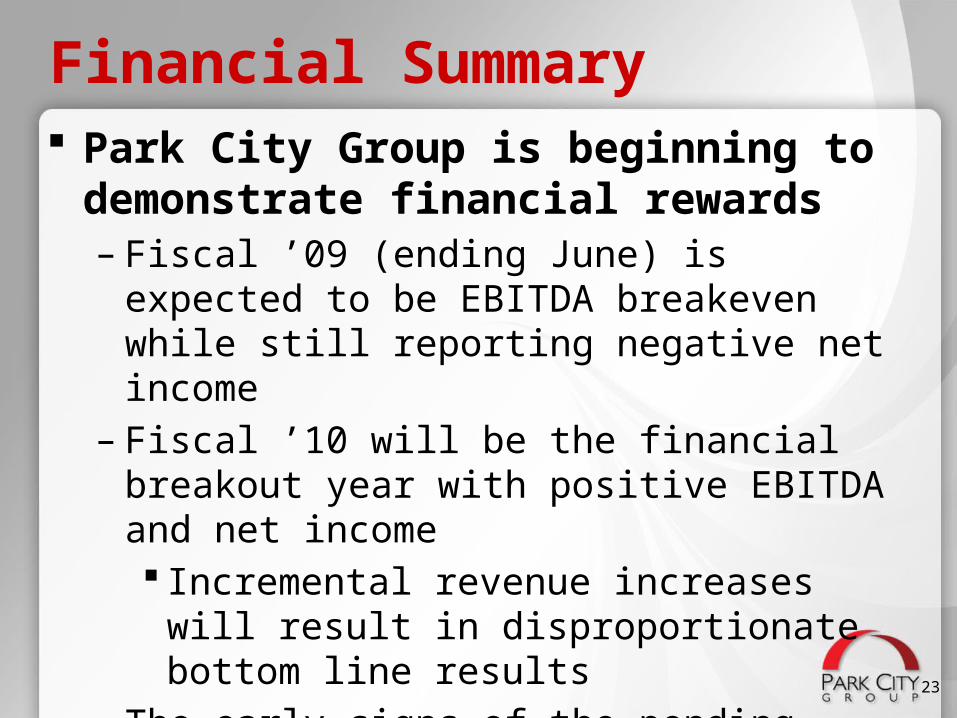
Financial Summary Park City Group is beginning to demonstrate
financial rewards– Fiscal ’09 (ending June) is expected to be EBITDA
breakeven while still reporting negative net income– Fiscal ’10 will be the financial breakout year with
positive EBITDA and net income Incremental revenue increases will result in
disproportionate bottom line results– The early signs of the pending acceleration of
financial results will be the signing on of additional Hubs
23
Forward-Looking StatementStatements in this presentation that relate to Park City Group's future plans, objectives, expectations, performance, events and the like are "forward-looking statements" within the meaning of the Private Securities Litigation Reform Act of 1995 and the Securities Exchange Act of 1934. Future events, risks and uncertainties, individually or in the aggregate, could cause actual results to differ materially from those expressed or implied in these statements. Those factors could include changes in economic conditions that may change demand for the Company's products and services and other factors discussed in the "forward-looking information" section and the "risk factor" section of the management's discussion and analysis included in the Company's report on Form 10-K for the year ended June 30, 2008 and in any risk factors or cautionary statements contained in the Company's periodic reports on Form 10-Q or current reports on Form 8-K filed with the Securities and Exchange Commission. This presentation is comprised of interrelated information that must be interpreted in the context of all of the information provided and care should be exercised not to consider portions of this release out of context. Park City Group uses paid services of investor relations organizations to promote the Company to the investment community. Investments in any company should be considered speculative and prior to acquisition, should be thoroughly researched. Park City Group does not intend to update these forward-looking statements prior to announcement of quarterly or annual results. Contact: Randy Fields435 645 [email protected] 24