Embed Size (px)
Citation preview

Journal of Modern Applied StatisticalMethods
Volume 15 | Issue 1 Article 9
5-2016
Parametric Tests for Two Population Means underNormal and Non-Normal DistributionsDiep T. NguyenUniversity of South Florida, [email protected]
Eun Sook KimUniversity of South Florida, [email protected]
Patricia Rodriguez de GilUniversity of South Florida, [email protected]
Anh KellermannUniveristy of South Florida, [email protected]
Yi-Hsin ChenUniversity of South Florida, [email protected]
See next page for additional authors
Follow this and additional works at: http://digitalcommons.wayne.edu/jmasm
This Regular Article is brought to you for free and open access by the Open Access Journals at DigitalCommons@WayneState. It has been accepted forinclusion in Journal of Modern Applied Statistical Methods by an authorized editor of DigitalCommons@WayneState.
Recommended CitationNguyen, Diep T.; Kim, Eun Sook; Rodriguez de Gil, Patricia; Kellermann, Anh; Chen, Yi-Hsin; Kromrey, Jeffrey D.; and Bellara, Aarti(2016) "Parametric Tests for Two Population Means under Normal and Non-Normal Distributions," Journal of Modern AppliedStatistical Methods: Vol. 15 : Iss. 1 , Article 9.DOI: 10.22237/jmasm/1462075680Available at: http://digitalcommons.wayne.edu/jmasm/vol15/iss1/9
Parametric Tests for Two Population Means under Normal and Non-Normal Distributions
AuthorsDiep T. Nguyen, Eun Sook Kim, Patricia Rodriguez de Gil, Anh Kellermann, Yi-Hsin Chen, Jeffrey D.Kromrey, and Aarti Bellara
This regular article is available in Journal of Modern Applied Statistical Methods: http://digitalcommons.wayne.edu/jmasm/vol15/iss1/9

Journal of Modern Applied Statistical Methods
May 2016, Vol. 16, No. 1, 141-159.
Copyright © 2016 JMASM, Inc.
ISSN 1538 − 9472
Eun Sook Kim is an Assistant Professor in the Department of Educational and Psychological Studies. Email her at: [email protected].
141
Parametric Tests for Two Population Means under Normal and Non-Normal Distributions
Diep T. Nguyen University of South Florida
Tampa, FL
Anh Kellermann University of South Florida
Tampa, FL
Eun Sook Kim University of South Florida
Tampa, FL
Yi-Hsin Chen University of South Florida
Tampa, FL
Patricia Rodriguez de Gil University of South Florida
Tampa, FL
Jeffrey D. Kromrey University of South Florida
Tampa, FL
Aarti Bellara University of Connecticut
Storrs, CT
A simulation study was conducted to explore the performance of the independent means t-test, Satterthwaite’s approximate t-test, and the conditional t-test under various conditions.
Type I error control and statistical power of these testing approaches were examined and guidance provided on the proper selection among them. Keywords: Type I error control, statistical power, parametric tests, independent means t-test, Satterthwaite’s approximate t-test, conditional t-test
Introduction
In elementary statistics courses, the independent means t-test is followed by a
discussion of statistical assumptions, robustness, Type I error control, and power.
At the time of writing, the independent means t-test has been widely used in almost
every discipline to this day. A search completed in June of 2014 with the key words
“independent means t-test”, with time period between 2013 and 2014, returned
1,740 articles from the Google Scholar database (excluding citation and patents)
and 605 articles from the Web of Science database. Among the 605 articles in Web
of Science, 170 out of the 202 most recent articles mentioned in the abstract that
these studies utilized the independent means t-test.
PARAMETRIC TESTS FOR TWO POPULATION MEANS
142
The independent means t-test relies on the assumptions of population
normality and equal variances (homoscedasticity). Alternative approaches such as
the Satterthwaite’s approximate t-test (Satterthwaite’s test hereinafter) relax these
assumptions, approximating the t distribution and the corresponding degrees of
freedom. Although the independent means t-test is “the most powerful unbiased
test” (Bridge & Sawilowsky, 1999, p. 229) for detecting true mean differences
under the assumption of normality, statisticians to date are still evaluating the
various conditions and factors for which this test is robust under the violation of the
equality of variances assumption and departures from normality.
Controversy about the Independent Means t-Test
Many statistical textbooks (e.g., Cody & Smith, 1997; Schlotzhauer & Littell, 1997)
continue recommending what Hayes and Cai (2007) call the “conditional decision
rule” (p. 217), that researchers screen their samples for variance homogeneity by
conducting preliminary tests (e.g., the Folded F-test). That is, the t-test assumes
that the distributions of the two groups being compared are normal with equal
variances. Although the authors of some statistics textbooks do not even mention
the assumption of homogeneity of variance (e.g., Gravetter & Wallnau, 2011) as
one required for the t-test, homoscedasticity is basic and necessary for hypothesis
testing because the violations of this assumption “alter Type I error rates, especially
when sample sizes are unequal” (Zimmerman, 2004, p. 173).
The preliminary test of the null hypothesis 2 2
1 2 versus the alternative
2 2
1 2 is conducted using the Folded F-test statistic 2
12
2
SF
S . Common
practice has been that if the Folded F-test is not statistically significant (e.g.,
p ≥ 0.05), then the test of µ1 = µ2 versus µ1 ≠ µ2 is calculated using the independent
means t-test:
1 2
1 2
1 2
1 1X X
X Xt
Sn n
(1)
On the other hand, if the preliminary test is statistically significant (e.g.,
p < 0.05) and in addition there are unequal sample sizes, the independent means
t-test should be avoided and the Satterthwaite’s test should be used instead (Moser,
Stevens, & Watts, 1989):

NGUYEN ET AL
143
1 2
2 2
1 2
1 2
'X X
tS S
n n
(2)
with
22 2
1 2
1 2
2 22 2
1 2
1 2
1 21 1
S S
n ndf
S S
n n
n n
(3)
Recently, researchers have questioned the robustness of the conditional t-test
with respect to Type I error and statistical power when the assumptions of normality
and homoscedasticity are not met. Besides the unlikelihood of encountering real
data that are normally distributed (Micceri, 1989), it is reported that there are also
serious disadvantages of performing preliminary tests of variances equality (e.g.,
Moser et al., 1989; Zimmerman, 2004). Specifically, Moser et al. (1989) evaluated
the impact of a preliminary variance test on the power and Type I error rate of the
regular t-test and the Satterthwaite’s test. Based on calculations of power and Type
I error, they suggested that for equal sample sizes (n1 = n2), the t-test and the
Satterthwaite’s test had the same power and provided very stable Type I error rates
close to the nominal alpha prescribed for the test of means. For unequal sample
sizes (n1 ≠ n2), the Satterthwaite’s test still provided reasonable and stable Type I
error rates close to the nominal significance level. In conclusion, Moser et al.
recommended applying directly the Satterthwaite’s test for testing the equality of
means from two independent and normally distributed populations where the ratio
of the variance is unknown.
Rasch, Kubinger, and Moder (2011) conducted a simulation study to compare
the performance of the regular (Student) t-test, Welch test, and Wilcoxon U-test to
investigate if we should perform the t-test conditionally after testing the
assumptions. These authors suggested not testing the underlying assumptions of the
t-test because such testing was not effective. Zimmerman (2004) found similar
optimal results for the Welch-Satterthwaite separate-variance t-test if applied
unconditionally whenever sample sizes were unequal and noted that the power of
this test deteriorated if it was conditioned by a preliminary test. Grissom (2000)
PARAMETRIC TESTS FOR TWO POPULATION MEANS
144
argued that it is realistic to expect heteroscedasticity in data as well as outliers, and
examined the effect of these factors on variance. He also addressed issues of
robustness (i.e., control of Type I error rate) in the presence of heteroscedasticity
and departures from normality, for which he suggested trimming as a way to
stabilize variances.
Purpose of the Present Study
The purpose of this study was to explore the performance of the independent means
t-test and two alternatives, Satterthwaite’s test and the conditional t-test, by
conducting a series of simulations under various manipulated conditions. The
current study extended previous studies on the independent means t-test and its
alternatives by taking into account the non-normality of population distribution and
various levels of heteroscedasticity. Accordingly, extensive simulation conditions
were included in this study: a wide range of total sample sizes (from 10 to 400 in
contrast with 10 to 100 in Rasch et al., 2011 and 30 and 60 in Zimmerman, 2004);
various variance ratios between populations up to 1:20 (beyond the realistic
maximum sample variance ratio of 1:12 suggested in Grissom, 2000 and the great
variance ratio of 1:16 mentioned in Wilcox, 1987); wide range of alpha set for
testing treatment effects and testing homogeneity assumption for the conditional
t-test; large range of non-normality (skewness from 0 to 6 and kurtosis from 0 to
25). In the study of Rasch et al. (2011), skewness and kurtosis were examined from
0 to 3 and 0 to 15, respectively. In addition, this paper provides some guidelines for
researchers on the selection of an appropriate test for the equality of two population
means.
Methodology
A simulation approach was used to explore and compare the behaviors of the
independent means t-test, Satterthwaite’s test, and the conditional t-test for two
means because simulation allows for the controlling of designed factors.
Manipulated Factors
A crossed factorial mixed design included seven factors: (a) total sample size (10,
20, 50, 100, 200, 300, and 400), (b) sample size ratio between groups (1:1, 2:3, and
1:4), (c) variance ratio between populations (1:1, 1:2, 1:4, 1:8, 1:12, 1:16, and 1:20),
(d) effect size for mean difference between populations (Δ = 0, .2, .5, and .8),
(e) alpha set for testing treatment effects (α = 0.01, 0.05, 0.10, 0.15, 0.20, and 0.25),

NGUYEN ET AL
145
(f) alpha set for testing homogeneity assumption for the conditional t-test (α = 0.01,
0.05, 0.10, 0.15, 0.20, 0.25, 0.30, 0.40, 0.45, and 0.50), and (g) population
distributions with varying kurtosis and skewness values (i.e., γ1 = 1.0 and γ2 = 3.0,
γ1 = 1.5 and γ2 = 5.0, γ1 = 2.0 and γ2 = 6.0, γ1 = 0.0 and γ2 = 25.0, as well as γ1 = 0.0
and γ2 = 0.0 for the normal distribution, where γ1 and γ2 represent skewness and
kurtosis, respectively). This crossed factorial design provided a total of 176,400
conditions for the conditional t-test and 17,640 conditions for the Satterthwaite’s
test and the regular t-test.
Data Generation
A random number generator, RANNOR in SAS/IML statistical software, was
employed with a different seed value for each execution of the simulation program
to generate data for this study. For each condition in the simulation, 100,000
samples were generated. The use of 100,000 replications provides a maximum
standard error of an observed proportion (i.e., Type I error rate estimate) of .00158,
and a 95% confidence interval no wider than ± .003 (Robey & Barcikowski, 1992).
Statistically Analytical Procedures
For each sample generated, both the independent means t-test and Satterthwaite’s
test, each at a range of nominal alpha levels (i.e., 0.01 through 0.25), were
conducted. The independent means t-test and Satterthwaite’s test were investigated
under a total of 17,640 conditions. In addition, the conditional t-test was conducted.
The testing procedures for the conditional t-test were as follows. Firstly, the Folded
F-test was implemented to examine the variance homogeneity assumption using a
range of nominal alpha levels (i.e., 0.01 through 0.50). Based upon the results of
the Folded F-test, either the independent means t-test or Satterthwaite’s test was
applied. Thus, for the conditional t-test, a total of 176,400 conditions were
examined.
The simulation focused on Type I error rates and power. Type I error was
examined when the population effect size (or two-group mean difference) was
simulated zero; otherwise power was computed. Type I error rates were evaluated
on the basis of the liberal criterion for robustness suggested by Bradley (1978).
Given a nominal alpha level, Bradley’s liberal criterion provides a plausible range
of Type I error rates in which a test can be considered robust. The liberal criterion
for the robustness is set at 0.5α around the nominal alpha. For example, when
α = 0.05, a test is considered robust when the Type I error rate falls between 0.025,
which is given by 0.5*.05, and .075, which is given by 1.5*.05. When there was
PARAMETRIC TESTS FOR TWO POPULATION MEANS
146
considerable variability in the estimated Type I error and power across simulation
conditions, eta-square analyses were conducted to examine the design factors
related to the variability.
Results
The results of simulation are reported in the following order: (a) power of the
Folded F-test for the test of equal variances, (b) Type I error control for the test of
means, and (c) power for the test of means. Under the Type I error control for the
test of means, an overview of Type I error rates, an analysis of design factors
associated with Type I error control, and an analysis based on Bradley’s liberal
criterion for robustness are presented.
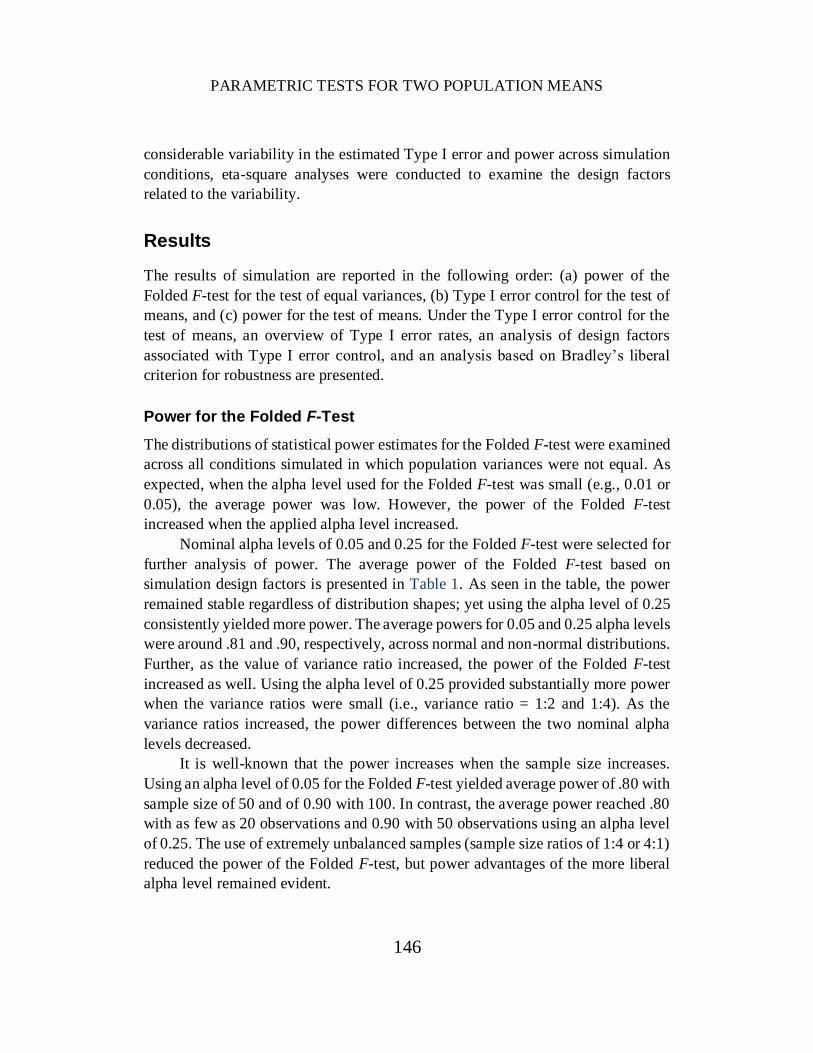
Power for the Folded F-Test
The distributions of statistical power estimates for the Folded F-test were examined
across all conditions simulated in which population variances were not equal. As
expected, when the alpha level used for the Folded F-test was small (e.g., 0.01 or
0.05), the average power was low. However, the power of the Folded F-test
increased when the applied alpha level increased.
Nominal alpha levels of 0.05 and 0.25 for the Folded F-test were selected for
further analysis of power. The average power of the Folded F-test based on
simulation design factors is presented in Table 1. As seen in the table, the power
remained stable regardless of distribution shapes; yet using the alpha level of 0.25
consistently yielded more power. The average powers for 0.05 and 0.25 alpha levels
were around .81 and .90, respectively, across normal and non-normal distributions.
Further, as the value of variance ratio increased, the power of the Folded F-test
increased as well. Using the alpha level of 0.25 provided substantially more power
when the variance ratios were small (i.e., variance ratio = 1:2 and 1:4). As the
variance ratios increased, the power differences between the two nominal alpha
levels decreased.
It is well-known that the power increases when the sample size increases.
Using an alpha level of 0.05 for the Folded F-test yielded average power of .80 with
sample size of 50 and of 0.90 with 100. In contrast, the average power reached .80
with as few as 20 observations and 0.90 with 50 observations using an alpha level
of 0.25. The use of extremely unbalanced samples (sample size ratios of 1:4 or 4:1)
reduced the power of the Folded F-test, but power advantages of the more liberal
alpha level remained evident.

NGUYEN ET AL
147
Table 1. The power of the Folded F-Test using α = .05 and α = .25
Condition α = .05 α = .25 Condition α = .05 α = .25
Total N Variance ratio
10 0.36 0.62 1:2 0.55 0.73
20 0.64 0.82 1:4 0.76 0.87
50 0.85 0.92 1:8 0.85 0.93
100 0.92 0.96 1:12 0.89 0.93
200 0.96 0.98 1:16 0.91 0.96
300 0.98 0.99 1:20 0.92 0.97
400 0.99 0.99
N ratio Shape
1:04 0.74 0.86 0.0, 0 0.82 0.91
2:03 0.83 0.92 1.0, 3 0.81 0.90
1:01 0.85 0.93 1.5, 5 0.81 0.90
3:02 0.85 0.92 2.0, 6 0.81 0.89
4:01 0.80 0.82 0.0, 25 0.81 0.91
For Shape, the two values indicate skewness and kurtosis, respectively
Type I Error Control for the Test of Means
An overall view of the Type I error control of the tests is provided in Figures 1 and
2. These boxplots describe the distributions of the Type I error rate estimates under
a nominal alpha level of 0.05 across all conditions in which the population means
were identical. The first two plots are for the independent means t-test and
Satterthwaite’s test, respectively. The remaining plots delineate the Type I error
rate estimates for the conditional t-test across the different conditioning rules (i.e.,
the alpha levels for the Folded F-test) that were investigated. For instance, the plot
for C(01) provides the distribution of the Type I error rates for the conditional t-test
when an alpha level of 0.01 was used with the Folded F-test as the rule to choose
between the independent means t-test and Satterthwaite’s test.
Note that in Figure 1 the independent means t-test has great dispersion of
Type I error rates. In some conditions, this testing approach provides appropriate
control of the Type I error probability while in others the Type I error rate is very
different from the nominal alpha level. In contrast, Satterthwaite’s approximate
t-test provides adequate Type I error control in nearly all of the conditions simulated.
The series of plots for the conditional t-test illustrate that the conditional test
provides a notable improvement in Type I error control relative to the independent
means t-test and the improvement increases as the alpha level for the Folded F-test
increases. This improvement occurs because the statistical power of the Folded
F-test increases as the alpha level increases. That is, the ability of the Folded F-test
PARAMETRIC TESTS FOR TWO POPULATION MEANS
148
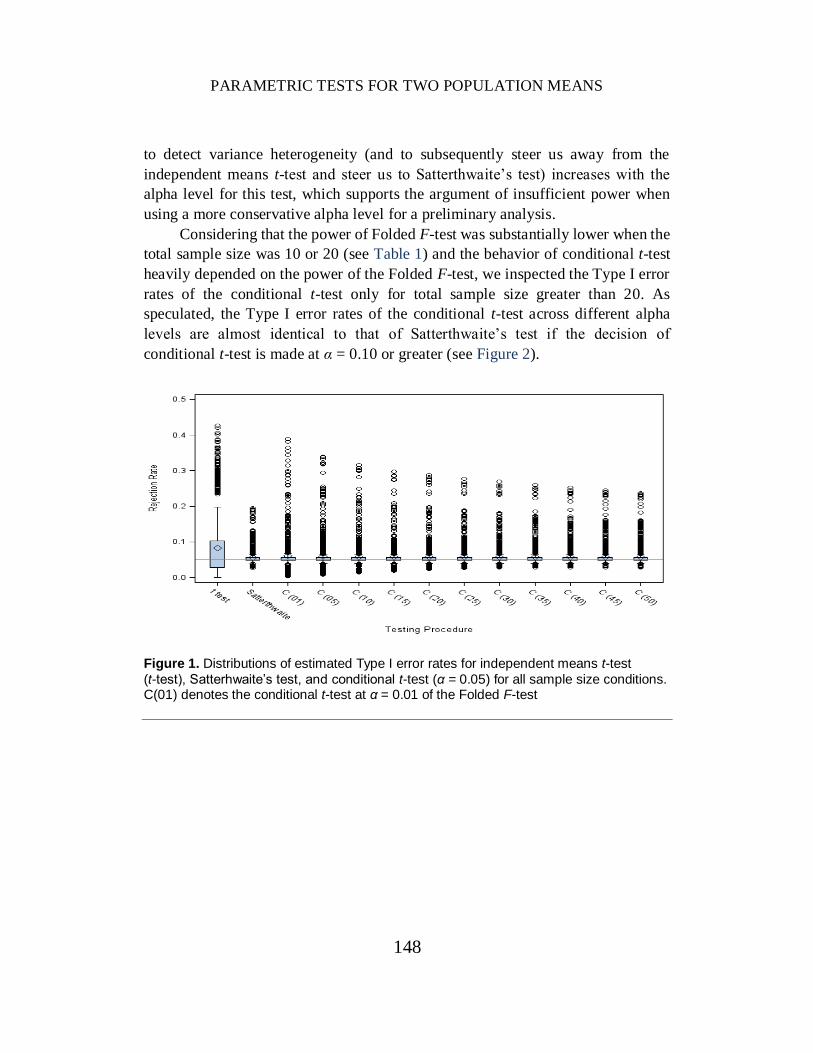
to detect variance heterogeneity (and to subsequently steer us away from the
independent means t-test and steer us to Satterthwaite’s test) increases with the
alpha level for this test, which supports the argument of insufficient power when
using a more conservative alpha level for a preliminary analysis.
Considering that the power of Folded F-test was substantially lower when the
total sample size was 10 or 20 (see Table 1) and the behavior of conditional t-test
heavily depended on the power of the Folded F-test, we inspected the Type I error
rates of the conditional t-test only for total sample size greater than 20. As
speculated, the Type I error rates of the conditional t-test across different alpha
levels are almost identical to that of Satterthwaite’s test if the decision of
conditional t-test is made at α = 0.10 or greater (see Figure 2).
Figure 1. Distributions of estimated Type I error rates for independent means t-test
(t-test), Satterhwaite’s test, and conditional t-test (α = 0.05) for all sample size conditions. C(01) denotes the conditional t-test at α = 0.01 of the Folded F-test

NGUYEN ET AL
149
Figure 2. Distributions of estimated Type I error rates for independent means t-test
(t-test), Satterhwaite’s test, and conditional t-test (α = 0.05) for N > 20. C(01) denotes the conditional t-test at α = 0.01 of the Folded F-test
Impact of Simulation Design Factors on Type I Error Controls
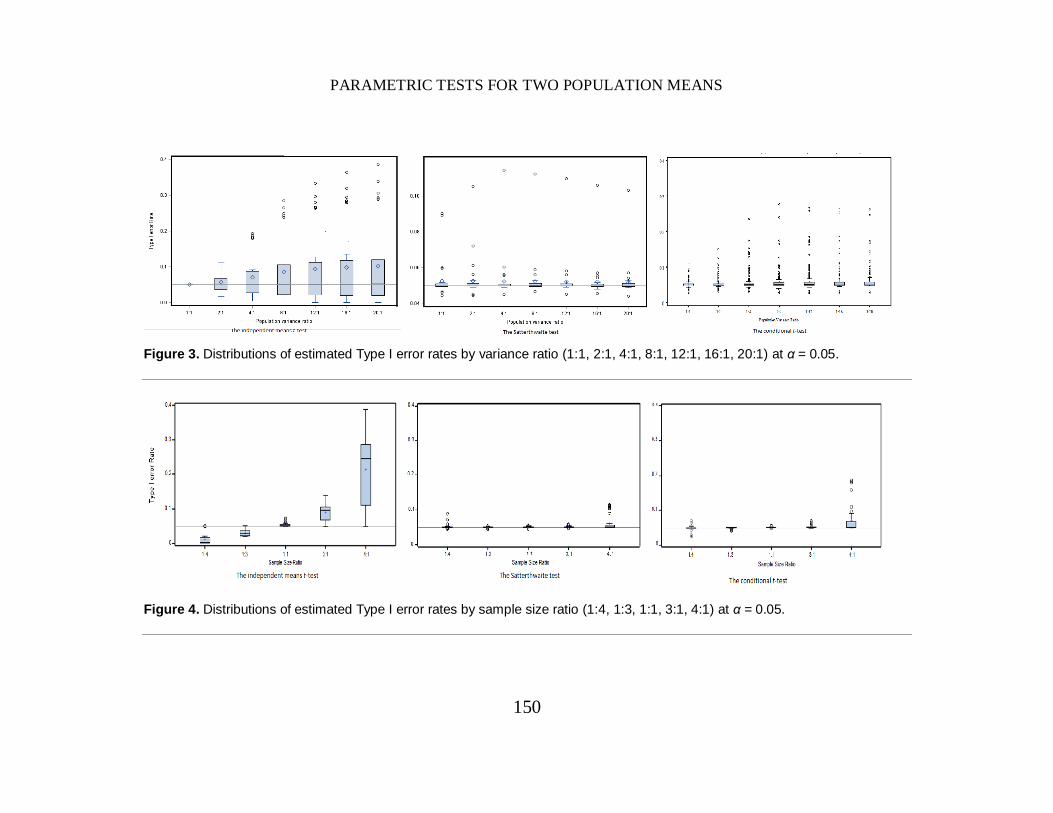
Variance heterogeneity. The large dispersion of Type I error rates for the
independent means t-test resulted in large part from the variance heterogeneity that
was included in the simulation conditions. Figure 3 presents the distributions of
Type I error rates for the independent means t-test with the results disaggregated
by population variance ratio. Note that as the population variance ratio increases,
both the average Type I error rate and the dispersion of Type I error rates increase.
On the other hand, both Satterthwaite’s test and the conditional t-test provide good
control of Type I error rate even if the population variances in the two groups are
heterogeneous (Figure 3).
Of course, the independent means t-test is known to be relatively robust to
violations of the assumption of variance homogeneity if the sample sizes in the two
groups are equal. This phenomenon is illustrated in Figure 4. Note that the Type I
error rate for the independent means t-test is maintained near the nominal 0.05 level
if sample sizes are equal. With disparate sample sizes in the two groups, the
independent means t-test either becomes conservative (Type I error rates lower than
the nominal alpha level) or liberal (Type I error rates higher than the nominal level)
depending upon the relationship between sample size and population variance. In
contrast, both Satterthwaite’s test and the conditional t-test evidence much
PARAMETRIC TESTS FOR TWO POPULATION MEANS
150
Figure 3. Distributions of estimated Type I error rates by variance ratio (1:1, 2:1, 4:1, 8:1, 12:1, 16:1, 20:1) at α = 0.05.
Figure 4. Distributions of estimated Type I error rates by sample size ratio (1:4, 1:3, 1:1, 3:1, 4:1) at α = 0.05.

NGUYEN ET AL
151
improved Type I error control under variance heterogeneity when samples sizes are
unequal.
Other design factors related to Type I error control. The variability in the
estimated Type I error rates for the three tests of means was analyzed by computing
the eta-squared value associated with each simulation design factor and the first-
order interactions. For the independent means t-test, the factors associated with
variability in estimated Type I error rates were sample size ratio (η2 = 0.69) and the
interaction between sample size ratio and variance ratio (η2 = 0.22). For
Satterthwaite’s test and the conditional t-test respectively, the major factors were
sample size ratio (η2 = 0.15; η2 = 0.18), total sample size (η2 = 0.18; η2 = 0.14), and
the interaction between sample size ratio and total sample size (η2 = 0.26; η2 = 0.36).
An analysis of the sole impact of distribution shape on Type I error rates of the
three tests showed that Type I error rate of Satterthwaite's test was most affected
(η2 = 0.07). While Type I error rate of the independent means t-test was least
impacted by the distribution shape (η2 = 0.001), Type I error rate of the conditional
t-test was also impacted (η2 = 0.04) but to a much lesser degree in comparison with
that of Satterthwaite's test.
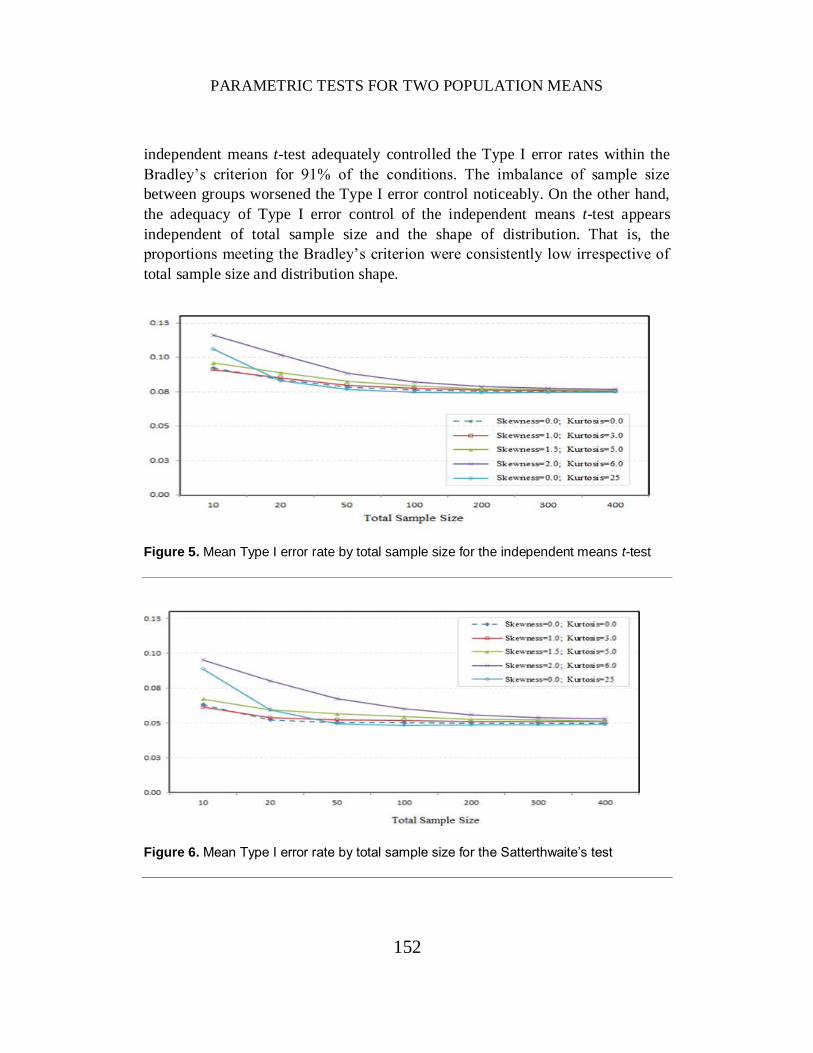
The mean Type I error rates by total sample size and distribution shape for
the independent means t-test and Satterthwaite's test under the nominal alpha level
of .05 are presented in Figures 5 and 6. The graph for the conditional t-test is similar
to that for Satterthwaite’s test. The mean Type I error rates of the independent
means t-test are much above the nominal alpha level in all conditions of distribution
shapes and total sample sizes (see Figure 5). Although the mean estimated Type I
error rates decrease with larger samples, they remain substantially greater than 0.05.
In contrast, both Satterthwaite’s test and the conditional t-test provided much better
Type I error control except for extremely small sample sizes (i.e., total sample size
of 10 or 20) or the extremely skewed distribution (e.g., skewness of 2) (see Figure
6 for Satterthwaite’s test).
The factors related to the Bradley proportions vary across tests (Table 2). For
the independent means t-test, sample size ratio and variance ratio between the two
populations emerged as primary factors making an impact on the Type I error
control. Although the overall proportions of cases meeting the Bradley’s criterion
for the independent means t-test were very low (below 50%), the Type I error rates
were perfectly controlled when the homogeneity of variance assumption was met
(i.e., variance ratio between groups = 1:1). As the disproportion of two group
variances became larger to 1:20, the Type I error control of independent means
t-test diminished considerably. When the two groups have equal sample size, the
PARAMETRIC TESTS FOR TWO POPULATION MEANS
152
independent means t-test adequately controlled the Type I error rates within the
Bradley’s criterion for 91% of the conditions. The imbalance of sample size
between groups worsened the Type I error control noticeably. On the other hand,
the adequacy of Type I error control of the independent means t-test appears
independent of total sample size and the shape of distribution. That is, the
proportions meeting the Bradley’s criterion were consistently low irrespective of
total sample size and distribution shape.
Figure 5. Mean Type I error rate by total sample size for the independent means t-test
Figure 6. Mean Type I error rate by total sample size for the Satterthwaite’s test
NGUYEN ET AL
153
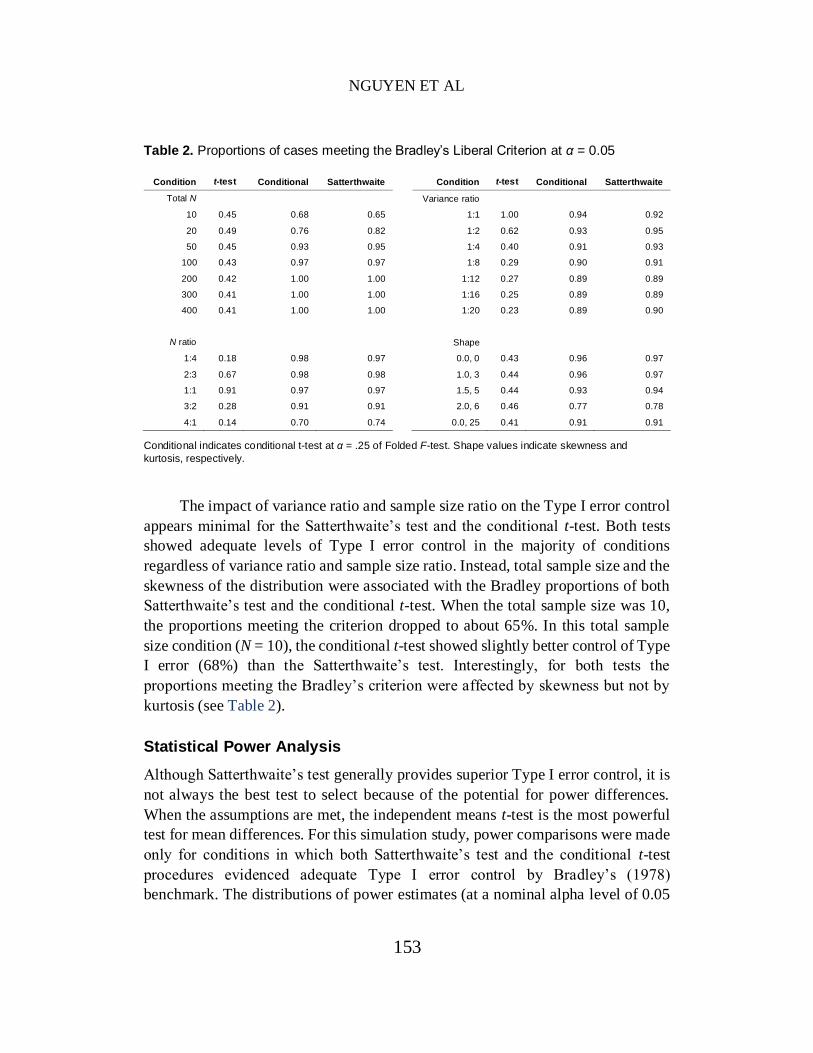
Table 2. Proportions of cases meeting the Bradley’s Liberal Criterion at α = 0.05
Condition t-test Conditional Satterthwaite Condition t-test Conditional Satterthwaite
Total N Variance ratio
10 0.45 0.68 0.65 1:1 1.00 0.94 0.92
20 0.49 0.76 0.82 1:2 0.62 0.93 0.95
50 0.45 0.93 0.95 1:4 0.40 0.91 0.93
100 0.43 0.97 0.97 1:8 0.29 0.90 0.91
200 0.42 1.00 1.00 1:12 0.27 0.89 0.89
300 0.41 1.00 1.00 1:16 0.25 0.89 0.89
400 0.41 1.00 1.00 1:20 0.23 0.89 0.90
N ratio Shape
1:4 0.18 0.98 0.97 0.0, 0 0.43 0.96 0.97
2:3 0.67 0.98 0.98 1.0, 3 0.44 0.96 0.97
1:1 0.91 0.97 0.97 1.5, 5 0.44 0.93 0.94
3:2 0.28 0.91 0.91 2.0, 6 0.46 0.77 0.78
4:1 0.14 0.70 0.74 0.0, 25 0.41 0.91 0.91
Conditional indicates conditional t-test at α = .25 of Folded F-test. Shape values indicate skewness and
kurtosis, respectively.
The impact of variance ratio and sample size ratio on the Type I error control
appears minimal for the Satterthwaite’s test and the conditional t-test. Both tests
showed adequate levels of Type I error control in the majority of conditions
regardless of variance ratio and sample size ratio. Instead, total sample size and the
skewness of the distribution were associated with the Bradley proportions of both
Satterthwaite’s test and the conditional t-test. When the total sample size was 10,
the proportions meeting the criterion dropped to about 65%. In this total sample
size condition (N = 10), the conditional t-test showed slightly better control of Type
I error (68%) than the Satterthwaite’s test. Interestingly, for both tests the
proportions meeting the Bradley’s criterion were affected by skewness but not by
kurtosis (see Table 2).
Statistical Power Analysis
Although Satterthwaite’s test generally provides superior Type I error control, it is
not always the best test to select because of the potential for power differences.
When the assumptions are met, the independent means t-test is the most powerful
test for mean differences. For this simulation study, power comparisons were made
only for conditions in which both Satterthwaite’s test and the conditional t-test
procedures evidenced adequate Type I error control by Bradley’s (1978)
benchmark. The distributions of power estimates (at a nominal alpha level of 0.05

PARAMETRIC TESTS FOR TWO POPULATION MEANS
154
for the tests of means) for Satterthwaite’s test and the conditional t-test (using an
alpha level of 0.25 for the Folded F-test) showed that the power differences
between the tests were small.
Figure 7 presents a scatter plot of the power estimates for Satterthwaite’s test
and the conditional t-test (using an alpha level of 0.25 for the Folded F-test). Data
points above the line represent conditions in which the conditional t-test was more
powerful than Satterthwaite’s test, while those below the line are conditions in
which Satterthwaite’s test is more powerful. Overall, the conditional t-test, using
an alpha level of 0.25 for the Folded F-test of variances, was more powerful in 29%
of the conditions, while Satterthwaite’s test was more powerful in only 23% of the
conditions (identical power estimates were obtained in the other conditions).
To identify research design factors associated with power differences between
these two tests, the percentages of conditions in which each test evidenced power
advantages were disaggregated by the simulation design factors (Table 3). For
conditions with homogeneous variances, the conditional t-test evidenced more
power than the Satterthwaite’s test in 61.64% of the conditions, while the
Satterthwaite’s test was more powerful in 20.55% of the conditions (in the
Figure 7. Scatterplot of power estimates for the conditional t-test and Satterthwaite’s
approximate t-test
0.00
0.10
0.20
0.30
0.40
0.50
0.60
0.70
0.80
0.90
1.00
0.00 0.20 0.40 0.60 0.80 1.00
Po
we
r o
f C
on
ditio
na
l t-t
est
Power of Satterthwaite's Approximate t-test

NGUYEN ET AL
155
remaining conditions, the two tests evidenced equal power). As the variance ratios
increased, the power advantages of the conditional t-test diminished, such that the
Satterthwaite’s test was more often the more powerful test when the population
variance ratio was 1:8 or larger.
With balanced samples the conditional t-test was more powerful in 35.38%
of the conditions and Satterthwaite’s test was never more powerful. With
unbalanced samples in which the larger sample is drawn from the population with
the larger variance (in heterogeneous populations), the Satterthwaite’s test presents
notable power advantages (44.77% and 51.03% of the cases with sample size ratios
of 2:3 and 1:4, respectively). In contrast, when the larger sample is drawn from the
population with the smaller variance, the conditional t-test evidences more power
than the Satterthwaite’s test (47.68% and 48.52% of the conditions with sample
size ratios of 3:2 and 4:1, respectively). The results by total sample size show that
the conditional t-test is more powerful in more conditions, except for the smallest
sample sizes examined (N = 10). Finally, the conditional t-test is more powerful in
more conditions for all distribution shapes except for the most skewed distribution
examined (i.e. skewness of 2, kurtosis of 6). Table 3. Percentage of simulation conditions by simulation design factors in which the
conditional t-test and Satterthwaite’s test were more powerful
Condition Conditional Satterthwaite Condition Conditional Satterthwaite
Total N Variance ratio
10 48.97 51.03 1:1 61.64 20.55
20 54.89 44.11 1:2 43.15 34.97
50 44.79 28.83 1:4 31.03 29.35
100 29.22 20.98 1:8 21.02 22.08
200 19.43 12.38 1:12 16.56 18.06
300 11.62 9.52 1:16 14.62 17.63
400 8.19 7.81 1:20 13.25 15.81
N ratio Shape
1:4 10.59 53.95 0.0, 0 29.20 15.67
2:3 9.21 44.77 1.0, 3 29.60 21.98
1:1 35.58 0.00 1.5, 5 28.17 24.63
3:2 47.68 4.04 2.0, 6 21.69 24.51
4:1 48.52 4.54 0.0, 25 34.98 27.50
Conditional indicates conditional t-test at α = 0.25 of Folded F-test. Shape values indicate skewness and
kurtosis, respectively

PARAMETRIC TESTS FOR TWO POPULATION MEANS
156
Conclusion
The testing of differences between two population means is a fundamental
statistical application, but controversy about the appropriate test to use has been
evident for many years. When conducting the independent means t-test, major
statistical software programs (e.g., SAS and SPSS) automatically produce the
results of the independent means t-test and the alternative Satterthwaite’s test.
Depending on the statistical significance of homogeneous variance testing (Folded
F-test in SAS and Levene’s F test in SPSS), researchers are recommended to follow
one of the options; this has been a common practice in studies comparing two
population means. However, recent studies on the conditional t-tests in comparison
to Satterthwaite’s test have strongly supported the Satterthwaite’s test over the
conditional t-test and suggested even abandoning the conventional practice of
selecting one of the options based on the results of the homogeneity of variance test.
Considering the ongoing controversy surrounding these tests and the frequency
with which two means are compared in applied research, in this simulation study
we investigated the performance of the independent means t-test, Satterthwaite’s
approximate t-test, and the conditional t-test under the manipulated conditions of
population distribution shape, total sample size, sample size ratio between groups,
variance ratio between populations, difference in means between populations, alpha
level for testing the treatment effect, and alpha level for testing the homogeneity
assumption for the conditional t-test. Type I error control and power analysis were
used to examine the performance of these testing procedures.
As expected, the independent means t-test performed very well on Type I
error control when the homogeneity assumption was met regardless of the tenability
of the normality assumption. This reminds us of the long-known property that the
independent means t-test requires the homogeneity assumption to be met and this
test is robust to violations of the normality assumption when two population
variances are equal. Furthermore, the independent means t-test showed adequate
Type I error control when sample sizes in the two groups were equal under the
normal distribution. This re-emphasizes another well-known property that the
independent means t-test is robust to violations of the homogeneity assumption
when the sample sizes are equal under the normal distribution. Under these
conditions, the independent means t-test is the best method to test the difference
between two independent means. This testing procedure also provides more
statistical power. On the other hand, the t-test evidenced poor Type I error control
under heterogeneous variances with non-normal distributions. Thus, two

NGUYEN ET AL
157
alternatives, Satterthwaite’s test and the conditional t-test, were considered in this
study.
It was also found that the Type I error rate of the conditional t-test was
affected by the alpha level for the Folded F-test that was used to test the
homogeneity assumption of population variances. The more conservative alpha
levels for the Folded F-test resulted in larger Type I error rates for the conditional
test because of lower statistical power, such that the Folded F-test is less likely to
detect the true difference between population variances. This leads us to re-consider
the conventional procedures for examining the difference between two population
means. Thus, the conditional t-test using a relatively large alpha level for the Folded
F-test may be an appropriate alternative.
Overall, Satterthwaite’s test performed best in control of Type I error rate but
the conditional t-test also yielded comparable results using a large alpha level of .25
for the Folded F-test. Both alternatives made a tremendous improvement in Type I
error control, compared to the independent means t-test, when group variances were
unequal. Extreme skewness (e.g. skewness of 2) contaminated the Type I error
control for both alternative testing procedures. Kurtosis seemed not to have this
kind of impact. Increasing total sample size was found in this study to improve
Type I error control for both testing procedures, but not for the independent t-test.
When total sample size was 200 or more, Bradley’s rates were 100% for both
alternative testing procedures. Although Satterthwaite’s test provides slightly better
Type I error control, the use of the conditional t-test may have a slight power
advantage.
Recommendations. With equal sample size the independent means t-test is the
appropriate testing procedure to examine the difference of two independent group
means because it provides adequate Type I error control and more statistical power.
With unequal sample size the Folded F-test can provide reasonable guidance in the
choice between the independent t-test and Satterthwaite’s test. A large alpha level
of .25 is recommended to evaluate the results of the Folded F-test. If the F value is
not statistically significant at this large alpha level, then the independent means
t-test should be used. In contrast, if the F value is statistically significant at this
large alpha level, then Satterthwaite’s test should be chosen. Finally, the confidence
in this conditional testing procedure increases as the sample sizes become larger.
To adequately control for Type I error rate in the conditional testing procedure, a
total sample size of at least 200 is recommended with extremely skewed
populations (e.g. skewness of 2). For less skewed populations, a total sample size
of at least 100 is recommended. With a total sample size smaller than these
PARAMETRIC TESTS FOR TWO POPULATION MEANS
158
recommended in the corresponding conditions, the Type I error control resulting
from any of these testing procedures may be questionable.
References
Bradley, J. V. (1978). Robustness? British Journal of Mathematical and
Statistical Psychology, 31(2), 144-152. doi: 10.1111/j.2044-8317.1978.tb00581.x
Bridge, P. D., & Sawilowsky, S. S. (1999). Increasing physicians’
awareness of the impact of statistics on research outcomes: Comparative power of
the t-test and Wilcox Rank-Sum test in small samples applied research. Journal of
Clinical Epidemiology, 52(3), pp. 229-235. doi: 10.1016/S0895-4356(98)00168-1
Cody, R. P., & Smith, J. K. (1997). Applied statistics and the SAS
programming language (4th ed.). Upper Saddle River, NJ: Prentice Hall.
Gravetter, F. J., & Wallnau, L. B. (2011). Essentials of Statistics for the
Behavioral Sciences (6th ed.). Belmont, CA: Wadsworth, Cengage Learning.
Grissom, R. J. (2000). Heterogeneity of variance in clinical data. Journal of
Consulting and Clinical Psychology, 68(1), 155-165. doi: 10.1037/0022-
006X.68.1.155
Hayes, A. F., & Cai, L. (2007). Further evaluating the conditional decision
rule for comparing independent means. British Journal of Mathematical and
Statistical Psychology, 60(2), 217-244. doi: 10.1348/000711005X62576
Micceri, T. (1989). The unicorn, the normal curve, and the other improbable
creatures. Psychological Bulletin, 105(1), 156-166. doi: 10.1037/0033-
2909.105.1.156
Moser, B. K., Stevens, G. R., & Watts, C. L. (1989). The two-sample t test
versus Satterthwaite’s approximate f test. Communications in Statistics: Theory
and Methods, 18(11), 3963-3975. doi: 10.1080/03610928908830135
Rasch, D., Kubinger, K. D., & Moder, K. (2011). The two-sample t test: pre-
testing its assumptions does not pay off. Statistical Papers, 52(1), 219-231. doi:
10.1007/s00362-009-0224-x
Robey, R. R., & Barcikowski, R. S. (1992). Type I error and the number of
iterations in Monte Carlo studies of robustness. British Journal of Mathematical
and Statistical Psychology, 45(2), 283-288. doi: 10.1111/j.2044-
8317.1992.tb00993.x
Schlotzhauer, S., & Littell, R. (1997). SAS System for elementary statistical
analysis (2nd ed.). Cary, NC: SAS Institute.

NGUYEN ET AL
159
Wilcox, R. R. (1987). New designs in analysis of variance. Annual Review
of Psychology, 38, 29-60. doi: 10.1146/annurev.ps.38.020187.000333
Zimmerman, D. W. (2004). A note on preliminary tests of equality of
variances. British Journal of Mathematical and Statistical Psychology, 57(1),
173-181. doi: 10.1348/000711004849222


![Ch11 [Non-Parametric Tests]](https://img.dokumen.tips/doc/110x75/577cd3291a28ab9e7896d6ef/ch11-non-parametric-tests.jpg)