Embed Size (px)
Citation preview
PARAMETRIC STUDY ON REINFORCED CONCRETE JACKETED
COLUMNS: COMPARISON OF CHANGES IN BEHAVIOR DUE TO
CHANGES IN REINFORCEMENT PATTERN
A. A. Saeem*, M. S. Ahmed, M. M. Rahman, I. Chowdhury & M. R. Alam
Department of Civil Engineering, Chittagong University of Engineering and Technology, Chittagong,
Bangladesh *Corresponding Author: [email protected]
ABSTRACT
This paper contains a parametric study on re-strengthening of rectangular RC columns using different
widely practiced RC jacketing techniques. Finite element program ANSYS Multi Physics is utilized for
non-linear finite element analysis owing to its capabilities to predict and pictorially represent the
response of RC columns in post-elastic range to the ultimate strength. Comparisons are done among
four different popular techniques of RC jacketing to find out the link between reinforcement pattern and
columns’ structural behaviour, i.e., lateral and axial deformation response and crack formation. A
rectangular RC column without retrofitting is analysed and then it is retrofitted to a target ultimate
strength theoretically in four distinct ways: retrofitted with (i) one reinforcing bar at each corner; (ii)
two reinforcing bars at each corner; (iii) three reinforcing bars at each corner with diagonal confinement
bar at corners; and (iv) four reinforcing bars at each corner having two layers of additional tie bars and
analysed. The study finds the jacketing technique (iii) to be the most efficient for jacket of RC column.
Keywords: ANSYS; finite element analysis; interface; RC column jacketing; re-strengthening
INTRODUCTION
Reinforced concrete members are often damaged due to natural disasters, notably earthquakes,
overloading, change in building usage and so on. Damage may take place in almost all parts of a
structure, namely slabs, beams, columns, walls etc. Rehabilitation is needed after the damage has taken
place to bring the damaged member to the strength previously existed. Re-strengthening is also carried
out when the purpose of an existing structure changes, predicted load increases or environmental load
increases than that was taken into account when designed. Re-strengthening of reinforced concrete
members has become very common in the modern world. There are different retrofitting techniques for
different members of a structure. Jacketing is the most popularly used method for strengthening of
building columns. The most common types of jackets are steel jacket, reinforced concrete jacket, fiber
reinforced polymer composite jacket, jacket with high tension materials like carbon fiber, glass fiber
etc. Enlargement of the existing structural members such as column and beam sections by placing
reinforcing steel rebars around its periphery and then concreting it is widely adopted option; which is
referred as concrete jacketing. This method significantly increases the member sizes and thereby its
stiffness. Concrete Jacketing primarily enhances the confinement along with the shear and axial
behaviour in case of columns.
There is a wide spectrum of published work on column jacketing. The published work emphasizes
finding out the minimum requirements, interface treatment and the failure type. Several experimental
and numerical analyses show the minimum requirements for reinforced concrete column jacketing
(Vedprakash et. al., 2014, Pravin et. al., 2011). Strength of the new materials will be equal or greater
than those of the existing column. Minimum jacket thickness will be 4". All published work on RC
jacketing recognize the importance of interface preparation to achieve a good bond between the original
column and the added jacket so that the resulting element behaves monolithically (Ju´lio et. al., 2003).
The current practice of surface treatment in several countries consists increasing surface roughness,
application of bonding agent and application of steel connectors. Hand chipping, sand-blasting,
jack-hammering, electric hammering, water demolition and iron brushing are the most common surface
Proceedings of 3rd International Conference on Advances in Civil Engineering, 21-23 December 2016, CUET, Chittagong, Bangladesh Islam, Imam, Ali, Hoque, Rahman and Haque (eds.)
480
roughening methods. Several authors state that increasing the roughness of the interface surface is
necessary, but its influence has not been quantified (Rodriguez et. al., 1994, Bett et. al., 1988, Alcocer
et. al., 1990). Several publications conclude that adding steel connectors crossing the interface does not
meaningfully increase the debonding force, but increases almost directly the longitudinal shear strength
considering slipping (Ju´lio et. al., 2001). In this work, a comparison among various techniques (Teran
et. al., 1992) of RC jacketing is done using ANSYS Multi Physics computer program. This study aims
to investigate and compute the lateral and axial deformation responses at different stages of axial
incremental loading and find the effect of reinforcement pattern on lateral and axial deformation
responses and crack formation.
NUMERICAL MODELING IN ANSYS
The concrete material model predicts the failure of brittle materials. An eight-node solid element
SOLID65 is used to model the concrete. The solid is capable of cracking in tension and crushing in
compression. The element is defined by eight nodes having three degrees of freedom at each node:
translations in the nodal x, y and z directions. Link8 element is used to model the steel reinforcement.
LINK8 is a 3-D spar element which is a uniaxial tension-compression element with three degrees of
freedom at each node: translations in the nodal x, y, and z directions. Interface surface is created using
TARGE170 and CONTA174 geometries. For 3D modeling, the surface of old concrete is taken as
contact surface and the surface of new concrete is taken as target surface by default. Then a contact pair
is created using standard contact behavior. Default values of normal penalty stiffness and penetration
tolerance are allowed for the surface to surface contact creation. Maximum friction stress is taken to be
1x10²⁰ psi.
The criterion for failure of concrete due to a multi-axial stress is controlled by the expression given by
Willam and Warnke (1975).
𝐹/𝑓𝑐−𝑆≥0
where, F = a function of the principal stress state (𝜎𝑥𝑝, 𝜎y𝑝, 𝜎𝑧𝑝); S = failure surface expressed in terms of
principal stresses and five input parameters 𝑓t, 𝑓𝑐, 𝑓𝑐𝑏, 𝑓1 and 𝑓2; 𝑓𝑐 = uniaxial crushing strength; σxp, σyp,
σzp = principal stresses in principal directions. However, the failure surface can be specified with a
minimum of two constants, ft and fc. The other three constants default to Willam and Warnke:
𝑓1=1.45𝑓𝑐 ; 𝑓2=1.725𝑓𝑐 ; 𝑓𝑐𝑏=1.2𝑓𝑐
These default values are valid only for stress states where the condition
|𝜎ℎ|≤√3 𝑓𝑐 ; 𝜎ℎ=Hydrostatic stress rate=(1/3)(𝜎𝑥𝑝+ 𝜎𝑦𝑝+ 𝜎𝑧𝑝)
is satisfied. This condition equation applies to stress situations with a low hydrostatic stress component.
All five failure parameters should be specified when a large hydrostatic stress component is expected. If
condition equation is not satisfied, the strength of the concrete material may be incorrectly evaluated.
When the crushing capability is suppressed with 𝑓𝑐 = -1.0, the material cracks whenever a principal
stress component exceeds 𝑓t.
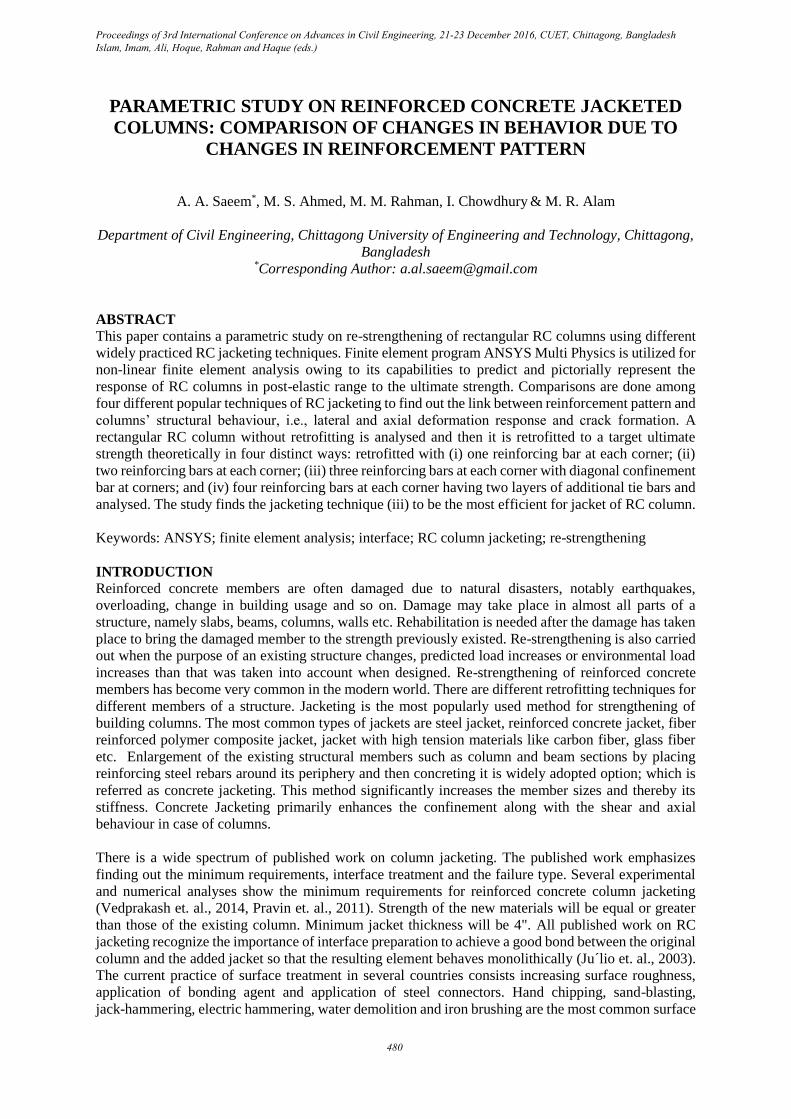
Fig. 1: 3-D failure surface in principal stress space
(ANSYS, 2011)
Fig. 2: Failure surface in principal stress space with
nearly biaxial stress (ANSYS, 2011)
Both the function F and the failure surface S are expressed in terms of principal stresses denoted as, 𝜎1,
𝜎2, and 𝜎3 where:
𝜎1=max (𝜎𝑥𝑝, 𝜎𝑦𝑝, 𝜎𝑧𝑝); 𝜎3 = min (𝜎𝑥𝑝, 𝜎𝑦𝑝, 𝜎𝑧𝑝) and 𝜎1 ≥ 𝜎2≥𝜎3.
The failure of concrete is categorized into four domains:
0 ≥ 𝜎1 ≥ 𝜎2≥𝜎3 (compression - compression - compression)
𝜎1 ≥ 0 ≥𝜎2 ≥ 𝜎3 (tensile - compression - compression)
Proceedings of 3rd International Conference on Advances in Civil Engineering, 21-23 December 2016, CUET, Chittagong, Bangladesh Islam, Imam, Ali, Hoque, Rahman and Haque (eds.)
481

𝜎1 ≥𝜎2 ≥ 0 ≥𝜎3 (tensile - tensile - compression)
𝜎1 ≥𝜎2 ≥𝜎3 ≥0 (tensile - tensile - tensile)
In each domain, independent functions describe F and the failure surface S. The four functions
describing the general function F are denoted as 𝐹1, 𝐹2,𝐹3, and 𝐹4 while the functions describing S are
denoted as, 𝑆1, 𝑆2 , 𝑆3 , and 𝑆4. The functions (i = 1-4) have the properties that the surface they describe
is continuous while the surface gradients are not continuous when any one of the principal stresses
changes sign. In this work, a 12"x12" column is taken to be re-strengthened. The dimensions of jacket
(4" at each side) for all four techniques are kept unaltered. Length of each model is 10 ft. The design is
done in such a way that the compressive strength of the four models after re-strengthening are
theoretically equal. The design compressive strength for non-jacketed (A) and jacketed (B, C, D, E)
columns are 433.8 kips and 1115.2 kips whereas the nominal compressive strength are 667.4 kips and
1715.6 kips respectively. The modelling of interface surface is done in the same way for four models.
These conditions ensure that the change in structural responses with incremental loading obtained in
numerical analysis will be controlled only by reinforcement pattern.
Table 1: Details of numerical modelling in ANSYS
A B C D E
Plan view
Isometric
view
Size 12″x12″ 20″x20″ 20″x20″ 20″x20″ 20″x20″
Longitudinal
Steel 4#8φ 8#8φ Equivalent to
8#8φ
Equivalent to
8#8φ
Equivalent to
8#8φ
Transverse
Steel
#3φ @12″
c/c
#3φ @6″ c/c Equivalent to #3φ
@6″ c/c
Equivalent to #3φ
@6″ c/c
Equivalent to #3φ
@6″ c/c
Material Properties
The properties of concrete and reinforcing steel are as the table below.
Table 2: Material Properties
Concrete Reinforcing Steel
Property Value Property Value
Compressive Strength 4000 psi Modulus of Elasticity 2.9x10⁷ psi
Modulus of Elasticity 3.605x10⁶ psi Poisson’s Ratio 0.3
Poisson’s Ratio 0.18 Yield Strength 60000 psi
Uniaxial Cracking Stress 474.34 psi Tangent Modulus 2900 psi
Open shear transfer coefficient 0.3
Closed shear transfer coefficient 1
Element Meshing
After modeling and inputting all the data the models are meshed. The original column (A) is subdivided
into 6x6x20=720 elements whereas the retrofitted columns (B, C, D and E) are subdivided into
10x10x20=2000 elements. Each element sizes 2″x2″x6″. The mesh size is kept the same in contact
surface i.e. 2″x6″. Number of elements in contact surface is 6x20x4=480.
Proceedings of 3rd International Conference on Advances in Civil Engineering, 21-23 December 2016, CUET, Chittagong, Bangladesh Islam, Imam, Ali, Hoque, Rahman and Haque (eds.)
482
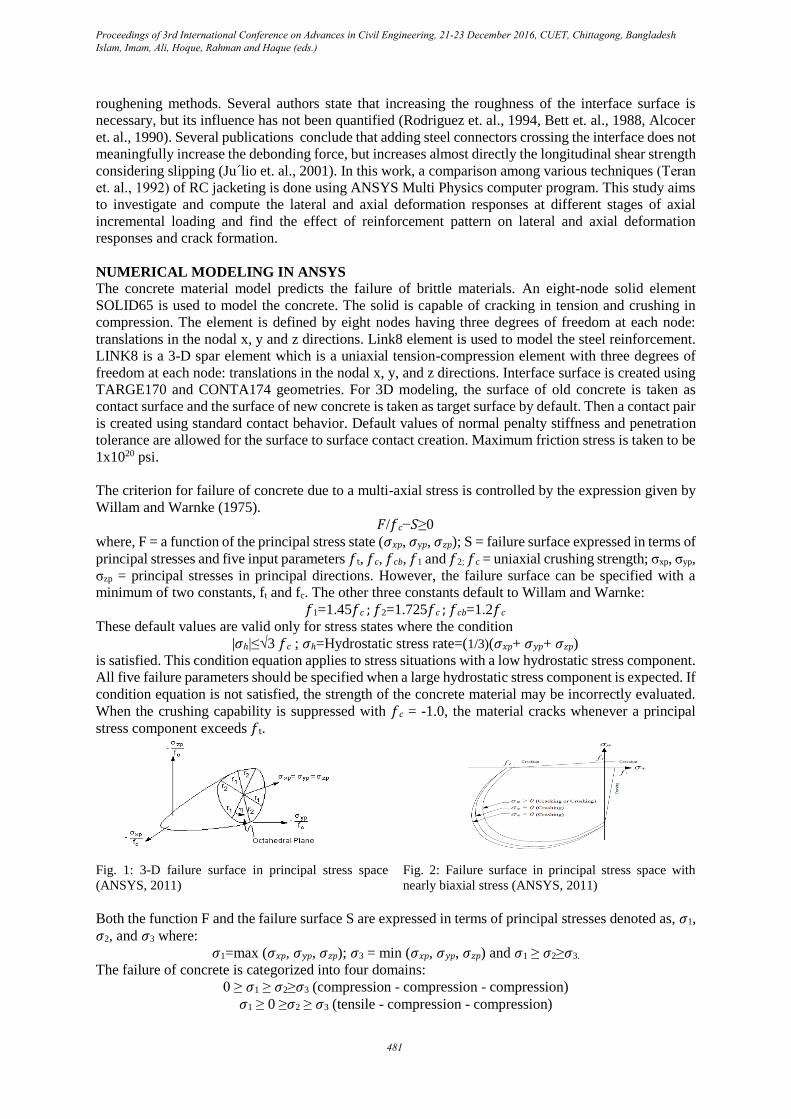
Loads and boundary condition Displacement boundary conditions are needed to be constrained in the model to get a unique solution.
To ensure that the model acts the same way as the experimental columns specimens, boundary
conditions need to be applied where the supports and loadings exist. For concentric columns model the
displacement of all nodes at bottom base of column in x, y and z. directions is held zero ( Ux=0 , Uz=0
and Uy=0 ). To apply the axial load on the top of the concentric column specimens, loads were applied
on each nodes at the top of the columns.
(a)
(b)
(c)
(d)
Interface
Surface
Modelling
Boundary
Conditions
Top view Top view
Front view Front
view
Fig. 3: Interface and Boundary
Conditions
Fig. 4: Selected directions for structural response comparison
RESULTS AND DISCUSSIONS
In the following section, the four models of RC jacketing will be compared on the basis of
load-deflection plots at selected locations on the columns, first cracking loads and loads at failure.
First Cracking Load
The analysis of the five column models shows the following first cracking loads. The increment of the
first cracking load with compared to model A is also shown in the Table 3.
Table 3: Comparison of first cracking load
Displacements and Stresses
Four directions are selected for the comparison of displacements and stresses as shown in Fig. 4. Total
72 different comparison are made on displacements (i.e. x-component of displacement, y- component
of displacement, z- component of displacement and displacement vector sum) and stresses (i.e. 1st
principal stress, 2nd principal stress, 3rd principal stress, stress intensity and equivalent Von Mises
stress). Some of the comparisons are shown in Fig. 5 to Fig. 12.
Fig. 5 shows that at top edge nodes of plan displacement is maximum at two opposite sides and
decreases from side to middle. Displacement plot shows that displacement both at middle and side are
minimum for model D at the same concentric loading condition.
Model A B C D E
First Cracking Load (Kips) 230.6 648.6 619.9 652.1 648.3
Increment (compared to A), % 0.00
181.27
168.82
182.78
181.1
4
Proceedings of 3rd International Conference on Advances in Civil Engineering, 21-23 December 2016, CUET, Chittagong, Bangladesh Islam, Imam, Ali, Hoque, Rahman and Haque (eds.)
483
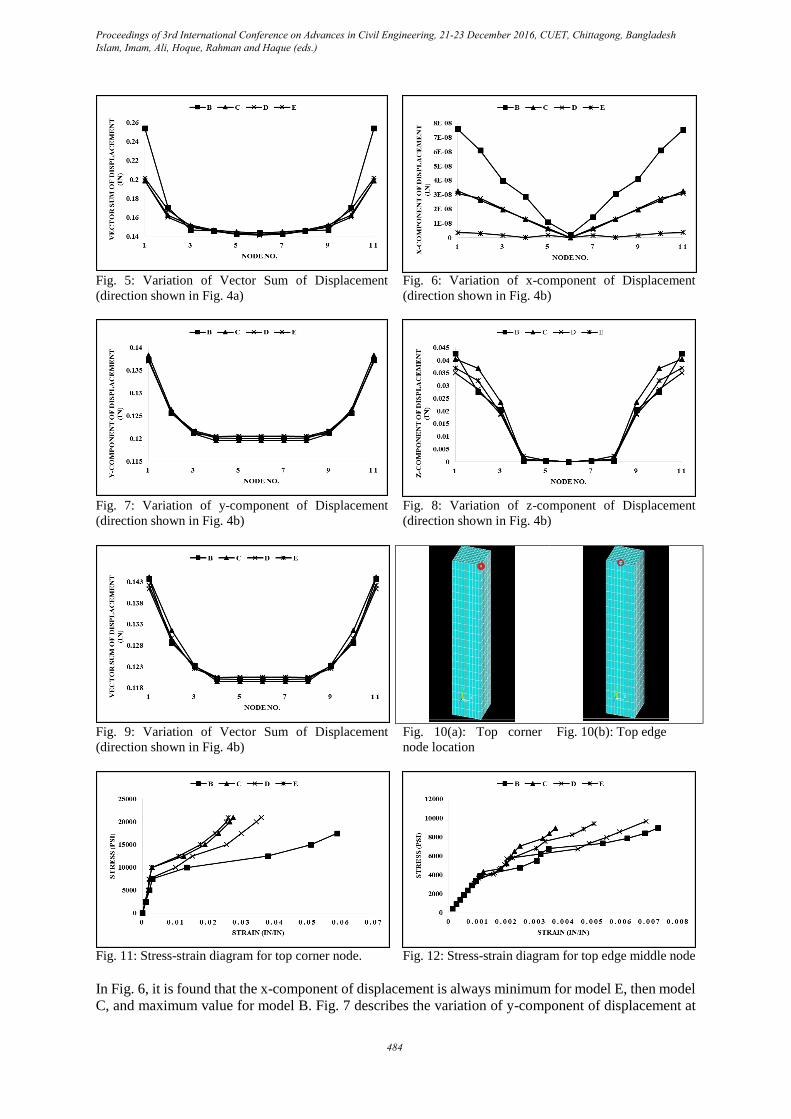
Fig. 5: Variation of Vector Sum of Displacement
(direction shown in Fig. 4a)
Fig. 6: Variation of x-component of Displacement
(direction shown in Fig. 4b)
Fig. 7: Variation of y-component of Displacement
(direction shown in Fig. 4b)
Fig. 8: Variation of z-component of Displacement
(direction shown in Fig. 4b)
Fig. 9: Variation of Vector Sum of Displacement
(direction shown in Fig. 4b)
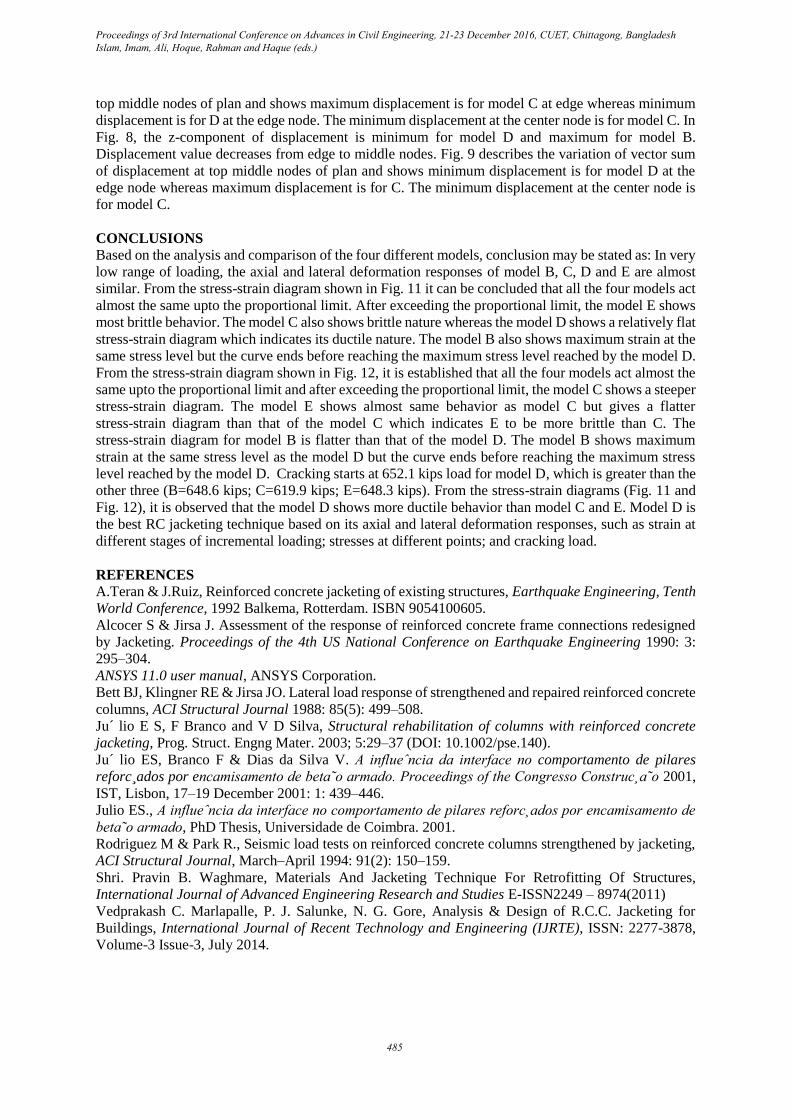
Fig. 10(a): Top corner
node location
Fig. 10(b): Top edge
Fig. 11: Stress-strain diagram for top corner node. Fig. 12: Stress-strain diagram for top edge middle node
In Fig. 6, it is found that the x-component of displacement is always minimum for model E, then model
C, and maximum value for model B. Fig. 7 describes the variation of y-component of displacement at
Proceedings of 3rd International Conference on Advances in Civil Engineering, 21-23 December 2016, CUET, Chittagong, Bangladesh Islam, Imam, Ali, Hoque, Rahman and Haque (eds.)
484
top middle nodes of plan and shows maximum displacement is for model C at edge whereas minimum
displacement is for D at the edge node. The minimum displacement at the center node is for model C. In
Fig. 8, the z-component of displacement is minimum for model D and maximum for model B.
Displacement value decreases from edge to middle nodes. Fig. 9 describes the variation of vector sum
of displacement at top middle nodes of plan and shows minimum displacement is for model D at the
edge node whereas maximum displacement is for C. The minimum displacement at the center node is
for model C.
CONCLUSIONS
Based on the analysis and comparison of the four different models, conclusion may be stated as: In very
low range of loading, the axial and lateral deformation responses of model B, C, D and E are almost
similar. From the stress-strain diagram shown in Fig. 11 it can be concluded that all the four models act
almost the same upto the proportional limit. After exceeding the proportional limit, the model E shows
most brittle behavior. The model C also shows brittle nature whereas the model D shows a relatively flat
stress-strain diagram which indicates its ductile nature. The model B also shows maximum strain at the
same stress level but the curve ends before reaching the maximum stress level reached by the model D.
From the stress-strain diagram shown in Fig. 12, it is established that all the four models act almost the
same upto the proportional limit and after exceeding the proportional limit, the model C shows a steeper
stress-strain diagram. The model E shows almost same behavior as model C but gives a flatter
stress-strain diagram than that of the model C which indicates E to be more brittle than C. The
stress-strain diagram for model B is flatter than that of the model D. The model B shows maximum
strain at the same stress level as the model D but the curve ends before reaching the maximum stress
level reached by the model D. Cracking starts at 652.1 kips load for model D, which is greater than the
other three (B=648.6 kips; C=619.9 kips; E=648.3 kips). From the stress-strain diagrams (Fig. 11 and
Fig. 12), it is observed that the model D shows more ductile behavior than model C and E. Model D is
the best RC jacketing technique based on its axial and lateral deformation responses, such as strain at
different stages of incremental loading; stresses at different points; and cracking load.
REFERENCES
A.Teran & J.Ruiz, Reinforced concrete jacketing of existing structures, Earthquake Engineering, Tenth
World Conference, 1992 Balkema, Rotterdam. ISBN 9054100605.
Alcocer S & Jirsa J. Assessment of the response of reinforced concrete frame connections redesigned
by Jacketing. Proceedings of the 4th US National Conference on Earthquake Engineering 1990: 3:
295–304.
ANSYS 11.0 user manual, ANSYS Corporation.
Bett BJ, Klingner RE & Jirsa JO. Lateral load response of strengthened and repaired reinforced concrete
columns, ACI Structural Journal 1988: 85(5): 499–508.
Ju´ lio E S, F Branco and V D Silva, Structural rehabilitation of columns with reinforced concrete
jacketing, Prog. Struct. Engng Mater. 2003; 5:29–37 (DOI: 10.1002/pse.140).
Ju´ lio ES, Branco F & Dias da Silva V. A influeˆncia da interface no comportamento de pilares
reforc¸ados por encamisamento de beta˜o armado. Proceedings of the Congresso Construc¸a˜o 2001,
IST, Lisbon, 17–19 December 2001: 1: 439–446.
Julio ES., A influeˆncia da interface no comportamento de pilares reforc¸ados por encamisamento de
beta˜o armado, PhD Thesis, Universidade de Coimbra. 2001.
Rodriguez M & Park R., Seismic load tests on reinforced concrete columns strengthened by jacketing,
ACI Structural Journal, March–April 1994: 91(2): 150–159.
Shri. Pravin B. Waghmare, Materials And Jacketing Technique For Retrofitting Of Structures,
International Journal of Advanced Engineering Research and Studies E-ISSN2249 – 8974(2011)
Vedprakash C. Marlapalle, P. J. Salunke, N. G. Gore, Analysis & Design of R.C.C. Jacketing for
Buildings, International Journal of Recent Technology and Engineering (IJRTE), ISSN: 2277-3878,
Volume-3 Issue-3, July 2014.
Proceedings of 3rd International Conference on Advances in Civil Engineering, 21-23 December 2016, CUET, Chittagong, Bangladesh Islam, Imam, Ali, Hoque, Rahman and Haque (eds.)
485