Embed Size (px)
Citation preview

1
Parameterization of Cirrus Cloud Formation in Large Scale Models: 1
Homogeneous Nucleation. 2
3
Donifan Barahona1 and Athanasios Nenes1,2* 4
1School of Chemical and Biomolecular Engineering, Georgia Institute of Technology 5
2School of Earth and Atmospheric Sciences, Georgia Institute of Technology 6
311 Ferst Dr., Atlanta, GA, 30332, USA 7
8
9
10
11
*Corresponding author 12
13
14
15
16
17
18
19
20
21
22
23

2
Abstract 24
This work presents a new physically-based parameterization of cirrus cloud formation for 25
use in large scale models which is robust, computationally efficient, and links chemical 26
effects (e.g., water activity and water vapor deposition effects) with ice formation via 27
homogenous freezing. The parameterization formulation is based on ascending parcel 28
theory, and provides expressions for the ice crystal size distribution and the crystal 29
number concentration, explicitly considering the effects of aerosol size and number, 30
updraft velocity, and deposition coefficient. The parameterization is evaluated against a 31
detailed numerical cirrus cloud parcel model (also developed during this study) where the 32
solution of equations is obtained using a novel Lagrangian particle tracking scheme. Over 33
a broad range of cirrus forming conditions, the parameterization reproduces the results of 34
the parcel model within a factor of two and with an average relative error of -15%. If 35
numerical model simulations are used to constraint the parameterization, error further 36
decreases to 1 ± 28%. 37
38
39
40
41
42
43
44
45

3
1 Introduction 46
The effect of aerosols on clouds and climate is one of the major uncertainties in 47
anthropogenic climate change assessment and prediction [IPCC, 2007]. Cirrus are of the 48
most poorly understood systems, yet they can strongly impact climate. Cirrus are thought 49
to have a net warming effect because of their low emission temperatures and small 50
thickness [Liou, 1986]. They also play a role in regulating the ocean temperature 51
[Ramanathan and Collins, 1991] and maintaining the water vapor budget of the upper 52
troposphere and lower stratosphere [Hartmann, et al., 2001]. Concerns have been raised 53
on the effect of aircraft emissions [Penner, et al., 1999; Minnis, 2004; Stuber, et al., 54
2006; IPCC, 2007] and long-range transport of pollution [Fridlind, et al., 2004] changing 55
the properties of upper tropospheric clouds, i.e., cirrus and anvils, placing this type of 56
clouds in the potentially warming components of the climate system. 57
58
Cirrus clouds form by the homogenous freezing of liquid droplets, by heterogeneous 59
nucleation of ice on ice nuclei, and the subsequent grow of ice crystals [Pruppacher and 60
Klett, 1997]. This process is influenced by the physicochemical properties of the aerosol 61
particles (i.e., size distribution, composition, water solubility, surface tension, shape), as 62
well as by the thermodynamical state (i.e., relative humidity, pressure, temperature) of 63
their surroundings. Dynamic variability (i.e., fluctuations in updraft velocity) also impact 64
the formation of cirrus clouds potentially enhancing the concentration of small crystals 65
[Lin, et al., 1998; Kärcher and Ström, 2003; Hoyle, et al., 2005]. 66
67

4
The potential competition between homogeneous and heterogeneous mechanisms has an 68
important impact on cirrus properties. For instance, by enhancing ice formation at low 69
relative humidity, heterogeneous effects may suppress homogeneous freezing and 70
decrease the ice crystal concentration of the newly formed cloud [DeMott, et al., 1994; 71
Kärcher and Lohmann, 2002a; Gierens, 2003; Haag, et al., 2003b]. It has been suggested 72
that heterogeneous freezing has an stronger impact on cirrus formation over polluted 73
areas [Chen, et al., 2000; Haag, et al., 2003b; Abbatt, et al., 2006], at low updraft 74
velocities (less than 10 cm s-1) [DeMott, et al., 1997; DeMott, et al., 1998; Kärcher and 75
Lohmann, 2003], and at temperatures higher than -38 °C where homogenous nucleation 76
is not probable [Pruppacher and Klett, 1997; DeMott, et al., 2003]. On the other hand, 77
homogenous freezing is thought to be the prime mechanism of cirrus formation in 78
unpolluted areas, high altitudes, and low temperatures [Heymsfield and Sabin, 1989; 79
Jensen, et al., 1994; Lin, et al., 2002; Haag, et al., 2003b; Cantrell and Heymsfield, 2005; 80
Khvorostyanov, et al., 2006]. 81
82
A major challenge in the description of cirrus formation is the calculation of the 83
nucleation rate coefficient, J, i.e., the rate of generation of ice germs per unit of volume. 84
Historically this has been accomplished through classical nucleation theory [DeMott, et 85
al., 1997; Pruppacher and Klett, 1997; Tabazadeh, et al., 1997], or using empirical 86
correlations [i.e., Koop, et al., 2000]. The former requires the accurate knowledge of 87
thermodynamic properties, such as surface and interfacial tensions, densities, and 88
activation energies [Cantrell and Heymsfield, 2005]. With appropriate extensions [i.e., 89
DeMott, et al., 1994; DeMott, et al., 1997; Chen, et al., 2000; Lin, et al., 2002], theory 90
5
included in cirrus formation simulations shows agreement with experimental 91
measurements and field campaigns [i.e., Chen, et al., 2000; Archuleta, et al., 2005; 92
Khvorostyanov, et al., 2006]. Still, there is much to learn on the physical properties of 93
aqueous solutions and ice at low temperatures. Until now, the most reliable methods to 94
calculate J are based on laboratory measurements [Lin, et al., 2002]. Koop et al. [2000] 95
used experimental data to develop a parameterization showing J as a function of water 96
activity and temperature (rather than on the nature of the solute), which has been 97
supported by independent measurements of composition and nucleation rate during field 98
campaigns and cloud chamber experiments [i.e., Haag, et al., 2003a; Möhler, et al., 99
2003]. 100
101
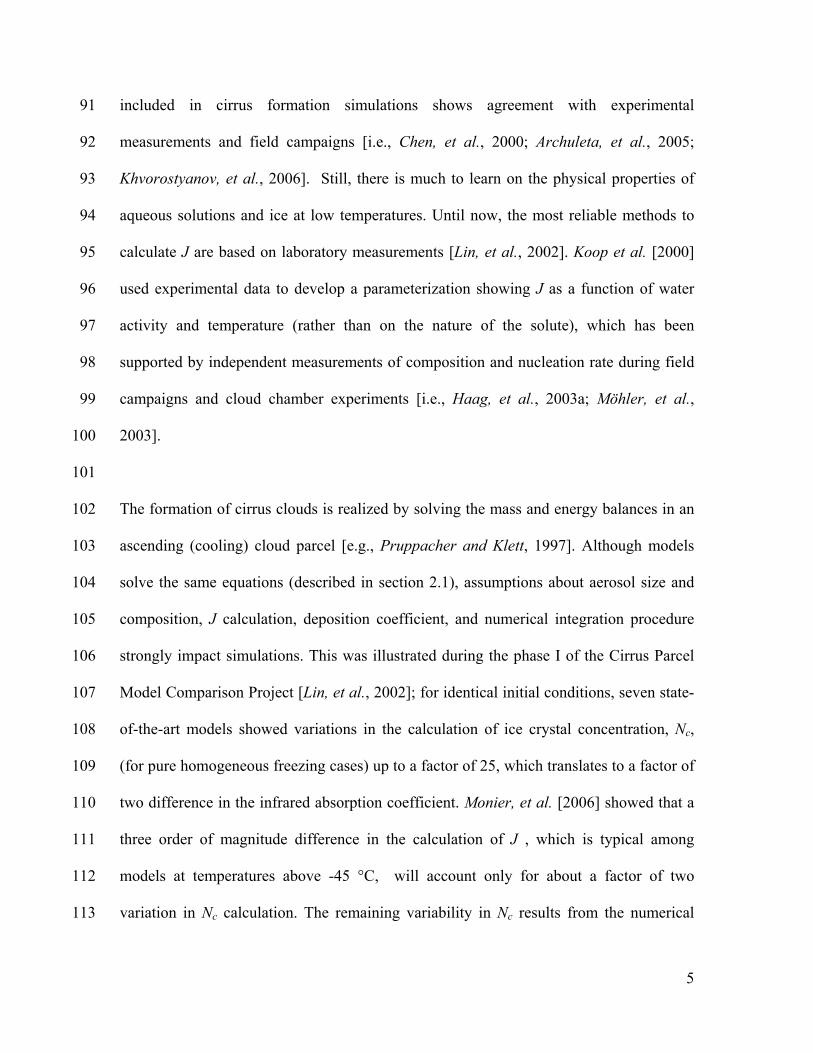
The formation of cirrus clouds is realized by solving the mass and energy balances in an 102
ascending (cooling) cloud parcel [e.g., Pruppacher and Klett, 1997]. Although models 103
solve the same equations (described in section 2.1), assumptions about aerosol size and 104
composition, J calculation, deposition coefficient, and numerical integration procedure 105
strongly impact simulations. This was illustrated during the phase I of the Cirrus Parcel 106
Model Comparison Project [Lin, et al., 2002]; for identical initial conditions, seven state-107
of-the-art models showed variations in the calculation of ice crystal concentration, Nc, 108
(for pure homogeneous freezing cases) up to a factor of 25, which translates to a factor of 109
two difference in the infrared absorption coefficient. Monier, et al. [2006] showed that a 110
three order of magnitude difference in the calculation of J , which is typical among 111
models at temperatures above -45 °C, will account only for about a factor of two 112
variation in Nc calculation. The remaining variability in Nc results from the numerical 113

6
scheme used in the integration, the calculation of the water activity inside the liquid 114
droplets at the moment of freezing, and the value of the water vapor deposition 115
coefficient. 116
117
Introducing ice formation microphysics in large scale simulations requires a physically-118
based link between the ice crystal size distribution, and the precursor aerosol and 119
thermodynamic state. Empirical correlations derived from observations are available [i.e., 120
Koenig, 1972]; their validity however for the whole spectra of cirrus formation 121
conditions present in a GCM is not guaranteed. Numerical simulations have been used to 122
produce prognostic parameterizations for cirrus formation [Sassen and Benson, 2000; Liu 123
and Penner, 2005], which relate Nc to updraft velocity and temperature (the Liu and 124
Penner, parameterization also takes into account the dependency of Nc on the precursor 125
aerosol concentration, and was recently incorporated into the NCAR Community 126
Atmospheric Model (CAM3) [Liu, et al., 2007]). Although theoretically based, these 127
parameterizations are constrained to a particular set of parameters (i.e., deposition 128
coefficient, aerosol composition and characteristics) used during the model simulations, 129
the value of which is still uncertain. Kärcher and Lohmann [2002b; 2002a] introduced a 130
physically-based parameterization solving analytically the parcel model equations. In 131
their approach a “freezing time scale” is defined, related to the cooling rate of the parcel, 132
and used to approximate the crystal size distribution at the peak saturation ratio through a 133
function describing the temporal shape of the freezing pulse. This function, along with 134
the freezing time scale, should be prescribed (also, the freezing pulse shape and freezing 135
time scale may still change with the composition and size of the aerosol particles). An 136

7
analytical fit of the freezing time scale based on Koop et al. [2000] data was provided by 137
Ren and Mackenzie [2005]. Kärcher and Lohmann parameterization have been applied 138
in GCM simulations [Lohmann and Kärcher, 2002] and extended to include 139
heterogeneous nucleation and multiple particle types [Kärcher, et al., 2006]. All 140
parameterizations developed to date provide limited information on the ice crystal size 141
distribution, which is required for computing the radiative properties of cirrus clouds 142
[Liou, 1986]. 143
144
In this work, we develop a new physically-based parameterization for ice formation from 145
homogeneous freezing in which we relax the requirement of prescribed parameters. The 146
parameterization unravels much of the stochastic nature of the cirrus formation process 147
by linking crystal size with the freezing probability, and explicitly considers the effects 148
the deposition coefficient and aerosol size and number, on Nc. With this approach, the 149
size distribution, peak saturation ratio, and ice crystal concentration can be computed. 150
The parameterization is then evaluated against a detailed numerical parcel model (also 151
presented here), which solves the model equations using a novel Lagrangian particle 152
tracking scheme. 153
154
2 Numerical Cirrus Parcel Model 155
Homogenous freezing of liquid aerosol droplets is a stochastic process resulting from 156
spontaneous fluctuations of temperature and density within the supercooled liquid phase 157
[Pruppacher and Klett, 1997]. Therefore, only the fraction of frozen particles at some 158
time can be computed (rather than the exact moment of freezing). At anytime during the 159

8
freezing process, particles of all sizes have a finite probability of freezing; this implies 160
that droplets of the same size and composition will freeze at different times, so even 161
freezing of a perfectly monodisperse droplet population will result in a polydisperse 162
crystal population. This conceptual model can be extended to a polydisperse droplet 163
population; each aerosol precursor “class” will then form an ice crystal distribution with 164
its own composition and characteristics, which if superimposed, will represent the overall 165
ice distribution. In this section the formulation of a detailed numerical model, taking into 166
account these considerations, is presented. The equations of the model share similar 167
characteristics with those proposed by many authors [Pruppacher and Klett, 1997; Lin, et 168
al., 2002, and references therein] as the ascending parcel framework is used for their 169
development. 170
171
2.1 Formulation of Equations 172
The equations that describe the evolution of ice saturation ratio, Si (defined as the ratio of 173
water vapor pressured to equilibrium vapor pressure over ice), and temperature, T, in an 174
adiabatic parcel, with no initial liquid water present, are [Pruppacher and Klett, 1997]. 175
⎥⎦⎤
⎢⎣⎡ −∆
+−−= VRT
gMdtdT
RTMHS
dtdw
pMpM
dtdS aws
ii
oiw
ai2)1( (1) 176
dtdw
cH
cgV
dtdT i
p
s
p
∆−−= (2) 177
where ∆Hs is the latent heat of sublimation of water, g is the acceleration of gravity, cp is 178
the heat capacity of air, oip is the ice saturation vapor pressure at T [Murphy and Koop, 179
2005], p is the ambient pressure, V is the updraft velocity, Mw and Ma are the molar 180
masses of water and air, respectively, and R is the universal gas constant. For simplicity, 181

9
radiative cooling effects have been neglected in equation (2), although in principle they 182
can be readily included. By definition, the ice mixing ratio in the parcel, wi, is given by 183
∫ ∫=max,
min,
max,
min,
),(6
3o
o
c
c
D
D
D
Dococcc
a
ii dDdDDDnDw π
ρρ (3) 184
where ρi and ρa are the ice and air densities, respectively. Dc is the volume-equivalent 185
diameter of an ice particle (assuming spherical shape), Do is the wet diameter of the 186
freezing liquid aerosol, c
ococc dD
DdNDDn )(),( = is the ice crystal number distribution 187
function, )( oc DN is the number density of ice crystals in the parcel formed at Do; Do,min, 188
and Do,max limit the liquid aerosol size distribution, and Dc,min and Dc,max the ice crystal 189
size distribution. Taking the time derivative of (3) we obtain 190
o
D
D
D
Dcocc
cc
a
ii dDdDDDndt
dDDdt
dw o
o
c
c
∫ ∫=max,
min,
max,
min,
),(2
2πρρ (4) 191
where the term t
DDnD occc ∂∂ ),(3 was neglected as instantaneous nucleation does not 192
contribute substantially to the depletion of water vapor in the cloudy parcel. The growth 193
term in equation (4) is given by [Pruppacher and Klett, 1997] 194
21
, )(Γ+Γ
−=
c
eqiic
DSS
dtdD (5) 195
with 196
d
w
woi
iws
a
is
wvoi
i
RTM
MpRT
RTMH
TkH
MDpRT
απρρρ 12
21
44 21 =Γ⎟⎠⎞
⎜⎝⎛ −∆∆
+=Γ (6) 197

10
where ka is the thermal conductivity of air, Dv is the water vapor diffusion coefficient 198
from the gas to ice phase, Si,eq is the equilibrium ice saturation ratio, and αd is the water 199
vapor deposition coefficient. 200
201
The crystal size distribution, ),( occ DDn is calculated by solving the condensation 202
equation [Seinfeld and Pandis, 1998] 203
⎟⎠⎞
⎜⎝⎛
∂∂
−=∂
∂dt
dDDDnDt
DDn cocc
c
occ ),(),( (7) 204
subject to the boundary and initial conditions (neglecting any change of volume upon 205
freezing), 206
0)0,,(;),(),(
),(),(=≡
∂
∂=
∂∂
=occo
ofoo
DD
cc DDntDt
tDPtDn
ttDn
oc
ψ (8) 207
where ),( tDn oo is the liquid aerosol size distribution function, ),( tDoψ is the nucleation 208
function which describes the number concentration of droplets frozen per unit of time, 209
and ),( tDP of is the cumulative probability of freezing, given by [Pruppacher and Klett, 210
1997] 211
⎟⎠⎞
⎜⎝⎛−−= ∫
t
oof dttJDtDP0
3 )(6
exp1),( π (9) 212
and 213
⎟⎠⎞
⎜⎝⎛−=
∂
∂∫
t
ooof dttJDtJD
ttDP
0
33 )(6
exp)(6
),( ππ (10) 214
J(t) is the homogeneous nucleation rate coefficient, and describes the number of ice 215
germs formed per unit of volume of liquid droplets per unit of time [Pruppacher and 216
Klett, 1997]. 217

11
218
Equation (7) is a simplified version of the continuous general dynamic equation for the 219
ice crystal population [Gelbard and Seinfeld, 1980; Seinfeld and Pandis, 1998], where 220
the nucleation term has been set as a boundary condition to facilitate its solution. This can 221
be done since the size of the ice particles equals the size of the precursor aerosol only at 222
the moment of freezing. 223
224
The evolution of the liquid droplets size distribution, ),( tDn oo , is calculated using an 225
equation similar to (7), 226
),()(),( tDdt
dDDnDt
tDno
ooo
o
oo ψ−⎟⎠⎞
⎜⎝⎛
∂∂
−=∂
∂ (11) 227
The first term of the right hand side of equation (11) represents the growth of aerosol 228
liquid particles by condensation of water vapor, and the second term the removal of 229
liquid particles by freezing. Boundary and initial conditions for (11) are simply the initial 230
aerosol size distribution and the condition of no particles at zero diameter. 231
232
2.2 Numerical Solution of parcel model equations 233
Equations (1) to (11) are solved numerically using a Lagrangian particle tracking scheme; 234
this uses a particle tracking grid for the ice crystal population (the growth of groups of ice 235
crystals is followed after freezing) coupled to a moving grid scheme (the liquid aerosol 236
population is divided into bins the size of which is changing with time), for the liquid 237
aerosol population (Figure 1). At any t = t’, the number of frozen aerosol particles is 238
calculated using (9) and placed in a node of the particle tracking grid, in which their 239
growth is followed. This group of ice crystals represents a particular solution of (7) for 240

12
the case in which all particles freeze at the same time and have the same size and 241
composition. Since a particular solution of (7) can be obtained for each time step and 242
droplet size, then the general solution of (7) is given by the superposition of all generated 243
ice crystal populations during the freezing process; wi can then be calculated and 244
equations (1-4) readily solved. To describe the evolution of ),( tDn oo , a moving grid is 245
employed, where frozen particles are removed from each size bin (which is in turn 246
updated to its equilibrium size) after each time step. 247
248
Since all ice particles are allowed to grow to their exact sizes, the effect of numerical 249
diffusion is small. The discretization of (7) transforms the partial differential equation 250
into a system of ordinary differential equations, each of which represents the growth of a 251
monodisperse ice crystal population. Thus, an Euler integration scheme can be used 252
without substantial losses in accuracy. This is at expense of setting a large grid: the total 253
number of nodes in the particle tracking grid is the product of the number of time steps 254
by the number of nodes of the liquid aerosol moving grid. The particle tracking grid size 255
can be substantially reduced by grouping the newly frozen particles in a fewer number of 256
sizes [i.e., Khvorostyanov and Curry, 2005], 257
o
D
D
ofoo
lowerupperDD
occ dDt
tDPtDn
DDttDDn upper
loweroc
∫ ∂
∂
−=
∂∂
=
),(),(1),,(
'
'
(12) 258
where 'oD is the assumed size of the frozen particles. If all aerosol particles freeze at the 259
same size, the integral in (12) is evaluated over the entire size spectrum of the liquid 260
aerosol population. A further reduction in the size of the particle tracking grid is achieved 261
by recognizing that the freezing process occurs after some threshold Si is reached [Sassen 262

13
and Benson, 2000; Kärcher and Lohmann, 2002b]; therefore the initial time step is set to 263
2V-1 s, and reduced to 0.05V-1 s (with V in m s-1) when the nucleation event starts (J > 104 264
m-3s-1), only after which the growth of ice particles is accounted for. 265
266
2.3 Baseline simulations 267
The formulation of the parcel model was tested using the baseline protocols of Lin et al. 268
[2002]. Pure ice bulk properties were used to calculate the growth terms (equations 5-6). 269
Do was assumed as the equilibrium size at Si, given by Köhler theory [Pruppacher and 270
Klett, 1997], and solved iteratively using reported bulk density and surface tension data 271
[Tabazadeh and Jensen, 1997; Myhre, et al., 1998]. This assumption may bias the results 272
of the parcel model simulations at low T and high V [Lin, et al., 2002]; alternatively the 273
aerosol size can be calculated using explicit growth kinetics for which the water vapor 274
uptake coefficient from the vapor to the liquid phase is uncertain [Lin, et al., 2002] 275
(recent measurements indicate a value between 0.4 and 0.7 [Gershenzon, et al., 2004]). J 276
was calculated using the Koop et al. [2000] parameterization due to its simplicity and its 277
widely accepted accuracy for a broad range of atmospheric conditions [i.e., Abbatt, et al., 278
2006] (in principle any model for J can be used.) The dry aerosol population was 279
assumed to be pure H2SO4, lognormally distributed with geometric mean diameter, Dg, dry 280
= 40 nm, geometric dispersion, σg, dry = 2.3, and total number concentration, No = 200 cm-281
3. The runs were performed using 20 size-bins for the liquid aerosol; the newly frozen 282
particles were grouped into 4 size classes, producing a grid between 1500 and 2000 283
nodes; numerical results showed that little accuracy was gained by using a finer grid (not 284

14
shown). Runs of the parcel model using a regular PC (2.2 GHz processor speed and 1 GB 285
of RAM), usually took between 5 and 12 min. 286
287
Figure 2 shows results of the performed simulations for the protocols of Lin, et al. [2002] 288
and αd = 1, these simulations are intended to provide a common basis for comparison 289
with other models.. The value of αd is still uncertain and may impact Nc [Lin, et al., 290
2002]. Simulations using αd = 0.1 (not shown) produced Nc (cm-3) of 0.20, 2.87, 24.06, 291
for the cases Ch004, Ch020 and Ch100, respectively, and 0.043, 0.535, and 5.98 for the 292
cases Wh004, Wh020 and Wh100, respectively. Results from the INCA campaign 293
summarized by Gayet, et al. [2004] indicate Nc around 1.71 cm-3 for T between -43 and -294
53 °C, and Nc around 0.78 cm-3 for T between -53 and -63 °C with V mainly below 1 m 295
s-1, at formation conditions consistent with a homogeneous nucleation mechanism [Haag, 296
et al., 2003b]. These values are consistent with a low value for αd (around 0.1) which is 297
supported by independent studies [Gierens, et al., 2003; Hoyle, et al., 2005; 298
Khvorostyanov, et al., 2006; Monier, et al., 2006]. However, direct comparison of the 299
parcel model with experimental results may presuppose a rather simplistic view of the 300
cirrus formation process, and overlook other effects (i.e., variation in aerosol 301
characteristics, V and T fluctuations [Kärcher and Ström, 2003; Kärcher and Koop, 302
2005]). Theoretical calculations and direct experimental observations have reported αd 303
values from 0.03 to 1 at temperatures within the range 20 to 263 K [i.e., Haynes, et al., 304
1992; Wood, et al., 2001]. Due to these considerations αd is considered in this work a 305
highly uncertain parameter for which more study is required. 306
307

15
3 Parameterization of Ice Nucleation and Growth 308
3.1 Parameterization of ),( occ DDn 309
The ultimate goal of this study is to develop an approximate analytical solution of 310
equations (5-12) to predict number and size of ice crystals as a function of cloud 311
formation conditions. For this, a link should be established between ice particle size and 312
their probability of freezing at the time of nucleation; such link defines ),( occ DDn at 313
each time during the freezing pulse. ),( occ DDn is determined for a given Si profile by 314
tracing back the growth of a group of ice crystals particles of size Dc down to Do (Figure 315
3). In the following derivation we assume that most of the crystals are nucleated before 316
maximum saturation ratio, Si,max, is reached. The implications of this assumption are 317
discussed in section 4. We start by writing a solution of equation (7) in the form 318
c
ofooocc D
SPDnDDn
∂
∂−=
)()(),(
'
(13) 319
where So’ is a value of Si < Si,max at which the ice crystals were formed and )( '
of SP 320
represents the current fraction of crystals of size Dc, that come from liquid aerosol 321
particles of size Do. )( oo Dn is the average )( oo Dn during the freezing interval, and is 322
taken to be constant since freezing occurs over a very narrow Si range [Kärcher and 323
Lohmann, 2002b] and Nc is usually much less than No [i.e., Lin, et al., 2002]. Since in a 324
monotonically increasing Si field )( 'of SP decreases with increasing Dc (as explained 325
below), a negative sign is introduced in equation (13). 326
327

16
Calculation of So’ is key for solving equation (13); this is done by combining equations 328
(1) and (2), 329
dtdwVS
dtdS i
ii βα −= (14) 330
where RT
gMRTc
MHg a
p
ws −∆
= 2α , 2
2
RTcMH
pMpM
p
wsoiw
a ∆>>=β . Before the nucleated ice crystals 331
substantially impact saturation (“free growth”, Figure 3), 0≈dt
dwi , and the integration of 332
(14) from So’ to Si,max gives 333
⎟⎟⎠
⎞⎜⎜⎝
⎛−≈−
max,
'
11
i
oo S
SV
ttα
(15) 334
where the approximation 1)ln( −≈ xx has been used. Equation (15) is similar to the 335
“upper bound” expression derived by Twomey [1959] for liquid water clouds. Numerical 336
simulations (section 4) support that “free growth” holds up to Si values very close Si,max; 337
for Si→Si,max however, equation (15) may underestimate t-to and its effect is discussed in 338
section 4. 339
340
By definition, t-to should equal the time for growth of the ice particles from Do to Dc 341
(Figure 3), which is found by integration of (5), 342
⎥⎦⎤
⎢⎣⎡ −Γ+−Γ
−=− )()(
2)1(1
2221
ococi
o DDDDS
tt (16) 343
where Si has been assumed as constant as nucleation occurs in a very narrow Si range 344
(i.e., Figure 5). The calculation of )( 'of SP using equation (9) requires the knowledge of J 345
as an explicit function of Si; this can be further simplified given that nucleation occurs on 346

17
a very narrow interval of saturation so that J(Si) can be approximated related to J(Si,max) 347
[i.e., Seinfeld and Pandis, 1998; Khvorostyanov and Curry, 2005] as 348
( )max,max,
)()(
)(ln iii
i SSTkSJ
SJ−≈ (17) 349
k(T) is obtained by fitting the Koop et al. [2000] data for J between 108 and 1022 m-3s-1, 350
6.405489.301046.0)( 2 +−= TTTk (18) 351
with T in K. Using (14) and (17), (9) is solved under the assumption of free growth to 352
give 353
[ ]))((exp)(
)()(1),( '
max,max,
max,
max,
''
oi
S
Si
oio
ioof SSTk
STkVvSJ
dSSJvVS
SDP o
o
−−=≈ ∫ αα (19) 354
where 6
3o
oDv π
= , and the approximation ∫∫ ≈⎟⎠⎞⎜
⎝⎛−−
t
o
t
o dttJvdttJv00
)()(exp1 has been 355
used. 356
The lower integration limit, So, in (19) represents the beginning of the freezing pulse, 357
assumed to be where ),( oof SDP < ),(10 max,6
iof SDP− , i.e., 358
[ ] [ ]))((exp))((exp max,'
max, oioi SSTkSSTk −−>>−− . The integration is not very sensitive 359
to the latter assumption, as most of the ice crystals form for Si close to Si,max [i.e., Kärcher 360
and Lohmann, 2002a]. Combining (15) and (16) to find 'max, oi SS − , and replacing into (19) 361
gives 362
[ ]),(exp)(
)(),(
max,
max,oc
i
oicof DD
STkVvSJ
DDP Γ−= µα
(20) 363

18
where )1(
)(
max.
max.
−=
i
i
SSTkVα
µ , and )()(2
),( 2221
ocococ DDDDDD −Γ+−Γ
=Γ . The ice number 364
distribution function at Si,max is obtained after computing c
cof
DDDP
∂
∂ ),( from (20) and 365
substituting into (13) 366
( ) [ ]),(exp)1(
)()(),( 21
max,
max,
max,occ
i
oiooSocc DDD
SvSJ
DnDDni
Γ−Γ+Γ−
= µ (21) 367
Since ice particles attain large sizes after freezing, the spectrum of Dc values spans over 368
several orders of magnitude [i.e., DeMott, et al., 1994; Monier, et al., 2006]. Typically 369
variation in Do is much smaller; furthermore, Pf reaches significant values only in a 370
fraction of the liquid droplets (generally those with larger sizes and low solute 371
concentrations [Pruppacher and Klett, 1997]). With this, the value of [ ]),(exp oc DDΓ− µ 372
will be dominated by variation in Dc, and the approximation 373
[ ] [ ]),(exp),(exp ococ DDDD Γ−≈Γ− µµ can be used. Obtaining the crystal size 374
distribution then is done by integration of (21) over the contribution from each droplet 375
size class, 376
( ) [ ] ooooocci
iScc dDvDnDDD
SSJ
Dni ∫Γ−Γ+Γ
−= )(),(exp
)1()(
)( 21max,
max,
max,µ (22) 377
which for a lognormal distribution of )( oo Dn gives 378
( ) [ ]),(exp)1(
)()( 21
max,
max,ln2/9 2
max,occ
i
iooScc DDD
SSJevN
Dng
iΓ−Γ+Γ
−= µ
σ
(23a) 379
or 380

19
( ) [ ]),(exp)1(
)(ln
)(ln 21max,
max,ln2/9 2
max,
max,occ
i
icoo
Sc
cScc DDD
SSJDevN
DddNDn
g
i
iΓ−Γ+Γ
−== µ
σ
381
(23b) 382
where 3
6 oo Dv π= and σg is the geometric dispersion of the droplet size distribution. 383
Equation (23) is the final expression used for the size distribution of the ice crystals at 384
Si,max. Equations (21-23) demonstrate the probabilistic character of ice nucleation: at any 385
time particles of all sizes have finite freezing probabilities; i.e., the population of ice 386
crystals of a given size Dc results from the freezing of droplets with different sizes. From 387
this, the freezing of a monodisperse aerosol size population produces a polydisperse ice 388
crystal population. Since for values below Si,max, Si increases monotonically with time, the 389
number of crystals generally increases as Dc decreases. For a given droplet size, Pf (Do, Si) 390
will increase with time so that the number of newly formed crystals will increase. These 391
crystals in turn will have less time to grow before Si reaches Si,max; that is, the most 392
recently formed crystals will have the largest probability of freezing, i.e., 393
),( max,iocf SDDP = . The maximum in the distribution may be shifted to Dc > oD if the 394
time scale for the growth of the newly formed particles is larger than the timescale of 395
change of probability (see section 4). 396
397
3.2 Calculation of cN at Si,max 398
The deposition rate of water vapor upon ice crystals can be approximated by substituting 399
equation (23) into (4), 400

20
∫ ⎥⎦⎤
⎢⎣⎡ −
Γ−=
max2,
222max,
ln2/9 )(2
exp)(2
sDc
Dcoccioo
a
ii
o
g dDDDDSJevNdt
dw µπρρ σ (24) 401
where max,scD is the equivalent diameter of the largest ice crystal at Si,max (calculated in 402
section 3.3) andΓ is given by [i.e., Fountoukis and Nenes, 2005] 403
⎥⎥⎥⎥⎥
⎦
⎤
⎢⎢⎢⎢⎢
⎣
⎡
−
⎟⎟⎠
⎞⎜⎜⎝
⎛Γ+Γ
Γ+Γ
ΓΓ
+Γ
=−
Γ+Γ=Γ
∫osc
o
sc
osc
sDc
Dc
c
c
DDD
D
DD
dDD
D
o
max
max
max
max
,
12
,12
1
2
1,
,
21ln
11 (25) 404
Integration of (24) gives 405
max,22
22
2/3
2
max,ln2/9
22)
2(
24
)(2
sc
o
co
g
D
D
D
cc
D
iooa
ii eDDerfeSJevNdt
dw⎥⎦
⎤⎢⎣
⎡
Γ−
Γ⎟⎠⎞
⎜⎝⎛
Γ
= Γ−Γ µ
µ
σ µµπµ
πρρ 406
(26a) 407
An order of magnitude estimation of parameters based on parcel simulations (not shown) 408
suggest that oD ~ 10-7 m, max,scD ~ 10-5 m and
Γ2µ ~ 1010 m-2. Therefore, the term in 409
brackets in (26a) tends to approach π in most conditions, i.e., 410
2/3
2
max,ln2/9
2)(
2
2
⎟⎠⎞
⎜⎝⎛Γ
=Γ
πµρ
ρµ
σo
g
D
iooa
ii eSJevNdt
dw (26b) 411
after substitution of (26b) into (14), at 0=dt
dSi , 412
2/3
2
max,ln2/9
max,2
)(
2
2
⎟⎠⎞
⎜⎝⎛
Γ
=Γ
πµρ
ρβα
µ
σo
g
D
iooa
ii
eSJevNVS (27) 413

21
the fraction of frozen particles, fc, at Si, max is found at the maximum Pf , given by (20) 414
max,
max,ln2/9 )(
),()(12
i
ioooocfoo
oc VS
SJevdDDDDPDn
Nf
g
α
σ
=== ∫ (28) 415
combining (27) and (28) we arrive at, 416
[ ]⎥⎥⎦
⎤
⎢⎢⎣
⎡
−Γ−
⎥⎥⎦
⎤
⎢⎢⎣
⎡
−Γ= 2
max,
max,
2/3
max,
max,2/1
)1(2)(
exp)1(
2)(o
i
i
i
i
oi
ac D
SSTVk
SVS
NTkf
απ
αβρ
ρ (29) 417
418
The exponential term in (29) approaches unity, which is a result of the assumption made 419
in (13) that freezing depletes a negligible amount of aerosol (i.e., )( oo Dn is constant 420
during the nucleation process). Since the term J(Si,max) has been eliminated from (29), fc is 421
not strongly influenced by small variations in Si,max. Thus, Si,max can be taken as the 422
saturation freezing threshold obtained solving the Koop et. al. [2000] parameterization 423
for 16max, 10)( =iSJ s-1 m-3, which is close to the nucleation rate of pure water at -38 °C 424
[Pruppacher and Klett, 1997; Sassen and Benson, 2000], and represents an average of 425
)( max,iSJ over a wide set of simulations (section 4). The total number of crystals would be 426
given by, coc fNN = , however such result will not be constrained by No as upper limit. 427
Instead, purposely contradicting the assumption made in (19), fc can be associated with 428
the solution of the integral in (9), i.e., ∫≈t
oc dttJvf0
)( and then write 429
)1( cc ffoc eeNN −− −= (30) 430
where cfoeN − represents the number of remaining unfrozen droplets. 431
432
433

22
3.3 Calculation of max,scD 434
max,scD is required for calculating the ice growth rate (equation (26b)); Two methods are 435
developed to calculate it. The first one is based on theoretical arguments, and assumes 436
max,scD as the diameter of the ice crystal at which 610),(
),( −==
ocf
oocf
DDPDDDP
(i.e., the size 437
above which the number of crystals is below 10-6Nc). With this, equation (20) can be 438
solved formax,scD , 439
0)(
)1)(10ln(22
1max,
max,6
,1
22, maxmax
=Γ−
−ΓΓ
+−
i
iscsc STVk
SDD
α (31) 440
where we have assumed osc DD >>max, (supported by numerical simulations). 441
Sincedα
12 ∝Γ (Equation (6)), the value of
max,scD would increase as dα decreases. For 442
low values of dα ice crystals grow slowly, and non-continuum effects limit the 443
condensation rate; when ice become large enough, gas-to-particle mass transfer is in the 444
continuum regime and the crystals grow quickly [Pruppacher and Klett, 1997]. When 445
growth of the newly frozen ice crystals is delayed, water vapor water tends to condensate 446
preferentially to preexisting ice crystals. Slow uptake effects became important for dα 447
lower than 0.1, i.e, when Г1 becomes comparable to Г2 [Lin, et al., 2002; Gierens, et al., 448
2003]. Alternatively, max,scD can be computed using an empirical fit to numerical 449
simulations obtained with the parcel model, 450
{ }4373.03,
05.01214, 10;)()101769.3106397.1(min
max
−−−−− ×−×= drygosc DNVTD (32) 451
where V is in m s-1, T is in K, No in cm-3 and Dg, dry in m. Equation (30) was generated 452
over a broad set of T, p, V, No, Dg, dry, and αd (Table 1, section 4). The T and V 453

23
dependencies in (32) are introduced to adjust the effective growth of the particles 454
correcting for the “free growth” assumption (section 3.1). Additional variability not taken 455
into account in the formulation of (30) is caused by the effect of variation in the aerosol 456
properties. Since )( oo Dn is in equilibrium with the dry aerosol size distribution, an 457
increase Dg, dry will increase the total volume of the liquid aerosol particles therefore 458
increasing Pf. This would produce a longer freezing pulse and increase Nc. The same 459
effect can be achieved by reducing the effective growth of the particles, which explains 460
the approximated dependency of Dc,Smax on the average volume of the dry aerosol 461
population, i.e., ~ ( ) 3/13,drygo DN (equation (32)). 462
463
3.4 Implementation of the Parameterization 464
The application of the parameterization is presented in Figure 4. As input, one requires 465
the conditions of cloud formation T, P, V, and αd and the aerosol characteristics (i.e., No 466
and drygD , ); the outputs are Nc and size distribution information. To apply the 467
parameterization, first Γ is calculated (Equation (25)) using max,scD estimated using either 468
Equation (31) or (32), the latter being preferred. Si,max is obtained by solving 469
16max, 10)( =iSJ s-1 m-3 [Koop, et al., 2000], for which reported fits, relating Si,max at 470
16max, 10)( =iSJ s-1 m-3 to T, can be employed [i.e., Ren and Mackenzie, 2005]. Nc is 471
calculated from (30) using fc calculated from (29). After fc is calculated, )( max,iSJ can be 472
corrected using gev
VSfSJ
o
ici σ
α2ln2/9max,
max, )( = (equation (27)) from where ),( occ DDn is obtained 473
(equations (21-23)). There is still uncertainty regarding the values of αd and the aerosol 474

24
characteristics [Lin, et al., 2002]; the sensitivity of the parameterization results to these 475
parameters is discussed in the next section. 476
477
4 Evaluation of the Parameterization 478
The parameterization was evaluated against the detailed numerical solution of the parcel 479
model over a wide range of T, V, Dg, dry, No, and αd (Table 1), in a total of 1200 runs, 480
covering the expected variation in cirrus cloud formation conditions in a GCM 481
simulation. The parcel model was run using initial Si = 1.0; initial p was estimated as in 482
hydrostatic equilibrium at T using a dry adiabatic lapse rate. The dry aerosol population 483
was assumed to be pure H2SO4, lognormally distributed. To test aged, unperturbed, and 484
perturbed aerosol runs the geometric dispersion of the dry aerosol distribution, σg, dry was 485
selected to be 1.7, 2.3 and 2.9 respectively [Seinfeld and Pandis, 1998]. The liquid 486
aerosol was assumed to be in equilibrium with Si in all simulations. Calculated Nc ranged 487
from 0.001 to 100 cm-3 and Si,max varied between 1.4 and 1.6 which agrees the range on 488
reported values for cirrus formation by homogeneous freezing [i.e., Heymsfield and 489
Sabin, 1989; Lin, et al., 2002]. 490
491
Two main assumptions were introduced in the development of the parameterization, i.e., 492
the calculation of Nc at Si,max rather than at the end of the freezing pulse, i.e., 493
maxScc NN ≈ ; and the assumption of negligible impact of the newly formed crystals on Si 494
before Si,max is reached (“free growth”). Figure 5 shows how these assumptions may 495
impact the results of the parameterization for high and low V and T (1-0.04 m s-1, 233-496
203 K). By using free growth regime to estimate the evolution of Si (dotted black line), 497

25
Si,max is overestimated by about 0.5 % at low V (bottom left) to about 2% at high V (top 498
right). At high T (right panels) such overestimation is not expected to exert a large 499
influence in the performance of the parameterization as low values of Si,max are reached. 500
Therefore the small overestimation in Si,max will not significantly influence J(Si,max) 501
(which is a very nonlinear function Si,max). However, as T decreases and V increases, Si,max 502
reaches higher values during the parcel ascent and small changes in Si,max significantly 503
impact J (hence Pf), for which an overestimation in Nc may be expected. Conversely, 504
Figure 5 shows that at low V (bottom panels), maxScN underestimates the actual Nc by 505
nearly a factor of 2; since few ice crystals (low Si,max) are formed, it takes a longer time to 506
deplete the available water vapor resulting in longer freezing pulses. At high V (top 507
panels) maxScN is close to Nc, since Si,max is reached rapidly and a larger number of crystals 508
is formed; this effect will be more important at low T as higher Si,max values are reached . 509
510
4.1 Calculation of )( cc Dn 511
The parameterized )( cc Dn , equation (23b), is presented for two representative cases in 512
Figure 6, along with max
)(iScc Dn obtained from parcel model simulations. Although the 513
effect of the droplet size distribution parameters is explicitly considered in (23) it cancels 514
out with its effect on cf (which is a result of the assumption constant )( oo Dn ), and a 515
single crystal size distribution is obtained for the three values of σg, dry tested (although 516
small variations in max
)(iScc Dn may occur due to differences in T at Si,max), this is not 517
critical as Nc variations with respect to σg, dry are generally small (i.e., Figure 6). oD was 518

26
assumed as the equilibrium size of Dg, dry at Si, max. )( cc Dn was calculated using the 519
procedure outlined in section 3.4 (Figure 4) in which J(Si,max) is corrected using equations 520
(30) and (32) (therefore enforcing c
D
DDccc dDDnN
c
oc
∫=
≈max,
)( ). Generally, the parameterized 521
)( cc Dn reproduces well the numerical results at Si,max, however, it predicts a continuous 522
size distribution down to oD , which differs from the numerical results. This can be 523
explained due to the discrete nature of the size distribution (and of the numerical 524
method). After freezing, the newly formed ice crystals “jump” to larger sizes leaving 525
gaps in the distribution, and eliminating part of the left-tail of the size distribution. Due to 526
the continuous nature of the parameterized )( cc Dn , it would tend to overpredict maxScN . 527
The adjusted J(Si,max) will then be slightly below the obtained in numerical simulations to 528
satisfy maxScc NN = . This works well in the cold case (T=213, V=1 m s-1, Figure 6, left) 529
as more crystals are to be produced after Si, max is reached. However in the warm case 530
(T=233, V=0.2 m s-1, Figure 6, right), the freezing pulse is shorter and the correction in 531
J(Si,max) produces a reduction in the peak of the distribution. The influence of these 532
factors on the resulting effective radius of the cirrus cloud, and its radiative properties, 533
will require the time integration of )( cc Dn , and the comparison with numerical 534
simulations at different stages after cloud formation. Although such a task may be readily 535
achieved, it is out of the focus of this manuscript and will be undertaken in future works. 536
537
538
539

27
4.2 Calculation of Nc 540
Figure 7 shows the comparison of Nc predicted by the parcel model and the 541
parameterization, equation (30), using the theoretical calculation ofmax,scD (right, equation 542
(31)) and using the empirical correlation formax,scD (left, equation (32)). The effects of the 543
assumption of “free growth” and the approximation of Nc asmaxScN are expected to cancel 544
out at moderate T and V. However at low V and high T (hence low Nc), the 545
parameterization tends to underestimate Nc with respect to the parcel model results; the 546
opposite tendency occurs at very high V (>2 m s-1) and low T (hence, high Nc). This latter 547
is not significant as such conditions are not typical of cirrus formation [i.e., Heymsfield 548
and Sabin, 1989; Gayet, et al., 2004]. In summary, using the theoretically 549
calculatedmax,scD gives a parameterized Nc always within a factor of 2 of the Nc predicted 550
by the parcel model with a mean relative error about -15% (for all runs in Table 1). When 551
using the empirically calculated max,scD (equation (32)) is used, the parameterized Nc is 552
much closer to the numerical parcel model (average relative error 1% ± 28%), as 553
equation (32) allows more flexibility in reproducing the parcel model results, and 554
accounts for the additional variability due to effect of aerosol size and number. 555
556
4.3 Comparison Against Other Parameterizations 557
The parameterization results were compared to those of several reported works for 558
different combinations of V, No, Dg, dry, T, and αd. The parameterizations used in this 559
section are those of Liu and Penner [2005 , hereafter LP2005], Sassen and Benson [2000, 560
hereafter SB2000], and Kärcher and Lohmann, [2002a, hereafter, KL2002; Fountoukis 561

28
and Nenes, 2005]. SB2000 is based on an empirical fit to numerical simulations relating 562
Nc to T and V. A similar approach is used in LP2005 where an additional dependency on 563
No is included. In both cases, J is calculated through classical nucleation theory (the latter 564
using the effective temperature method [i.e., DeMott, et al., 1994]). KL2002 is physically 565
based and employs the freezing timescale and the threshold supersaturation as input 566
parameters. It resolves explicitly the dependency of Nc on T, V, αd, and Do, and uses No as 567
upper limit for Nc. Although the freezing of polydisperse aerosol is discussed in KL2002 568
not explicit solution is presented, therefore their monodisperse solution is used for 569
comparison. The freezing timescale and supersaturation threshold are calculated using the 570
analytical fits to Koop et al. [2000] data provided by Ren and Mackenzie [2005]. oD in 571
this case was taken as in equilibrium with the volume-weighted geometric mean diameter 572
of the dry size distribution. By using this definition of oD , the best agreement between 573
the parcel model simulations and the results of the KL2002 parameterization was 574
obtained. The three parameterizations were compared to the solution of equation (30) 575
using theoretically calculated Dc,max, equation (31) (termed “theoretical”, still k(T), 576
equation (18), has been derived from an empirical fit to J ), and using the empirically 577
adjusted Dc,max equation (32), (termed “adjusted”). oD was calculated as the equilibrium 578
size of Dg, dry at Si, max. All parameterizations are evaluated using T obtained at Si,max from 579
the parcel model simulations. αd was set to 0.1 and 1.0 to test both diffusionally and non-580
difussionally limited cases (see section 3.3). 581
582
583
584

29
Dependency on V 585
Figure 8 presents the comparison of the different parameterizations at To= 213 (left panel, 586
T between 208.6 and 209.4 K) and 233 K (right panel, T between 228.8 and 229.2 K), 587
and αd = 0.1 (black) and 1.0 (blue). At To=233 K, all parameterizations agree fairly well 588
when αd = 0.1 and V < 1 m s-1. At higher V, KL2002 and LP2005 predict a larger Nc, 589
whereas SB2000 predicts a lower Nc, with respect to the parcel model results, although 590
the difference becomes significant only for V > 3 m s-1. At these conditions the adjusted 591
parameterization follows well the parcel model results whereas the theoretical 592
parameterization slightly underpredicts Nc at low V. Runs made using αd =1 (blue) 593
showed a good agreement between KL2002, the adjusted and theoretical 594
parameterizations, and the numerical results. This is expected as equation (28) bears the 595
same dependency on V and oip , reported by KL2002 in their “fast growth” solution (i.e., 596
2/3VNc ∝ ) and emphasized by more recent works [Gierens, 2003; Ren and Mackenzie, 597
2005]. At high fc (i.e., low T, low αd, and high V) the exponential term in (30) dampens 598
the effect of V (also due to the dependency ofmax,scD on V) and Nc becomes almost linear 599
on V. Results at αd = 1 lie below those of LP2005 and SB2000, who used lower αd values 600
for their numerical simulations (LP2005 used αd = 0.1 and SB2000 used αd = 0.36 [Lin, et 601
al., 2002]). At To=213 K, and αd = 0.1 (left, black), the parameterizations agree only for V 602
below 0.3 m s1 whereas for large V they diverge, being Nc calculated using KL2002, the 603
largest over the whole V interval. At very high V (>3 m s-1) the adjusted parameterization 604
underpredicts Nc with respect to the parcel model results which is a result of the 605
exponential term introduced in (30). As with To = 233 K, KL2002, and the adjusted and 606

30
theoretical parameterizations agree well with the numerical results when αd = 1, and 607
To=213 K (left, blue). 608
609
Dependency on No 610
Figure 9 presents Nc as a function of No for V=0.2 m s-1 (left) and V=1.0 m s-1 (right) and 611
To=213 (black) and 233 K (blue); for these simulations Dg,dry was set to 40 nm and αd to 612
0.1. In all cases of Figure 9, LP2005 and the adjusted parameterization show the best 613
agreement with the parcel model results. Still, at To=213 K, V= 1.0 m s-1, the adjusted 614
parameterization underpredicts with respect to the numerical results, for No below 20 cm-615
3 whereas LP2005 overpredicts; in both cases the difference with the parcel model results 616
is about ± 50 %, which is not critical as these very low No are atypical of cirrus forming 617
conditions [i.e., Pruppacher and Klett, 1997]. In all cases of figure 9 KL2002 predicts a 618
larger Nc than the parcel model, however the difference becomes much smaller at large 619
No. In the same interval of No, SB2000 predicts Nc close to the average of the parcel 620
model results at To=213 K; when To=233 K, SB2000 predicts Nc close to the parcel model 621
results at large No. The theoretical parameterization shows the opposite tendency and 622
tends to agree better with the parcel model results at low No. In most of the cases the 623
parcel model results can be reasonable well fitted in the form boc aNN = where a and b 624
are functions of T, V, Dg, dry and αd (also proposed in LP2005). The dependency of Nc on 625
No generally increases when T and αd decrease, and V increases. For the cases of Figure 9, 626
b lies between 0.19 (To=233 K , V= 0.2 m s-1) and 0.61 (To=213 K , V= 1 m s-1). This is 627
in good agreement with experimental and numerical studies that usually report an 628

31
increase in Nc by a factor between 2 and 4 for a 10-fold increase in No [i.e., Heymsfield 629
and Sabin, 1989; Jensen and Toon, 1994; Seifert, et al., 2004]. 630
631
Dependency on Dg, dry 632
Figure 10 presents Nc as a function of Dg, dry for To=213 (left) and To=233 (right), and αd 633
= 0.1 (black) and αd = 1 (blue); for these simulations V=1.0 m s-1 and No = 200 cm-3. To 634
apply KL2002, Dg, dry was converted into the volume-weighted mean diameter in 635
equilibrium with Si,max; however Nc results in Figure 10 are plotted using the original Dg, 636
dry. In all conditions of Figure 10 parcel model results suggest an approximated linear 637
dependency of Nc with Dg, dry, which is also found by the combination of equations (29) 638
and (32). This is a result of the increased Pf due to the larger volume of the liquid aerosol 639
particles in equilibrium with the aerosol dry distribution (see section 3.3 and equation 640
(9)), which was also observed in LP2005. This result is opposite to the tendency 641
predicted by KL2002 ( 1−∝ oc DN ), and also (although much more slightly) by the 642
theoretical parameterization. In the latter, the effect of increased Pf is not accounted for 643
due to the assumption of an infinite aerosol source (section 3.1, equation (13)). Although 644
LP2005 does not take into account this dependency it predicts Nc in agreement with 645
parcel model results at Dg, dry = 80 nm, and αd = 0.1. SB2000 predicted Nc agrees with the 646
parcel model results at Dg, dry = 40 nm and To=213, and at Dg, dry = 120 nm and To=233, 647
when αd = 0.1. If a linear fit is adjusted to the cases shown in Figure 10 then its slope will 648
decrease from 0.32 at To=213 and αd = 0.1 to 0.015 at To=233 and αd = 1, which indicates 649
again that these effects would be more important at low T and high V. In all cases of 650
Figure 10 the adjusted parameterization reproduces closely the parcel model results. 651

32
While the comparison of the different parameterizations was carried out over a 652
comprehensive set of conditions, common values of Dg, dry often vary between 40-100 nm 653
(and between 100-500 cm-3 for No) [e.g., Heymsfield and Miloshevich, 1995; Gayet, et al., 654
2004]. Figures 8-10 show that the effect of T and V variations on Nc is much stronger 655
than that of Dg, dry and No. The relative importance of each parameter remains to be 656
assessed in global model studies. 657
658
5 Summary and Conclusions 659
To address the need for improved physics of ice cloud formation in large scale models, 660
we have developed a parameterization for cirrus clouds formation, which is robust, 661
computationally efficient, and links chemical effects (e.g., water activity and uptake 662
effects) with ice formation via homogenous freezing. This was accomplished by tracing 663
back the growth of ice crystals to their point of freezing, in a given ice saturation profile, 664
connecting their size to their freezing probability. Using this approach, an expression for 665
the crystal size distribution is derived, the integration of which yields the number 666
concentration of crystals, and compared against the solution of a detailed parcel model. 667
The numerical solution of the parcel model was accomplished by using a Lagrangian 668
particle tracking scheme. In this method the evolution of the ice crystal size distribution 669
is described by the superposition and growth of monodisperse crystal populations 670
generated by the freezing of single classes (of same size and composition) of supercooled 671
droplets. 672
673

33
The parameterized ice crystal size distribution captured well the characteristics of the ice 674
crystal population and represents a robust approximation to calculate Nc. Its integration to 675
find Nc was carried out either using complete theoretical arguments or their combination 676
with parcel model results. When compared against the predictions of the numerical parcel 677
model over a broad set of conditions, the theoretically based parameterization for Nc 678
reproduced the results of the parcel model within a factor of two and with an average 679
relative error of about -15%. Adjustments in the ice crystal growth rate (using numerical 680
simulations) further reduced the relative error to 1 ± 28%, which is remarkable given the 681
simplicity of the final expression obtained for Nc, the broad set of conditions tested, and 682
the complexity of the parcel model equations. 683
684
Due to its analytical nature the proposed parameterization presented in this work offers 685
explicitly relation between variables, that as analyzed in the last section goes beyond 686
scaling factors, and it is not constrained to a single set of parameters (i.e., αd, aerosol 687
characteristics) which is desirable due to the large uncertainty associated with them. As 688
shown in Figure 7 the accuracy with which the parameterization reproduces the parcel 689
model results, is independent of these parameters. In this regards, only the KL2002 690
parameterization shares this advantages, however the presented parameterization offers 691
explicitly the relation between the different variables that determine the freezing time 692
scale of the particles, and explicitly considers the effect of the aerosol number on Nc. 693
694
This work offers a new, alternative approach to the description of cirrus formation and its 695
representation in large scale models. The results given are applicable for cirrus formation 696

34
on predominantly homogenous freezing conditions. Still, in a number of cases 697
heterogeneous freezing and competition between multiple particle types significantly 698
affect the cloud formation process. Both the numerical model and the parameterization 699
can be readily extended to include these effects, which will be the focus of future work. 700
701
6 Acknowledgments 702
This study was supported by NASA MAP, NASA EOS-IDS-CACTUS, and a NASA 703
New Investigator Award. We would also like to thank Dr. B.Kahn for his comments on 704
the manuscript. 705
706
707
APPENDIX 708
List of Symbols 709
710
α, β Parameters defined in equation (14)
αd Water vapor to ice deposition coefficient
cp Heat capacity of air
∆Hs Heat of sublimation of water
max,scD Diameter of the largest ice particle at Si,max
Dc Volume sphere-equivalent diameter of an ice particle
Dg, dry Geometric mean diameter of the dry aerosol size distribution
Do Diameter of a liquid aerosol particle
Dv Bulk water vapor diffusion coefficient

35
fc Fraction of frozen particles at Si,max
g Acceleration of gravity
),( oc DDΓ Growth function defined in equation (20)
Γ Effective growth parameter defined in equation (25)
1Γ , 2Γ Parameters defined in equation (6).
J Nucleation rate coefficient
)(Tk Constant defined in equation (18)
ka Thermal conductivity of air
µ Parameter defined in equation (20)
Mw, Ma Molar masses of water and air, respectively
),( occ DDn Ice crystal number distribution function originated at Do
)( cc Dn Ice crystal number distribution function
)( oo Dn Liquid aerosol size distribution function
)( oo Dn Average liquid aerosol size distribution function during freezing
maxScN Ice crystal number concentration at Si,max
Nc Ice crystal number concentration
No Aerosol number concentration
p Ambient pressure
oip Ice saturation vapor pressure
Pf , ),( tDP of Cumulative probability of freezing
ρi, ρa Ice and air densities, respectively

36
R Universal gas constant
σg Geometric dispersion of the liquid aerosol size distribution
σg, dry Geometric dispersion of the dry aerosol size distribution
Si Water vapor saturation ratio with respect to ice
Si,eq Equilibrium ice saturation ratio
Si,max Maximum ice saturation ratio
So Ice saturation ratio at the beginning of freezing
So’ Ice saturation ratio at which an ice crystal was formed
T Temperature
t Time
to Time of freezing
V Updraft velocity
ov Volume of a liquid droplet of size Do
wi Ice mass mixing ratio
),( tDoψ Ice nucleation function

37
7 References
Abbatt, J. P. D., S. Benz, D. J. Cziczo, Z. Kanji, and O. Möhler (2006), Solid ammonium
sulfate as ice nuclei: a pathway for cirrus cloud formation, Science, 313, 1770-
1773.
Archuleta, C. M., P. J. DeMott, and S. M. Kreidenweis (2005), Ice nucleation by
surrogates for atmospheric mineral dust and mineral dust/sulfate particles at cirrus
temperatures, Atmos. Chem. Phys., 5, 2617-2634.
Cantrell, W., and A. J. Heymsfield (2005), Production of ice in tropospheric clouds, Bull.
Am. Meteorol. Soc., 86, 795-807.
Chen, Y., P. J. DeMott, S. M. Kreidenweis, D. C. Rogers, and D. E. Sherman (2000), Ice
formation by sulfate and sulfuric acid aerosol particles under upper-tropospheric
conditions, J. Atmos. Sci., 57, 3752-3766.
DeMott, P. J., D. J. Cziczo, A. J. Prenni, D. M. Murphy, S. M. Kreidenweis, D. S.
Thompson, R. Borys, and D. C. Rogers (2003), Measurements of the
concentration and composition of nuclei for cirrus formation, Proc. Natl. Acad.
Sci. USA, 100, 14655-14660.
DeMott, P. J., M. P. Meyers, and R. W. Cotton (1994), Parameterization and impact of
ice initiation processes relevant to numerical model simulations of cirrus clouds,
J. Atmos. Sci., 51, 77-90.
DeMott, P. J., D. C. Rogers, and S. M. Kreidenweis (1997), The susceptibility of ice
formation in upper tropospheric clouds to insoluble aerosol components, J.
Geophys. Res., 102, 19575-19584.

38
DeMott, P. J., D. C. Rogers, S. M. Kreidenweis, Y. Chen, C. H. Twohy, D. G.
Baumgardner, A. J. Heymsfield, and K. R. Chan (1998), The role of
heterogeneous freezing nucleation in upper tropospheric clouds: inferences from
SUCCESS, Geophys. Res. Lett., 25, 1387-1390.
Fountoukis, C., and A. Nenes (2005), Continued development of a cloud droplet
formation parameterization for global climate models, J. Geophys. Res., 110,
D11212, doi:11210.11029/12004JD005591.
Fridlind, A. M., A. S. Ackerman, E. J. Jensen, A. J. Heymsfield, M. R. Poellot, D. E.
Stevens, D. Wang, L. M. Miloshevich, D. G. Baumgardner, P. Lawson, J.
Willson, R. C. Flagan, J. H. Seinfeld, H. H. Jonsson, T. M. VanReken, V.
Varutbangkul, and T. A. Rissman (2004), Evidence for the predominance of mid-
tropospheric aerosols as subtropical anvil cloud nuclei, Science, 304, 718-722.
Gayet, J. F., J. Ovarlez, V. Shcherbakov, J. Ström, U. Schumann, A. Minikin, F. Auriol,
A. Petzold, and M. Monier (2004), Cirrus cloud microphysical and optical
properties at southern and northern midlatitudes during the INCA experiment, J.
Geophys. Res., 109, D20206.
Gelbard, F., and J. H. Seinfeld (1980), Simulation of multicomponent aerosol dynamics,
Journal of Colloid and Interface Science, 78, 485-501.
Gershenzon, M., P. Davidovits, L. R. Williams, Q. Shin, J. T. Jayne, C. H. Kolb, and D.
R. Worsnop (2004), Uptake of H217O(g) and D2O(q) by aqueous sulfuric acid
droplets, J. Phys. Chem. A, 108, 1567-1573.
Gierens, K. (2003), On the transition between heterogeneous and homogeneous freezing
Atmos. Chem. Phys., 3, 437-446.

39
Gierens, K., M. Monier, and J. F. Gayet (2003), The deposition coefficient and its role for
cirrus clouds, J. Geophys. Res., 108, 4069.
Haag, W., B. Kärcher, S. Schaefers, O. Stetzer, O. Möhler, U. Schurath, M. Krämer, and
C. Schiller (2003a), Numerical simulations of homogeneous freezing processes in
the aerosol chamber AIDA, Atmos. Chem. Phys., 3, 195-210.
Haag, W., B. Kärcher, J. Strom, A. Minikin, U. Lohmann, J. Ovarlez, and A. Stohl
(2003b), Freezing thresholds and cirrus formation mechanisms inferred from in
situ measurements of relative humidity, Atmos. Chem. Phys., 3, 1791-1806.
Hartmann, D. L., J. R. Holton, and Q. Fu (2001), The heat balance of the tropical
tropopause, cirrus, and stratospheric dehydration Geophys. Res. Lett., 28, 1969-
1972.
Haynes, D. R., N. J. Tro, and S. M. George (1992), Condensation and evaporation of H2O
on ice surfaces, J. Phys. Chem., 96, 8502-8509.
Heymsfield, A. J., and L. M. Miloshevich (1995), Relative humidity and temperature
influences on cirrus formation and evolution: observations from wave clouds and
FIRE II, J. Atmos. Sci., 52, 4302.
Heymsfield, A. J., and R. M. Sabin (1989), Cirrus crystal nucleation by homogenous
freezing of solution droplets., J. Atmos. Sci., 46, 2252.
Hoyle, C. R., B. P. Luo, and T. Peter (2005), The origin of high ice crystal number
densities in cirrus clouds, J. Atmos. Sci., 62, 2658-2579.
IPCC (2007), Climate change 2007: the physical basis. Contribution of working group I
to the fourth assessment report of the Intergovernmental Panel on Climate

40
Change. , Cambridge University Press, Cambridge, United Kingdom and New
York, NY, USA.
Jensen, E. J., and O. B. Toon (1994), Ice nucleation in the upper troposphere: sensitivity
to aerosol number density, temperature, and cooling rate, Geophys. Res. Lett., 21,
2019-2022.
Jensen, E. J., O. B. Toon, D. L. Westphal, S. Kinne, and A. J. Heymsfield (1994),
Microphysical modeling of cirrus 1. Comparison with 1986 FIRE IFO
measurements, J. Geophys. Res., 99, 10421-10442.
Kärcher, B., J. Hendricks, and U. Lohmann (2006), Physically based parameterization of
cirrus cloud formation for use in global atmospheric models, J. Geophys. Res.,
111, D01205.
Kärcher, B., and T. Koop (2005), The role of organic aerosols in homogeneous ice
formation, Atmos. Chem. Phys., 5, 703-714.
Kärcher, B., and U. Lohmann (2002a), A parameterization of cirrus cloud formation:
homogeneous freezing including effects or aerosol size, J. Geophys. Res., 107,
4698, doi:4610.1029/2001JD001429.
Kärcher, B., and U. Lohmann (2002b), A parameterization of cirrus cloud formation:
homogeneous freezing of supercooled aerosols, J. Geophys. Res., 107, 4010,
doi:4010.1029/2001JD000470.
Kärcher, B., and U. Lohmann (2003), A parameterization of cirrus cloud formation:
Heterogeneous freezing J. Geophys. Res., 108, 4402,
doi:4410.1029/2002JD003220.

41
Kärcher, B., and J. Ström (2003), The roles of dynamical variabilty and aerosols in cirrus
cloud formation, Atmos. Chem. Phys., 3, 823-838.
Khvorostyanov, V. I., and J. A. Curry (2005), The theory of ice nucleation by
heterogeneous freezing of deliquescent mixed CCN. Part II: parcel model
simulations, J. Atmos. Sci., 62, 261-285.
Khvorostyanov, V. I., H. Morrison, J. A. Curry, D. G. Baumgardner, and P. Lawson
(2006), High supersaturation and modes of ice nucleation in thin tropopause
cirrus: simulation of the 13 July 2002 cirrus regional study of tropical anvils and
cirrus layers case, J. Geophys. Res., 111, D02201,
doi:02210.01029/02004JD005235.
Koenig, R. L. (1972), Parameterization of ice growth for numerical calculations of cloud
dynamics, Mon. Weather Rev., 100, 417-423.
Koop, T., B. Luo, A. Tslas, and T. Peter (2000), Water activity as the determinant for
homogeneous ice nucleation in aqueous solutions, Nature, 406, 611-614.
Lin, H., K. J. Noone, J. Ström, and A. J. Heymsfield (1998), Dynamical influences on
cirrus cloud formation process, J. Atmos. Sci., 55, 1940-1943.
Lin, R., D. Starr, P. J. DeMott, R. Cotton, K. Sassen, E. J. Jensen, B. Kärcher, and X. Liu
(2002), Cirrus parcel model comparison project. Phase 1: The critical components
to simulate cirrus initiation explicitly., J. Atmos. Sci., 59, 2305-2328.
Liou, K. (1986), Influence of cirrus clouds on weather and climate processes: a global
perspective, Mon. Weather Rev., 114, 1167-1199.
Liu, X., and J. E. Penner (2005), Ice nucleation parameterization for global models,
Meteorol. Z., 14, 499-514.

42
Liu, X., J. E. Penner, S. J. Ghan, and M. Wang (2007), Inclusion of ice mycrophysics in
the NCAR Community Atmospheric Model version 3 (CAM3), J. Clim., 20,
4526-4547.
Lohmann, U., and B. Kärcher (2002), First interactive simulations of cirrus clouds
formed by homogeneous freezing in the ECHAM general circulation model J.
Geophys. Res., 107, 4105, doi:4110.1029/2001JD000767.
Minnis, P. (2004), Contrails, cirrus trend, and climate, J. Clim., 17, 1671-1685.
Möhler, O., O. Stetzer, C. Linke, M. Schnaiter, R. Tiede, H. Saathoff, M. Krämer, A.
Mangold, P. Budz, P. Zink, J. Schreiner, K. Mauersberger, W. Haag, B. Kärcher,
and U. Schurath (2003), Experimental investigation of homogeneous freezing of
sulfuric acid particles in the aerosol chamber AIDA, Atmos. Chem. Phys., 3, 211-
223.
Monier, M., W. Wobrock, J. F. Gayet, and A. Flossman (2006), Development of a
detailed microphysics cirrus model tracking aerosol particles. Histories for
interpretation of the recent INCA campaign, J. Atmos. Sci., 63, 504-525.
Murphy, D. M., and T. Koop (2005), Review of the vapour pressures of ice and
supercooled water for atmospheric applications, Q. J. R. Meteorol. Soc., 131,
1539-1565.
Myhre, C. E., C. J. Nielsen, and O. E. Saastad (1998), Density and surface tension of
aqueous H2SO4 at low temperatures J.Chem. Eng. Data, 43, 617-622.
Penner, J. E., D. H. Lister, D. J. Griggs, D. J. Dokken, and M. McFarland (1999),
Aviation and the global atmosphere - A special report of IPCC working groups I

43
and III. Intergovernmental Panel on Climate Change., 365 pp., Cambridge
University Press.
Pruppacher, H. R., and J. D. Klett (1997), Microphysics of clouds and precipitation 2nd
ed., Kluwer Academic Publishers, Boston, MA
Ramanathan, V., and W. Collins (1991), Thermodynamic regulation of ocean warming
by cirrus clouds deduced from observations of 1987 El Nino, Nature, 351, 27-32.
Ren, C., and A. R. Mackenzie (2005), Cirrus parameterization and the role of ice nuclei,
Q. J. R. Meteorol. Soc., 131, 1585-1605.
Sassen, K., and S. Benson (2000), Ice nucleation in cirrus clouds: a model study of the
homogeneous and heterogeneous modes, Geophys. Res. Lett., 27, 521-524.
Seifert, M., J. Strom, R. Krejci, A. Minikin, A. Petzold, J.-F. Gayet, H. Schlager, H.
Ziereis, U. Schumann, and J. Ovarlez (2004), Aerosol-cirrus interactions: a
number based phenomenon at all?, Atmos. Chem. Phys., 4, 293-305.
Seinfeld, J. H., and S. N. Pandis (1998), Atmospheric Chemistry and Physics, John Wiley
and Sons, New York, NY, USA.
Stuber, N., P. Forster, G. Radel, and K. Shine (2006), The importance of the diurnal and
annual cycle of air traffic for contrail radiative forcing, Nature, 441, 864-867.
Tabazadeh, A., and E. J. Jensen (1997), A model description for cirrus nucleation from
homogeneous freezing of sulfate aerosols J. Geophys. Res., 102, 23845-23850.
Tabazadeh, A., O. B. Toon, and E. J. Jensen (1997), Formation and implications of ice
particle nucleation in the stratosphere, Geophys. Res. Lett., 24, 2007-2010.

44
Twomey, S. (1959), The nuclei of natural cloud formation. II. The supersaturation in
natural clouds and the variation of cloud droplet number concentration, Pure
Appl. Geophys., 43, 243-249, doi:210.1007/BF01993560.
Wood, S. E., M. B. Baker, and D. Calhoun (2001), New model for the vapor growth of
hexagonal ice crystals in the atmosphere, J. Geophys. Res., 106, 4845-4870.

45
Table 1. Cloud formation conditions used in evaluation.
Property Values T (K) 200-235 V (m s-1) 0.02-5 αd 0.05-1.0 σg, dry 1.7, 2.3, 2.9 No (cm-3) 10-5000 Dg, dry (nm) 20-160

46
Figure Captions Figure 1. Lagrangian particle-tracking scheme for a hypothetical population of two liquid
droplets during three successive time steps. Circles represent supercooled liquid droplets,
and hexagons ice crystals. Black arrows indicate growth and aging whereas red arrows
onset of freezing. Transition of light to darker shady indicates temporal evolution.
Figure 2. Sketch of the parameterization concept. Circles represent supercooled liquid
droplets, and hexagons ice crystals.
Figure 3. Si, Nc, and ice water content (IWC) profiles obtained from the numerical
solution of the parcel model. Cases considered are those of Lin et al. [2002]. Solid lines
indicates To = 233 K and dashed lines To = 213 K. V=0.04 m s-1 (upper), 0.2 m s-1
(middle), and 1 m s-1 (lower).
Figure 4. Parameterization algorithm.
Figure 5. Si (red, left axes) and Nc (blue, right axes) evolution calculated by the parcel
model. T and V conditions shown are 233 K and 1 m s-1 (top right), 203 K and 1 m s-1
(top left), 233 K and 0.04 m s-1 (bottom right), 203 K and 0.04 m s-1 (bottom left).
Dashed lines represent the time at which Si,max is reached and dotted lines Si evolution
under “free growth”.
Figure 6. Crystal size distribution calculated by the parcel model and the
parameterization at Si,max. Left, T=213 K V= 1.0 m s-1. Right, T=233 K V= 0.2 m s-1. σg, dry
is the geometric dispersion of the aerosol size distribution.
Figure 7. Ice crystal number concentration calculated by the parcel model and the
parameterization. max,scD was calculated using either equation (31) (right) or (32) (left).

47
Gray scale represents the value of αd used in the calculations; dashed lines represent the ±
50 % difference.
Figure 8. Ice crystal number concentration as a function of the updraft velocity,
calculated using the parcel model (symbols), KL2002 (dashed line), LP2005 (dashed-
dotted line), SB2000 (dotted line), and the theoretical (stars), and adjusted (solid line)
parameterizations. Results are shown for T=233 K, p=34000 Pa (right) and T = 213 K,
p=17000 Pa (left), and αd = 0.1 (black) and αd = 1.0 (blue). No=200 cm-3, and Dg,dry = 40
nm.
Figure 9. Ice crystal number concentration as a function of the aerosol number
concentration. Symbols as in Figure 8. Results are shown for V= 0.2 m s-1 (left) and 1 m
s-1, and T=233 K, p=38812 Pa (blue) and T = 213 K, p=27350 Pa (black). αd = 0.1, and
Dg,dry = 40 nm.
Figure 10. Ice crystal number concentration as a function of the aerosol mean dry
diameter. Symbols as in Figure 8. Results are shown for T=233 K, p=34000 Pa (right)
and T = 213 K, p=17000 Pa (left), and αd = 0.1 (black) and αd = 1.0 (blue). No=200 cm-3,
and V= 1 m s-1.

48
FIGURE 1
Particle Tracking
Moving
Grid

49
FIGURE 2

50
time
“free growth” Si,max
Ice germ
(freezing)
“growth tracing-back”
So’
So
Parcel ice saturation
to t time
“free growth” Si,max
Ice germ
(freezing)
“growth tracing-back”
So’
So
Parcel ice saturation
to t
FIGURE 3

51
FIGURE 4

52
FIGURE 5

53
FIGURE 6

54
FIGURE 7

55
FIGURE 8

56
FIGURE 9

57
FIGURE 10