Embed Size (px)
Citation preview
2720 Biophysical Journal Volume 106 June 2014 2720–2728
Paradoxical Results in Perturbation-Based Signaling NetworkReconstruction
Sudhakaran Prabakaran,† Jeremy Gunawardena,† and Eduardo Sontag‡*†Department of Systems Biology, Harvard Medical School, Boston Massachusetts; and ‡Department of Mathematics & BioMaPs Institute forQuantitative Biology, Rutgers University, Piscataway, New Jersey
ABSTRACT Mathematical models are extensively employed to understand physicochemical processes in biological sys-tems. In the absence of detailed mechanistic knowledge, models are often based on network inference methods, which inturn rely upon perturbations to nodes by biochemical means. We have discovered a potential pitfall of the approach underpin-ning such methods when applied to signaling networks. We first show experimentally, and then explain mathematically, howeven in the simplest signaling systems, perturbation methods may lead to paradoxical conclusions: for any given pair of twocomponents X and Y, and depending upon the specific intervention on Y, either an activation or a repression of X could beinferred. This effect is of a different nature from incomplete network identification due to underdetermined data and is a phe-nomenon intrinsic to perturbations. Our experiments are performed in an in vitro minimal system, thus isolating the effect andshowing that it cannot be explained by feedbacks due to unknown intermediates. Moreover, our in vitro system utilizes proteinsfrom a pathway in mammalian (and other eukaryotic) cells that play a central role in proliferation, gene expression, differen-tiation, mitosis, cell survival, and apoptosis. This pathway is the perturbation target of contemporary therapies for various typesof cancers. The results presented here show that the simplistic view of intracellular signaling networks being made up of acti-vation and repression links is seriously misleading, and call for a fundamental rethinking of signaling network analysis andinference methods.
INTRODUCTION
Mathematical models in molecular, cellular, and develop-mental biology, representing intracellular networks orga-nized into modular components that interact positively(activation) or negatively (inhibition or repression), areextensively employed to understand physicochemical pro-cesses in biological systems (1–4). The lack of mechanisticknowledge presents a challenge to constructing accuratemodels and establishing rigorous links to experimentaldata (5), and has led to the widespread adoption of reverseengineering and network inference methods that aim to un-ravel network topology from quantitative data gatheredfrom perturbations (e.g., small-molecule kinase inhibitors,over- or underexpression of enzymes, gene knockdowns,siRNAs) (6–10). However, underlying all these methods isthe assumption that perturbations to a node will uniquelydetermine the sign of its direct effects on other nodes.Here we report on a surprising discovery that contradictsthis widespread assumption: perturbation methods maylead to paradoxical conclusions, with either an activationor a repression of a second component being inferred, de-pending upon the particular type of intervention performedon the first component.
We carried out our experiments on an in vitro reconsti-tuted system involving the proteins from the canonicalmitogen-activated protein kinase/extracellular signal-regu-lated kinases (MAPK/ERK) pathway. This comprises a
Submitted January 23, 2014, and accepted for publication April 23, 2014.
*Correspondence: [email protected]
Editor: Stanislav Shvartsman.
� 2014 by the Biophysical Society
0006-3495/14/06/2720/9 $2.00
set of phosphorylation/dephosphorylation covalent modifi-cation cycles found in all eukaryotes (11–17), and isinvolved in the regulation of proliferation, gene expres-sion, differentiation, mitosis, cell survival, apoptosis, andother processes (18). Our rationale for testing our ideason an in vitro system is that, if a method fails there, thereis no justification for believing that it will work in a morecomplicated in vivo context. We also analyzed a genericmathematical model that shows the generality of the phe-nomenon for other enzymatic systems. Our results showthat the simplistic view of signaling networks throughactivation and repression links is seriously misleading,calling for a fundamental rethinking of network analysisand inference methods. This is especially urgent becausethe perturbation of pathway activities (and, specifically,the targeting of MAPK/ERK components) is the focusof current-generation drugs to treat advanced melanomasand a wide range of tumors including lung and thyroidcancers (19).
Perturbation methods
Awidely used strategy for reverse engineering, and indeed acommon feature of many popular approaches, relies on thefollowing simple principle: to deduce the character of adirected interaction from a network node Y to anothernode X, apply a perturbation that locally affects Y, and quan-tify the change in X (20). The perturbation used experimen-tally might be performed through small-molecule kinaseinhibitors, over- or underexpression of enzymes, siRNAs,
http://dx.doi.org/10.1016/j.bpj.2014.04.031

Paradoxical Results in Network Reconstruction 2721
or other interventions. If (positively) first-order correlatedeffects are observed, an arrow Y / X is drawn, in thenetwork being studied, to graphically represent an activa-tion. If the effects are of opposite sign, a blunt arrow Y xX is drawn, to represent an inactivation, repression, degrada-tion, or inhibition. Otherwise, no arrow is drawn betweenthese nodes (Fig. 1, a–c).
In this work, we undertook to test experimentally thefollowing question: is it possible that the nature of the spe-cific perturbations may affect the results? We discoveredthat, indeed, perturbation methods often lead to paradoxicalconclusions, that is, different perturbations, on the samenode, may lead to opposite conclusions. Specifically, evenfor the simplest systems, it is possible that, for the samepair of components X and Y, depending upon the specifictype of intervention on Y, either an activation Y / X or arepression Y x X might be inferred. We emphasize thatthis effect is of a completely different nature from thewell-studied issue of incomplete network identificationdue to underdetermined data (21). It is a phenomenonintrinsic to perturbation approaches, no matter how muchdata is collected.
EXPERIMENTS AND THEORY
Experiments
We carried out our experiments on an in vitro reconstitutedsystem involving the proteins from the canonical Raf/Mek/Erk MAPK/ERK pathway, a cascade of phosphorylations inwhich Raf activates Mek, which, when active, in turn acti-vates Erk. An example in which MAPK networks are usedas a subject of perturbation-based reverse engineering isSantos et al. (22).
Specifically, our system consists of
1. Constitutively active Raf;2. Unphosphorylated Mek;3. Unphosphorylated Erk with Threonine T188 in the acti-
vation loop mutated to Valine (Erk-T188V), leaving onlyTyrosine Y190 to be phosphorylated by Mek;
4. Protein Phosphatase 2A (PP2A); and5. Protein Tyrosine phosphatase (PTP).
FIGURE 1 Perturbation experiments. (a) Correlated response suggests activa
drawn in graph. To see this figure in color, go online.
For simplicity, we refer to Erk-T188V simply as ‘‘Erk’’. Thepossible enzymatic reactions between these proteins are asfollows:
1. Constitutively active Raf will doubly phosphorylate Mekto form activated Mekpp,
2. Mekpp in turn will phosphorylate Erk to form Erkp,3. PTP will only dephosphorylate Erkp, and4. PP2A will only dephosphorylate Mekpp.
The choice of Erk-T188V ensures that PP2A does not alsodephosphorylate Erkp. In the context of our general discus-sion of perturbation methods, X is Mekpp, and Y is Erkp.Our perturbations consist of modifying the total amountsof Erk or PTP.
We measured doubly-phosphorylated Mek and singly-phosphorylated Erk using an MS method, which we havepreviously shown to be significantly more accurate thanquantitative Western blots with phosphospecific antibodies(23). When the concentration of PTP is increased in the re-action conditions (see Materials and Methods), we observeddecreased Erkp and increased Mekpp. In contrast, when theconcentration of Erk is increased in the reaction conditions(see Materials and Methods), we observed increased Erkpand increased Mekpp (Fig. 2 a). Western blots supportedthe MS results with less quantitative discrimination(Fig. 2 b).
Thus, our minimalist, in vitro system clearly shows thatopposite inferences between two nodes in a reaction (X asMekpp and Y as Erkp) can be inferred depending uponexperiment: a perturbation in which we increase PTP leadsto concluding an inhibitory edge Y x X, while a perturba-tion in which we increase Erk would lead to an inferenceof an activation Y / X. Every network reverse engineeringalgorithm based on these experiments and using activeMekpp and Erkp as nodes will suffer from this paradoxicalresult. The only solution to the ambiguity is to add to thenetwork description the various phosphorylation states,and to measure these as well.
Modeling
To understand these experimental results, we formulatedand analyzed a minimal mathematical model that suggests
tion. (b) Anti-correlation suggests repression. (c) If no response, no edge
Biophysical Journal 106(12) 2720–2728
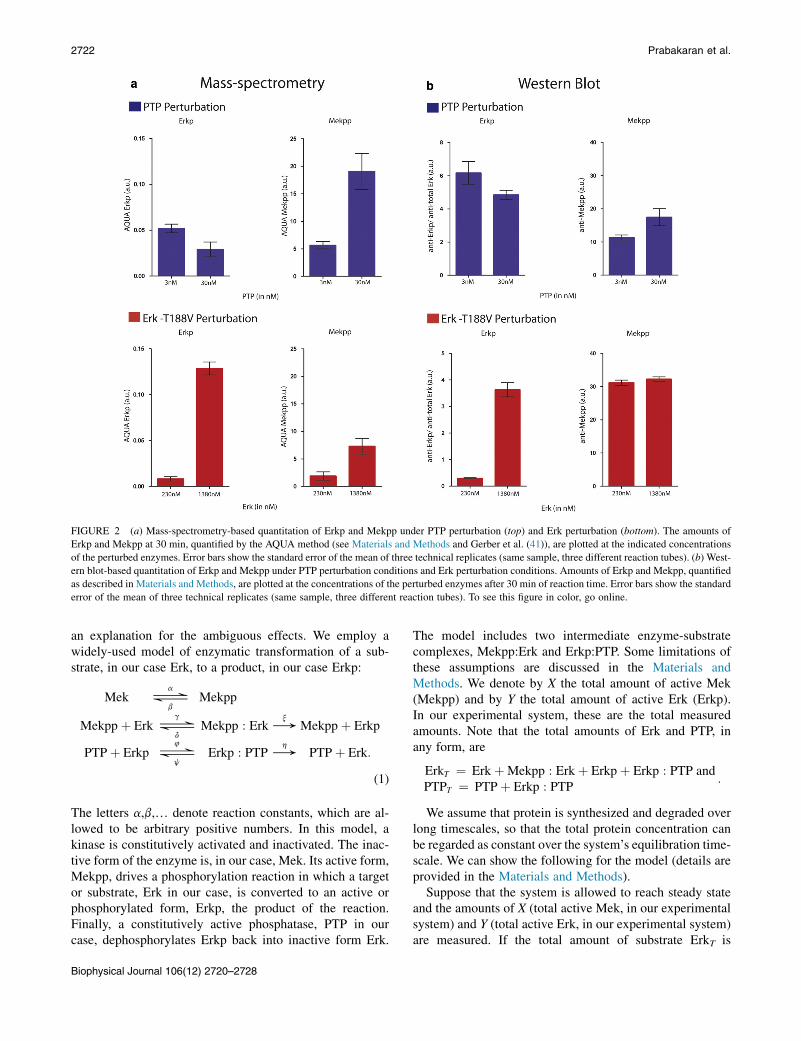
FIGURE 2 (a) Mass-spectrometry-based quantitation of Erkp and Mekpp under PTP perturbation (top) and Erk perturbation (bottom). The amounts of
Erkp and Mekpp at 30 min, quantified by the AQUA method (see Materials and Methods and Gerber et al. (41)), are plotted at the indicated concentrations
of the perturbed enzymes. Error bars show the standard error of the mean of three technical replicates (same sample, three different reaction tubes). (b) West-
ern blot-based quantitation of Erkp and Mekpp under PTP perturbation conditions and Erk perturbation conditions. Amounts of Erkp and Mekpp, quantified
as described in Materials and Methods, are plotted at the concentrations of the perturbed enzymes after 30 min of reaction time. Error bars show the standard
error of the mean of three technical replicates (same sample, three different reaction tubes). To see this figure in color, go online.
2722 Prabakaran et al.
an explanation for the ambiguous effects. We employ awidely-used model of enzymatic transformation of a sub-strate, in our case Erk, to a product, in our case Erkp:
Mek #a
bMekpp
Mekppþ Erk#g
dMekpp : Erk/
xMekppþ Erkp
PTPþ Erkp#4
jErkp : PTP/
hPTPþ Erk:
(1)
The letters a,b,. denote reaction constants, which are al-
lowed to be arbitrary positive numbers. In this model, akinase is constitutively activated and inactivated. The inac-tive form of the enzyme is, in our case, Mek. Its active form,Mekpp, drives a phosphorylation reaction in which a targetor substrate, Erk in our case, is converted to an active orphosphorylated form, Erkp, the product of the reaction.Finally, a constitutively active phosphatase, PTP in ourcase, dephosphorylates Erkp back into inactive form Erk.Biophysical Journal 106(12) 2720–2728
The model includes two intermediate enzyme-substratecomplexes, Mekpp:Erk and Erkp:PTP. Some limitations ofthese assumptions are discussed in the Materials andMethods. We denote by X the total amount of active Mek(Mekpp) and by Y the total amount of active Erk (Erkp).In our experimental system, these are the total measuredamounts. Note that the total amounts of Erk and PTP, inany form, are
ErkT ¼ ErkþMekpp : Erkþ Erkpþ Erkp : PTP andPTPT ¼ PTPþ Erkp : PTP
:
We assume that protein is synthesized and degraded overlong timescales, so that the total protein concentration canbe regarded as constant over the system’s equilibration time-scale. We can show the following for the model (details areprovided in the Materials and Methods).
Suppose that the system is allowed to reach steady stateand the amounts of X (total active Mek, in our experimentalsystem) and Y (total active Erk, in our experimental system)are measured. If the total amount of substrate ErkT is
Paradoxical Results in Network Reconstruction 2723
increased, and the system is allowed to reach steady state,then it will be found that the levels of both Y and X haveincreased: perturbation analysis would suggest that Y /X. If, instead, the total amount of Erk phosphotase PTPT isdecreased, and the system is allowed to reach steady stateagain, then it will be found that the amount of Y has onceagain increased, but the amount of X has now decreased:perturbation analysis would instead suggest that Y x X.
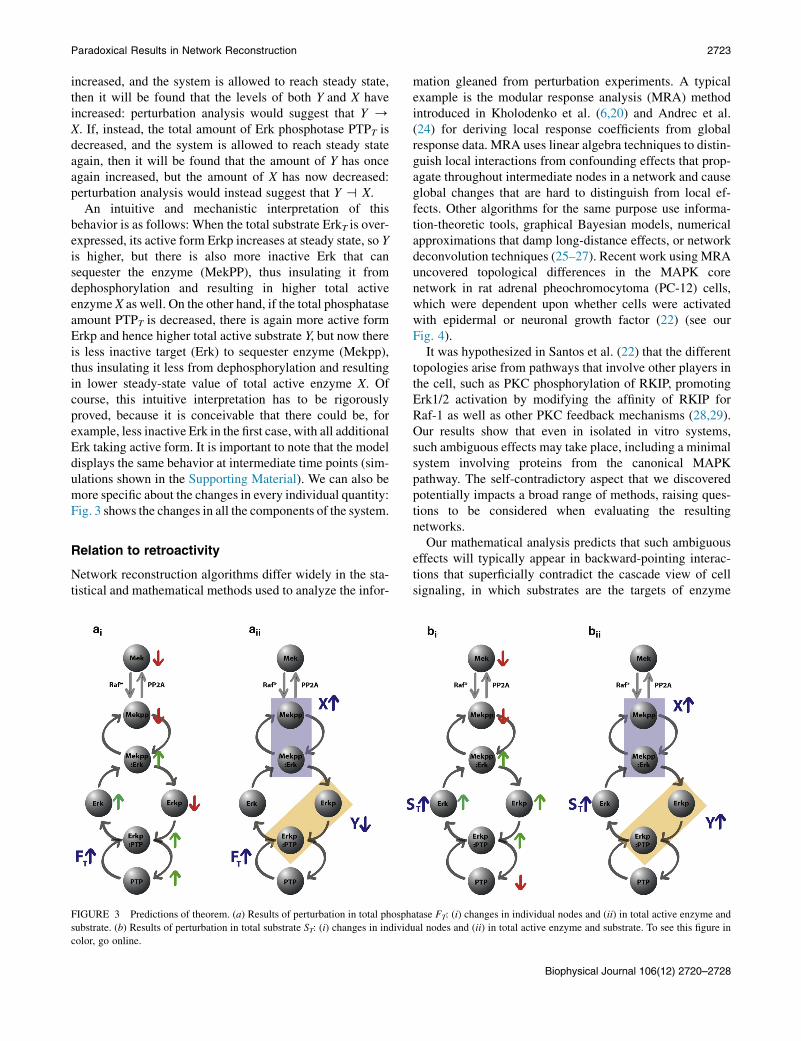
An intuitive and mechanistic interpretation of thisbehavior is as follows: When the total substrate ErkT is over-expressed, its active form Erkp increases at steady state, so Yis higher, but there is also more inactive Erk that cansequester the enzyme (MekPP), thus insulating it fromdephosphorylation and resulting in higher total activeenzyme X as well. On the other hand, if the total phosphataseamount PTPT is decreased, there is again more active formErkp and hence higher total active substrate Y, but now thereis less inactive target (Erk) to sequester enzyme (Mekpp),thus insulating it less from dephosphorylation and resultingin lower steady-state value of total active enzyme X. Ofcourse, this intuitive interpretation has to be rigorouslyproved, because it is conceivable that there could be, forexample, less inactive Erk in the first case, with all additionalErk taking active form. It is important to note that the modeldisplays the same behavior at intermediate time points (sim-ulations shown in the Supporting Material). We can also bemore specific about the changes in every individual quantity:Fig. 3 shows the changes in all the components of the system.
Relation to retroactivity
Network reconstruction algorithms differ widely in the sta-tistical and mathematical methods used to analyze the infor-
FIGURE 3 Predictions of theorem. (a) Results of perturbation in total phosph
substrate. (b) Results of perturbation in total substrate ST: (i) changes in individ
color, go online.
mation gleaned from perturbation experiments. A typicalexample is the modular response analysis (MRA) methodintroduced in Kholodenko et al. (6,20) and Andrec et al.(24) for deriving local response coefficients from globalresponse data. MRA uses linear algebra techniques to distin-guish local interactions from confounding effects that prop-agate throughout intermediate nodes in a network and causeglobal changes that are hard to distinguish from local ef-fects. Other algorithms for the same purpose use informa-tion-theoretic tools, graphical Bayesian models, numericalapproximations that damp long-distance effects, or networkdeconvolution techniques (25–27). Recent work using MRAuncovered topological differences in the MAPK corenetwork in rat adrenal pheochromocytoma (PC-12) cells,which were dependent upon whether cells were activatedwith epidermal or neuronal growth factor (22) (see ourFig. 4).
It was hypothesized in Santos et al. (22) that the differenttopologies arise from pathways that involve other players inthe cell, such as PKC phosphorylation of RKIP, promotingErk1/2 activation by modifying the affinity of RKIP forRaf-1 as well as other PKC feedback mechanisms (28,29).Our results show that even in isolated in vitro systems,such ambiguous effects may take place, including a minimalsystem involving proteins from the canonical MAPKpathway. The self-contradictory aspect that we discoveredpotentially impacts a broad range of methods, raising ques-tions to be considered when evaluating the resultingnetworks.
Our mathematical analysis predicts that such ambiguouseffects will typically appear in backward-pointing interac-tions that superficially contradict the cascade view of cellsignaling, in which substrates are the targets of enzyme
atase FT: (i) changes in individual nodes and (ii) in total active enzyme and
ual nodes and (ii) in total active enzyme and substrate. To see this figure in
Biophysical Journal 106(12) 2720–2728
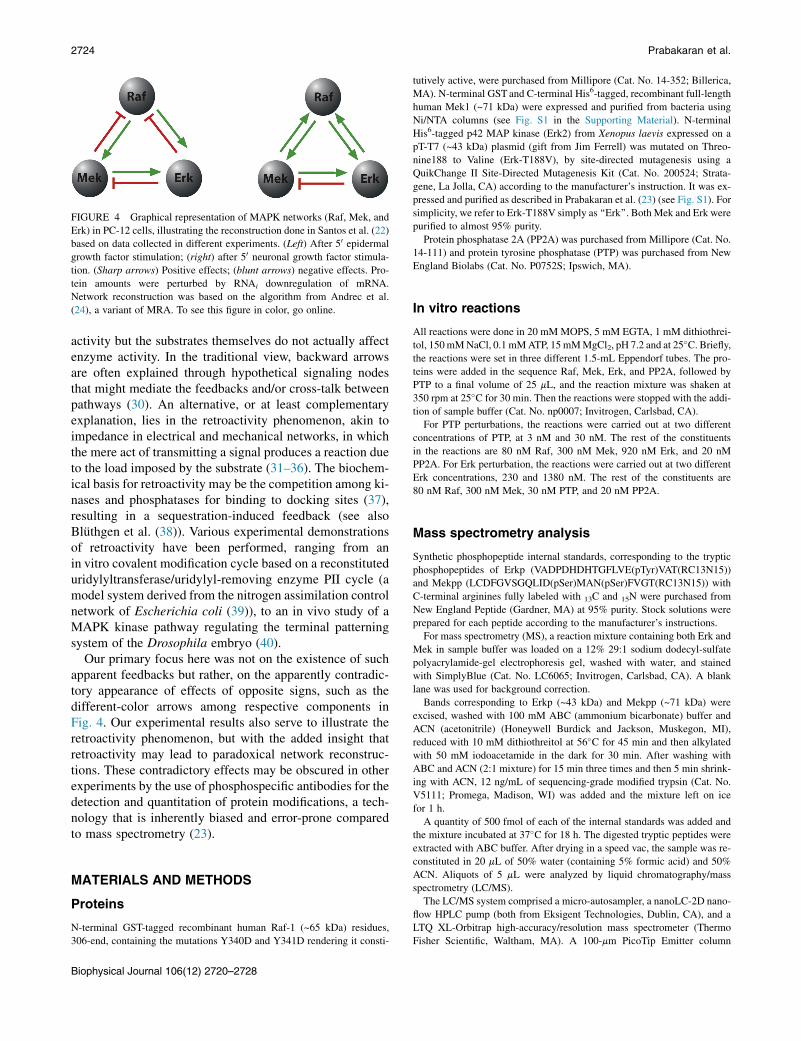
FIGURE 4 Graphical representation of MAPK networks (Raf, Mek, and
Erk) in PC-12 cells, illustrating the reconstruction done in Santos et al. (22)
based on data collected in different experiments. (Left) After 50 epidermal
growth factor stimulation; (right) after 50 neuronal growth factor stimula-
tion. (Sharp arrows) Positive effects; (blunt arrows) negative effects. Pro-
tein amounts were perturbed by RNAi downregulation of mRNA.
Network reconstruction was based on the algorithm from Andrec et al.
(24), a variant of MRA. To see this figure in color, go online.
2724 Prabakaran et al.
activity but the substrates themselves do not actually affectenzyme activity. In the traditional view, backward arrowsare often explained through hypothetical signaling nodesthat might mediate the feedbacks and/or cross-talk betweenpathways (30). An alternative, or at least complementaryexplanation, lies in the retroactivity phenomenon, akin toimpedance in electrical and mechanical networks, in whichthe mere act of transmitting a signal produces a reaction dueto the load imposed by the substrate (31–36). The biochem-ical basis for retroactivity may be the competition among ki-nases and phosphatases for binding to docking sites (37),resulting in a sequestration-induced feedback (see alsoBluthgen et al. (38)). Various experimental demonstrationsof retroactivity have been performed, ranging from anin vitro covalent modification cycle based on a reconstituteduridylyltransferase/uridylyl-removing enzyme PII cycle (amodel system derived from the nitrogen assimilation controlnetwork of Escherichia coli (39)), to an in vivo study of aMAPK kinase pathway regulating the terminal patterningsystem of the Drosophila embryo (40).
Our primary focus here was not on the existence of suchapparent feedbacks but rather, on the apparently contradic-tory appearance of effects of opposite signs, such as thedifferent-color arrows among respective components inFig. 4. Our experimental results also serve to illustrate theretroactivity phenomenon, but with the added insight thatretroactivity may lead to paradoxical network reconstruc-tions. These contradictory effects may be obscured in otherexperiments by the use of phosphospecific antibodies for thedetection and quantitation of protein modifications, a tech-nology that is inherently biased and error-prone comparedto mass spectrometry (23).
MATERIALS AND METHODS
Proteins
N-terminal GST-tagged recombinant human Raf-1 (~65 kDa) residues,
306-end, containing the mutations Y340D and Y341D rendering it consti-
Biophysical Journal 106(12) 2720–2728
tutively active, were purchased from Millipore (Cat. No. 14-352; Billerica,
MA). N-terminal GSTand C-terminal His6-tagged, recombinant full-length
human Mek1 (~71 kDa) were expressed and purified from bacteria using
Ni/NTA columns (see Fig. S1 in the Supporting Material). N-terminal
His6-tagged p42 MAP kinase (Erk2) from Xenopus laevis expressed on a
pT-T7 (~43 kDa) plasmid (gift from Jim Ferrell) was mutated on Threo-
nine188 to Valine (Erk-T188V), by site-directed mutagenesis using a
QuikChange II Site-Directed Mutagenesis Kit (Cat. No. 200524; Strata-
gene, La Jolla, CA) according to the manufacturer’s instruction. It was ex-
pressed and purified as described in Prabakaran et al. (23) (see Fig. S1). For
simplicity, we refer to Erk-T188V simply as ‘‘Erk’’. Both Mek and Erk were
purified to almost 95% purity.
Protein phosphatase 2A (PP2A) was purchased from Millipore (Cat. No.
14-111) and protein tyrosine phosphatase (PTP) was purchased from New
England Biolabs (Cat. No. P0752S; Ipswich, MA).
In vitro reactions
All reactions were done in 20 mMMOPS, 5 mM EGTA, 1 mM dithiothrei-
tol, 150mMNaCl, 0.1 mMATP, 15mMMgCl2, pH 7.2 and at 25�C. Briefly,the reactions were set in three different 1.5-mL Eppendorf tubes. The pro-
teins were added in the sequence Raf, Mek, Erk, and PP2A, followed by
PTP to a final volume of 25 mL, and the reaction mixture was shaken at
350 rpm at 25�C for 30 min. Then the reactions were stopped with the addi-
tion of sample buffer (Cat. No. np0007; Invitrogen, Carlsbad, CA).
For PTP perturbations, the reactions were carried out at two different
concentrations of PTP, at 3 nM and 30 nM. The rest of the constituents
in the reactions are 80 nM Raf, 300 nM Mek, 920 nM Erk, and 20 nM
PP2A. For Erk perturbation, the reactions were carried out at two different
Erk concentrations, 230 and 1380 nM. The rest of the constituents are
80 nM Raf, 300 nM Mek, 30 nM PTP, and 20 nM PP2A.
Mass spectrometry analysis
Synthetic phosphopeptide internal standards, corresponding to the tryptic
phosphopeptides of Erkp (VADPDHDHTGFLVE(pTyr)VAT(RC13N15))
and Mekpp (LCDFGVSGQLID(pSer)MAN(pSer)FVGT(RC13N15)) with
C-terminal arginines fully labeled with 13C and 15N were purchased from
New England Peptide (Gardner, MA) at 95% purity. Stock solutions were
prepared for each peptide according to the manufacturer’s instructions.
For mass spectrometry (MS), a reaction mixture containing both Erk and
Mek in sample buffer was loaded on a 12% 29:1 sodium dodecyl-sulfate
polyacrylamide-gel electrophoresis gel, washed with water, and stained
with SimplyBlue (Cat. No. LC6065; Invitrogen, Carlsbad, CA). A blank
lane was used for background correction.
Bands corresponding to Erkp (~43 kDa) and Mekpp (~71 kDa) were
excised, washed with 100 mM ABC (ammonium bicarbonate) buffer and
ACN (acetonitrile) (Honeywell Burdick and Jackson, Muskegon, MI),
reduced with 10 mM dithiothreitol at 56�C for 45 min and then alkylated
with 50 mM iodoacetamide in the dark for 30 min. After washing with
ABC and ACN (2:1 mixture) for 15 min three times and then 5 min shrink-
ing with ACN, 12 ng/mL of sequencing-grade modified trypsin (Cat. No.
V5111; Promega, Madison, WI) was added and the mixture left on ice
for 1 h.
A quantity of 500 fmol of each of the internal standards was added and
the mixture incubated at 37�C for 18 h. The digested tryptic peptides were
extracted with ABC buffer. After drying in a speed vac, the sample was re-
constituted in 20 mL of 50% water (containing 5% formic acid) and 50%
ACN. Aliquots of 5 mL were analyzed by liquid chromatography/mass
spectrometry (LC/MS).
The LC/MS system comprised a micro-autosampler, a nanoLC-2D nano-
flow HPLC pump (both from Eksigent Technologies, Dublin, CA), and a
LTQ XL-Orbitrap high-accuracy/resolution mass spectrometer (Thermo
Fisher Scientific, Waltham, MA). A 100-mm PicoTip Emitter column

Paradoxical Results in Network Reconstruction 2725
(New Objective, Woburn, MA) was packed in-house using 5 mm, 10-nm
pore size Magic C18 beads (Michrom BioResources, Auburn, CA). A 60-
min gradient, 95–20% A, 5–80% B, in the first 10 min for Mekpp
doubly-charged phosphopeptide (LCDFGVSGQLID(pSer)MAN(pSer)
FVGTR) to elute was utilized for quantifying Mek phosphorylation, along
with two targeted full-scan windows 5 2.5 m/z for the doubly-phosphory-
lated peptide and its corresponding internal standard (A ¼ 0.2% formic aid
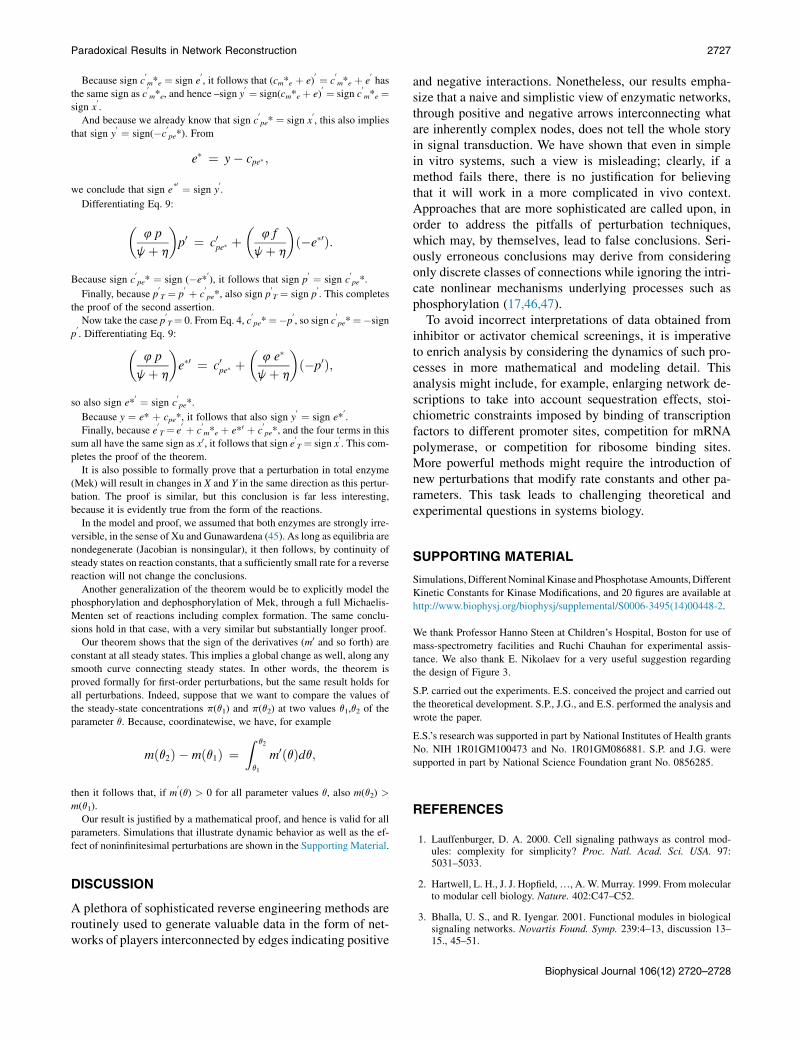
in water and B ¼ 0.2% formic acid in ACN). Fig. S2 illustrates a represen-
tative chromatogram, mass spectrum of doubly-charged Mekpp and mass-
spectrum of its internal standard. A 60-min gradient, 95–65% A, 5–35% B
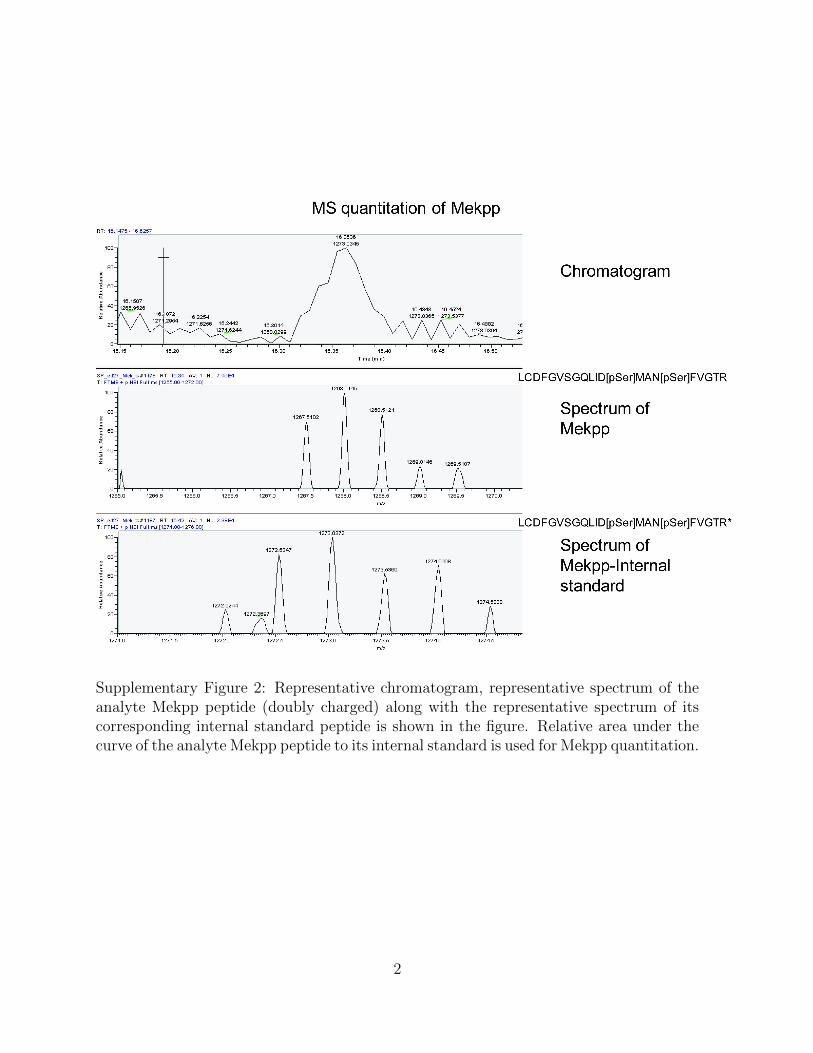
was utilized for Erkp triply-charged phosphopeptide (VADPDHDHTGFL
VE(pTyr)VATR) to elute with two targeted full-scan windows 5 2.5 m/z
for the monophosphorylated peptide and its corresponding internal stan-
dard. Fig. S3 illustrates a representative chromatogram, mass-spectrum of
triply-charged Erkp and mass-spectrum of its internal standard. The
amounts of both Mekpp and Erkp were quantified using the AQUA method
(41) by taking the peak-area ratio of the phosphorylated peptide to its cor-
responding internal standard.
Peak-area integration of extracted ion chromatograms (50.17 m/z of the
most abundant isotope), blank correction, and calculation of sample/inter-
nal standard ratios were programmed in the software XCALIBUR (Thermo
Scientific). The intensities of the phosphorylated peptides of Mek and Erk,
normalized to their corresponding internal standards, are plotted in Fig. 2
dm=dt ¼ � am þ bm�
dm�=dt ¼ am � bm� � gm�e þ ðdþ xÞcm�ede=dt ¼ � gm�e þ dcm�e þ hc
pe�dcm�e=dt ¼ gm�e � ðdþ xÞcm�ede�=dt ¼ xcm�e þ jc
pe� � 4pe�
dp=dt ¼ ðjþ hÞcpe� � 4pe�
dcpe�
�dt ¼ � ðjþ hÞc
pe� þ 4pe�:
(2)
using the software GRAPHPAD PRISM Ver. 4 (GraphPad Software, La
Jolla, CA).
Western blot analysis
For the antibody analysis of Fig. 2 b, samples in sample buffer were heated
at 70�C for 10 min and 100 pg/well of each sample was loaded in triplicate
on a 15-well 12% 29:1 sodium dodecyl-sulfate polyacrylamide-gel electro-
phoresis gel (nine technical replicates for each data point). For the antibody
analysis of Fig. S4, Fig. S5, and Fig. S6, three technical replicates were
loaded for each reaction. After separation, proteins were transferred onto
transfer membranes (Cat. No. IPVH00010; Millipore) for 1 h, incubated
with blocking buffer (Cat. No. 92740-000; LI-COR Biosciences, Lincoln,
NE) for 60 min at room temperature, and then incubated with rabbit
anti-phospho-Mek antibody (Cat. No. 2338; Cell Signaling Technology,
Beverly, MA) at 1:2000 dilution and mouse anti-phospho-tyrosine-Erk
(monoclonal anti-MAP kinase, monophosphorylated tyrosine produced in
mouse (Cat. No. M3682; Sigma, St. Louis, MO)) along with rabbit anti-to-
tal Erk (Cat. No. 06-182; Millipore) antibody at 1:2000 overnight at 4�C.Membranes were washed four times with PBS (phosphate-buffered sa-
line) and incubated with IRDye 680, goat anti-rabbit IgG (Cat. No. 926-
32221; LI-COR Biosciences) at 1:1000 dilution, and IRDye 800, goat
anti-mouse IgG (Cat. No. 926-32210; LI-COR Biosciences) at 1:10 000
dilution and for 1 h at room temperature in the dark. Finally, membranes
were washed four times with PBS and scanned with the Odyssey Infrared
Imager (LI-COR Biosciences) at 169-mm resolution, medium-quality, and
intensity level 3 for both 680 and 800 channels. Bands were quantified
with ODYSSEY software (Ver. 2.3; LI-COR). Each band was five times
zoomed, manually outlined and default background correction settings (me-
dian, border width 2, top-down) used to determine the integrated intensity.
Fig. S4 illustrates a representative Western blot used for the experiment.
Mek and Erk due to their different molecular weights run to different posi-
tions on the gel. Red bands indicate IRDye680 channel and green bands indi-
cate IRDye800 channel. Their overlaid images are also shown in Fig. S4.
Intensity from the red channel is used for the Mekpp quantitation while
the relative intensity of the green channel to the red one is used for quantita-
tion of Erkp ((23)). The intensity of the 680 channel for Mekpp and the 800
channel for Erkp were plotted using GRAPHPAD PRISM, Ver. 4.
Details of model
Assuming that protein is synthesized and degraded over long timescales, so
that the total protein concentration can be regarded as constant over the sys-
tem’s equilibration timescale, the mass-action kinetics’ differential equa-
tions governing the time evolution of the components in the chemical
reaction (1) is given by the set of ordinary differential equations shown
in Eq. 2. For simplicity, we use the following lower-case variables to indi-
cate the molar concentrations of components: cm*e¼ [Mekpp : Erk]; cpe*¼[Erkp : PTP]; e ¼ [Erk]; e* ¼ [Erkp]; m ¼ [Mek]; m* ¼ [Mekpp]; and p ¼[PTP].
The letters a, b,. denote reaction constants, which are allowed to be arbi-
trary positive numbers for the purpose of our mathematical arguments. The
amounts of constitutively active Raf and protein phosphatase 2A (PP2A)
are subsumed by the values of a and b. Total concentration of active kinase,
in free (Mekpp) or bound (Mekpp:Erk) form, is denoted by x. Total concen-
tration of active target, in free (Erkp) or bound (Erkp:PTP) form, is denoted
by y.
The following three conservation laws hold along any solutions of the
system
mþ m� þ cm�e ¼ m�T ; (3)
where m*T is the total amount of enzyme in any form (inactive, active but
free, or bound to complex),
pþ cpe� ¼ pT ; (4)
where pT is total amount of phosphatase (free or bound), and
eþ cm�e þ e� þ cpe� ¼ eT ; (5)
where eT is the total amount of substrate in any form.
We will show next that, for the model in Eqs. 1 and 2, from a perturba-
tion in total phosphatase pT, one would deduce a repression arrow Y x X,
but from a perturbation in total substrate eT, one would deduce an activa-
tion arrow Y / X. Specifically, if pT is increased, then, at steady state, y
decreases and x increases; if, instead, eT is increased, then both y and x
increase.
Biophysical Journal 106(12) 2720–2728
2726 Prabakaran et al.
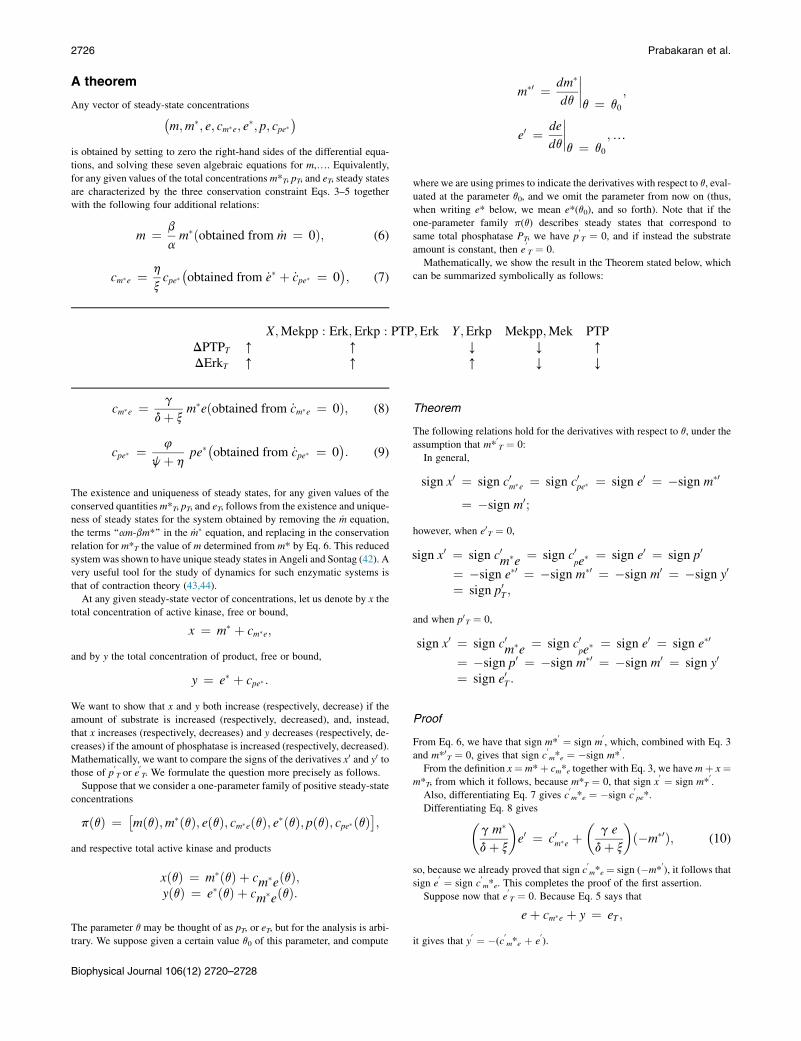
A theorem
Any vector of steady-state concentrations�m;m�; e; cm�e; e
�; p; cpe��
is obtained by setting to zero the right-hand sides of the differential equa-
tions, and solving these seven algebraic equations for m,.. Equivalently,
for any given values of the total concentrations m*T, pT, and eT, steady states
are characterized by the three conservation constraint Eqs. 3–5 together
with the following four additional relations:
m ¼ b
am�ðobtained from _m ¼ 0Þ; (6)
cm�e ¼ hcpe�
�obtained from _e� þ _cpe� ¼ 0
�; (7)
x
X;Mekpp : Erk;Erkp : PTP;Erk Y;Erkp Mekpp;Mek PTPDPTPT [ [ Y Y [DErkT [ [ [ Y Y
cm�e ¼ gm�eðobtained from _cm�e ¼ 0Þ; (8)
dþ x
cpe� ¼ 4pe�
�obtained from _cpe� ¼ 0
�: (9)
jþ h
The existence and uniqueness of steady states, for any given values of the
conserved quantitiesm*T, pT, and eT, follows from the existence and unique-
ness of steady states for the system obtained by removing the _m equation,
the terms ‘‘am-bm*’’ in the _m� equation, and replacing in the conservation
relation for m*T the value of m determined from m* by Eq. 6. This reduced
system was shown to have unique steady states in Angeli and Sontag (42). A
very useful tool for the study of dynamics for such enzymatic systems is
that of contraction theory (43,44).
At any given steady-state vector of concentrations, let us denote by x the
total concentration of active kinase, free or bound,
x ¼ m� þ cm�e;
and by y the total concentration of product, free or bound,
y ¼ e� þ cpe� :
We want to show that x and y both increase (respectively, decrease) if the
amount of substrate is increased (respectively, decreased), and, instead,
that x increases (respectively, decreases) and y decreases (respectively, de-
creases) if the amount of phosphatase is increased (respectively, decreased).
Mathematically, we want to compare the signs of the derivatives x0 and y0 tothose of p
0T or e
0T. We formulate the question more precisely as follows.
Suppose that we consider a one-parameter family of positive steady-state
concentrations
pðqÞ ¼ �mðqÞ;m�ðqÞ; eðqÞ; cm�eðqÞ; e�ðqÞ; pðqÞ; cpe� ðqÞ
�;
and respective total active kinase and products
xðqÞ ¼ m�ðqÞ þ cm�eðqÞ;yðqÞ ¼ e�ðqÞ þ cm�eðqÞ:
The parameter q may be thought of as pT, or eT, but for the analysis is arbi-
trary. We suppose given a certain value q0 of this parameter, and compute
Biophysical Journal 106(12) 2720–2728
m�0 ¼ dm�
dq
����q ¼ q0
;
e0 ¼ de
dq
����q ¼ q0
;.
where we are using primes to indicate the derivatives with respect to q, eval-
uated at the parameter q0, and we omit the parameter from now on (thus,
when writing e* below, we mean e*(q0), and so forth). Note that if the
one-parameter family p(q) describes steady states that correspond to
same total phosphatase PT, we have p0T ¼ 0, and if instead the substrate
amount is constant, then e0T ¼ 0.
Mathematically, we show the result in the Theorem stated below, which
can be summarized symbolically as follows:
Theorem
The following relations hold for the derivatives with respect to q, under the
assumption that m*0T ¼ 0:
In general,
sign x0 ¼ sign c0m�e ¼ sign c0pe� ¼ sign e0 ¼ �sign m�0
¼ �sign m0;
however, when e0T ¼ 0,
sign x0 ¼ sign c0m�e ¼ sign c0pe� ¼ sign e0 ¼ sign p0
¼ �sign e�0 ¼ �sign m�0 ¼ �sign m0 ¼ �sign y0
¼ sign p0T ;
and when p0T ¼ 0,
0 0 0 0 �0
sign x ¼ sign cm�e ¼ sign cpe� ¼ sign e ¼ sign e¼ �sign p0 ¼ �sign m�0 ¼ �sign m0 ¼ sign y0
¼ sign e0T :
Proof
From Eq. 6, we have that sign m*0 ¼ sign m
0, which, combined with Eq. 3
and m*0T ¼ 0, gives that sign c0m*e ¼ �sign m*
0.
From the definition x¼ m*þ cm*e together with Eq. 3, we havemþ x¼m*T, from which it follows, because m*T ¼ 0, that sign x
0 ¼ sign m*0.
Also, differentiating Eq. 7 gives c0m*e ¼ �sign c
0pe*.
Differentiating Eq. 8 gives�g m�
dþ x
e0 ¼ c0m�e þ
�g e
dþ x
ð�m�0Þ; (10)
so, because we already proved that sign c0m*e ¼ sign (�m*
0), it follows that
sign e0 ¼ sign c
0m*e. This completes the proof of the first assertion.
0
Suppose now that e T ¼ 0. Because Eq. 5 says thateþ cm�e þ y ¼ eT ;
it gives that y0 ¼ �(c
0m*e þ e
0).
Paradoxical Results in Network Reconstruction 2727
Because sign c0m*e ¼ sign e
0, it follows that (cm*e þ e)
0 ¼ c0m*e þ e
0has
the same sign as c0m*e, and hence –sign y
0 ¼ sign(cm*e þ e)0 ¼ sign c
0m*e ¼
sign x0.
And because we already know that sign c0pe* ¼ sign x
0, this also implies
that sign y0 ¼ sign(�c
0pe*). From
e� ¼ y� cpe� ;
we conclude that sign e*0 ¼ sign y
0.
Differentiating Eq. 9:
�4 p
jþ h
p0 ¼ c0pe� þ
�4 f
jþ h
ð�e�0Þ:
Because sign c0pe* ¼ sign (�e*
0), it follows that sign p
0 ¼ sign c0pe*.
Finally, because p0T ¼ p
0 þ c0pe*, also sign p
0T ¼ sign p
0. This completes
the proof of the second assertion.
Now take the case p0T¼ 0. From Eq. 4, c
0pe*¼�p
0, so sign c
0pe*¼�sign
p0. Differentiating Eq. 9:�
4 p
jþ h
e�0 ¼ c0pe� þ
�4 e�
jþ h
ð�p0Þ;
so also sign e*0 ¼ sign c
0pe*.
Because y ¼ e* þ cpe*, it follows that also sign y0 ¼ sign e*
0.
Finally, because e0T ¼ e
0 þ c0m*e þ e*0 þ c
0pe*, and the four terms in this
sum all have the same sign as x0, it follows that sign e0T ¼ sign x
0. This com-
pletes the proof of the theorem.
It is also possible to formally prove that a perturbation in total enzyme
(Mek) will result in changes in X and Y in the same direction as this pertur-
bation. The proof is similar, but this conclusion is far less interesting,
because it is evidently true from the form of the reactions.
In the model and proof, we assumed that both enzymes are strongly irre-
versible, in the sense of Xu and Gunawardena (45). As long as equilibria are
nondegenerate (Jacobian is nonsingular), it then follows, by continuity of
steady states on reaction constants, that a sufficiently small rate for a reverse
reaction will not change the conclusions.
Another generalization of the theorem would be to explicitly model the
phosphorylation and dephosphorylation of Mek, through a full Michaelis-
Menten set of reactions including complex formation. The same conclu-
sions hold in that case, with a very similar but substantially longer proof.
Our theorem shows that the sign of the derivatives (m0 and so forth) are
constant at all steady states. This implies a global change as well, along any
smooth curve connecting steady states. In other words, the theorem is
proved formally for first-order perturbations, but the same result holds for
all perturbations. Indeed, suppose that we want to compare the values of
the steady-state concentrations p(q1) and p(q2) at two values q1,q2 of the
parameter q. Because, coordinatewise, we have, for example
mðq2Þ � mðq1Þ ¼Z q2
q1
m0ðqÞdq;
then it follows that, if m0(q) > 0 for all parameter values q, also m(q2) >
m(q1).
Our result is justified by a mathematical proof, and hence is valid for all
parameters. Simulations that illustrate dynamic behavior as well as the ef-
fect of noninfinitesimal perturbations are shown in the Supporting Material.
DISCUSSION
A plethora of sophisticated reverse engineering methods areroutinely used to generate valuable data in the form of net-works of players interconnected by edges indicating positive
and negative interactions. Nonetheless, our results empha-size that a naive and simplistic view of enzymatic networks,through positive and negative arrows interconnecting whatare inherently complex nodes, does not tell the whole storyin signal transduction. We have shown that even in simplein vitro systems, such a view is misleading; clearly, if amethod fails there, there is no justification for believingthat it will work in a more complicated in vivo context.Approaches that are more sophisticated are called upon, inorder to address the pitfalls of perturbation techniques,which may, by themselves, lead to false conclusions. Seri-ously erroneous conclusions may derive from consideringonly discrete classes of connections while ignoring the intri-cate nonlinear mechanisms underlying processes such asphosphorylation (17,46,47).
To avoid incorrect interpretations of data obtained frominhibitor or activator chemical screenings, it is imperativeto enrich analysis by considering the dynamics of such pro-cesses in more mathematical and modeling detail. Thisanalysis might include, for example, enlarging network de-scriptions to take into account sequestration effects, stoi-chiometric constraints imposed by binding of transcriptionfactors to different promoter sites, competition for mRNApolymerase, or competition for ribosome binding sites.More powerful methods might require the introduction ofnew perturbations that modify rate constants and other pa-rameters. This task leads to challenging theoretical andexperimental questions in systems biology.
SUPPORTING MATERIAL
Simulations,DifferentNominalKinase andPhosphotaseAmounts,Different
Kinetic Constants for Kinase Modifications, and 20 figures are available at
http://www.biophysj.org/biophysj/supplemental/S0006-3495(14)00448-2.
We thank Professor Hanno Steen at Children’s Hospital, Boston for use of
mass-spectrometry facilities and Ruchi Chauhan for experimental assis-
tance. We also thank E. Nikolaev for a very useful suggestion regarding
the design of Figure 3.
S.P. carried out the experiments. E.S. conceived the project and carried out
the theoretical development. S.P., J.G., and E.S. performed the analysis and
wrote the paper.
E.S.’s research was supported in part by National Institutes of Health grants
No. NIH 1R01GM100473 and No. 1R01GM086881. S.P. and J.G. were
supported in part by National Science Foundation grant No. 0856285.
REFERENCES
1. Lauffenburger, D. A. 2000. Cell signaling pathways as control mod-ules: complexity for simplicity? Proc. Natl. Acad. Sci. USA. 97:5031–5033.
2. Hartwell, L. H., J. J. Hopfield,., A. W. Murray. 1999. Frommolecularto modular cell biology. Nature. 402:C47–C52.
3. Bhalla, U. S., and R. Iyengar. 2001. Functional modules in biologicalsignaling networks. Novartis Found. Symp. 239:4–13, discussion 13–15., 45–51.
Biophysical Journal 106(12) 2720–2728

2728 Prabakaran et al.
4. Aldridge, B. B., J. M. Burke, ., P. K. Sorger. 2006. Physicochemicalmodeling of cell signaling pathways. Nat. Cell Biol. 8:1195–1203.
5. Jaqaman, K., and G. Danuser. 2006. Linking data to models: dataregression. Nat. Rev. Mol. Cell Biol. 7:813–819.
6. Kholodenko, B. N., A. Kiyatkin, ., J. B. Hoek. 2002. Untangling thewires: a strategy to trace functional interactions in signaling and genenetworks. Proc. Natl. Acad. Sci. USA. 99:12841–12846.
7. de la Fuente, A., P. Brazhnik, and P. Mendes. 2002. Linking the genes:inferring quantitative gene networks from microarray data. TrendsGenet. 18:395–398.
8. Gardner, T. S., D. di Bernardo,., J. J. Collins. 2003. Inferring geneticnetworks and identifying compound mode of action via expressionprofiling. Science. 301:102–105.
9. Stark, J., R. Callard, andM. Hubank. 2003. From the top down: towardsa predictive biology of signaling networks. Trends Biotechnol. 21:290–293.
10. Prill, R. J., J. Saez-Rodriguez,., G. Stolovitzky. 2011. Crowdsourcingnetwork inference: the DREAM predictive signaling network chal-lenge. Sci. Signal. 4:mr7.
11. Chen, Z., T. B. Gibson, ., M. H. Cobb. 2001. MAP kinases. Chem.Rev. 101:2449–2476.
12. Shaul, Y. D., and R. Seger. 2007. The MEK/ERK cascade: fromsignaling specificity to diverse functions. Biochim. Biophys. Acta.1773:1213–1226.
13. Huang, C.-Y., and J. E. Ferrell, Jr. 1996. Ultrasensitivity in the mitogen-activated protein kinase cascade. Proc. Natl. Acad. Sci. USA. 93:10078–10083.
14. Asthagiri, A. R., and D. A. Lauffenburger. 2001. A computationalstudy of feedback effects on signal dynamics in a mitogen-activatedprotein kinase (MAPK) pathwaymodel. Biotechnol. Prog. 17:227–239.
15. Widmann, C., S. Gibson, ., G. L. Johnson. 1999. Mitogen-activatedprotein kinase: conservation of a three-kinase module from yeast to hu-man. Physiol. Rev. 79:143–180.
16. Bardwell, L., X. Zou,., N. L. Komarova. 2007. Mathematical modelsof specificity in cell signaling. Biophys. J. 92:3425–3441.
17. Futran, A. S., A. J. Link, ., S. Y. Shvartsman. 2013. ERK as a modelfor systems biology of enzyme kinetics in cells. Curr. Biol. 23:R972–R979.
18. Pearson, G., F. Robinson, ., M. H. Cobb. 2001. Mitogen-activatedprotein (MAP) kinase pathways: regulation and physiological func-tions. Endocr. Rev. 22:153–183.
19. Ledford, H. 2013. First-in-class cancer drug approved to fightmelanoma. http://blogs.nature.com/news/2013/05/first-in-class-cancer-drug-approved-to-fight-melanoma.html. Nature News Blog. Posted 30May 2013, Accessed January 2014. Nature, International Weekly Jour-nal of Science, Nature Publishing Group, Macmillan Publishers, Lon-don, UK. http://www.nature.com
20. Kholodenko, B., M. B. Yaffe, and W. Kolch. 2012. Computational ap-proaches for analyzing information flow in biological networks. Sci.Signal. 5:re1.
21. Godsey, B. 2013. Improved inference of gene regulatory networksthrough integrated Bayesian clustering and dynamic modeling oftime-course expression data. PLoS ONE. 8:e68358.
22. Santos, S. D., P. J. Verveer, and P. I. Bastiaens. 2007. Growth factor-induced MAPK network topology shapes Erk response determiningPC-12 cell fate. Nat. Cell Biol. 9:324–330.
23. Prabakaran, S., R. A. Everley,., J. Gunawardena. 2011. Comparativeanalysis of Erk phosphorylation suggests a mixed strategy formeasuring phospho-form distributions. Mol. Syst. Biol. 7:482.
24. Andrec, M., B. N. Kholodenko, ., E. Sontag. 2005. Inference ofsignaling and gene regulatory networks by steady-state perturbation ex-periments: structure and accuracy. J. Theor. Biol. 232:427–441.
Biophysical Journal 106(12) 2720–2728
25. Margolin, A. A., I. Nemenman, ., A. Califano. 2006. ARACNE: analgorithm for the reconstruction of gene regulatory networks in amammalian cellular context. BMC Bioinformatics. 7 (Suppl 1):S7.
26. Barzel, B., and A. L. Barabasi. 2013. Network link prediction by globalsilencing of indirect correlations. Nat. Biotechnol. 31:720–725.
27. Feizi, S., D. Marbach,., M. Kellis. 2013. Network deconvolution as ageneral method to distinguish direct dependencies in networks. Nat.Biotechnol. 31:726–733.
28. Bhalla, U. S., P. T. Ram, and R. Iyengar. 2002. MAP kinase phospha-tase as a locus of flexibility in a mitogen-activated protein kinasesignaling network. Science. 297:1018–1023.
29. Lorenz, K., M. J. Lohse, and U. Quitterer. 2003. Protein kinase Cswitches the Raf kinase inhibitor from Raf-1 to GRK-2. Nature.426:574–579.
30. Cirit, M., C. C. Wang, and J. M. Haugh. 2010. Systematic quantifica-tion of negative feedback mechanisms in the extracellular signal-regu-lated kinase (ERK) signaling network. J. Biol. Chem. 285:36736–36744.
31. Saez-Rodriguez, J., A. Kremling, and E. Gilles. 2005. Dissecting thepuzzle of life: modularization of signal transduction networks.Comput.Chem. Eng. 29:619–629.
32. Del Vecchio, D., A. J. Ninfa, and E. D. Sontag. 2008. Modular cellbiology: retroactivity and insulation. Mol. Syst. Biol. 4:161.
33. Ventura, A. C., J. A. Sepulchre, and S. D. Merajver. 2008. A hiddenfeedback in signaling cascades is revealed. PLOS Comput. Biol.4:e1000041.
34. Kim, K. H., and H. M. Sauro. 2011. Measuring retroactivity from noisein gene regulatory networks. Biophys. J. 100:1167–1177.
35. Alexander, R. P., P. M. Kim, ., M. B. Gerstein. 2009. Understandingmodularity in molecular networks requires dynamics. Sci. Signal.2:pe44.
36. Jayanthi, S., K. S. Nilgiriwala, and D. Del Vecchio. 2013. Retroactivitycontrols the temporal dynamics of gene transcription. ACS Synth. Biol.2:431–441.
37. Bardwell, A. J., M. Abdollahi, and L. Bardwell. 2003. Docking sites onmitogen-activated protein kinase (MAPK) kinases, MAPK phospha-tases and the Elk-1 transcription factor compete for MAPK bindingand are crucial for enzymic activity. Biochem. J. 370:1077–1085.
38. Bluthgen, N., F. J. Bruggeman,., B. N. Kholodenko. 2006. Effects ofsequestration on signal transduction cascades. FEBS J. 273:895–906.
39. Jiang, P., A. C. Ventura,., D. Del Vecchio. 2011. Load-induced mod-ulation of signal transduction networks. Sci. Signal. 4:ra67.
40. Kim, Y., Z. Paroush, ., S. Y. Shvartsman. 2011. Substrate-dependentcontrol of MAPK phosphorylation in vivo. Mol. Syst. Biol. 7:467.
41. Gerber, S. A., J. Rush, ., S. P. Gygi. 2003. Absolute quantification ofproteins and phosphoproteins from cell lysates by tandem MS. Proc.Natl. Acad. Sci. USA. 100:6940–6945.
42. Angeli, D., and E. Sontag. 2008. Translation-invariant monotone sys-tems, and a global convergence result for enzymatic futile cycles. Non-lin. Anal. B Real World App. 9:128–140.
43. Russo, G., M. di Bernardo, and E. D. Sontag. 2010. Global entrainmentof transcriptional systems to periodic inputs. PLOS Comput. Biol.6:e1000739.
44. Barton, J. P., and E. D. Sontag. 2013. The energy costs of insulators inbiochemical networks. Biophys. J. 104:1380–1390.
45. Xu, Y., and J. Gunawardena. 2012. Realistic enzymology for post-translational modification: zero-order ultrasensitivity revisited.J. Theor. Biol. 311:139–152.
46. Wang, L., and E. D. Sontag. 2008. On the number of steady states in amultiple futile cycle. J. Math. Biol. 57:29–52.
47. Thomson, M., and J. Gunawardena. 2009. Unlimited multistability inmultisite phosphorylation systems. Nature. 460:274–277.

Supplementary Materials
Paradoxical results in perturbation-based signaling network reconstruction
Sudhakaran Prabakaran, Jeremy Gunawardena, and Eduardo D. Sontag
Additional experimental data
Supplementary Figure 1: The figure shows coomassie stained gels of purified Erk andMek. Mutated Erk (ErkT88V) was expressed in bacteria and purified using Ni/NTAcolumn (molecular weight ∼43 kDa). It is purified to almost 95% purity. Mek1 was alsoexpressed and purified to 95% purity.
1
Supplementary Figure 2: Representative chromatogram, representative spectrum of theanalyte Mekpp peptide (doubly charged) along with the representative spectrum of itscorresponding internal standard peptide is shown in the figure. Relative area under thecurve of the analyte Mekpp peptide to its internal standard is used for Mekpp quantitation.
2
Supplementary Figure 3: Representative chromatogram, representative spectrum of theanalyte Erkp peptide (triply charged) along with the representative spectrum of its corre-sponding internal standard peptide is shown in the figure. Relative area under the curveof the analyte Erkptide to its internal standard is used for Erkp quantitation.
3
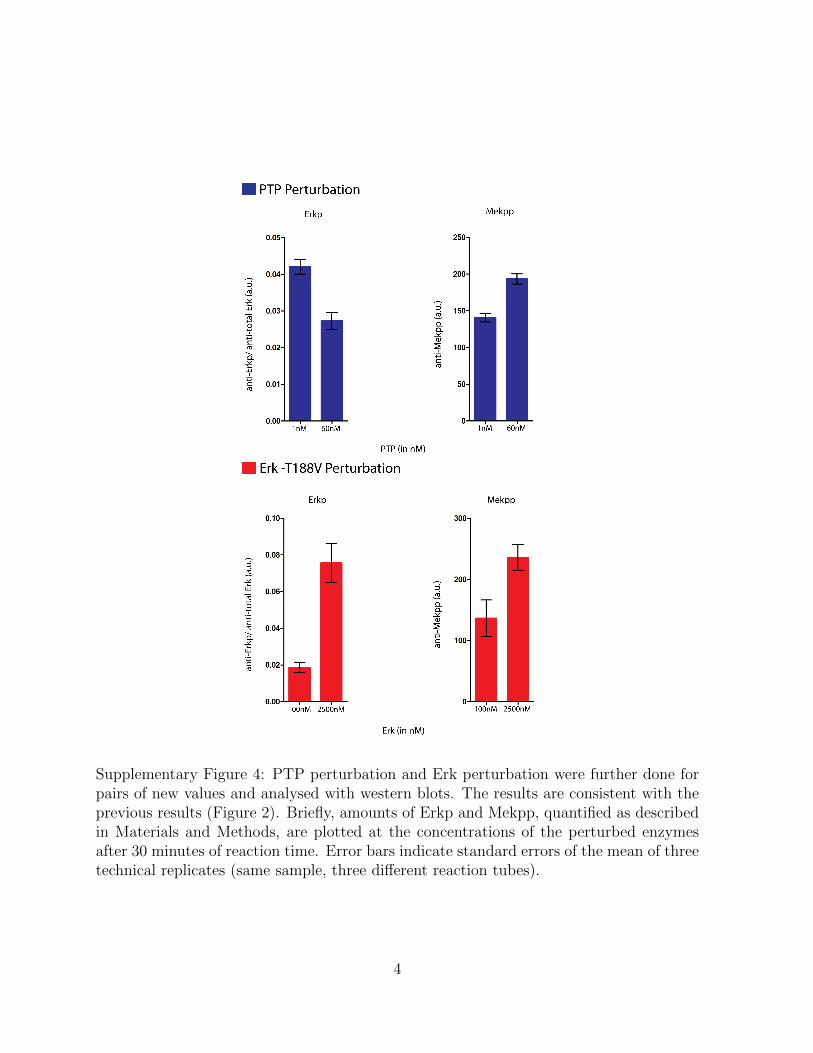
Supplementary Figure 4: PTP perturbation and Erk perturbation were further done forpairs of new values and analysed with western blots. The results are consistent with theprevious results (Figure 2). Briefly, amounts of Erkp and Mekpp, quantified as describedin Materials and Methods, are plotted at the concentrations of the perturbed enzymesafter 30 minutes of reaction time. Error bars indicate standard errors of the mean of threetechnical replicates (same sample, three different reaction tubes).
4

Supplementary Figure 5: Representative western blots for experiment in SupplementaryFigure 4 along with time-course data are shown in the Figure. These blots were donefor PTP pertubation experiments. Reaction aliquots containing Erk (∼43kDa) and Mek(∼71kDa), collected at 0min, 10min, 20min, 30min and 40min of reaction times weresnap frozen and run on the same SDS-PAGE, transferred and probed with mouse, anti-phospho Erk ab, rabbit, anti-total Erk ab and rabbit anti-phospho-Mek ab. Secondaryanti- mouse (green pseudo color) and anti-rabbit (red pseudo color) were used to probe theprimary antibodies. The relative intensities of green and red channels were used for Erkpquantitation (overlaid image), the red channel intensity was used for Mekpp quantitation.Error bars show the standard error of the mean of three technical replicates (same sample,three different reaction tubes).
5
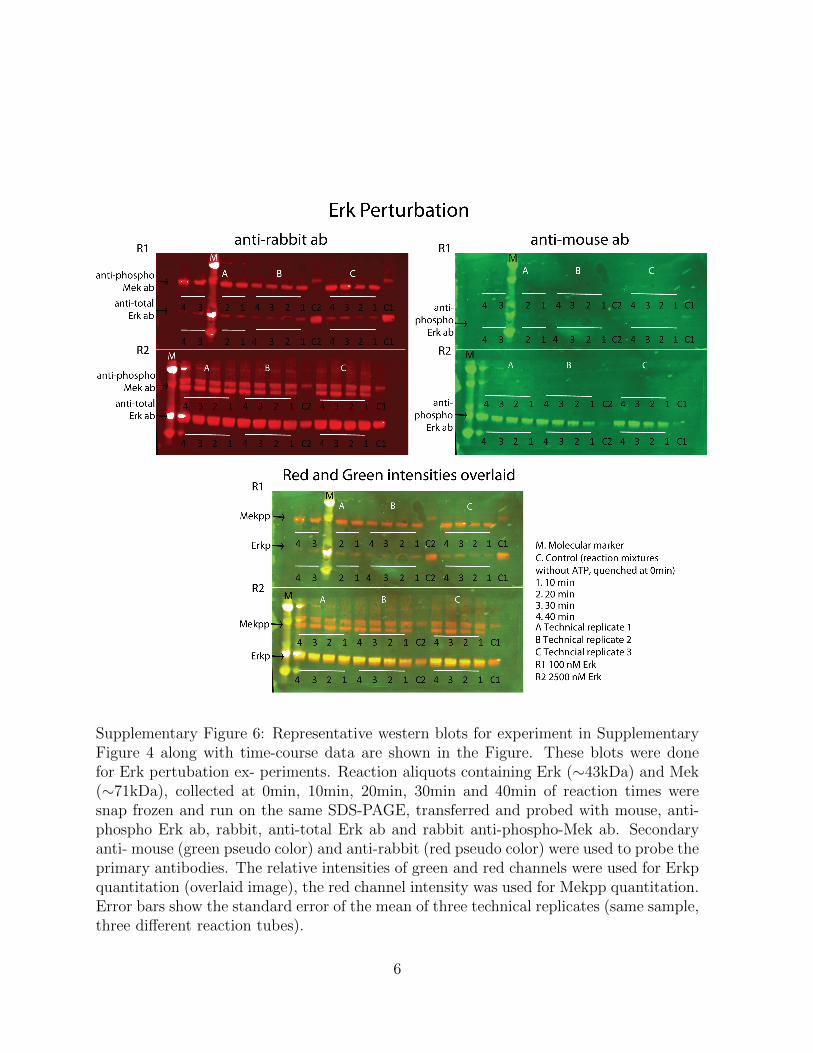
Supplementary Figure 6: Representative western blots for experiment in SupplementaryFigure 4 along with time-course data are shown in the Figure. These blots were donefor Erk pertubation ex- periments. Reaction aliquots containing Erk (∼43kDa) and Mek(∼71kDa), collected at 0min, 10min, 20min, 30min and 40min of reaction times weresnap frozen and run on the same SDS-PAGE, transferred and probed with mouse, anti-phospho Erk ab, rabbit, anti-total Erk ab and rabbit anti-phospho-Mek ab. Secondaryanti- mouse (green pseudo color) and anti-rabbit (red pseudo color) were used to probe theprimary antibodies. The relative intensities of green and red channels were used for Erkpquantitation (overlaid image), the red channel intensity was used for Mekpp quantitation.Error bars show the standard error of the mean of three technical replicates (same sample,three different reaction tubes).
6
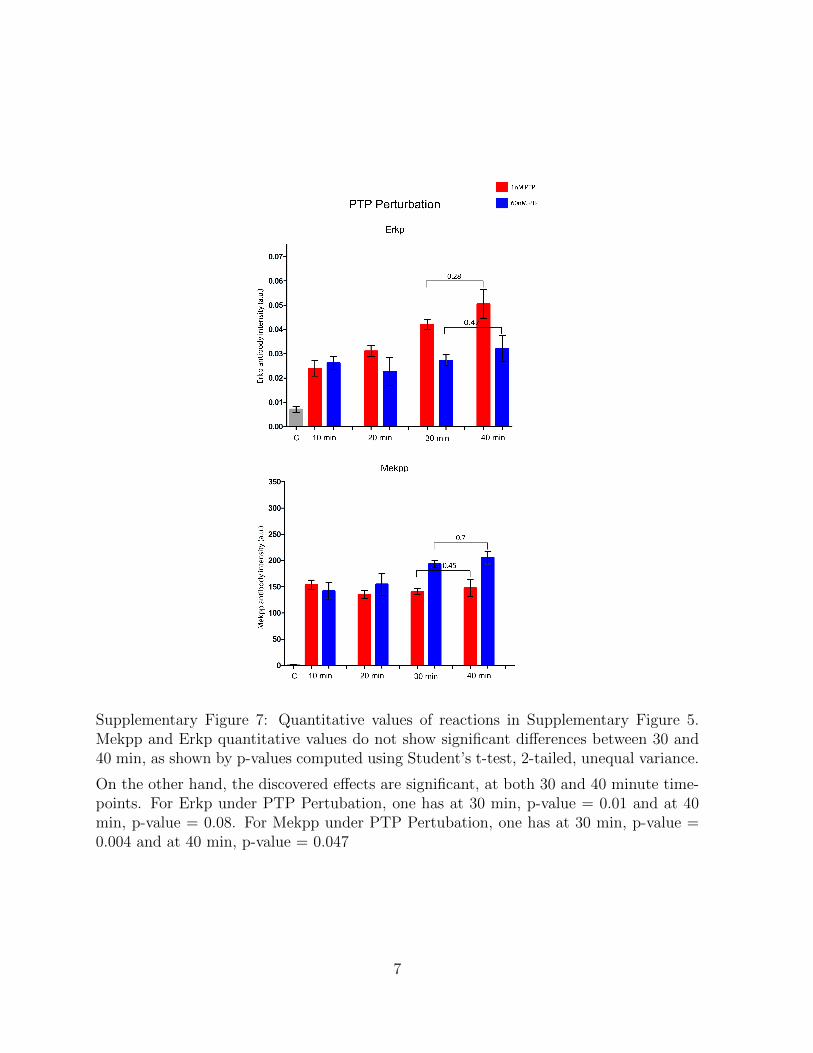
Supplementary Figure 7: Quantitative values of reactions in Supplementary Figure 5.Mekpp and Erkp quantitative values do not show significant differences between 30 and40 min, as shown by p-values computed using Student’s t-test, 2-tailed, unequal variance.
On the other hand, the discovered effects are significant, at both 30 and 40 minute time-points. For Erkp under PTP Pertubation, one has at 30 min, p-value = 0.01 and at 40min, p-value = 0.08. For Mekpp under PTP Pertubation, one has at 30 min, p-value =0.004 and at 40 min, p-value = 0.047
7

Supplementary Figure 8: Quantitative values of reactions in Supplementary Figure 6.Mekpp and Erkp quantitative values do not show significant differences between 30 and40 min, as shown by p-values computed using Student’s t-test, 2-tailed, unequal variance.
On the other hand, the discovered effects are significant, at both 30 and 40 minute time-points. For Erkp under Erk Pertubations, one has at 30 min, p-value = 0.027 and at 40min, p-value = 0.057. For Mekpp under Erk Pertubation, one has at 30 min, p-value =0.059 and at 40 min, p-value = 0.02
8
Simulations
We provide here some simulations that confirm the predictions of the theorem. We takeinitially the following values for the kinetic constants:
α = 0.1, β = 0.1, γ = 0.01, δ = 1, ξ = 1, ϕ = 0.01, η = 1, ψ = 1,
and conserved quantities:
mT = 100, pT = 100, eT = 1000
(units: s−1 for constants in monomolecular and nM−1s−1 for bimolecular reactions, andnM for conserved quantities). As precise values of kinetic constants are not known,we picked these numbers as a rough order of magnitude approximation of the differentRaf/Mek/Erk constants in the reactions given in the Online Supplementary Materialsfor the paper (1). (The values of α and β are obtained from multi-step reactions askcateT/Km, assuming a first-order linear regime in a Michaelis-Menten approximation.)The conserved quantity numbers represent a rough range of the concentrations of enzymesused in our experimental work. Later, we also show simulations where parameters andenzyme concentrations are taken to have very different values.
As initial states in the first set of simulations, we take:
m(0) = mT , p(0) = pT , e(0) = eT , m∗(0) = 0, cm∗e(0) = 0, e∗(0) = 0, cpe∗(0) = 0.
The simulations in Fig. 9 compare the solutions for the above values of pT and eT and thesolutions obtained when perturbing each of these by doubling them one at a time. Shownare plots of total active enzyme (left) and total active substrate (right). Observe that notonly the predicted changes in steady states are as claimed, but in addition the dynamicbehavior at intermediate states, even under non-infinitesimal perturbations, is consistentwith the predictions.
Keeping our parameters unchanged, we investigate next the effect of starting at fullyactivated substrate, enzyme, or both, see Figs. 10, 11, and 12. At steady state, the samevalues obtain, but transient behaviors are different. Nonetheless, the conclusions regardingthe effect of perturbations stay unchanged: For the active enzyme (x(t)) all values arehigher, at steady state, for both types of perturbations. For active substrate (y(t)), allvalues are higher both transiently and at steady state for substrate perturbations, whileall values are lower both transiently and at steady state for phosphatase perturbations.
9

Supplemental Figure 9: Left: active enzyme (x(t)) as function of time, using mT = 100,pT = 100, eT = 1000, α = β = 0.1, m(0) = mT , e(0) = eT , m∗(0) = 0, e∗(0) = 0.Observe that all values are higher, both transiently and at steady state, for both types ofperturbations. Right: active substrate (y(t)) as function of time, using same parameters.Observe that all values are higher, respectively lower, both transiently and at steady state,for substrate (ErkT , red), respectively phosphatase (PTPT , blue), perturbations. Blackplot is reference (unperturbed).
10

Supplemental Figure 10: Left: active enzyme (x(t)) as function of time, using pT = 100,mT = 100, eT = 1000, α = β = 0.1, m(0) = mT , e(0) = 0, m∗(0) = 0, e∗(0) = eT . Right:active substrate (y(t)) as function of time, using same parameters. Colors are as in Fig. 9.
11
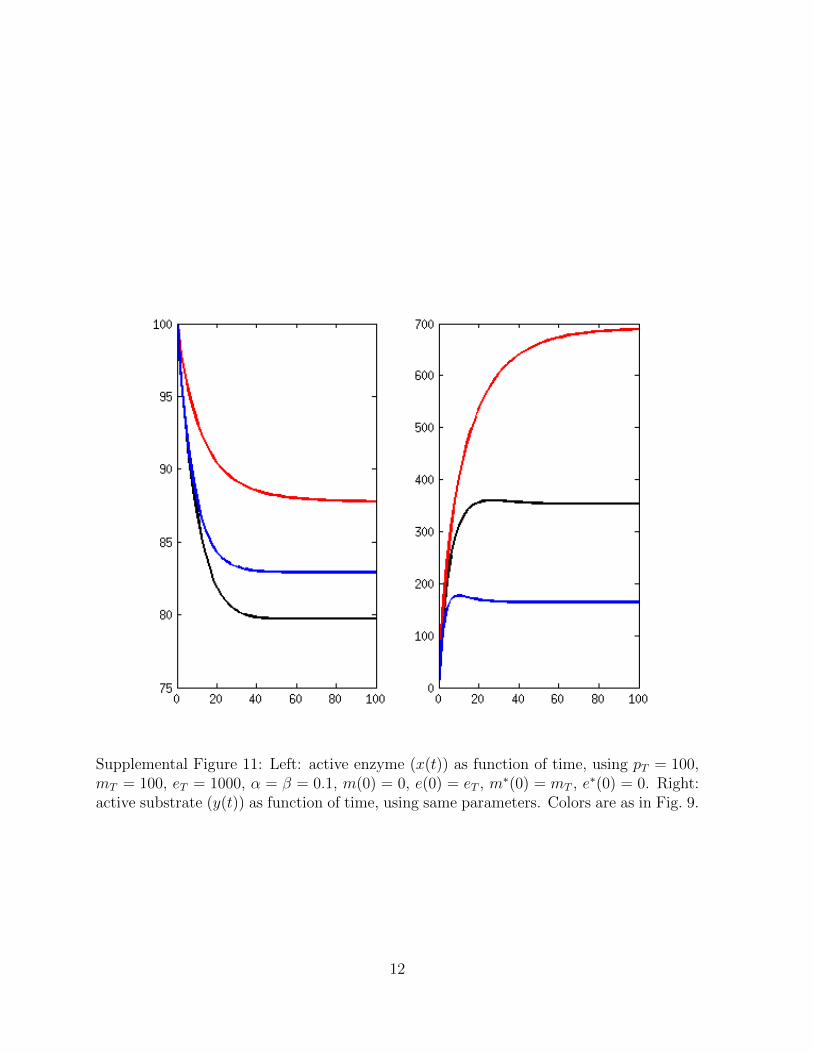
Supplemental Figure 11: Left: active enzyme (x(t)) as function of time, using pT = 100,mT = 100, eT = 1000, α = β = 0.1, m(0) = 0, e(0) = eT , m∗(0) = mT , e∗(0) = 0. Right:active substrate (y(t)) as function of time, using same parameters. Colors are as in Fig. 9.
12

Supplemental Figure 12: Left: active enzyme (x(t)) as function of time, using pT = 100,mT = 100, eT = 1000, α = β = 0.1, m(0) = 0, e(0) = 0, m∗(0) = mT , e∗(0) = eT . Right:active substrate (y(t)) as function of time, using same parameters. Colors are as in Fig. 9.
13
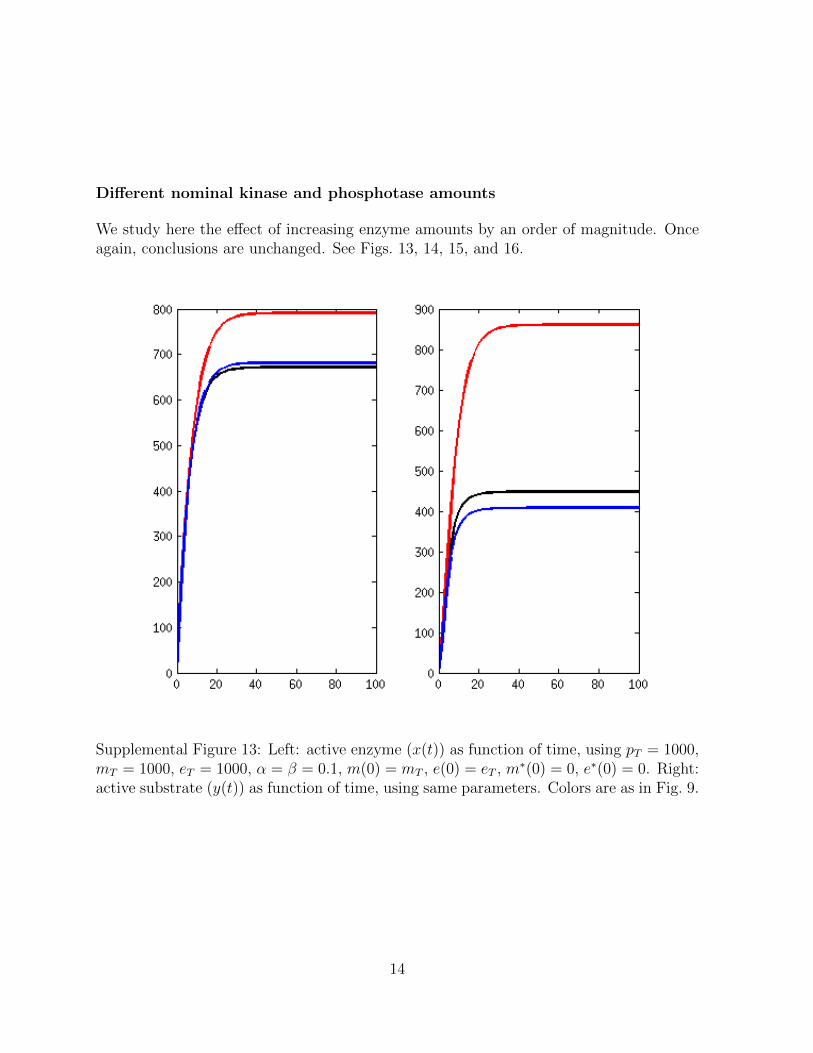
Different nominal kinase and phosphotase amounts
We study here the effect of increasing enzyme amounts by an order of magnitude. Onceagain, conclusions are unchanged. See Figs. 13, 14, 15, and 16.
Supplemental Figure 13: Left: active enzyme (x(t)) as function of time, using pT = 1000,mT = 1000, eT = 1000, α = β = 0.1, m(0) = mT , e(0) = eT , m∗(0) = 0, e∗(0) = 0. Right:active substrate (y(t)) as function of time, using same parameters. Colors are as in Fig. 9.
14
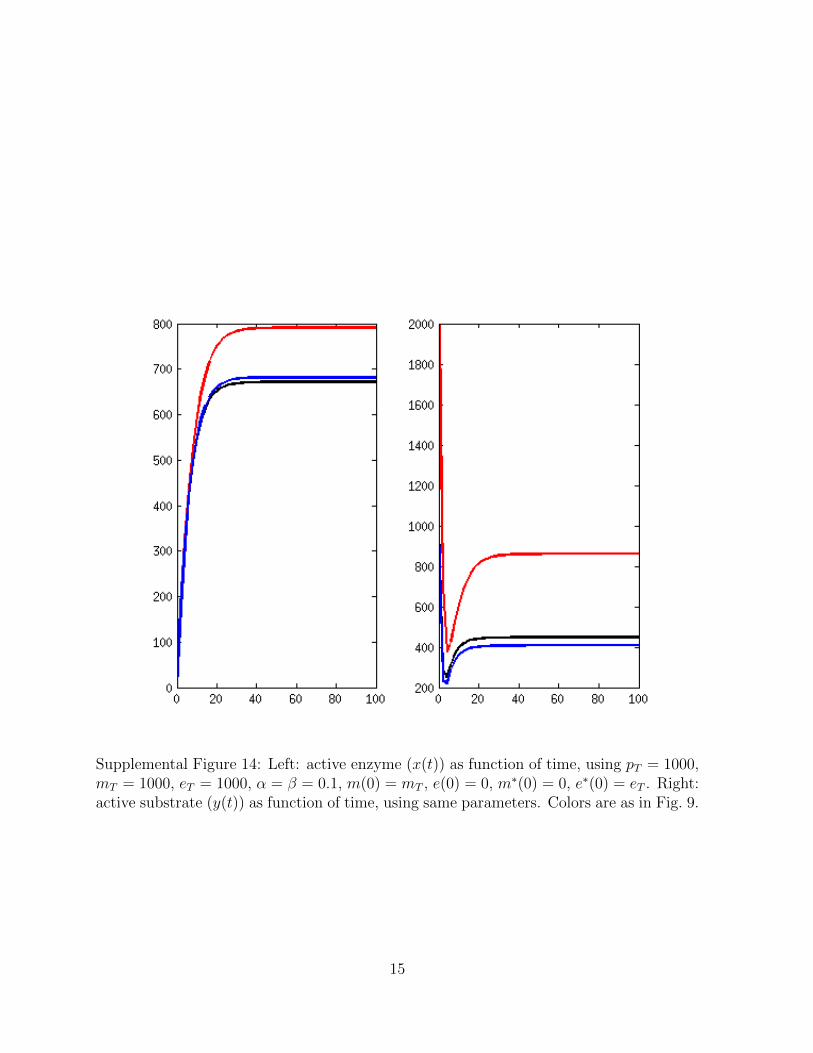
Supplemental Figure 14: Left: active enzyme (x(t)) as function of time, using pT = 1000,mT = 1000, eT = 1000, α = β = 0.1, m(0) = mT , e(0) = 0, m∗(0) = 0, e∗(0) = eT . Right:active substrate (y(t)) as function of time, using same parameters. Colors are as in Fig. 9.
15
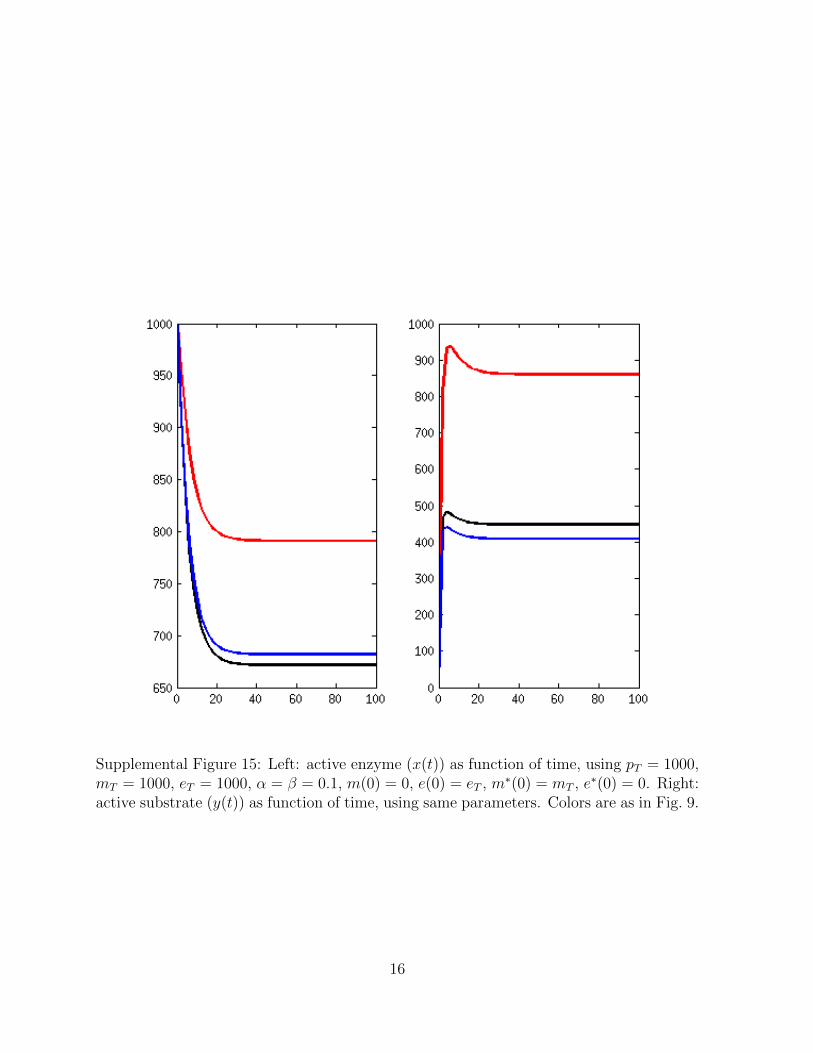
Supplemental Figure 15: Left: active enzyme (x(t)) as function of time, using pT = 1000,mT = 1000, eT = 1000, α = β = 0.1, m(0) = 0, e(0) = eT , m∗(0) = mT , e∗(0) = 0. Right:active substrate (y(t)) as function of time, using same parameters. Colors are as in Fig. 9.
16
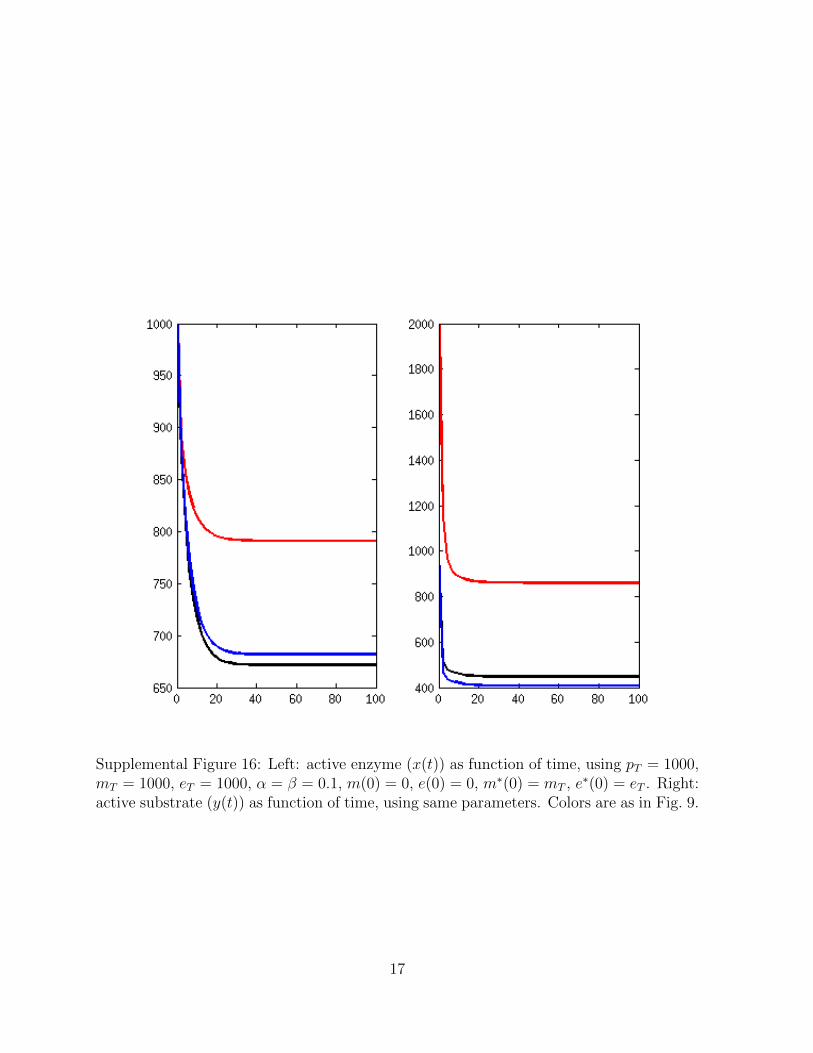
Supplemental Figure 16: Left: active enzyme (x(t)) as function of time, using pT = 1000,mT = 1000, eT = 1000, α = β = 0.1, m(0) = 0, e(0) = 0, m∗(0) = mT , e∗(0) = eT . Right:active substrate (y(t)) as function of time, using same parameters. Colors are as in Fig. 9.
17

Different kinetic constants for kinase modifications
We study here the effect of increasing by a factor the rates α and β at which the enzymeE may be phosphorylated or dephosphorylated. Conclusions remain unchanged. SeeFigs. 17, 18, 19, and 20.
Supplemental Figure 17: Left: active enzyme (x(t)) as function of time, using pT = 100,mT = 100, eT = 1000, α = β = 1, m(0) = mT , e(0) = eT , m∗(0) = 0, e∗(0) = 0. Right:active substrate (y(t)) as function of time, using same parameters. Colors are as in Fig. 9.
18
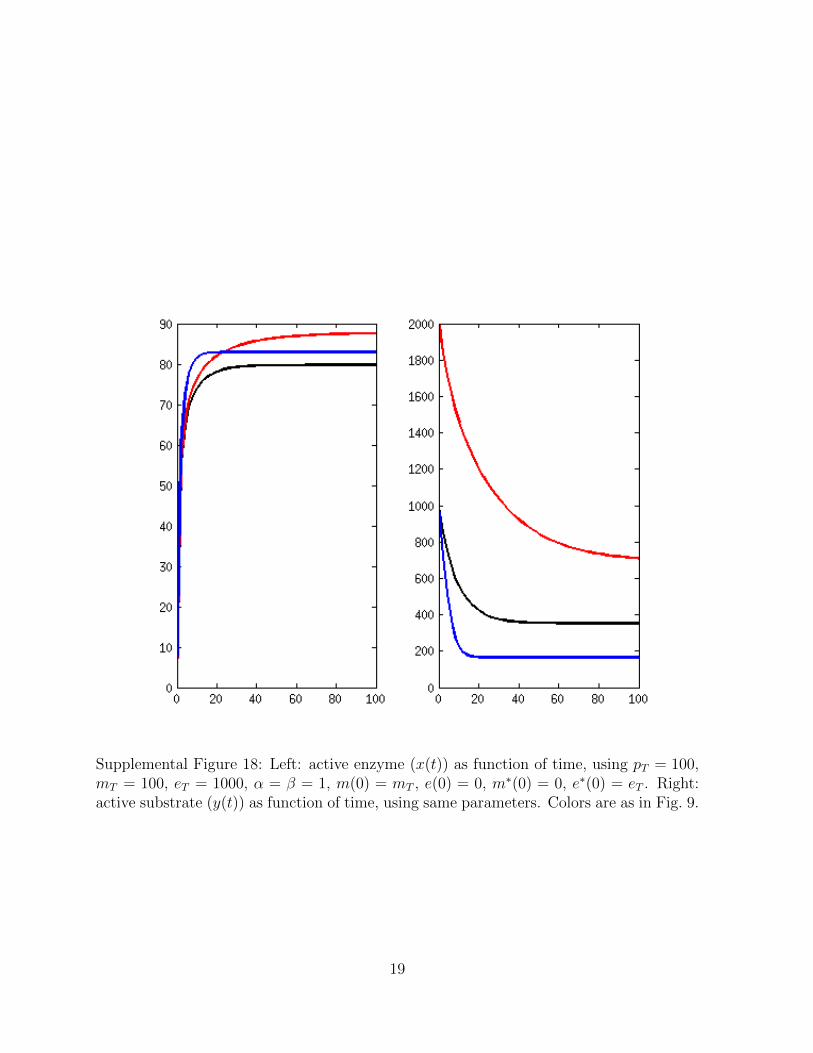
Supplemental Figure 18: Left: active enzyme (x(t)) as function of time, using pT = 100,mT = 100, eT = 1000, α = β = 1, m(0) = mT , e(0) = 0, m∗(0) = 0, e∗(0) = eT . Right:active substrate (y(t)) as function of time, using same parameters. Colors are as in Fig. 9.
19
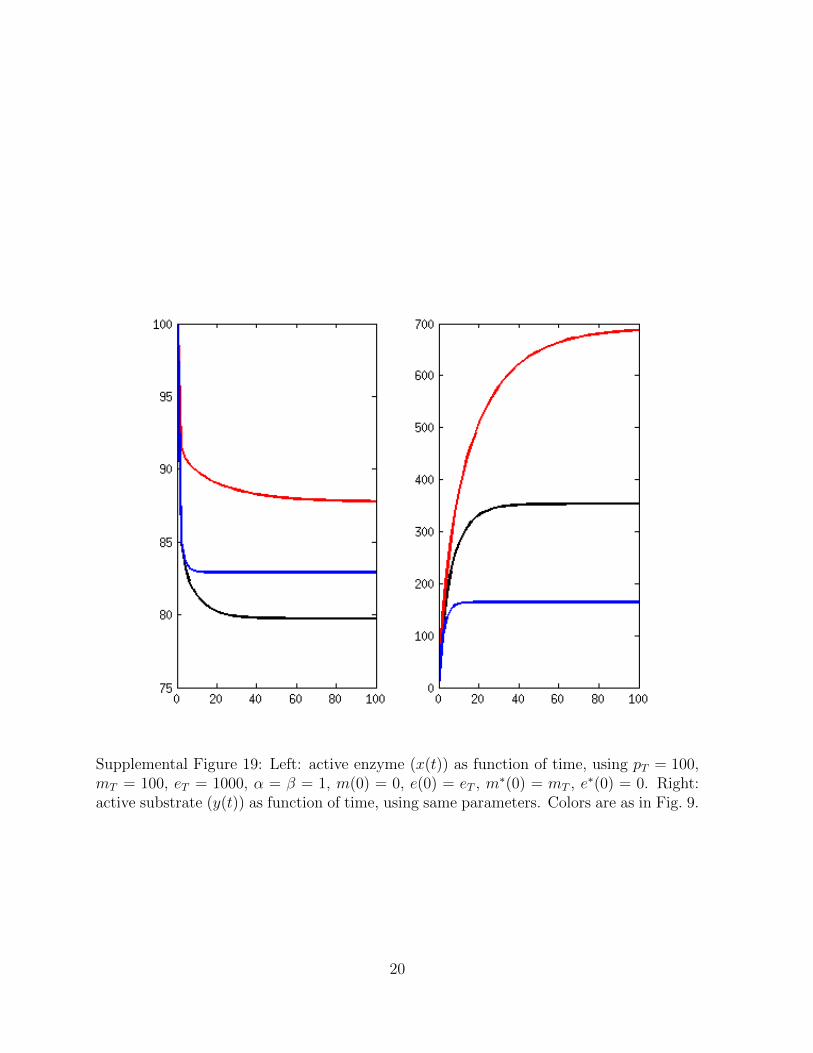
Supplemental Figure 19: Left: active enzyme (x(t)) as function of time, using pT = 100,mT = 100, eT = 1000, α = β = 1, m(0) = 0, e(0) = eT , m∗(0) = mT , e∗(0) = 0. Right:active substrate (y(t)) as function of time, using same parameters. Colors are as in Fig. 9.
20

Supplemental Figure 20: Left: active enzyme (x(t)) as function of time, using pT = 100,mT = 100, eT = 1000, α = β = 1, m(0) = 0, e(0) = 0, m∗(0) = mT , e∗(0) = eT . Right:active substrate (y(t)) as function of time, using same parameters. Colors are as in Fig. 9.
21
References
1. Markevich, N. I., J. B. Hoek, and B. N. Kholodenko, 2004. Signaling switches andbistability arising from multisite phosphorylation in protein kinase cascades. J. CellBiol. 164:353–359.
22